Social Media Metrics: What to Track & How (2026 Benchmarks)
Learn how to track the social media metrics that matter, with formulas, 2026 benchmarks and expert tips on reach, engagement and video.

Every social media team tracks something. Open any monthly report and you'll find a familiar lineup of numbers, neatly charted and color-coded.
But are those the numbers that actually explain performance? Or just the ones that are easiest to pull?
Let's take a quick look at what teams measure today. According to recent Socialinsider research among 147 social media professionals, these are the most-tracked metrics:
- Engagement rate: 85.1%
- Reach: 60.2%
- Follower growth: 49.3%
- Views: 41.8%
The big catch? These four show that people noticed your content. They don't show whether anyone saved it, shared it, or acted on it.
In this guide, I'll walk through the social media metrics worth tracking beyond the usual four: what each one measures, how it's calculated, and how I'd track it over time. Along the way, Melani De Guzman, social media manager at FreshDirect, shares how her team reads the numbers behind a very local, video-first brand.
Key takeaways
-
Social media metrics fall into seven categories: reach and audience, engagement, content and video performance, influence and brand, traffic and conversion, customer care, and competitive. Each one answers a different question, so no single number tells you whether social is working.
-
To track social media metrics effectively, use one consistent formula per metric across all platforms, centralize the data in a cross-channel analytics tool, review it on a fixed weekly, monthly and quarterly cadence, and keep historical and competitor data for comparison.
-
Measuring social media performance over time means comparing results against your own baseline, using rates instead of raw totals, tracking how quickly engagement builds after publishing, and checking both month-over-month and year-over-year changes to separate real trends from seasonality.
What are the 7 categories of social media metrics you should track?
Before getting into individual metrics, let's zoom out for a second.
Most social teams don't struggle with a lack of data. They struggle with too much of it: dozens of numbers across six platforms, all competing for the same spot in the monthly report.
The fix isn't tracking less. It's knowing what each number is actually for.
There are 26 metrics in this guide. That's a lot to keep in your head, so I group them by the question each one answers.
Of course, not every metric needs your eyes every week.
If you lead a social team, I'd keep reach, follower growth and conversion metrics on your own radar. They're the closest to the business outcomes you answer for.
Engagement, content and video metrics are the post-by-post detail. I'd delegate those to whoever owns content, and review the patterns they surface rather than the raw numbers.
Competitive metrics sit somewhere in between. A quarterly look is usually enough, unless you're mid-campaign against a specific rival.
Reach and audience metrics
Here's a question worth asking before anything else: is anyone new actually seeing your content?
Reach and audience metrics answer it. They show how many people discover your brand, and whether they're the right people.
Melani leans on reach whenever her team tests something new. In her words:
If you're experimenting with different content pillars or different topics, then I think you will be prioritizing reach to see if it is landing well with a wider audience. We'll see if it's landing well. Is it reaching outside of our followers and that creator's followers? Is it getting people interested in learning more? Is it getting them to follow the brand, message us? Those are important.
1. Reach
Your follower count tells you how many people could see a post. Reach tells you how many actually did.
It counts the unique accounts that saw your content. Platforms report it directly, and to compare accounts of different sizes, I'd turn it into a rate.
Reach rate = reach ÷ followers × 100
One of our customers put it perfectly: "When I'm new and need visible wins fast, reach helps me show our brand's growing footprint."
A steady upward line means the algorithm keeps backing your content.
A sudden dip is a different story. It usually points to weak timing, low relevance, or a format that's run its course.
When reach falls off a cliff, I don't guess. I use Socialinsider's anomaly analysis: I click the dip on the graph, and the posts behind it show up right away.


Pretty handy, no?
2. Impressions
Reach and impressions often get used interchangeably. They shouldn't be.
Impressions count every time your content was displayed, including repeat views from the same person. Divide them by reach, and you get frequency: how many times the average person saw your post.
Frequency = impressions ÷ reach
When impressions climb steadily across posts, your content is staying in feeds longer.
When they stay stubbornly low, the usual suspects are a weak hook, bad timing, or content people scroll straight past.
3. Follower growth rate
A follower count of 50,000 sounds impressive. Until you notice it hasn't moved in six months.
Follower growth rate fixes that blind spot. It shows how fast your audience is expanding, which says far more about momentum than any raw total.
Follower growth rate = (followers at the end − followers at the start) ÷ followers at the start × 100
So what does healthy growth look like? Here's the average yearly follower growth rate brands saw in 2025, by platform and account size:
No surprises here. TikTok still grows audiences faster than any other platform, even though growth dropped across every account size compared to 2024.
The takeaway? Always compare your growth rate against accounts of a similar size.
If you ask me about the monitoring frequency, I'd track it week over week or month over month.
Growth spikes right after a campaign confirm that something landed. Long plateaus usually point to content fatigue or irregular posting.
4. Audience demographics
Growing fast is great. Growing with the wrong people? Not so much.
Demographics show who your audience actually is: age, gender, location and sometimes language. You'll find them in native insights for your own accounts.
I'd start by holding your split up against your ideal customer profile. If the two match, you're reaching the right people.
Then watch for shifts. A sudden change in age or location often means a new content theme is pulling in a fresh segment, for better or worse.
Engagement metrics
A like takes half a second. A save, a share or a thoughtful comment takes intent.
That gap is what engagement metrics are really about: whether people care enough to do something with your content.
In many of our customer interviews, engagement came up as the fastest route to credibility. It offers emotional proof ("people care") and functional proof ("it's working") at the same time.
But not every interaction weighs the same. A post with 200 saves and a real discussion underneath can matter far more than one with thousands of quick likes.
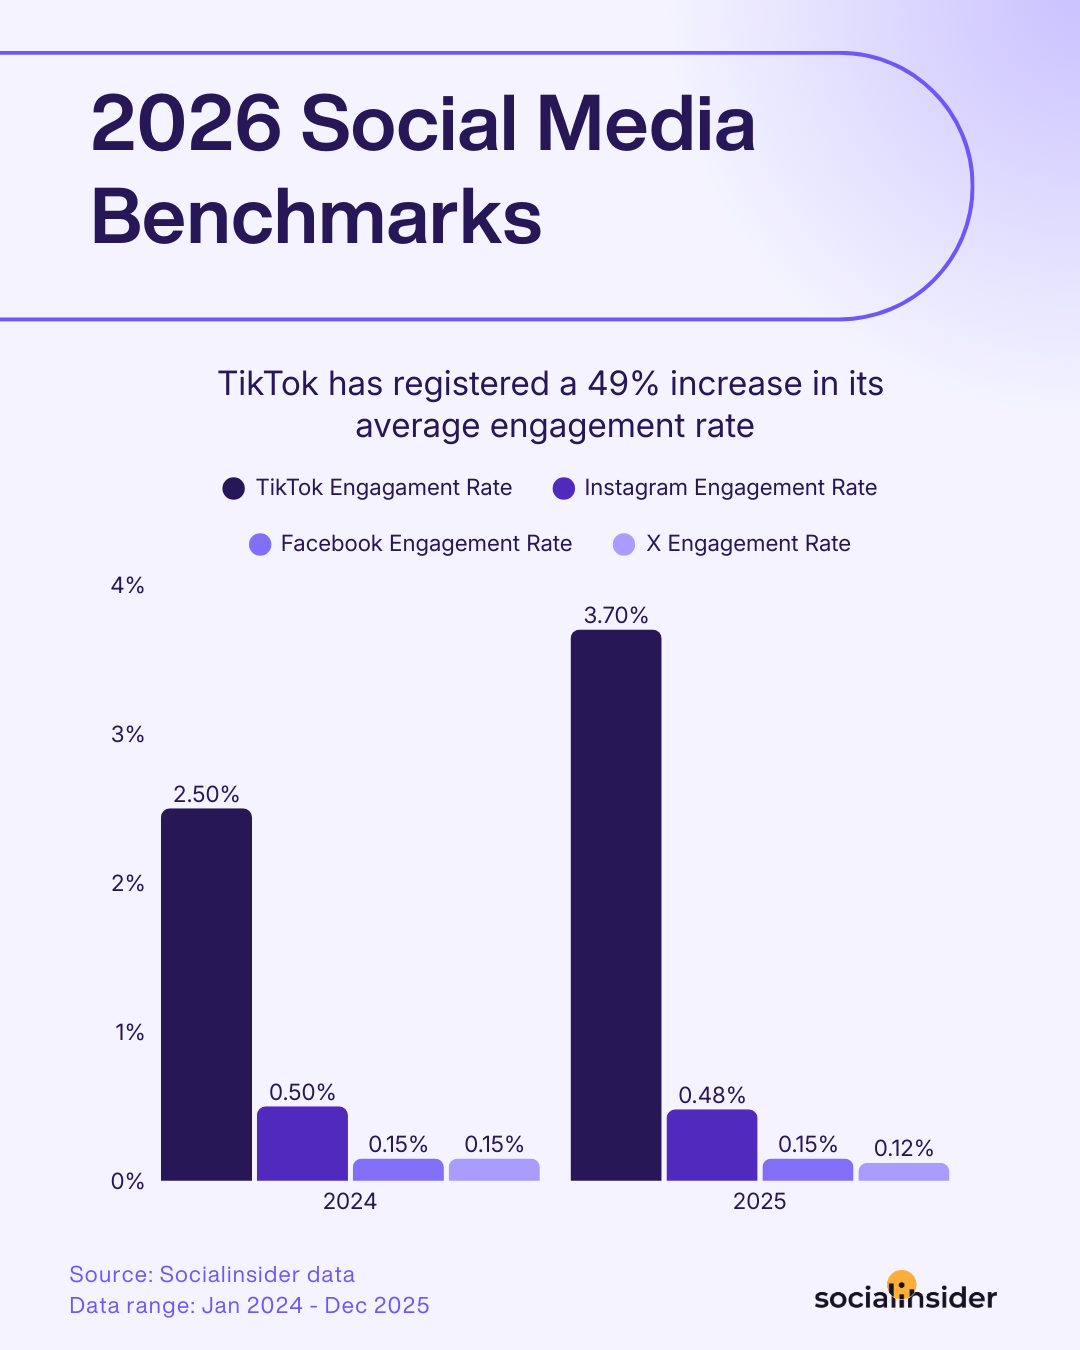
5. Engagement rate by followers
How do you compare yourself with a competitor ten times your size? Raw likes won't help.
Engagement rate by followers will. It shows how many of your existing followers interact with your content, so the comparison stays fair whatever the gap in audience size.
Engagement rate by followers = total engagements ÷ followers × 100, averaged per post
For Melani, it's the go-to metric for anything FreshDirect creates on its own:
When we post in-house, there's no creator, no partner, no collab involved. It's just our content. I'm looking at the engagement rate by followers because we're seeing which ones of our followers resonated with this.
A healthy engagement rate by followers holds steady as your audience grows.
When followers rise and engagement keeps pace, your content strategy is doing its job.
6. Engagement rate by reach
Now, what happens when a post reaches people who've never followed you?
Engagement rate by followers stops telling the full story. Engagement rate by reach picks it up: it shows what share of the people who actually saw a post chose to interact with it.
Engagement rate by reach = total engagements ÷ reach × 100
That's exactly why Melani switches to it for collaborations:
When it's a collab post, when it involves other people, I switch to reach-based engagement because the reach is always going to be higher. We're potentially reaching people who've never heard of us.
What I'd watch here is stability. If engagement by reach holds up while new, unfamiliar viewers pile in, the content is doing real work.

7. Shares, saves and sends
Here's where engagement gets interesting.
Shares, saves and sends are your amplification metrics. They show that a post was useful enough to keep, or relevant enough to pass on.
Each one says something slightly different. Saves signal long-term usefulness. Shares and sends show that someone was willing to put their own name behind your content.
I'd track them as rates rather than raw counts, so bigger posts don't automatically look better.
Share rate = shares ÷ reach × 100 (the same logic works for saves and sends)
Sends deserve special attention. Instagram now treats them as one of its strongest ranking signals, because a post someone forwards to a friend is a post they genuinely value.

From what I've seen, educational posts earn saves, relatable posts drive shares and sends, and bold, opinion-led posts bring the comments.
8. Comments and conversation
Can a post underperform on likes and still be a success? Absolutely.
Comments show whether your content starts a conversation, and their quality matters as much as their number.
Melani saw this firsthand after FreshDirect hosted an in-person event for creators, media and food tastemakers in New York City. The recap Reel wasn't a viral hit. The comment section, though, turned into the strongest success signal of the whole campaign.
As she explains:
The comments were extremely positive. People were sharing that they had a great time, that the tour was a hit, learning about other brands. Even if the video didn't hit huge likes or reach, the comments were so strong that it told us what we're doing works. This is how people grow respect for the brand — by feeling welcome and included. And it shows in the comments and the stories people posted about us.
That's the whole point.
So I'd read the comments, not just count them. Thoughtful replies and people tagging friends are signs of real interaction.
Likes and reactions still count. I just treat them as a quick first signal rather than proof that a post worked.
9. Content pillar engagement
You've introduced a new theme. Humor, maybe, or employee-led content. Is it working?
Content pillar engagement shows how each of your core themes performs, so you know which ones earn their spot in the calendar.
Here's how Melani's team settles on what stays:
When we do our monthly strategy, we look at which content pillars are working really well organically. Showcasing our plant and different departments like seafood or produce does really well because people want to see stories internal to the company — that's not always on Instagram. We also see really fun man-on-the-street formats perform really well, where we ask people about food opinions or preferences. Anything that creates fun dialogue around food is really important for us.
The big catch is the tagging. Sorting hundreds of posts into pillars by hand takes hours.
That's why I rely on Socialinsider's AI-based content pillars to do the sorting for me.

For a specific campaign, I build custom pillars with the Query Builder instead.

Once the data's in, I'd look past likes. The pillars that keep earning saves, shares and comments are the ones creating real value.
And a pillar that underperforms month after month? It needs a rethink, or a quiet retirement.
10. Content format performance
Reels, carousels, static images. Which one is actually landing with your audience?
Format performance compares results across creative formats on each channel.
The trick is consistency. A format that wins once might be a fluke. A format that wins across ten posts is a pattern.
I'd also judge each format by its job. An educational carousel may collect fewer likes than a Reel and still earn far more saves.
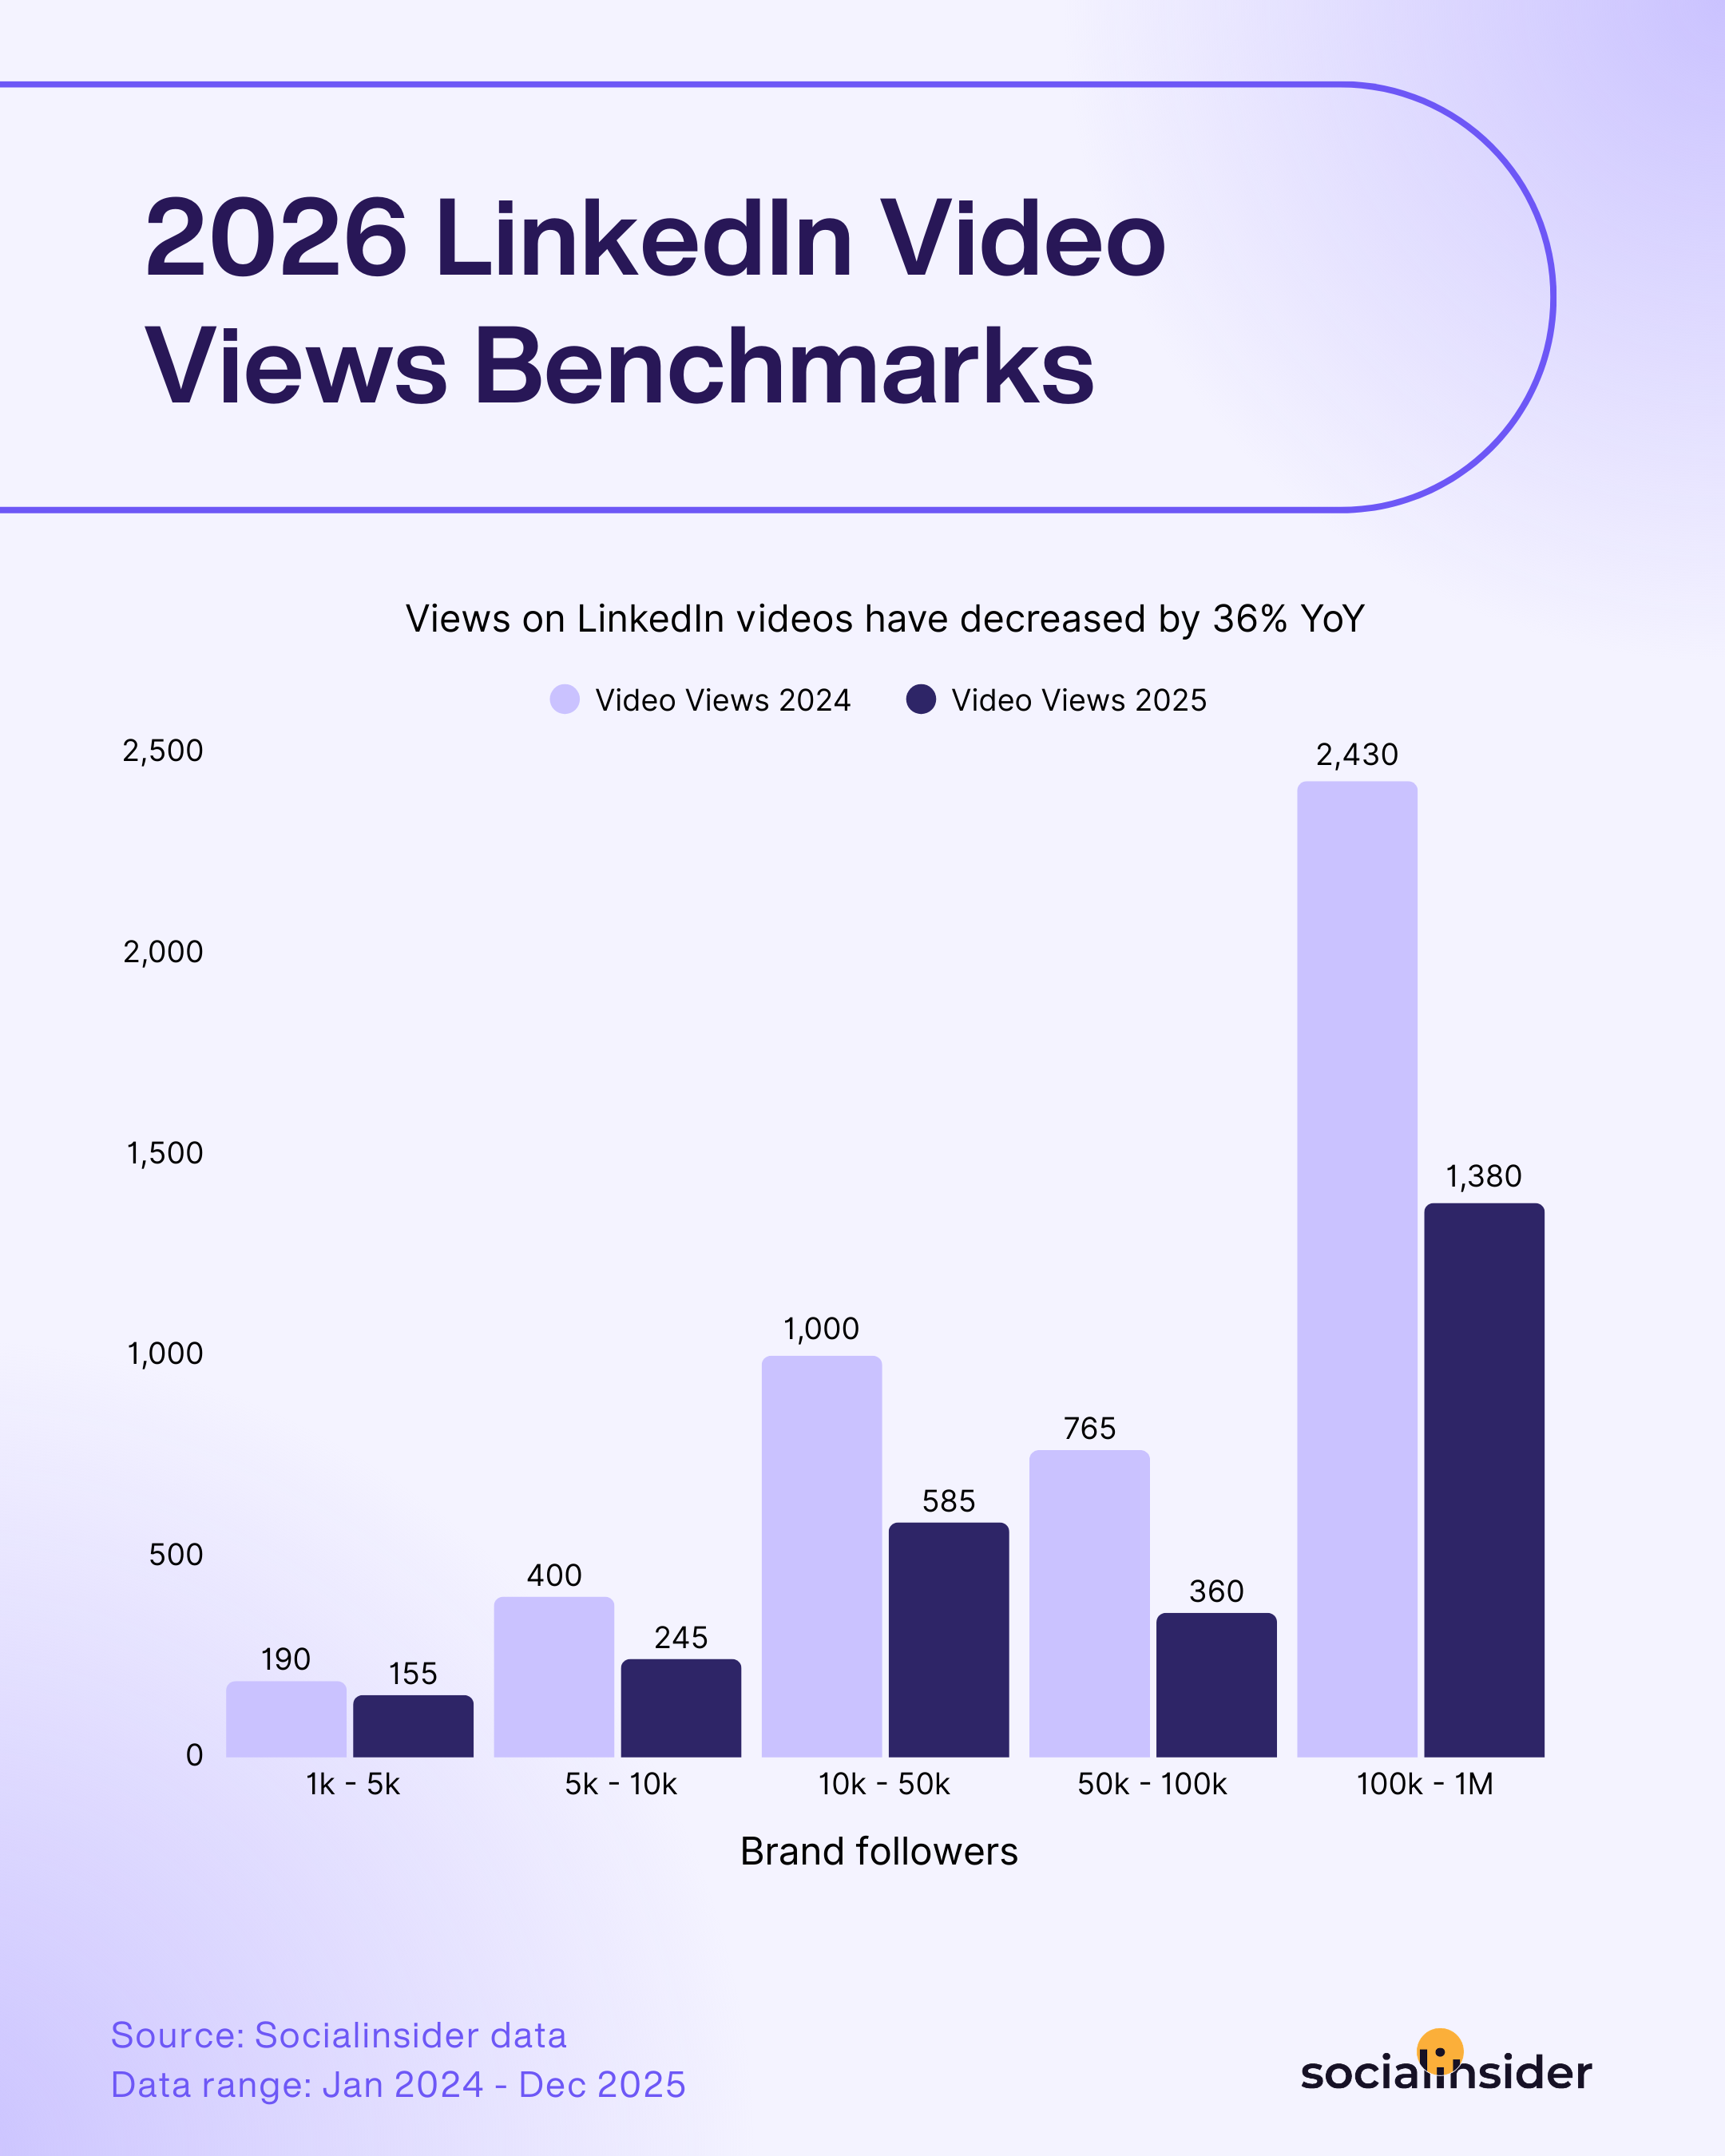
11. Video views
Views are the first thing everyone checks. They're also the easiest number to misread.
Video views count how many times your video was watched. Mostly, they tell you whether your hook was strong enough to stop the scroll.
I'd pay attention to how quickly views pile up. Fast early growth usually means a strong opening and good timing.
But a raw view count means little without context. Is 10,000 views good for your industry, or just big?
Socialinsider's social media benchmark reports answer exactly that.
12. Video completion rate
Plenty of people start your video. How many actually finish it?
Completion rate is the share of viewers who watched all the way to the end.
Completion rate = completed views ÷ total views × 100
It's one of my favorite video metrics, because it shows whether your pacing, structure and message really hold attention.
For Melani, it matters most on YouTube:
Prioritizing completion rate on YouTube is very, very important because majority of the people on the platform are really excited about long form, right? They're there to really watch something long. So when it comes to them watching a short and finishing it, that means they find it fascinating. That means they're really engaging with it and learning from it.
13. Watch time and average percentage viewed
Is a 3-minute video with 90 seconds of watch time better than a 30-second clip watched in full? It depends which metric you look at.
Watch time is the total time people spend watching. Average percentage viewed shows how far through the video the typical viewer gets.
I'd always track them together. Watch time naturally favors longer videos. Average percentage viewed removes that bias, so you can compare short and long content fairly.
On TikTok, Melani treats watch time as creative feedback:
For TikTok, it's the watch time — figuring out where people drop off. In this one-minute or two-minute video, where did people get bored? How can you as a storyteller improve your art?

14. Retention rate
Views tell you people clicked. Retention tells you whether they stayed.
Retention rate shows how well your video holds attention from second to second, and exactly where people bail.
Melani prioritizes it on Instagram, where the competition for attention is fierce:
Instagram is such a high discovery tool now. There's so many aesthetic things on the app, people want to keep scrolling. So when someone stays on one video and watches it all the way through, that means they found value in it.
I'd look for the exact second the curve drops.
If it's always in the first three seconds, the hook is the problem. If it drops halfway through, it's the pacing.
Influence and brand metrics
So how is social media influence actually measured?
Here's the gist: by what people say and create about your brand when you're not the one posting. In practice, that comes down to three things: mentions and user-generated content, sentiment, and the impact of creator content.
15. Mentions and UGC
What's better than a great post from your brand? A great post about your brand that you didn't make.
Mentions and UGC track how often people tag, name or feature you in their own content. It's about as close to love as social media gets.
I'd look at who is talking, not just how many. A mention from a loyal customer or a niche community often carries more weight than a dozen passing tags.
Spikes usually follow a campaign or product news. A slow, steady slide is the one to worry about, since it often means momentum is fading.
16. Audience sentiment
High engagement sounds great. Unless half of it is people complaining.
Sentiment sorts the conversations about your brand into positive, neutral and negative, so you can tell the difference.
I'd track the ratio over time rather than reacting to individual comments. A healthy brand leans positive, with little volatility.
The big catch is context. A handful of sharp negative comments about a product issue can matter more than a hundred neutral ones, and sudden swings in tone deserve a look the same day.
17. Creator content impact
You're paying creators, or at least gifting them. Are those posts doing anything your own content can't?
Creator content impact shows how much reach and engagement your brand earns through creators and collaborations, beyond your own followers.
The simplest way I'd measure it: compare engagement rate by reach on creator posts with the same metric on your in-house posts. It's the same switch Melani makes for every collab.
If it helps you picture it: your own posts show how much your followers like you. Creator posts show whether strangers will, too.
For the full workflow of tracking creators campaign by campaign, see our influencer analytics dashboard guide.
Traffic and conversion metrics
At some point, someone in a leadership meeting will ask: "But what did social actually drive?"
These are the metrics that answer them. Social media conversion metrics show whether your content turns viewers into people who click, sign up or buy.
This is where social stops being purely a visibility play and starts touching revenue.
18. Click-through rate
A post can rack up thousands of impressions and still send no one anywhere.
Click-through rate (CTR) shows the share of people who clicked your link after seeing a post or ad.
CTR = link clicks ÷ impressions × 100
I'd compare CTR across posts to see which hooks and calls to action actually earn the click.
I also like testing different CTA styles. Fair warning: the winner is rarely the one I'd have bet on.
19. Social referral traffic
Clicks are a promise. Did people actually arrive, and did they stick around?
Social referral traffic counts the visitors who land on your website from social platforms. You'll find it in Google Analytics, under traffic acquisition, filtered by social channels.
I'd look at quality, not just volume. Time on site and pages per session show whether visitors found what they came for.
Some channels send crowds. Others send fewer, far more qualified people. Both are useful, as long as you know which is which.
20. Conversion rate
Traffic is nice. Action is better.
Conversion rate shows the percentage of people who completed a desired action after engaging with your content.
Conversion rate = conversions ÷ clicks (or visits) × 100
What I'd watch is where conversions come from. Certain platforms and formats almost always convert better than others, and that's worth knowing before you plan next quarter's mix.
21. Return on ad spend
Cheap clicks feel like a win. Until you check what they actually earned.
Return on ad spend (ROAS) shows how much revenue you earn for every dollar spent on social ads.
ROAS = revenue from ads ÷ ad spend
I'd compare it platform by platform. Some channels deliver cheap clicks but weak conversions, and that drags the overall return down.
Whether that return makes social worth the investment is a bigger question. For attribution models and lifetime value, see our guides on social media ROI and how effective social media marketing is.

Customer care metrics
For a lot of people, your comment section and DMs are the help desk. They don't care which team officially owns it.
So how well are you keeping up? Two metrics tell you.
22. Response rate
Every unanswered question is a small public signal that nobody's listening.
Response rate shows the share of questions, complaints and DMs your team actually answers.
Response rate = messages answered ÷ messages that needed an answer × 100
One tip: I'd separate real questions from general reactions before calculating. Otherwise, every "love this!" drags your rate down for no reason.
23. Average response time
Answering is good. Answering before someone gives up is better.
Average response time shows how long people wait, on average, for a reply.
I'd break it down by platform and by time of day. Slow replies tend to cluster around evenings and weekends, which is often exactly when a complaint turns into a public thread.
Competitive metrics
Your engagement rate went up 12% this quarter. Great news, right?
Not if your closest competitor's went up 40%.
Competitive metrics put your numbers in context. They show where you lead, where you lag, and which tactics competitors are using to win attention.
This section covers the metrics themselves. For the full process, see our guides to competitive analysis on social media and competitive benchmarking.
24. Share of voice
When people in your industry talk on social, how much of that conversation is about you?
Share of voice (SOV) answers that, by comparing your brand's slice of the conversation with your competitors'.
Share of voice = your brand's mentions (or engagements) ÷ the total across your competitive set × 100
I'd track it platform by platform. You may own the conversation on Instagram while a competitor quietly dominates LinkedIn.
And if your SOV suddenly drops? Someone else probably just launched a campaign.
25. Competitor growth
Are your competitors growing faster than you? And more importantly, why?
Competitor growth tracks how quickly they gain followers, engagement and visibility.

I'd look for the spikes first, then go find their cause. They almost always trace back to a campaign, a viral post or a new format.
Steady growth is a different signal. It usually means a solid social media strategy rather than luck.
The numbers only tell you half the story, though. I also check qualitative competitor insights, like the tone and style competitors use in their Reels.
The clues are out there for you, too.
26. Industry benchmarks
Is a 3% engagement rate good?
In one industry, it's excellent. In another, it's average. Without a benchmark, you simply can't tell which.
Industry benchmarks show how a typical brand in your sector performs on the same metrics you track.
How to track social media metrics
Phew. That's a lot of metrics.
Knowing what they mean is one thing. Tracking them without drowning in tabs and exports is another. Here's the process I'd follow.
Step 1: Fix your formulas before you collect anything
Every platform calculates engagement a little differently. Some count video views as engagement, others don't. Some divide by followers, others by impressions.
If you compare Instagram and LinkedIn numbers built on different formulas, the comparison means nothing.
So before you collect anything, I'd decide on one definition per metric and apply it everywhere. Write it down. Your future self, and whoever inherits your reports, will thank you.
Step 2: Choose native analytics, a tool, or both
Native analytics are free, and they're fine for a quick check on a single account.
The big catch? You end up hopping from Instagram Insights to TikTok's dashboard to LinkedIn Analytics, copying numbers into a spreadsheet by hand. Every single month.
For anything recurring, I use three tools, each covering a different part of the journey.

Socialinsider gives me cross-channel analytics in one place: engagement trends, follower growth, content pillars and formats across every platform. It also adds what native tools can't, like benchmarking against competitors and historical data for any public account.
Google Analytics shows what happens after someone clicks. Social platforms tell you about reach and engagement. Google Analytics connects those clicks to sign-ups, purchases and revenue.
Looker Studio turns scattered data into visual reports that update themselves. It's especially useful for pairing social engagement with website conversions in one view.
Here's a simple test for your setup: can these tools answer a specific question about any metric in this guide, without someone exporting and stitching data together first?
If the answer is no, or your dashboards keep failing with errors like "Looker Studio cannot connect to your data set," that's a tooling problem worth fixing. It isn't something your team should have to work around.
Step 3: Set a tracking cadence
Not every metric needs checking every day. Here's the rhythm I'd use:
- Weekly: reach, engagement rate, top and bottom posts. A quick pulse check.
- Monthly: follower growth, content pillar and format performance, traffic and conversions. This is where real trends show up.
- Quarterly: share of voice, competitor growth and industry benchmarks.
Daily checks rarely reveal anything a weekly review wouldn't. Unless you're mid-launch, I'd skip them.
Step 4: Track history and competitors, not just this month
A single month's numbers are a snapshot. You need the months before them to know whether things are improving.
The same goes for competitors. Tracking only your own accounts tells you how you're doing, but not how you're doing compared with anyone else.
That's why I'd pick a tool that stores historical data and lets you add competitor profiles from day one, rather than starting from scratch every time someone asks.
How to measure social media performance over time
Your engagement rate is 2.4% this month. Is that good? On its own, there's no way to know.
Measuring performance means reading numbers in context, and three habits make the difference.
Start with a baseline
Before you judge any number, you need to know what normal looks like for your account. I'd take your average across the last three to six months as a starting point.
Anything well above that line is worth studying. Anything well below it is worth a closer look.
Normalize by audience size
Raw totals favor big accounts. A brand with two million followers will always win on likes.
That's why rates (engagement rate, reach rate, follower growth rate) are the fairer way to compare accounts, platforms and time periods.
Measure momentum, not just totals
Static metrics are snapshots. Momentum tells you whether content is actually gaining traction.
So instead of asking "how many likes did this post get?", I'd ask:
- How fast did engagement come in after publishing?
- Did reach keep climbing after the first few hours, or flatten right away?
- Are saves and shares still growing days later?
That's also how Melani's team found their winning format. Instead of relying on industry assumptions, they looked for patterns in their own performance data:
We noticed very early on that video, especially stories focused on New York-centric, local creator content, consistently outperform everything else. Videos always do well, so we truly prioritize videos.
They review performance monthly, spot the patterns that repeat, and double down on the formats that keep people engaged.
Compare month over month and year over year
Month-over-month comparisons show short-term direction. Year-over-year comparisons strip out seasonality.
Holiday spikes. Summer slumps. Back-to-school surges.
Seasonal patterns like these can make a perfectly normal month look like a crisis, or a weak one look like a win. That's why I'd always check both views before drawing a conclusion.
Importance of different social media metrics by platform
The categories above apply everywhere. Of course, each platform puts its own spin on them.
Let's take a quick look at the metrics that matter most on each network. For formulas, benchmarks and platform-specific advice, the dedicated guides go much deeper.
Instagram: sends, saves and Reels retention carry the most weight, since Instagram is now heavily discovery-driven. See our full guide to Instagram metrics.
TikTok: watch time, completion rate and shares tell you whether a video earned its spot on the For You page. More in our guide to TikTok metrics.
LinkedIn: engagement rate by impressions, click-through rate and follower demographics by job function matter most for B2B brands. See LinkedIn metrics.
Facebook: with organic reach under pressure, reach, shares and video views show which content still travels. See Facebook metrics.
YouTube: average view duration, thumbnail click-through rate and subscribers gained per video show long-term channel health. See YouTube metrics.
X (Twitter): engagement rate, replies and link clicks show whether your posts start conversations. See Twitter metrics.
Final thoughts
A dashboard full of numbers isn't the same as knowing what's working.
The brands that get the most out of social media metrics don't track more of them. They track the right ones consistently, judge every number against a baseline or a benchmark, and look past likes to the signals that show real interest.
The next step is turning a few of these metrics into goals with targets. That's what our social media KPIs guide covers.
For now though, if you'd rather skip the spreadsheets, Socialinsider brings your metrics, your competitors' and your industry benchmarks into one place. Start a free trial and see your numbers in context.
FAQs on social media metrics
What are social media metrics, and how are they different from KPIs?
Social media metrics are the data points that show how your accounts and content perform: who sees your posts, how people react, and what they do next. A KPI is one of the few metrics you've tied to a business goal and a target. Every KPI is a metric, but not every metric deserves to be a KPI. Our social media KPIs guide covers how to choose them.
What are the most important social media metrics to track?
In our survey of over 140 social media professionals, the most-tracked metrics were engagement rate (85.1%), reach (60.2%), follower growth (49.3%) and views (41.8%). Beyond those, the most important metrics are the ones that answer the question your team is responsible for, whether that's awareness, engagement or conversion.
Which social media metrics are vanity metrics?
Likes, raw follower counts and impressions become vanity metrics when they're reported on their own. They're not useless. They just need context, such as a rate, a trend or a benchmark, before they say anything meaningful about performance.
How often should I check my social media metrics?
Weekly for a quick pulse check, monthly for spotting real trends, and quarterly for benchmarking against competitors and industry averages. Daily checks rarely reveal anything a weekly review wouldn't.
How do I track my competitors' social media metrics?
Native analytics only cover your own accounts, so you'll need a third-party tool. Socialinsider lets you add any public competitor profile and track its follower growth, engagement, content pillars and share of voice, including historical data, next to your own.
What tools can I use to track social media metrics?
Native analytics work for quick checks on a single account. For recurring, cross-platform tracking, a dedicated tool like Socialinsider brings every channel, your competitors and industry benchmarks into one place. Google Analytics covers what happens after the click, and Looker Studio helps you combine everything into automated reports.

Elena Cucu
As Content & SEO Manager at Socialinsider, Elena Cucu helps social media leaders make sense of the numbers behind their performance. Featured in TechCrunch, TNW, and ReadWrite.

Know what your competitors do — before your manager asks
Get instant social benchmarks & reports without manual work.