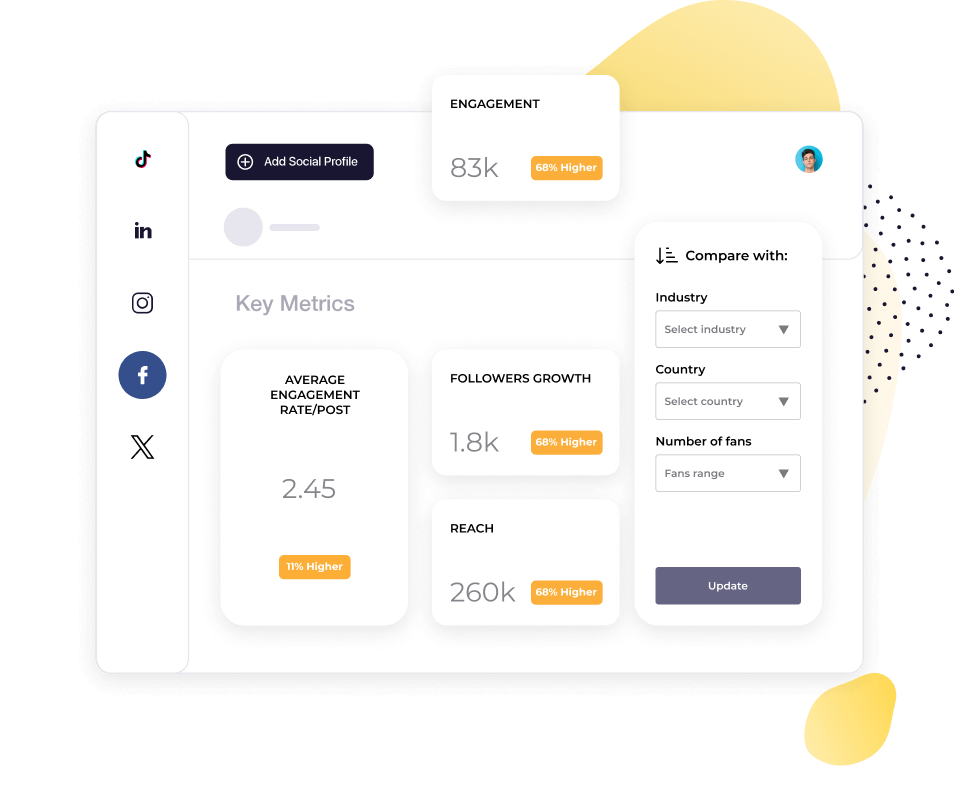
Facebook competitor benchmarks and analytics in one place
Socialinsider tracks any public Facebook page alongside yours. Compare engagement, growth, and content strategy so you're never reporting numbers in a vacuum.


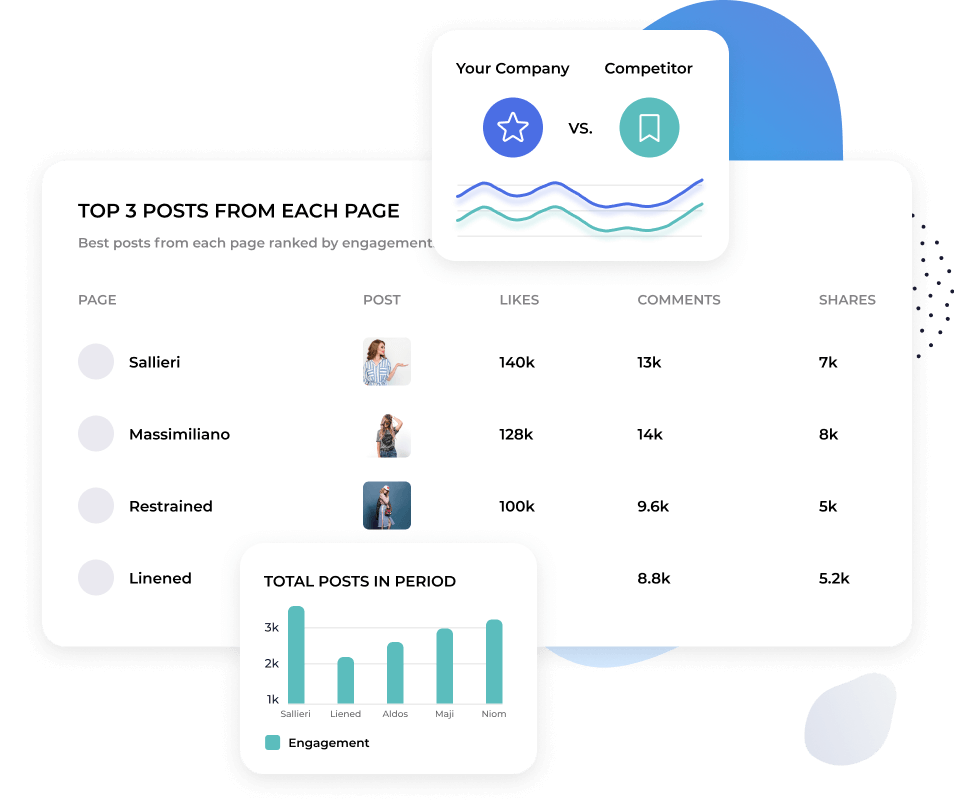
Compare multiple Facebook pages in one view
Add every competitor you want to track and see them all in one aggregated view.
Compare engagement, growth, and posting frequency across your full competitive set instead of checking pages one at a time.
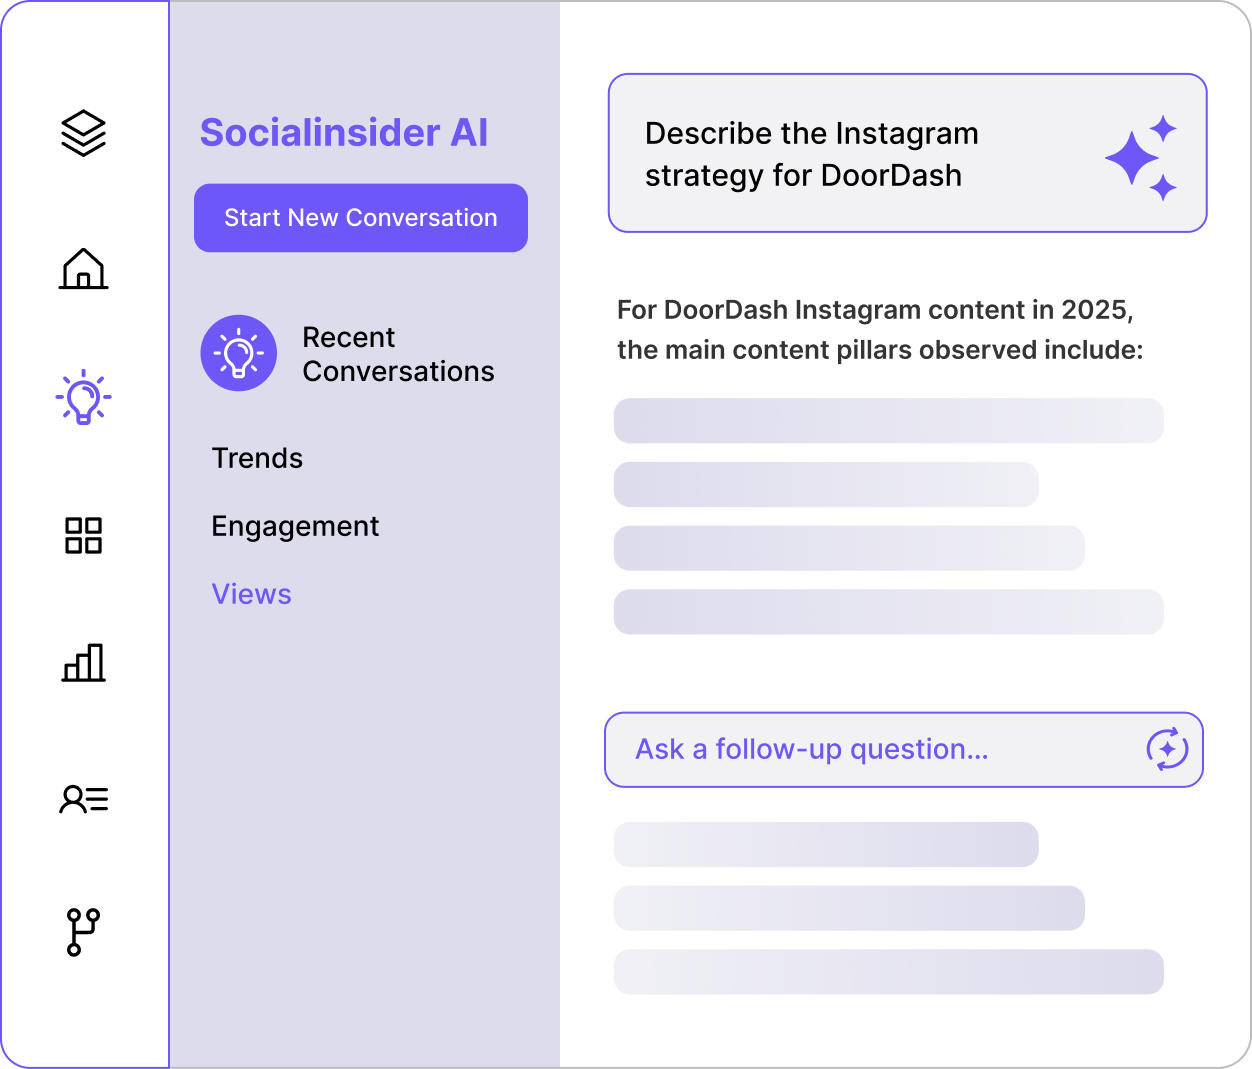
Ask Socialinsider AI anything & uncover insights
Facebook competitor analysis is easy when you can get answers instantly.
Ask Socialinsider AI any question in plain language. It analyzes your account, competitor data, and market benchmarks in real time. Get answers to questions like “Why did our engagement drop this month?” in seconds.

"The competitor analysis helped in creating visibility on how we are performing in the market."

Know if there’s a shift in your market
When your engagement drops, the first question is whether it's happening to everyone or just you.
Socialinsider shows your trends alongside your competitors' trends so you can tell the difference immediately instead of making a best guess.
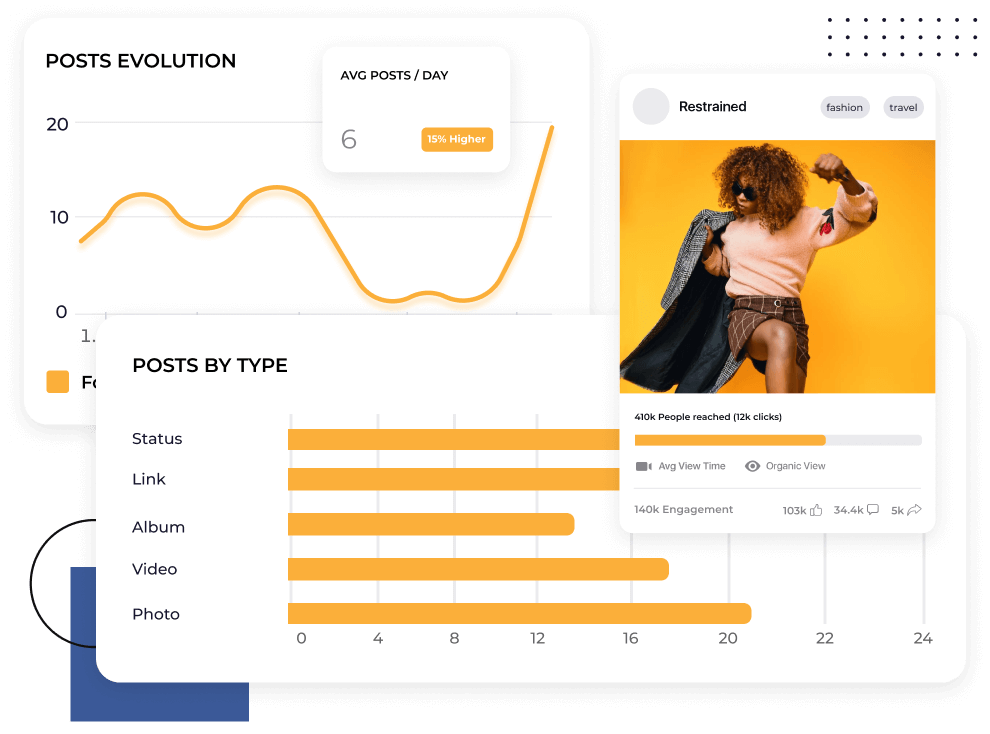
Find out what content is working on Facebook right now
What worked with Facebook's algorithm a year ago may not work today.
Socialinsider finds what types of content are performing well in your market so you can see patterns and post what gets likes, comments, and shares.
What they say about us
"Customer service has been one of my favourite features as well. You guys are just phenomenal. Your team is so responsive and very friendly and helpful. Which is not the norm."

"Socialinsider helped us understand whether we're improving or decreasing especially compared to the other accounts that we follow."

"Socialinsider allows for a competitor analysis that gives an insight to performance relative to the market."

"The sentiment analysis is amazing for Instagram hashtags. This new social media listening dashboard helped me in long-term planning."

"We are using this social media analytics dashboard for all our 40 social media clients. We can have all the performance data in one single place."

"With Socialinsider, our team became more efficient. We do not need to spend time on social media data gathering. Instead, we can focus on insights and analysis."

"We use Socialinsider for day-to-day social media insights if we need to outline any simple strategic changes or review the performance of certain social posts."

"On average, a social media report for a brand requires 1 to 2 hours of work with Socialinsider, where it used to require a full day to gather the data."

"Socialinsider has saved us more than $16k per year. It has enabled us to save time on monthly reports and complex long-term analyses."

How to track Facebook engagement rate in Socialinsider
Sociainsider’s social media analytics, competitors analysis tools allow you to measure social media performance, run audits, and compare performance.
Start by creating a trial account to Socialinsider
Add your competitors and connect the profiles you manage
Get all the engagement metrics for any Facebook business account
Compare your performance against your top competitors
Perform a cross-channel analysis to evaluate your Facebook performance.

Get competitive insights and explore
social media analytics metrics
Frequently Asked Questions
Got a question? We've got answers.
What is Facebook analytics?
Facebook analytics refers to collecting and analyzing data and metrics from a Facebook business page. This helps you to measure the effectiveness of your social media marketing.
You can see analytics using different tools—from Meta Business Suite and Facebook Insights, to third-party apps like Socialinsider—to get insights on your audience growth and behavior, content and campaign performance, and the overall impact of your marketing efforts.
Why are Facebook analytics important?
Facebook analytics are important because they help businesses and marketers to understand how their page, content and campaigns are performing.
A Facebook analytics dashboard gives you an overview and granular detail on audience demographics, engagement rates, ad spend, conversion metrics, and more. Using these insights, you can make informed decisions to optimize your strategy, improve your targeting and ultimately drive better results for your business.
Analytics reporting is especially important on Facebook, since it has the most users (over 3 billion) and therefore data of any social media platform. This holds huge potential for businesses, as long as you can organize and accurately assess all of that data.
Effectively leveraging Facebook data analysis will help you figure out:
- Who to target
- What content to create
- When, where and how to post (best times to post, post types and formats)
- Why tactics and strategies do or don’t work
…so you can make the most of that potential.
What’s the difference between Facebook analytics vs Facebook Insights?
Facebook analytics is a broad term used to describe the tracking and analysis of data and metrics from a Facebook page. Not to be confused with Facebook Analytics (capital “A”), which was the name of the platform’s native analytics app, retired in 2021.
In its place, you can now access Facebook analytics data through:
Facebook InsightsFacebook Insights is a reporting tool in the native app that offers detailed analytics of micro-level data.
Meta Business SuiteFacebook business analytics software that aggregates macro-level data from your Facebook and Instagram business profiles.
Third-party toolsPremium social media analytics tools like Socialinsider offer in-depth Facebook analysis in professional dashboards, with advanced metrics and automated reporting.
What are the top 3 Facebook analytics tools?
Wondering how to access analytics for Facebook? Facebook analytics software helps you monitor and understand metrics and data—but there are lots of tools to choose from.
To save you some time, here are the best reporting tools and what they offer:
Facebook Insights
A native tool by Meta, which you can access within the app.
Facebook Insights gives you comprehensive data about your page and recent posts, so you can see how your audience is growing and how your content is performing.
Insights tells you your reach, likes, comments, shares, audience demographics, competitor pages to watch and more, which will help you understand and build your presence.
Meta Business Suite
Meta Business Suite is another native tool for marketing professionals, which consolidates Instagram and Facebook business analytics in one place.
You can manage and report on multiple Facebook pages and Instagram accounts, with more in-depth metrics on post performance, audience insights and advertising data. This streamlines cross-platform management and gives you a holistic overview of your social media marketing efforts.
Socialinsider
Socialinsider is a third-party, robust social media analytics tool that provides advanced insights on your Facebook marketing.
It allows you to track your Facebook page performance in an in-depth, professional-level dashboard. You can compare and analyze any page to run a Facebook competitor analysis report or conduct cross–platform analysis. Then easily export all of this data in multiple formats whenever you want to audit or share results from your Facebook marketing.
All of which will help you optimize your strategy and stay ahead of the competition.
How to access Facebook analytics
Here are 3 ways where you can acces Facebook analytics insights
How to access analytics with Facebook Insights
To access analytics within Facebook Insights, follow these steps:
- Log into your Facebook account.
- Go to your business or fan page.
- Click on “Insights” in the top menu.
You’ll be able to see different metrics under these categories:
- Page overview: this is where you’ll find a summary of your Facebook page views, page likes and impressions, as well as total post reach and engagement.
- Audience: check Facebook followers and changes over time, plus audience demographics like language, age, gender and location.
- Recent posts: see reach, clicks, reactions, comments, shares and video views.
How to access Facebook analytics in the Meta Business Suite
To see insights in the Meta Business Suite, follow these steps:
- Log into your Facebook account.
- Navigate to the Meta Business Suite: business.facebook.com.
- Select your business account.
- Click on “Insights” in the left-hand menu.
You’ll get more sophisticated data aggregation and macro metrics that aren’t available in Page Insights:
- Overview metrics: reach (both paid and organic), 3-second views, 1-minute views, minutes viewed, content interactions, reach breakdown.
- Comparison between Facebook and Instagram performance: reach, visits, net followers.
- Existing vs potential audience: demographics and metrics on your current audience, as well as potential users you could target.
- Benchmarking: industry insights and Facebook competitive analysis.
- Content overview: all post formats (Reels, videos, Live, posts, Stories), top content formats and audience retention.
How to access Facebook analytics with Socialinsider
Socialinsider is a robust Facebook analytics tool that lets you monitor your content performance, profile growth and insights in one place.
To access Facebook analytics with Socialinsider, follow these steps:
- Sign up or log in to your account on socialinsider.io.
- Create a new project or navigate to an existing project. Click “Connect social accounts”.
- Connect to your Facebook account, then select the page(s) you would like to add.
- From your dashboard, you can select the page you wish to analyze.
You’ll get a comprehensive page Summary, where you can select the KPIs and charts you wish to see, depending on your most important metrics. For more detailed analysis, toggle between engagement, reach, impressions, audience, and more.
Here are some examples of the analytics you get with Socialinsider:
- History post data
- Top Facebook analytics metrics: content, engagement, estimated reach (only Facebook provides accurate reach metrics—we estimate this metric based on other data), impressions, audience demographics, top posts, video metrics
- Social media competitor analysis: industry-wide and direct competitors
- Top-performing content formats
- Reels analytics
- Video analytics
- Cross-channel analysis: compare your Facebook page performance with your Instagram performance
You can export or schedule a Facebook analytics report with all the data you want to see.
Which Facebook page analytics metrics should you track?
Facebook data reporting can offer you valuable insights into the effectiveness of your social media marketing strategy.
However, you might feel overwhelmed by just how many Facebook metrics there are. What do they mean? Which ones should you track? And how can you use that data to unlock success for your business?
Here’s what you need to know.
How to analyze your Facebook data
If you’re new to monitoring your Facebook page analytics, start by considering what’s important to your business.
Is your page a top-of-funnel brand awareness channel? Then maybe you want your organic posts to go viral, so you can reach a much wider audience. In this case, you might prioritize reach, impressions, follower/fan growth and engagements.
Or perhaps Facebook is a key acquisition channel that drives revenue. You’d want to scrutinize your Facebook ad analytics to make sure you’re getting the best ROI.
Identify these goals first if you want to really benefit from an in-depth understanding of Facebook analytics. Then it will become clear which metrics show your progress.
We can group these Facebook metrics into:
- Page analytics
- Audience insights
- Post analytics
- Stories analytics
- Reels analytics
- Video analytics
- Live analytics
- Ad analytics
Let’s take a look at each category in more detail.
Which Facebook page analytics metrics should you track?
Your Facebook business page analytics cover everything related to page performance: reach, impressions, engagement, clicks, mentions and followers.
These insights tell you how users are interacting with your page and its content, so you can understand the impact of your posts and activity.
The reason why it’s important to track Facebook page analytics is that a lot of effort goes into creating content—so it’s easy to just focus on individual post performance. However, you need to think of the bigger picture to create a really successful strategy.
Think of your Facebook page metrics as a litmus test for your brand’s overall presence. They’re your feedback loop for how your posts and activity are growing your brand awareness, engaging your audience and driving traffic.
Reach - available in Socialinsider as an estimateReach is the number of unique accounts (which means individual users) who have seen content from your page or about your page.
Reach data is available in Meta and as an estimate in Socialinsider.
Impressions - available in SocialinsiderImpressions are the number of times content from your page or about your page is displayed on a user’s feed.
Engagement - available in SocialinsiderEngagement is the total number of user interactions with your content (likes, comments and shares).
Engagement rate per post, by reach and by followers - available in SocialinsiderEngagement rate is the percentage of people who engaged with your content, divided by either those who saw it (reach) or the total number of people who could see it (followers).
Link clicks - available in SocialinsiderLink clicks are the number of times users click on the links in your posts.
Mentions - available in SocialinsiderMentions are the number of times your page is mentioned in posts by other pages or users.
Post format by engagement - available in SocialinsiderPost format by engagement shows you which type of content (e.g. text, photo, video) gets the most engagement (likes, comments, shares).
Followers - available in SocialinsiderFollowers is the total number of users who have liked or followed your page.
Follower growth rate - available in SocialinsiderFollower growth rate is the percentage growth of your page followers over a specific period of time (weekly, monthly, yearly or custom dates).
Which Facebook audience metrics should you track?
Facebook audience insights metrics help you understand your audience demographics, behaviors and preferences so you can create targeted and relevant content. They include age and gender, location, language and potential audience.
Knowing your social media personas is, of course, the foundation of any successful social media marketing plan. With this valuable information, you can optimize your content and activity so that it reaches and engages the right people. For example, starting a localized Facebook group or working with influencers in certain countries or regions.
Audience insights give you the added advantage of data on your potential audience. By monitoring both your existing followers/fans and a wider group of users who could be interested in your page, you can continue to grow and nurture your brand community.
Age and gender - available in SocialinsiderA demographic breakdown of your followers by age groups and gender.
Location - available in SocialinsiderThe geographic distribution of your audience, showing the top cities and countries where your followers are based.
Language - available in SocialinsiderThe primary languages your audience speaks.
Potential audience - track with MetaThe estimated number of users who fit your targeting criteria and could potentially be reached through content or ads.
Which Facebook post analytics metrics should you track?
Facebook post analytics give you individual post metrics for more granular insights on performance. These content reporting metrics include impressions, reach, link clicks, engagement, engagement rate, plays for videos and reels, top performing posts, bottom posts, and insights on post themes and categories.
Tracking both your best and worst performing posts will allow you to identify recurring themes, so you can do more of what is working and less of what isn’t.
Post impressions - available in SocialinsiderThe total number of times a specific post was displayed to users.
Post reach - available in SocialinsiderThe number of unique users who saw a specific post.
Post link clicks - available in SocialinsiderThe number of times users click on a link in a specific post.
Engagement - available in SocialinsiderThe total interactions (likes, comments, shares) on a specific post.
Engagement rate per post (by post reach) available in SocialinsiderThe percentage of interactions (likes, comments, shares) on a post, relative to the number of users who saw the post.
Plays for video and reels - available in SocialinsiderThe total number of times a user played or viewed your video or Reels post.
Top performing posts - available in SocialinsiderPosts with the most engagements, highest engagement rate, reach, or other key metrics.
Bottom posts - available in SocialinsiderPosts with the least engagements, lowest engagement rate, reach, or other key metrics.
Posts groups - available in SocialinsiderAdvanced data analysis on posts that are tagged and grouped according to content themes, post formats, types of engagement (e.g. different reactions), or other categories.
Which Facebook Stories analytics metrics should you track?
Facebook Stories analytics show you reach and engagement with your Stories.
Stories are ephemeral content (videos, static posts, text, and more) that appear at the top of a user’s feed and lasts only 24 hours. They are an immediate and highly visible way to engage your audience in between page posts.
Business pages can use Stories to drive brand awareness and engagement. Because they are highly prominent on a user’s screen, they encourage your audience to interact with your brand more frequently, helping you stay top of mind and communicate in real-time.
Stories are also a lower-cost way to create content, compared to page posts like photos or videos. However, they still hold a lot of value for businesses—and that’s why it’s important to monitor Stories analytics.
Reach on Stories - track in MetaThe number of unique users who have viewed your Story.
Stories interactionsThe total number of interactions with your Story: taps, swipes, replies and reactions.
Which Facebook Reels analytics should you track?
Facebook Reels analytics give you insights on video views, reach and engagement.
Facebook Reels are short videos (3 to 90 seconds) with a vertical (9:16) format. They’re designed for immersive and entertaining content that’s a bit more thoughtful than Stories, but not as high-production as a standard video post.
Video marketing is increasingly dominating most social media platforms, and Facebook is no exception. Because Reels are given high priority by the algorithm and shown to people outside of your follower base, they can be a powerful format for enhancing discovery and boosting reach.
Reels content tends to be incredibly creative and trend-led, meaning it’s often used to achieve high-impact marketing without a huge budget. Well-crafted reels can be used for anything from sharing your brand’s take on a viral trend, to directly promoting a product or service.
To maximize their potential—and keep up with fast-moving trends—you need to keep a close eye on Reels analytics.
While these metrics are fairly similar to standard post analytics, some (initial plays, minutes viewed) are more in-depth to reflect the unique style of Reels content.
Initial plays - track with MetaThe number of times a Reel has been played for the first time by users.
Minutes viewed - track with MetaThe total number of minutes users have spent watching a Reel.
Interactions - available in SocialinsiderThe total number of user interactions with a Reel, including likes, comments and shares.
Post reach - available in SocialinsiderThe number of unique users who have viewed a specific Reel.
Post link clicks - available in SocialinsiderThe total number of times users have clicked on a link in a specific Reel.
Engagements - available in SocialinsiderThe total number of interactions (likes, comments, shares) a specific Reel has received.
Engagement rate per post - available in SocialinsiderThe percentage of interactions (likes, comments, shares) relative to the number of users who viewed the Reel.
Which Facebook video analytics metrics should you track?
Facebook video analytics indicate views, reach and engagement for your video posts.
Like Reels, video posts have increased visibility and stronger performance in the algorithm, so they typically have broader reach and higher levels of engagement than static posts.
The difference between Facebook Reels and Facebook videos is that Reels have a dedicated feed and are therefore shown to a wider audience, including non-followers. The style of content is also important, as videos can be longer than Reels and are less trend-led.
Because of this, long-form video posts can be an effective way to convey complex messages, capture viewers’ attention spans for longer, and build brand personality. For example, you might use a video post to tell your founder story or showcase how your product works.
As video posts tend to require a bigger investment of time, resource and budget than low-fi Stories or Reels, video analytics can make sure you get your money’s worth.
Minutes viewed - track in MetaTo check your video views on Facebook, you can look at the total number of minutes that users have spent watching a specific video (including any time spent replaying it).
Engagement - available in SocialinsiderThe total interactions on a video, including likes, comments, shares and reactions.
Post impressions - available in SocialinsiderThe total number of times a specific video was shown to users, regardless of whether they engaged with it.
Post reach - available in SocialinsiderThe total number of unique users who have viewed a specific video post.
Post link clicks - available in SocialinsiderThe total number of times users clicked on links included in a specific video post.Engagement rate per video post - available in SocialinsiderThe percentage of interactions (likes, comments, shares) relative to the number of users who viewed the video post.
Which Facebook Live analytics metrics should you track?
Facebook Live analytics give you performance data for your live streams.
The Live feature lets businesses pages interact with their audience in real-time. By hosting a live stream, you can get immediate feedback and build authentic connections with your ideal customer.
The Live format enhances transparency and builds trust, making it perfect for launching new products, running Q&A or Ask Me Anything sessions, sharing live events, or taking fans behind-the-scenes of your business.
On top of this, Live has high visibility in the algorithm, meaning you can use this feature to increase reach and boost engagement. Monitoring your Live analytics will help you decide the most effective and exciting ways to interact with your audience.
Minutes viewed - track with MetaThe total number of minutes users have spent watching a Facebook Live.
Engagement - available in SocialinsiderThe total interactions (likes, comments, shares and reactions) during a Facebook Live.
Peak views - available in SocialinsiderThe highest number of viewers watching a Facebook Live at the same time, for at least three seconds.
Which Facebook ad analytics metrics should you track?
Facebook ad analytics show you the effectiveness of your ad campaigns, so that you can optimize ad spend and maximize ROI.
Businesses invest a lot of time, resource and budget into developing effective Facebook marketing strategies—that’s why tracking and reporting is so crucial. This is especially true of ads, which require the most significant investment.
The best tool to monitor ad analytics is Meta’s Ads Manager. By closely analyzing metrics like reach, impressions and cost per result, you can gain insight into your ideal audience, track ad performance against your business goals, and make data-driven adjustments to your content and campaigns.
The deeper your understanding of your ads, the better your results will be.
Reach - track with MetaThe number of unique users who have seen your Facebook ad.
Impressions - track with MetaThe total number of times your Facebook ad is displayed, regardless of whether it was clicked or not.
Cost per result - track with MetaThe average cost of each desired outcome or action (e.g. a click or a conversion) generated by your Facebook ad. For example, if your ad spend is $100 and your campaign gets 10 clicks, the average cost per result is $10.
How to read a Facebook analytics report
The sheer volume of data available on Facebook can be a double-edged sword. While it gives you invaluable insights on the effectiveness of your marketing strategy, it can also feel confusing to know how to organize and analyze it.
So when you’re trying to read a Facebook analytics report, where do you start?
Here’s what to look out for:
Performance tracking: key metrics.
Remember that Facebook analytics primarily exist for you to understand how your page and content are performing. Start by focusing on the KPIs that you have identified to be most relevant to your business goals. In most cases, this will be:
- Reach
- Impressions
- Engagement
- Conversion rates
When you track these metrics across time, you’ll start to notice trends and patterns that will help you gauge the success of your strategy.Audience demographics.
The next piece of the data puzzle is audience demographics. These are crucial because they help you assess who your content is reaching and engaging—and whether this is the right audience.
Audience demographics include age, gender, location and interests. Monitoring these insights can reveal opportunities to tailor your messaging and tactics for your intended audience, so that your content, campaigns and other activities are relevant and targeted.
They can also reveal opportunities to evolve your strategy and reach new audiences entirely. For example, expanding into a new geographic location.
Content optimization.
Facebook analytics play a huge role in content marketing, particularly given that social media algorithms move at a fast pace. What works today might not work tomorrow, so you need to pay close attention to make sure your content delivers results.
Regular analysis and reporting helps you review which types of content (whether that’s post formats or content pillars) get the highest reach and the most engagement. You can determine what resonates with your target audience and use this information to optimize future content—from replicating successful campaigns to pressing pause on formats that aren’t yielding any results.
This will also help you judge whether to participate in wider platform trends or adjust your strategy when a new feature is released.
For example, you might notice that Reels boost your reach or that humorous content leads to more followers. Leveraging these insights means you can start creating content with confidence, rather than feeling like you’re shooting in the dark.
Budget allocation.
Anyone who’s ever created content for a business will know that it takes time, skill and budget—from hiring specialists, to producing assets, to committing to ad spend. To justify these investments, you need to be able to clearly visualize and communicate performance.
Facebook analytics help you to evaluate where your budget is going and if it is generating the right results. Look at cost metrics (such as cost per click or cost per conversion) to make sure you are getting a good ROI and share these with stakeholders to demonstrate the impact of your marketing efforts.
You can then adjust budget allocation depending on which ads and campaigns are the most successful.
Strategy adjustment.
Facebook analytics provide a wealth of data that can be used to examine specific tactics—whether it’s audience targeting, trend-led content, or ad spend.
Weaving all these things together tells the bigger story of your strategy: the overarching plan or method working to achieve your business goals.
Combining the insights gained from performance tracking, audience demographics, content optimization and budget allocation will ultimately give you an answer as to whether your strategy is working. For example, how are your tactics feeding into objectives like building brand awareness or driving sales?
From here, you will be able to judge what needs to change or stay the same. Use Facebook reporting to share key insights and takeaways with your wider team, then make data-driven decisions to enhance content, improve targeting, refine campaigns, or whatever else needs to be done to make your strategy more effective.
How to see post analytics on Facebook
Facebook post analytics are one of the most immediate and accessible ways for businesses to understand their performance. You’ll likely want to check post data on a weekly if not daily basis, so here’s how to do it:
#1. In Facebook’s Page Insights
To see post analytics in Page Insights, follow these steps:
- Log into your Facebook account. Either click “Professional Dashboard” from your feed, or go to the page you manage and click “Manage”.
- Once you are in the Professional Dashboard, you can navigate to “Your Page” to see an overview of post reach and engagement.
- Or you can go to “Content” to see a more detailed breakdown.
#2. In the Meta Business Suite
The Meta Business Suite provides you with more granular data on your posts, plus you can compare with Instagram content.
To see your Facebook post analytics in the Meta Business Suite, follow these steps:
- Log into Facebook and click on your profile photo in the top right.
- Select “See all profiles”, then choose the Page you want to review.
- Go to Meta Business Suite in the left-hand menu.
- Click “Insights” and scroll down to “Content”.
- Click “Overview” for top-level metrics (e.g. median post reach per media type) or “Content” for post-by-post metrics (e.g. post reach, reactions, comments and shares).
#3. With Socialinsider
Socialinsider gives you more advanced Facebook analytics for a detailed and professional-level understanding of your performance.
To see your Facebook post analytics in Socialinsider, follow these steps:
- Sign up or log in to your Socialinsider account.
- Select or create a Project and choose or connect the Facebook page you’d like to analyze.
- Toggle between different sections in the left-hand sidebar, depending on the data you need. “Content” shows you an overview of your publishing (e.g. post distribution, posting times, top posts and bottom posts). “Posts” or “Video” shows you more granular metrics for individual posts (e.g. reach, impressions, engagements and views).
How to track Facebook traffic in Google analytics.
Does your Facebook page serve as a brand awareness, lead generation or acquisition channel for your product or service? Then you’ll likely want to keep a close eye on how your Facebook marketing translates to website traffic.
You can track website traffic from your Facebook page in Google Analytics (GA) by following these steps:
1. Set up UTM parameters with Google Campaign URL Builder.
Firstly, you need to set up UTM parameters for the links you wish to share. This will allow you to accurately attribute traffic from Facebook in GA.
Add UTM parameters to your website links using Google Campaign URL Builder. You can track key information by filling in the different fields: source, medium, campaign name, term and content.
For example, utm_source=facebook, utm_medium=social or utm_campaign=[campaign_name].
2. Add your custom URL to your posts.
When you’ve filled out these fields, Google will generate a custom, trackable URL that you can copy and paste into your Facebook posts.
If you wish to shorten the link, you can use a tool like Bitly.
3. Measure traffic in Google Analytics.
Log in to your GA account and go to Reporting > Acquisition > Traffic acquisition.
Here, you can view the traffic driven by your content and campaigns, including metrics like sessions, bounce rate and conversions.
In the drop-down menu, you can change the view depending on the UTM parameters you set (session medium, session source, session campaign, etc.).
4. Analyze your performance.
GA will show you how your Facebook marketing is driving traffic to your website or landing page and compare it with other sources (e.g. email or Instagram). Use these insights to create reports and optimize your strategy.
Is Facebook Analytics still available?
Facebook Analytics was the name of Facebook’s native tool for tracking audience and performance data from business pages and profiles. As of July 2021, the tool is no longer available.
You can now track Facebook analytics (referring to metrics and data from a business page, not the standalone tool) in Facebook Page Insights, from the Meta Business Suite, or using a third-party tool like Socialinsider.
How are data analytics used in Facebook?
Broadly speaking, Facebook uses data analytics to track user behavior and campaign performance.
Meta collects data from its users both on and off the platform, using cookies to track their online activity and store information about their behavior.
The data is used to personalize content, improve and build new features, keep users safe, target ads, and make sure the platform is running efficiently.
Business page owners can also benefit from this data through analytics, using Facebook’s native Insights feature, Meta Business Suite or a third-party tool like Socialinsider. These tools aggregate and analyze data so business owners and marketers can track key performance metrics, leverage audience insights and optimize their social media strategy.
How to export Facebook analytics data
If you want to create personalized reports on your Facebook marketing, you can export Facebook analytics data in Meta Business Suite or through another tool.
Socialinsider allows you to export Facebook insights in multiple formats: CSV, PPT, PDF and XLS. You can import data to Google’s Looker Studio too.
In Socialinsider, there’s also an option to schedule data downloads, so you can automate your Facebook reporting process. You easily customize your Facebook analytics reports by adding your brand colors and company logo.
The easiest way to get Facebook benchmark data
Add competitor pages and see how your performance compares. Start a free trial.