Executive Reporting: How to Turn Social Data Into Business Intelligence
Transform your reporting process with our tailored executive reporting solutions. Achieve clarity and precision in your business insights.


Executive reporting transforms social media metrics into strategic insights that drive C-suite decisions and justify marketing spend.
When done correctly, social media reporting bridges the gap between digital marketing activities and business outcomes, helping leadership understand not just what happened but what actions it needs to take to improve strategy.
This guide will help you understand what executive reporting is, how to make it count, and what tools to use to ease the process.
Key tkeaways
-
Types of executive reports in a social-first organization: Executive reports should align social media performance with business goals through ROI tracking, brand monitoring, and competitive benchmarking.
-
Executive reporting best practices for social media data: Effective executive reporting uses clear visuals and ties social data to strategic business outcomes.
-
How to build an integrated executive reporting system: An integrated system connects social metrics to company-wide KPIs by aligning objectives, selecting outcome-based metrics, and addressing data integration challenges.
What is executive reporting?
Executive reporting is the process of summarizing essential business data into clear, high-level reports tailored for the C-suite — think CEOs, CMOs, and other senior decision-makers.
Unlike operational reports that dive into granular day-to-day metrics, executive reports zoom out to showcase the bigger picture. They connect marketing and performance data to strategic business objectives like revenue growth, brand health, or customer loyalty.
In the context of social media, executive reporting translates engagement, reach, sentiment, and ROI into language that speaks to business impact. These reports help leadership understand what’s working, what needs attention, and where to invest next.
Ultimately, executive reporting is about turning social media data collection into direction, providing the clarity needed to make fast, informed decisions at the top level.
To help you strengthen your executive social media performance reports, Socialinsider has introduced a feature called Organic Value.
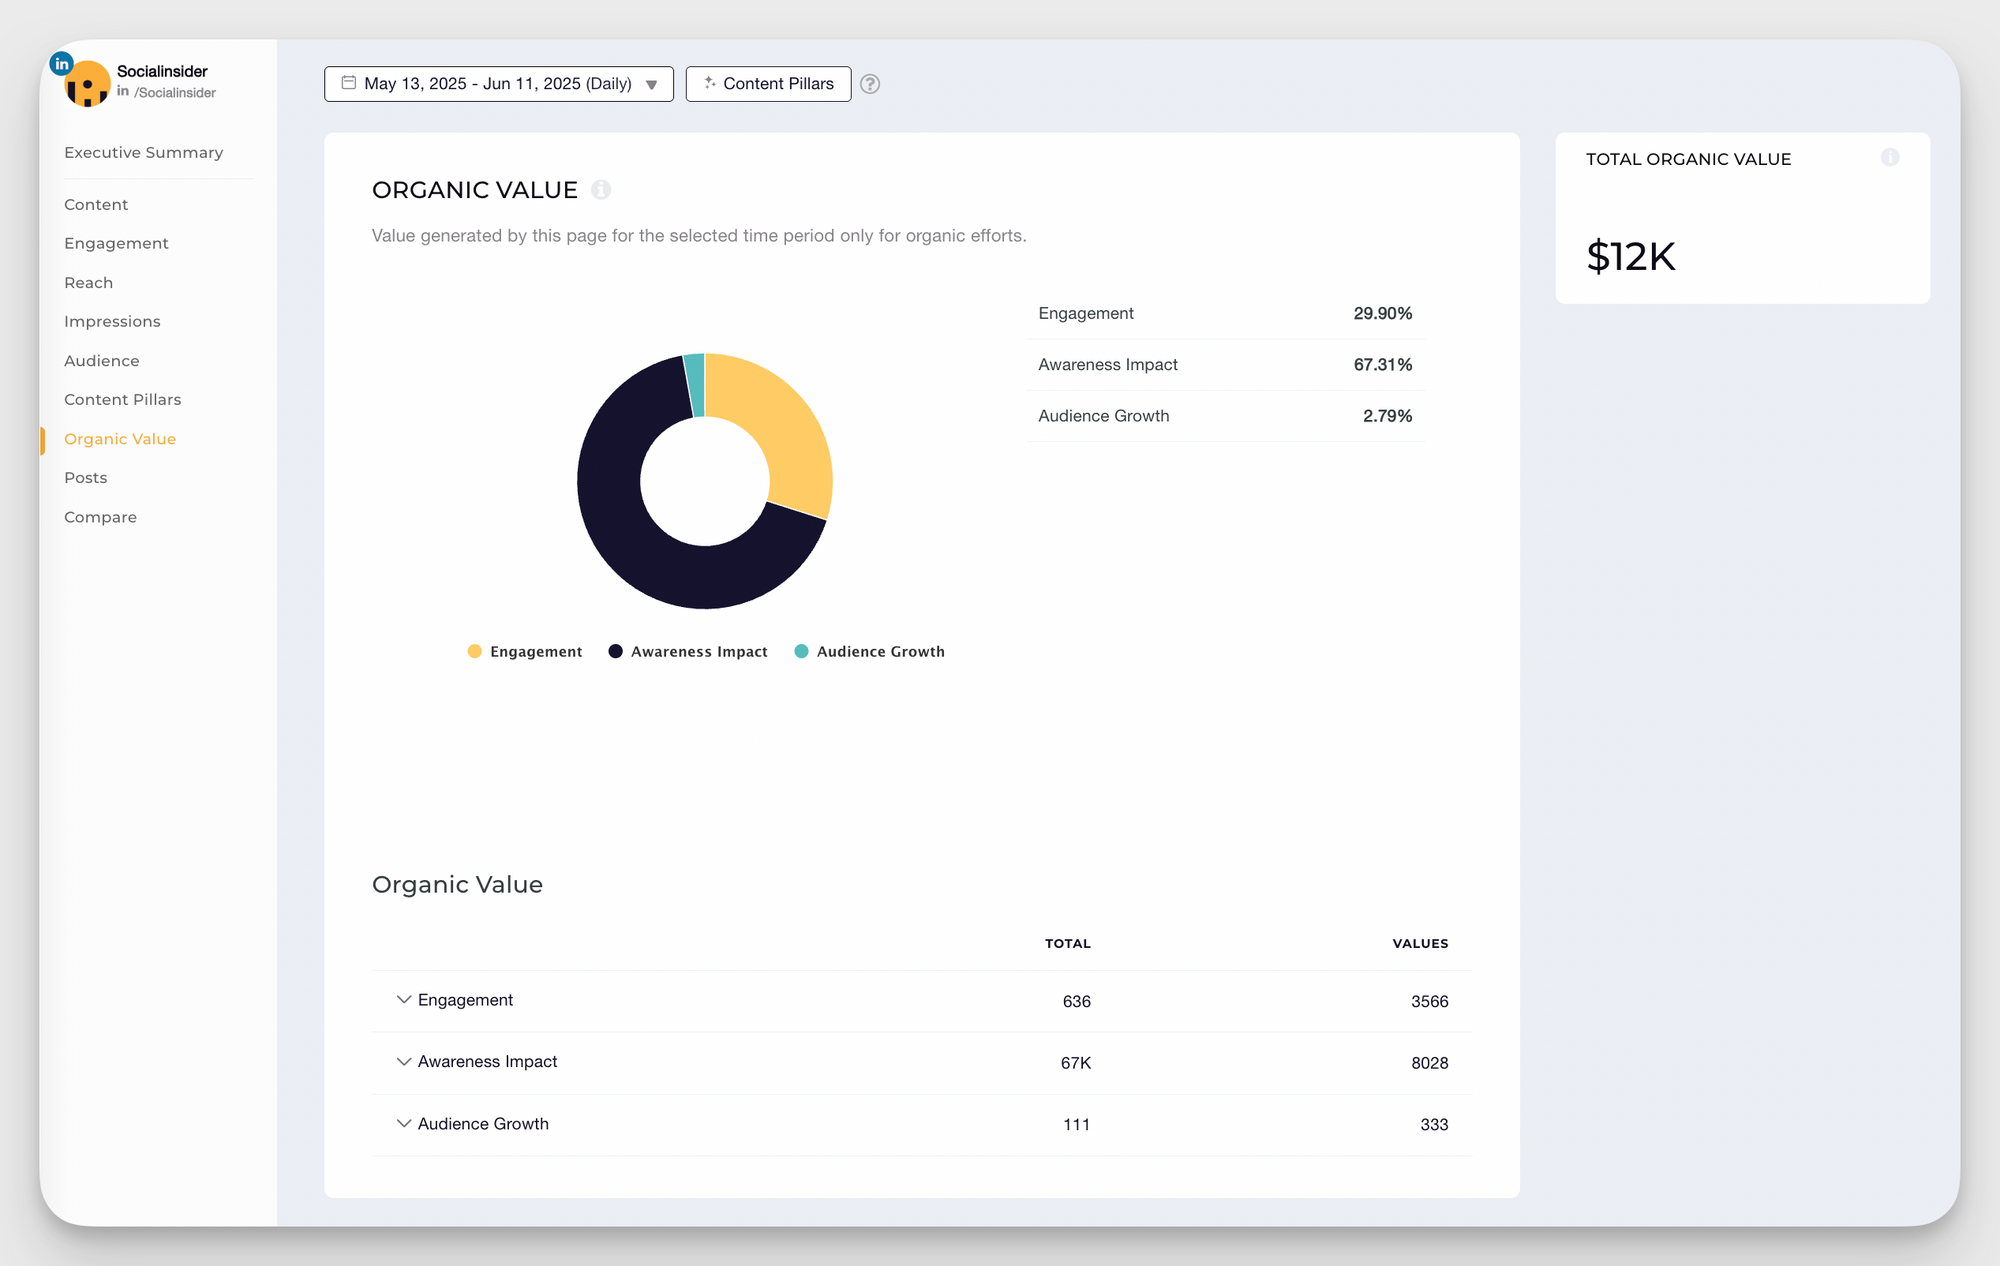
But what does it mean, more specifically?
Basically, it allows you to connect classic metrics such as follower growth and engagement to monetary results.
By assigning specific values to different results (based on your industry's benchmarks), you can now prove the value of organic social by showing how much paid advertising would cost to reach your numbers.
Here's a quick rundown of the process implied:
- Add a social profile to the Socialinsider dashboard.
- From Home, go to Settings and click on the Organic Value Configuration.
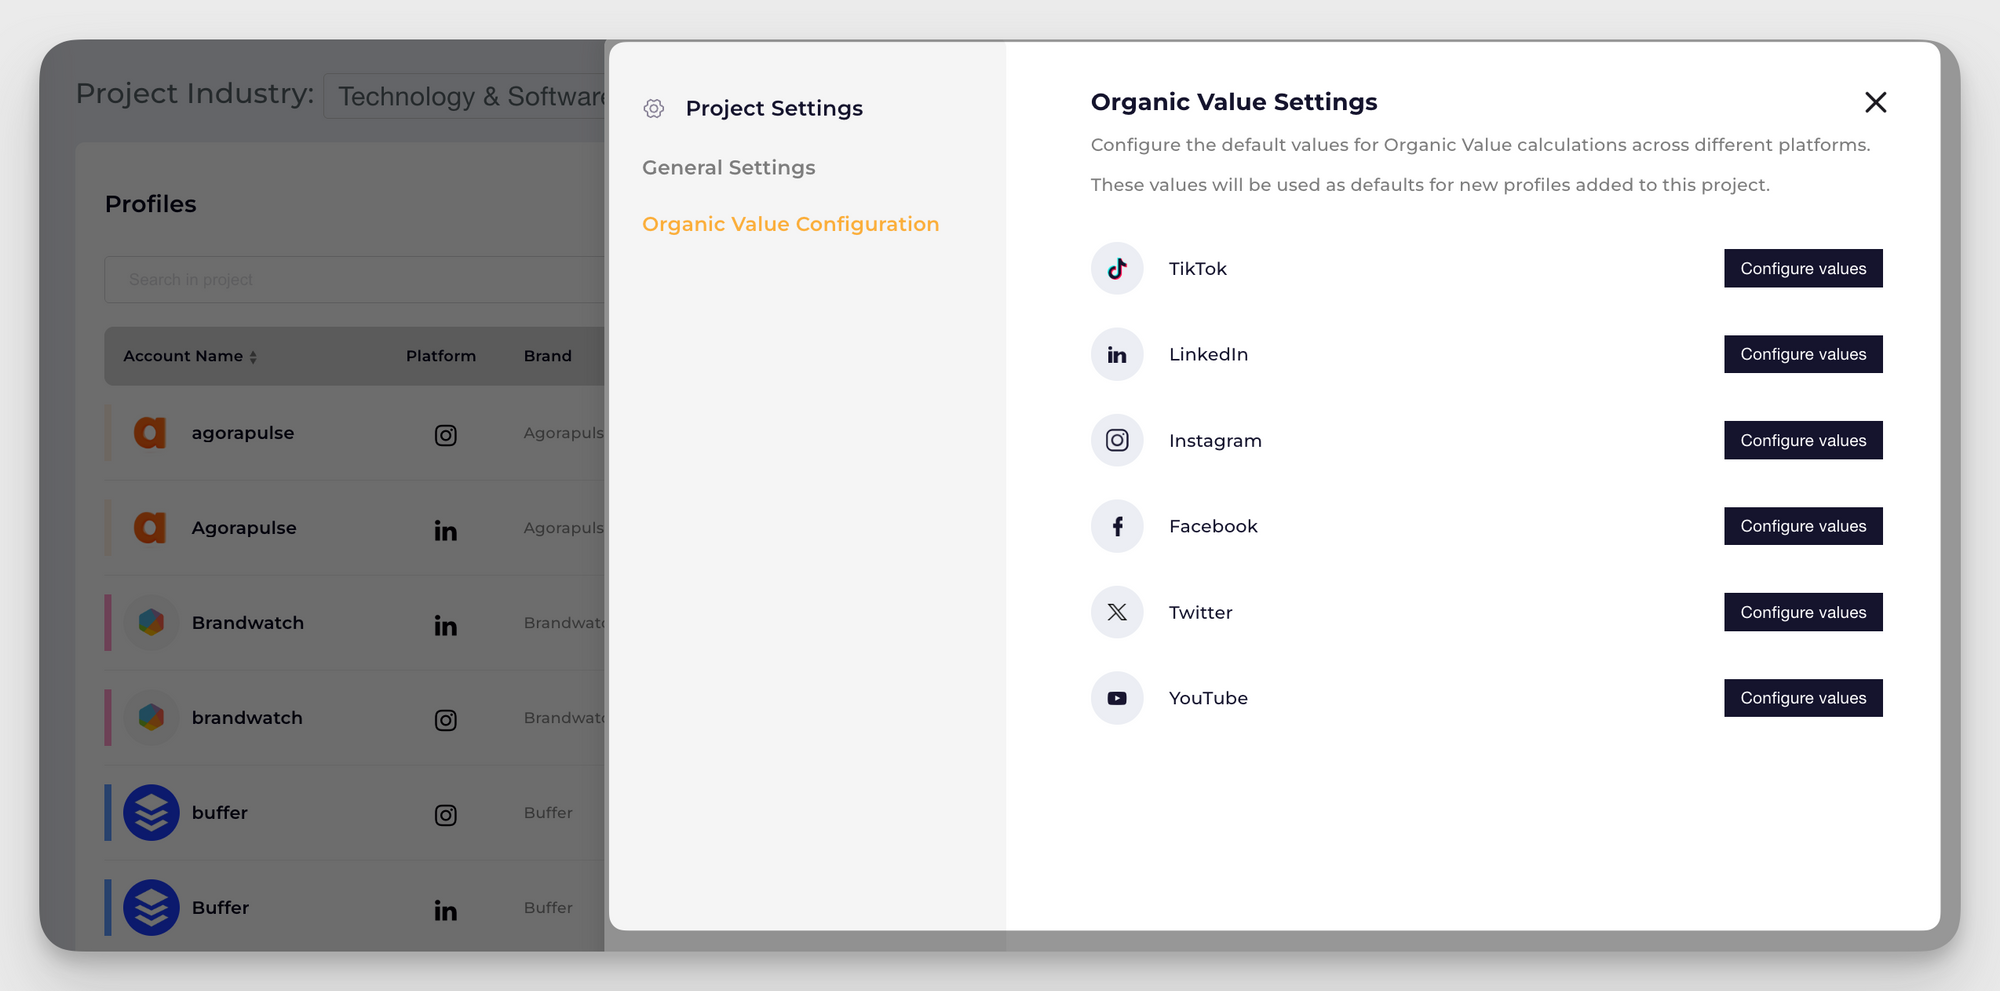
Then select the platform for which you want to calculate your organic value by clicking on the Configure Value button.
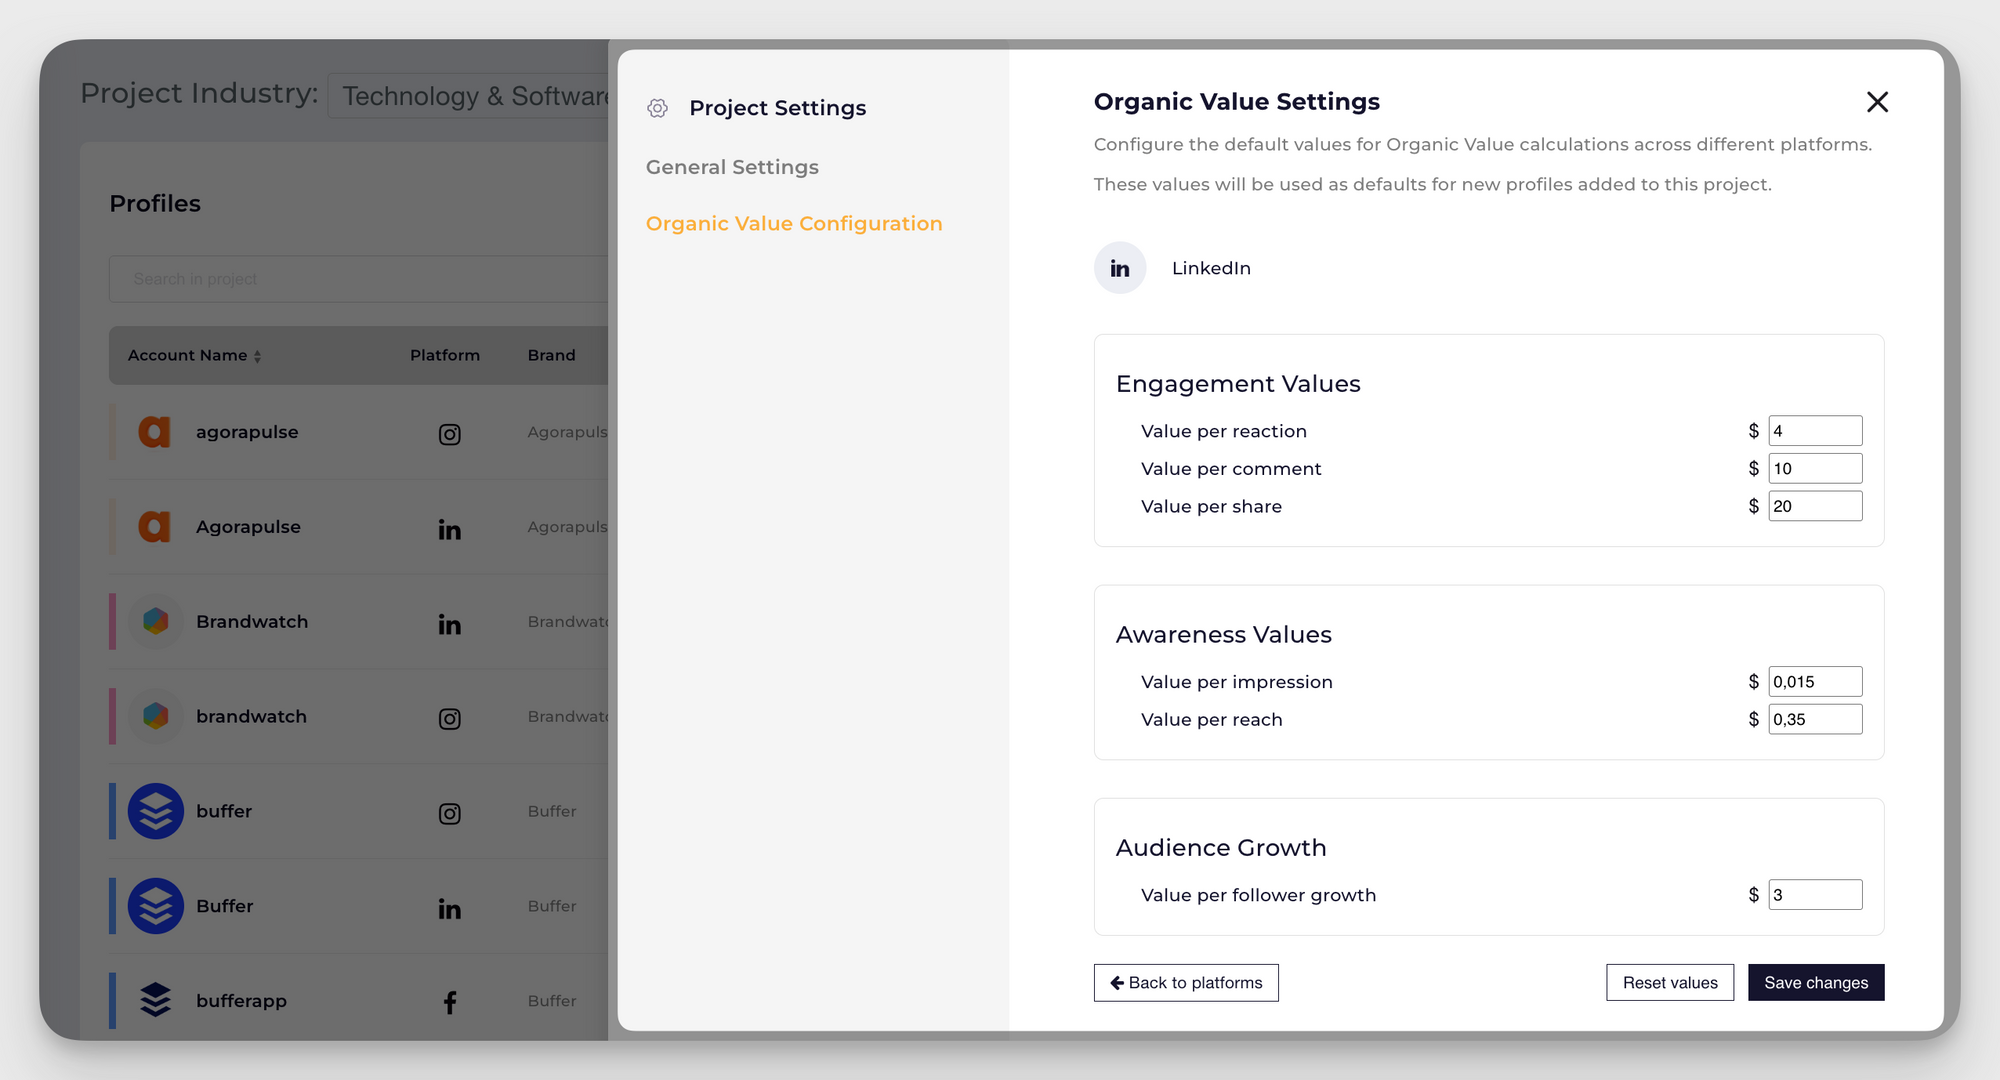
- Assign a specific value to each goal or metric.
- Next, from the left-sided menu, click on the social profile for which you want to see your numbers.
- Then, click on the Organic Value from the left-sided menu, and you'll see the organic data value for that specific channel.
What’s the impact of executive-level reporting within a business?
To keep it short, here's why effective executive reporting is so important:
- It drives strategic decisions: C-suite leaders don’t have time to sift through endless spreadsheets. They need focused insights. Executive reports deliver curated data that aligns with the business’s strategic goals — allowing leadership to prioritize, pivot, and plan ahead with confidence.
- It aligns team: When social and marketing teams build reports that connect their work to wider business outcomes, they bridge the gap between departments. Everyone — from product to sales to leadership — can rally around shared goals, backed by the same data.
- It supports social media budget decisions: One of the biggest challenges for social teams is justifying budgets. Executive reporting makes that case stronger by tying spend to results. When decision-makers see that a paid campaign drove sign-ups or that influencer content increased brand mentions by 40%, it’s easier to secure budget — not just to maintain performance, but to scale it.
Types of executive reports in a social-first organization
When reporting on social media performance, you shouldn’t just talk about how many likes and shares your posts received. You must connect social media metrics to business outcomes that matter to the leadership.
Here are the key types of executive reports that will keep your C-suite informed and your social strategy funded.
Integrated marketing performance reports
Instead of looking at social in isolation, integrated marketing performance reports connect the dots between your social media campaigns, email marketing, paid advertising, and content marketing efforts.
Your integrated report should include cross-channel attribution data, showing how social media influences the customer journey even when it's not the final touchpoint.
Social media ROI and attribution reports
These reports answer the burning question: "Is it worth investing in social media?" Social media ROI reports track revenue directly attributable to social media activities, from direct conversions to influenced sales.
Your ROI report should include metrics like cost per acquisition, lifetime value of social media-acquired customers, and revenue generated from direct social sales. Factor in both direct and indirect conversions, as many customers interact with your social content multiple times before making a purchase.
Also, include a breakdown of ROI by platform and content type. You might find that LinkedIn generates higher-value B2B leads while Instagram provides more volume at a lower cost per conversion.
Brand health and reputation monitoring
Brand health reports track how your audience perceives your company across social platforms. They monitor sentiment, share of voice, brand mentions, and reputation trends over time.
Track both direct mentions and indirect conversations about your products, services, or industry. Include metrics like net sentiment score, volume of brand mentions, and response time to customer inquiries.
This data helps leadership understand not just what people are saying about your brand, but how effectively you're managing your online reputation.
Customer experience and sentiment analysis
These reports focus on how customers feel about their interactions with your brand on social media. They track customer satisfaction, response times, resolution rates, and overall social media engagement quality.
Your customer experience report should include data from social media customer service interactions, user-generated content sentiment, and feedback from social media surveys or polls.
Competitive benchmarking reports
Competitive benchmarking reports compare your brand's social media performance against direct competitors and industry leaders.
These reports should include metrics like share of voice, engagement rates, follower growth, and content performance compared to key competitors. Track both direct and indirect competitors.
Including comparisons with industry leaders helps highlight best practices and opportunities for improvement. When you show that your engagement rate is 20% higher than your main competitor but 15% lower than the industry leader, it provides clear direction for goal-setting.
This is how we approach competitive analysis at SocialInsider: we create comprehensive dashboards that track multiple competitors across various metrics, giving a complete picture of the competitive environment.
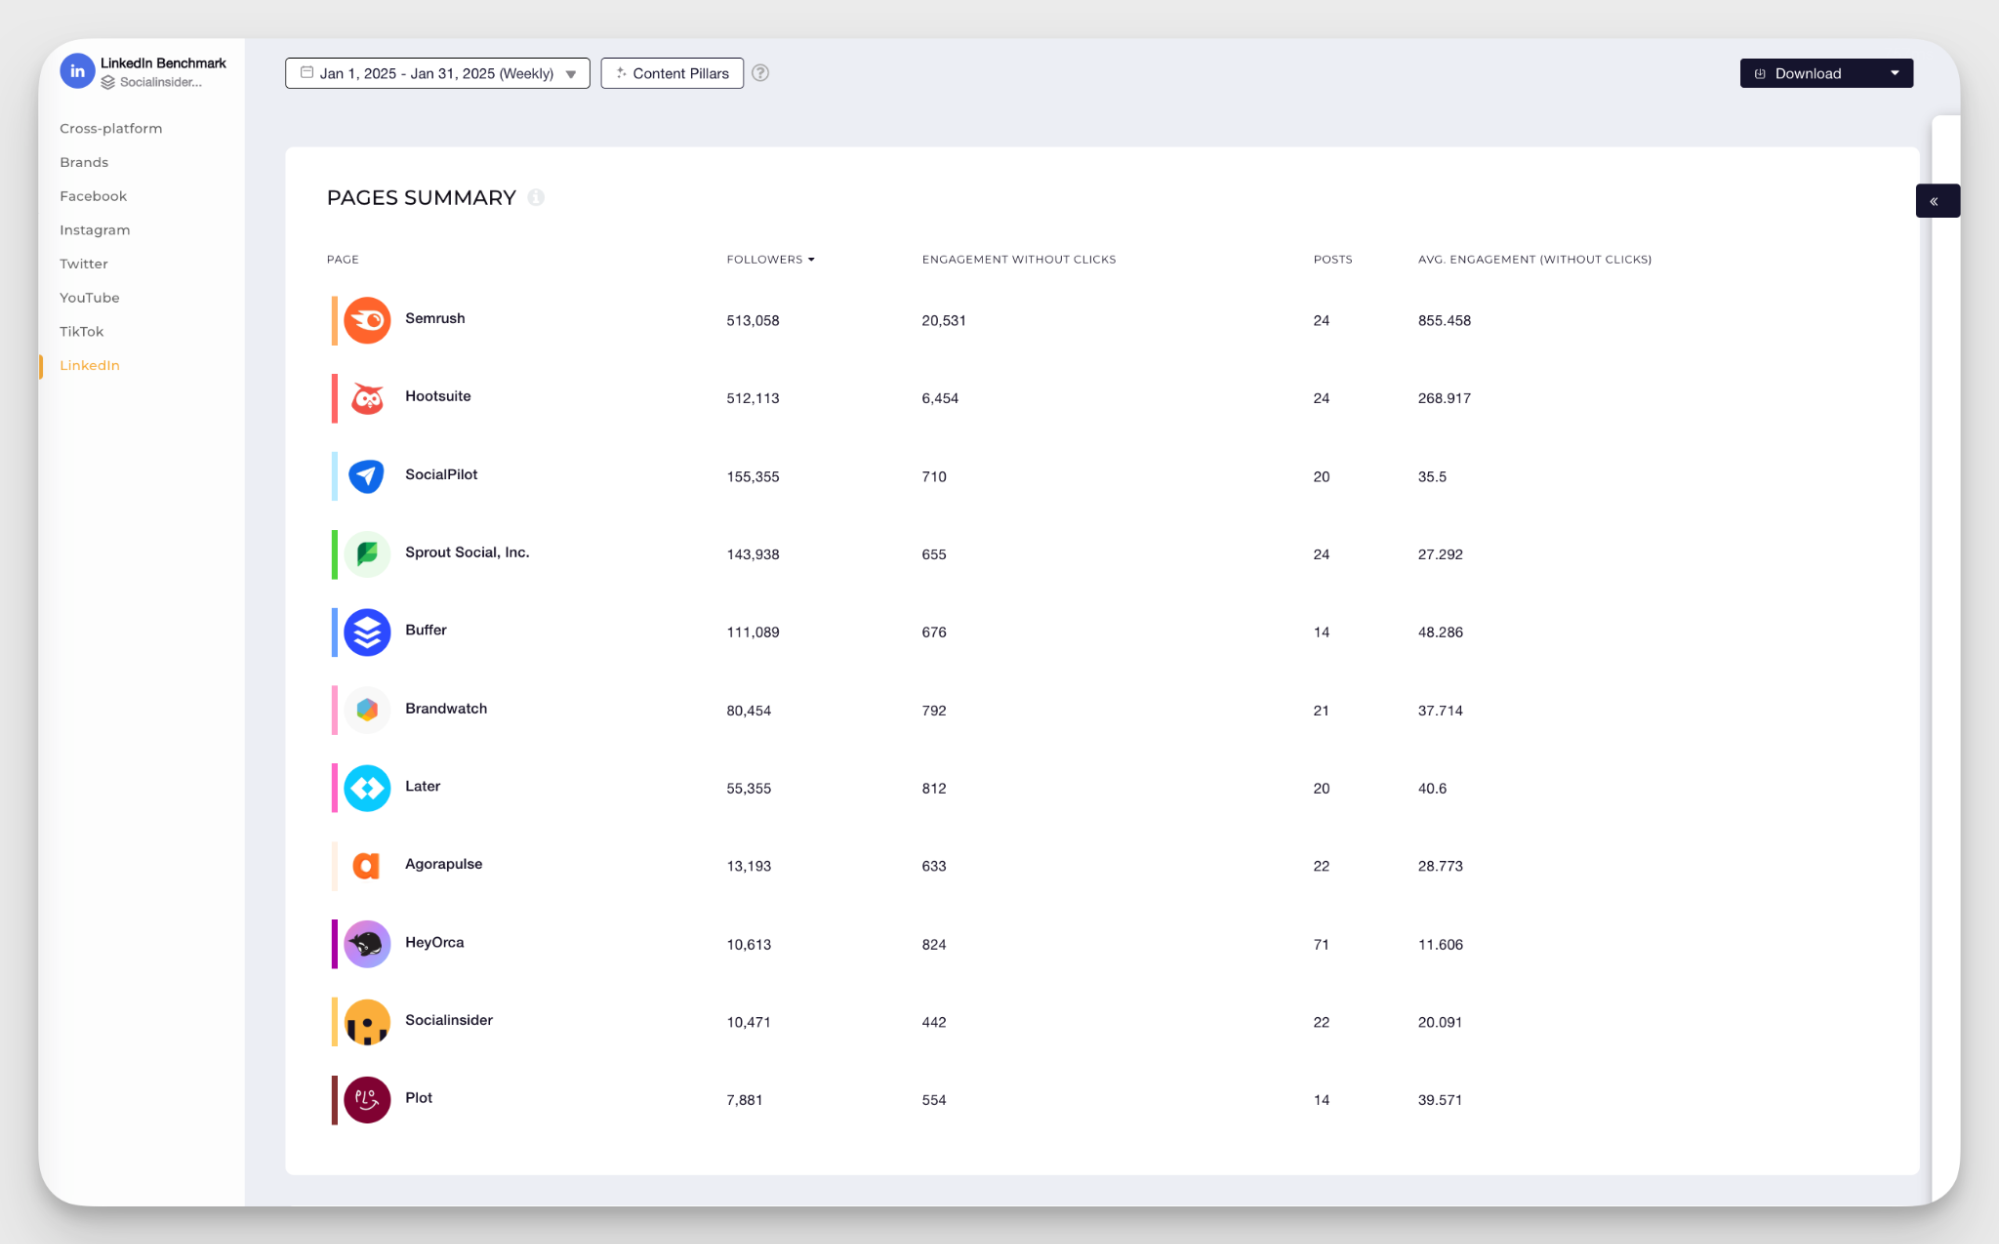
For example, we analyzed how Semrush's posts related to their Spotlight conference performed, breaking down engagement by content type, timing, and messaging.
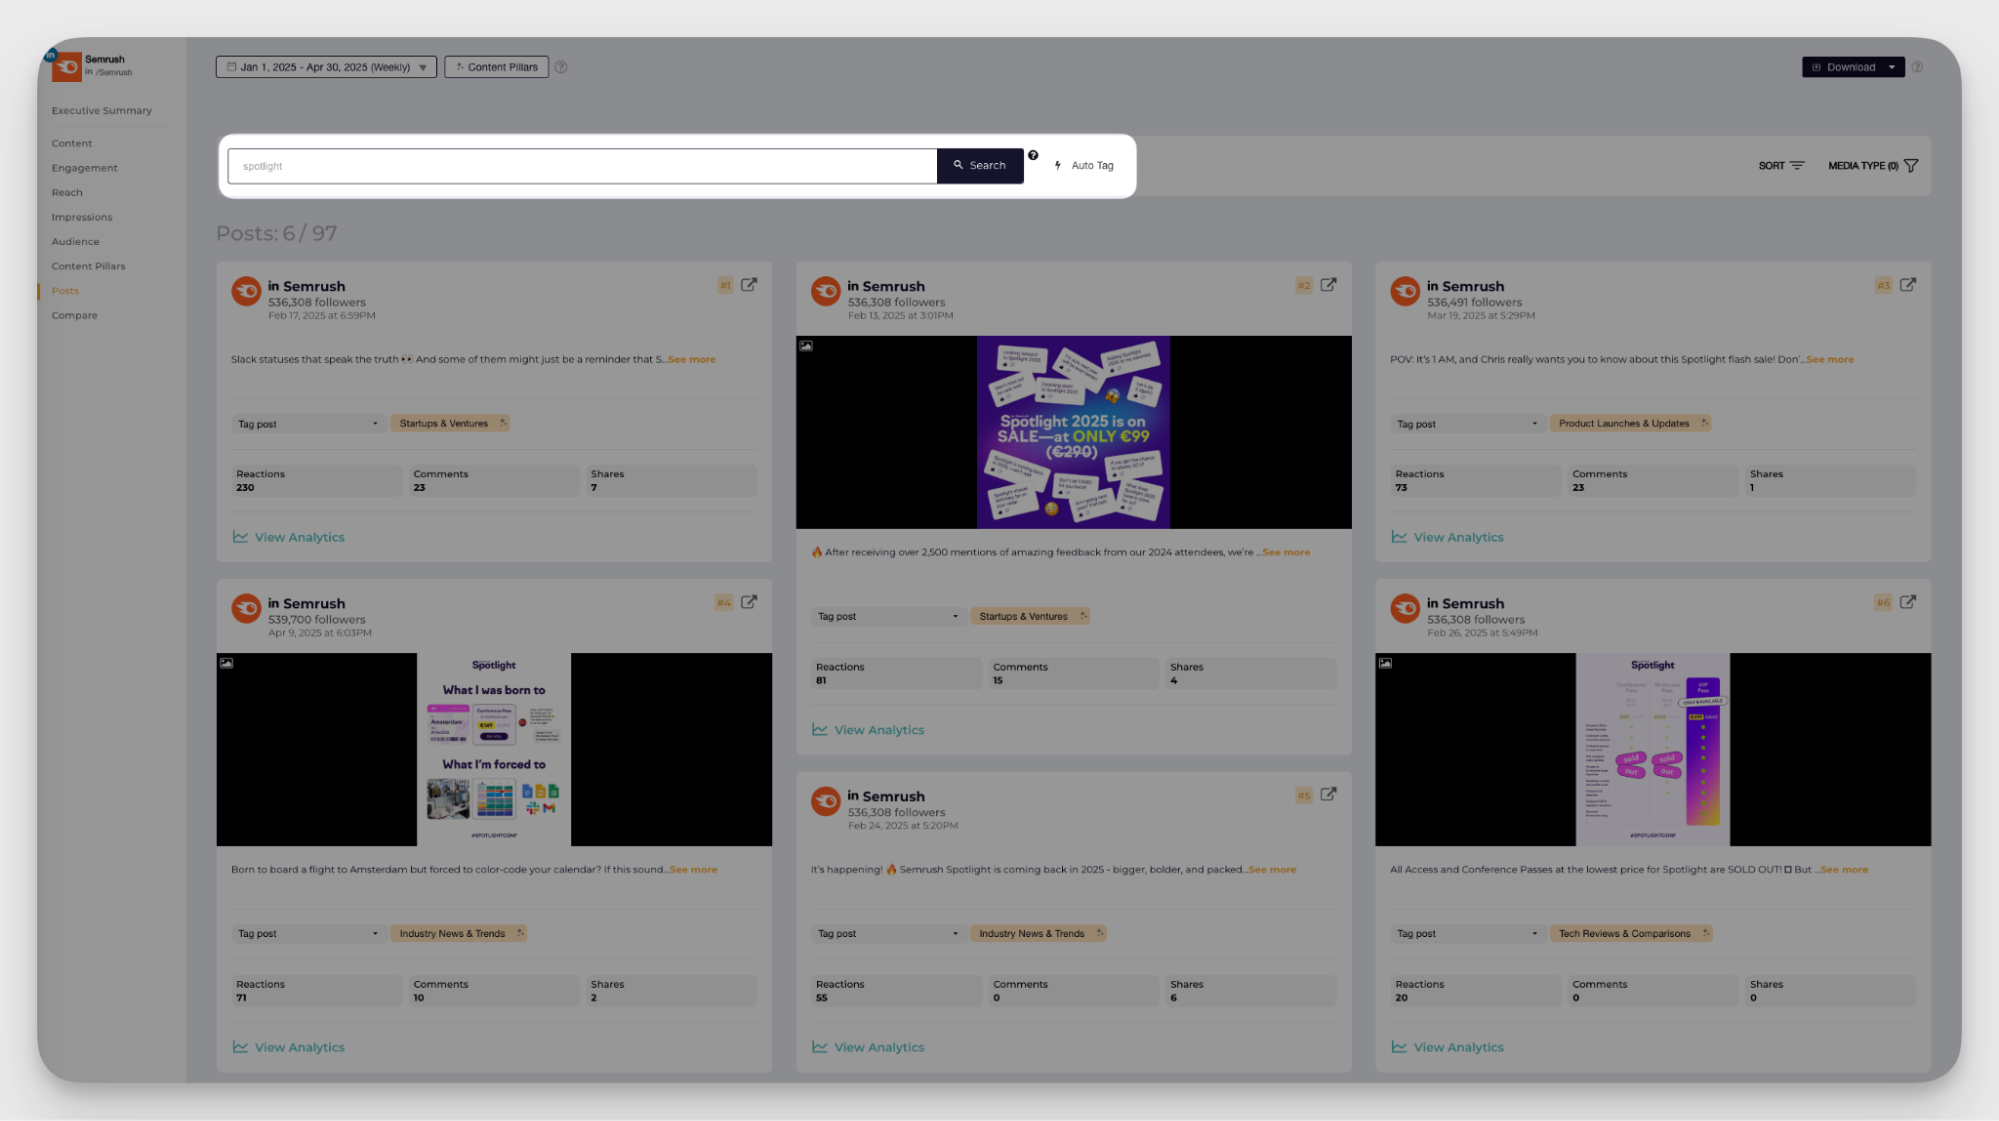
This granular analysis helps executives understand not just what worked, but why it worked and how to replicate success.
How to build an integrated executive reporting system?
Most organizations struggle with disconnected reporting systems where social media data lives in isolation from broader business intelligence. Start by auditing your current reporting structure to identify where the gaps exist.
Assess current gaps between social and business reporting
Look at what executives currently receive from other departments: sales reports, marketing performance dashboards, customer service metrics, and financial summaries. Then, examine your social media reports. Are you speaking the same language? Are you measuring against the same business objectives?
Common gaps include:
- misaligned timeframes (social reports monthly, business reports quarterly)
- different success definitions (engagement vs. revenue)
- isolated data sources that don't integrate with existing business intelligence tools
Your social media analyst should be working with the same KPIs that drive other marketing and business decisions.
The goal is to create a unified view where social media performance clearly contributes to broader business objectives rather than existing as a separate, disconnected activity.
Select metrics that connect social activities to business outcomes
Different business objectives require different measurement approaches, and your reporting should reflect this strategic thinking.
Awareness goals
Follower growth and social media reach are the primary indicators of whether your content is expanding your brand's visibility. Executives want to see follower growth because it directly correlates with market expansion and brand recognition.
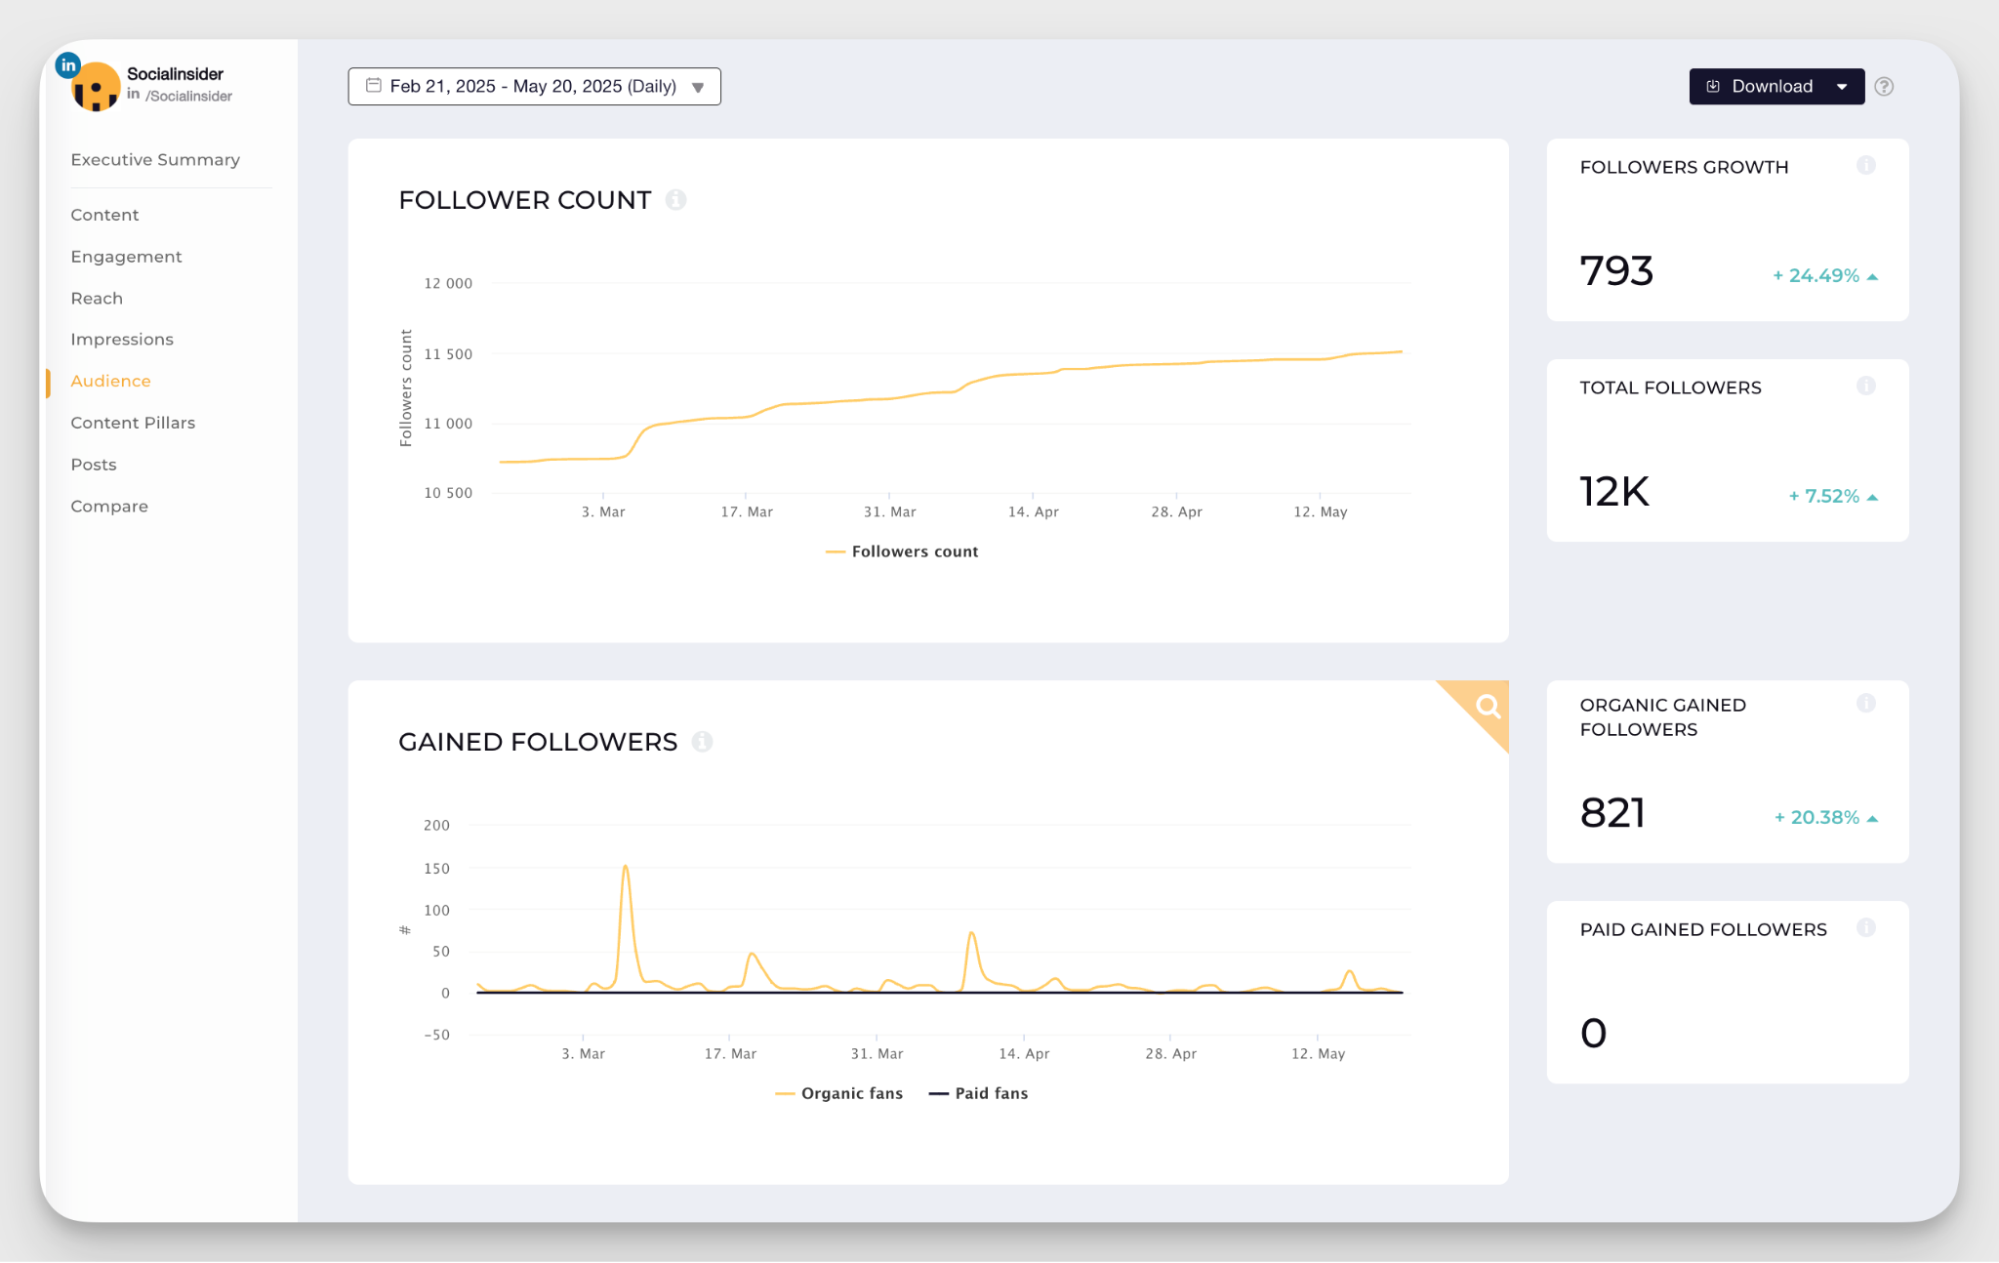
This type of visualization immediately shows executives whether your social strategy is expanding your addressable audience. The steady upward trend in follower count, combined with organic growth metrics, demonstrates that your content strategy is working without paid ads.
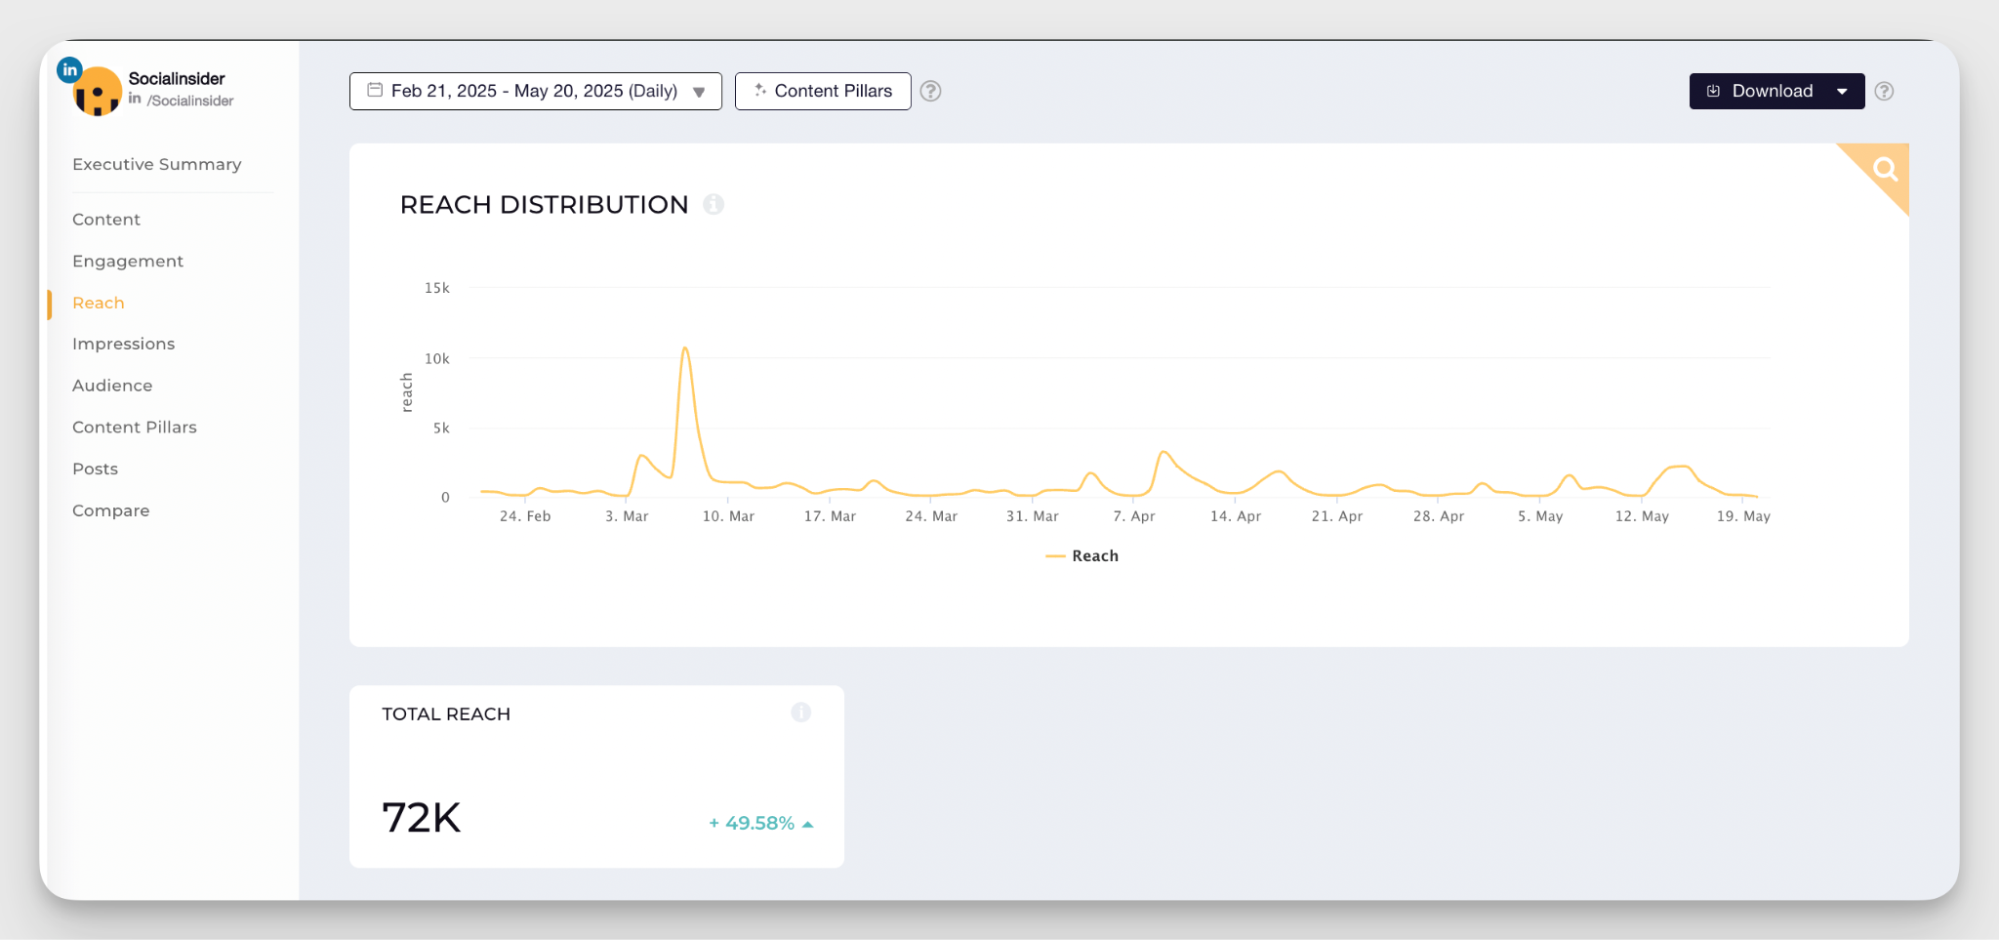
Reach distribution charts help executives understand when your content performs best and how consistently you're maintaining audience attention. The spikes indicate successful content or campaigns that generated above-average visibility.
Consideration goals
For consideration goals, engagement metrics become the primary focus. Tracking engagement rate, comments, and shares shows how deeply your content resonates with your audience.
These engagement metrics tell executives whether your content is starting conversations and generating the kind of interaction that moves prospects through the consideration phase.
The significant increases in both comments and shares indicate that your content strategy is successfully engaging your audience in meaningful ways.
Conversion goals
For conversion goals, track metrics that connect social activity to business results: website traffic from social media, lead generation, event sign-ups, and direct sales attribution.
These metrics require social media measurement tools that can track the customer journey from social interaction to business outcome.
Loyalty goals
For loyalty goals, monitor metrics that indicate long-term relationship building: customer reviews, brand mentions, user-generated content, and repeat engagement from existing customers.
These metrics show executives how social media contributes to customer retention and lifetime value.
Data integration challenges and solutions
The biggest challenge in executive reporting is connecting social media data with other business systems. Most social media analytics platforms don't natively integrate with CRM systems, sales databases, or business intelligence tools.
Common integration challenges include:
- Different data formats
- Mismatched customer identifiers
- Varying update frequencies
- Incompatible attribution models
For example, your social media platform might update hourly while your sales system updates daily, creating timing mismatches in your reports.
To solve this, establish consistent customer identifiers across systems. Use UTM parameters, unique promo codes, or dedicated landing pages. Implement marketing automation tools that can bridge the gap between social engagement and sales outcomes.
Tools that bridge social analytics with executive dashboards
The right tools can make the difference between time-consuming manual reporting and automated insights that update in real-time. Focus on platforms that can connect social media data with broader business intelligence systems.
Socialinsider
Socialinsider provides comprehensive social media insights that executives need, including competitive benchmarking, performance analysis, and AI-driven recommendations.
The platform's executive overview automatically highlights the metrics that matter most to leadership, saving time while ensuring nothing important gets missed.
Socialinsider's strength lies in its ability to provide context around your performance, not just showing that engagement increased, but explaining why it happened and what it means for your business objectives.
Moreover, the platform's advanced competitive intelligence features help executives understand performance relative to industry benchmarks.
If you’d like to see these features in action and start building beautiful and useful social media reports, start a 14-day free trial.
Looker Studio
Looker Studio is helpful for creating custom executive dashboards that combine social media data with other business metrics. You can build reports that show social media performance alongside website traffic, sales data, and customer acquisition costs.
You can create automated reports that update daily or weekly, ensuring executives always have current information without manual intervention.
Common pitfalls in social media executive reporting
Even experienced social media strategists can fall into traps that make their executive reports less effective. Below are common mistakes and how to avoid them.
Missing context in social performance evaluation
When you tell executives that engagement increased by 25%, that number is meaningless without understanding whether it's above or below industry benchmarks, how it compares to competitors, or what drove the change.
Context comes in several forms:
- Competitive context shows how your performance stacks up against other brands in your space.
- Historical context helps executives understand trends rather than isolated data points. A 15% drop in social media reach might seem alarming until you explain that it's part of a seasonal pattern or that it coincides with algorithm changes that affected all brands.
- Business context connects social media performance to broader company activities. If engagement spiked during a product launch week, that context helps executives understand the relationship between social media and business events.
- Campaign context explains why certain content performed differently than usual. If educational posts usually generate higher engagement than promotional content, but this month promotional posts outperformed everything else, executives need to understand what changed.
Missing context leads to misinterpretation and poor decision-making. Executives might cut budgets based on declining metrics that are actually industry-wide trends, or they might double down on tactics that only worked due to temporary conditions.
To avoid this, take the time to understand the different types of contexts yourself and translate them into actionable items in executive reports.
Over-reporting vs. strategic insight delivery
Avoid overwhelming executives with every metric. Instead, focus on data that drives decisions like budget, campaigns, or strategy.
Prioritize "so what?" metrics. If a number doesn't suggest an action or impact on business objectives, it's not needed.
Match reporting frequency and platform detail to their strategic importance. Not every metric needs to be reported at every meeting. Daily active users might be important for monthly reports, but irrelevant for quarterly business reviews. Match your reporting detail to the decision-making timeline.
As a general rule, focus on signals, not noise, in social media measurement. Report significant trends over minor fluctuations. Look for consistent patterns across time, platforms, or content.
Lead with insights, then support them with data. This helps executives quickly grasp what matters and what actions to take.
Final thoughts
Time to cut the fluff from executive social media reports. As we've shown above, successful reports are about showing business impact. Your goal is to provide leaders with clear, actionable insights at the right time.
If you're ready to make your reports genuinely useful, give Socialinsider a spin for free. The platform helps you link social performance to business goals, offering competitive insights in compelling dashboards and AI-driven analysis that executives will actually appreciate.
Sabina Varga
Content marketing expert with 15 years of experience in digital marketing. I dream of beach life but love the city as a multitasking mom juggling playgrounds, books, brunches, and travels.

Analyze your competitors in seconds
Track & analyze your competitors and get top social media metrics and more!
You might also like


Improve your social media strategy with Socialinsider!
Use in-depth data to measure your social accounts’ performance, analyze competitors, and gain insights to improve your strategy.