[What Data Says] Social Media Reach Has a 12% YoY Decrease on Instagram
Why is social media reach on a downward slope? Check out this study to see what our data says about reach on social media.

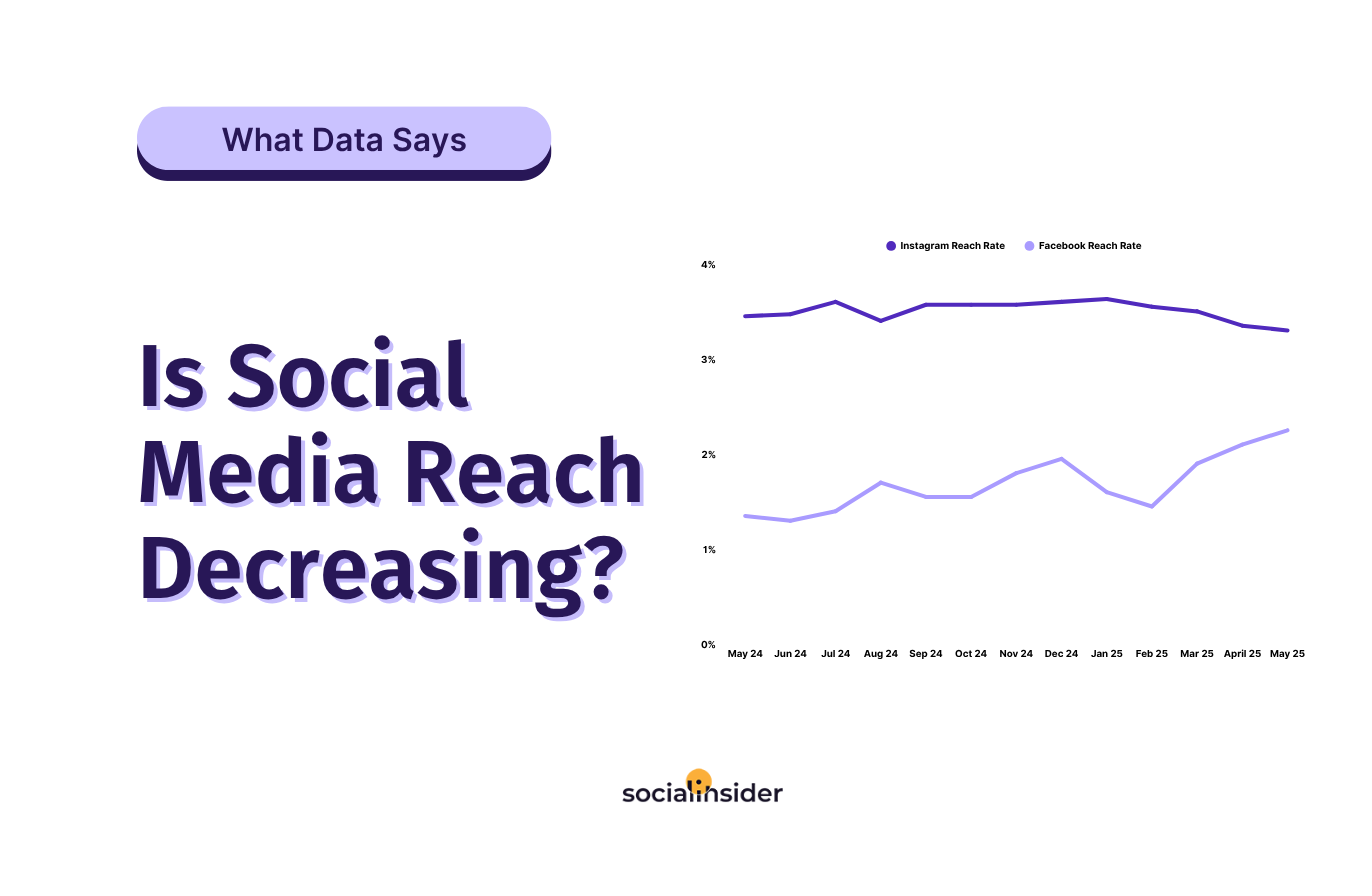
With many businesses relying on Instagram to drive sales and revenue, what happens when the algorithm shifts and your posts no longer reach the audience they once did?
This shift highlights the importance of understanding key social media metrics and trends, such as social media reach and engagement rate by reach fluctuations, in order to effectively evaluate your strategy's results and establish future goals.
In this study, we're going to be looking at the average reach rate in 2025 and beyond, offering a data-driven look at how reach on social media is changing, and what it means for brands moving forward.
Executive summary
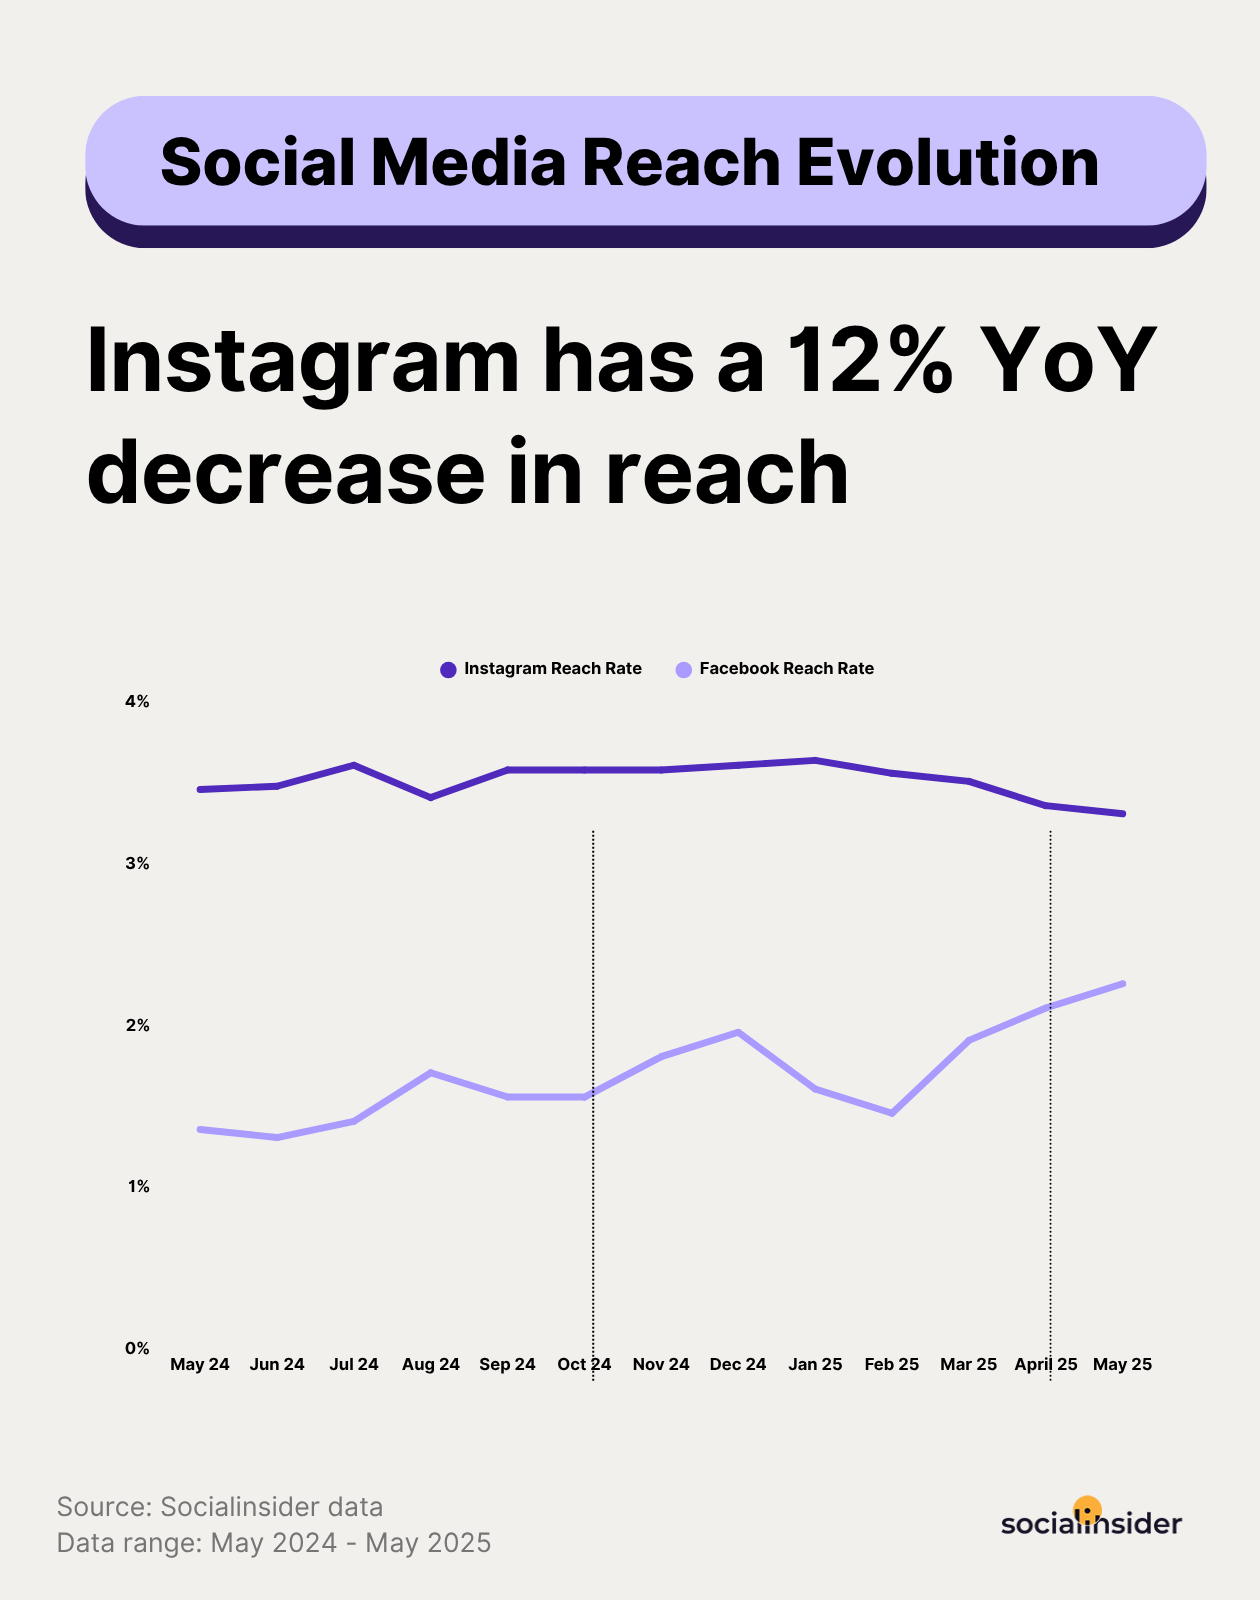
- Instagram has a 12% YoY decrease in reach, and at the moment has an average reach rate of 3.50%.
- Instagram scores a double reach rate compared to Facebook.
- Facebook has an average reach rate of 1.20%.
What is social media reach?
Social media reach represents the total number of unique users who have been exposed to a piece of content, post, or advertisement on a social media channel within a selected timeframe.
The reach metric indicates how aware people are of your brand. Unlike followers or impressions, it gives you a more accurate count of the people you've impacted and helps you estimate the potential size of your audience.
Why is social media reach important?
By tracking social media reach, you can, for instance, see just how effective your campaigns are in real-time and make any necessary adjustments before it's too late.
Besides social media campaign measurement, reach can also provide some useful information about:
- The real number of active followers
- The impact of your partnerships with influencers and other brands
- The interest generated around your online events and launches
Compared to other metrics (such as impressions), reach paints a more realistic picture of your content's performance because it counts each person only once, regardless of how many times they've seen your content.
How to calculate social media reach?
Calculating social media reach can be tricky, considering that this metric only takes into account unique users who were exposed to your content.
One thing to keep in mind is that social media reach data will always be an estimate - regardless of the third-party analytics app you're using. For maximum accuracy, our recommendation is that you turn to native analytics dashboards (Meta, LinkedIn, X/Twitter, YouTube, TikTok).
Social media reach is one of the most important content KPIs, especially relevant for measuring brand awareness. As a result, reach is one of the go-to social media managers’ metrics analyzed for this business objective.
Is social media reach decreasing?
Over the last couple of years, several social media studies have emphasized Instagram’s superiority in performance compared to Facebook.
Whether for its increased reach, engagement rate, and many other KPIs, Instagram has proven to be the better choice for marketing purposes.
But while it is true that Instagram generates a higher reach compared to Facebook, it also registers a 12% YoY decrease.
Jumping to the numbers now - in 2025, Instagram has a reach rate of 3.50% on average, while Facebook scores a 1.65% average reach rate.
For more up-to-date Instagram insights on a variety of metrics, you can check our latest benchmarks data for Instagram.
Engagement by reach stats for 2025
The final result is to be multiplied by 100 to get a percentage.
With reach representing the total number of unique viewers a social post gained, engagement by reach displays how many interactions a post has gathered from those viewers.
Since a brand's social posts are usually seen only by a part of its total social media followers, the engagement rate by reach is considered a more accurate and insightful way of getting engagement data.
Compared to the engagement rate by followers, engagement by reach is frequently the preferred formula when measuring social media engagement.
That’s because this measurement version shows how relevant a piece of content was for those users who have actually seen it.
Most of the time, the people reached make for a smaller base than the total follower base.
With fewer users taken into account as a reference, in this situation, there will be significant variations in numbers when calculating engagement by both followers and reach.
Moreover, regardless of how marketers may look at engagement, according to data, one thing is clear - Instagram records higher engagement rates than Facebook.
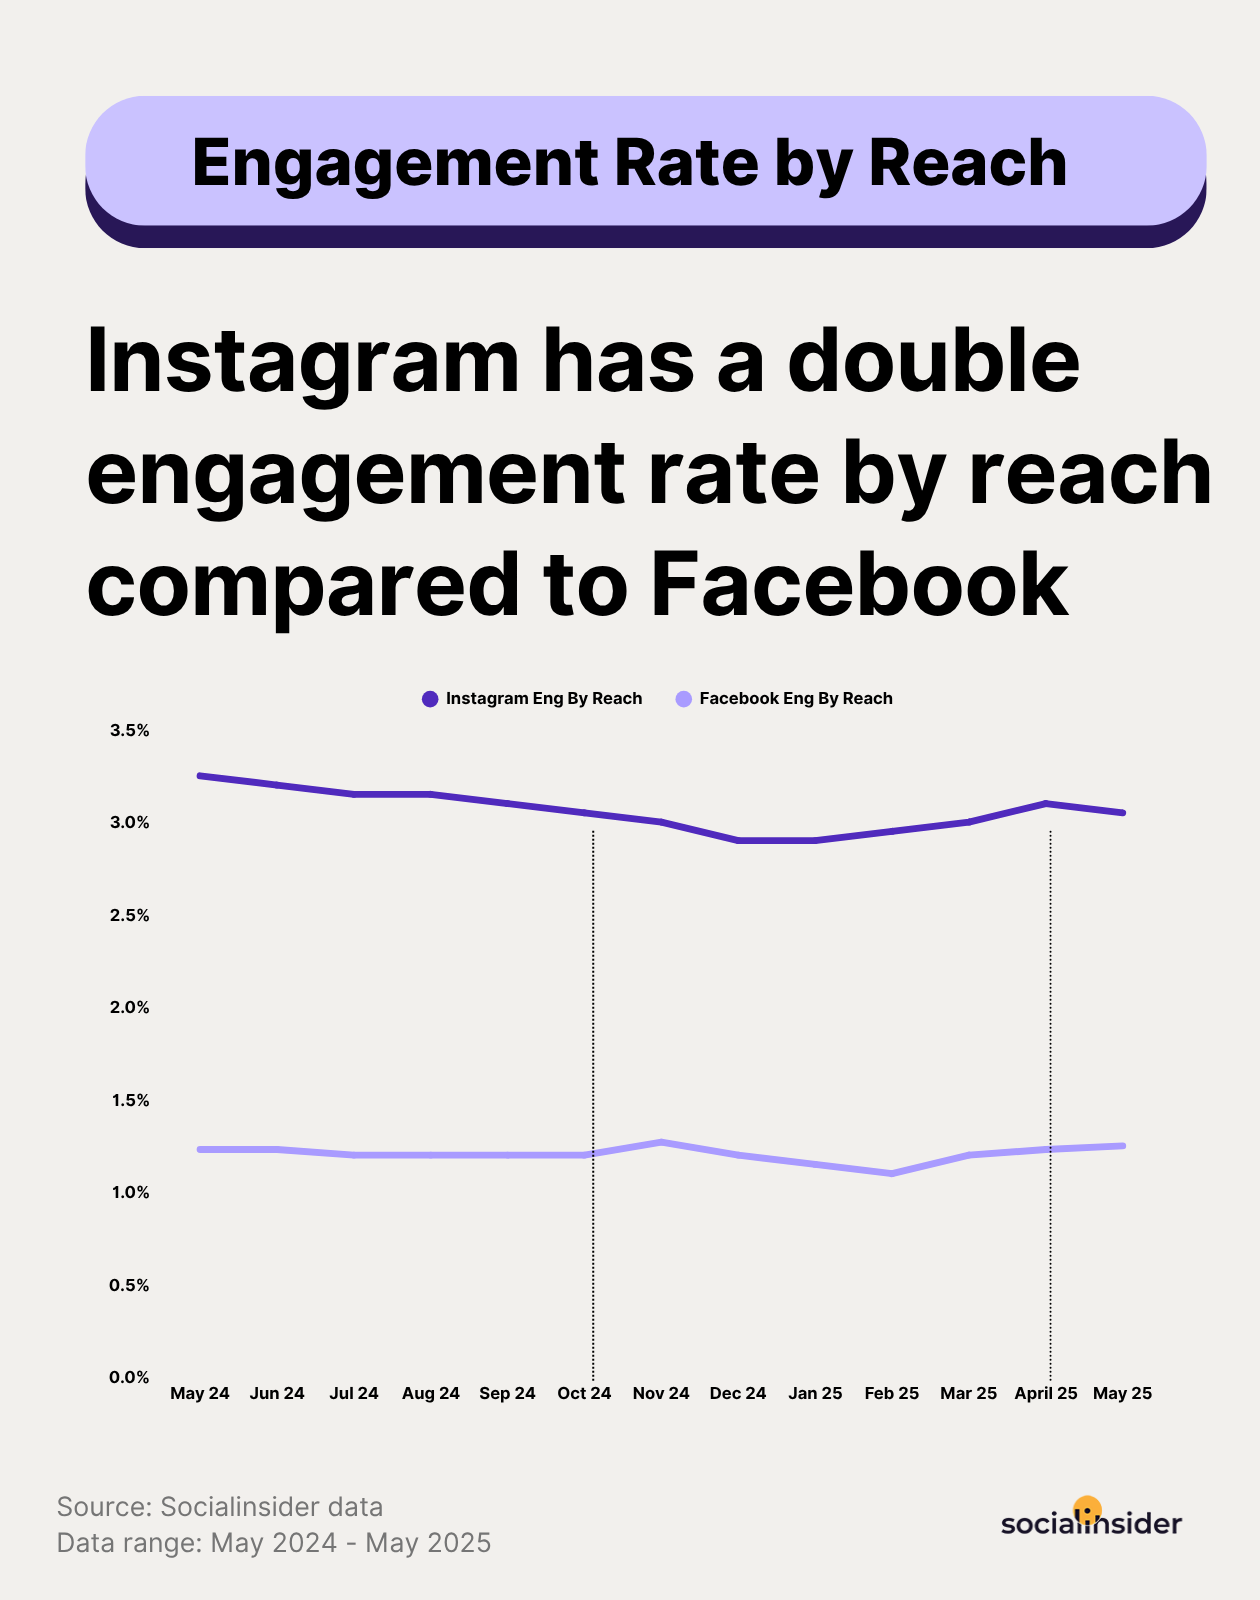
In 2025, Instagram gets an engagement rate by reach of 3.00% on average, while Facebook engagement rate by reach records average values that go up to a maximum of only 1.20%.
NOTE: The findings of this study are based on the analysis of Facebook and Instagram social media posts published between May 2024 - May 2025.
Other social media platforms were not included in this research, as some have different ways of calculating engagement, while others do not offer reach data.
4 Tips on how to increase social media reach
Boosting your social media reach requires a combination of strategy and creativity. Here are a few proven methods that can help expand your audience and improve engagement.
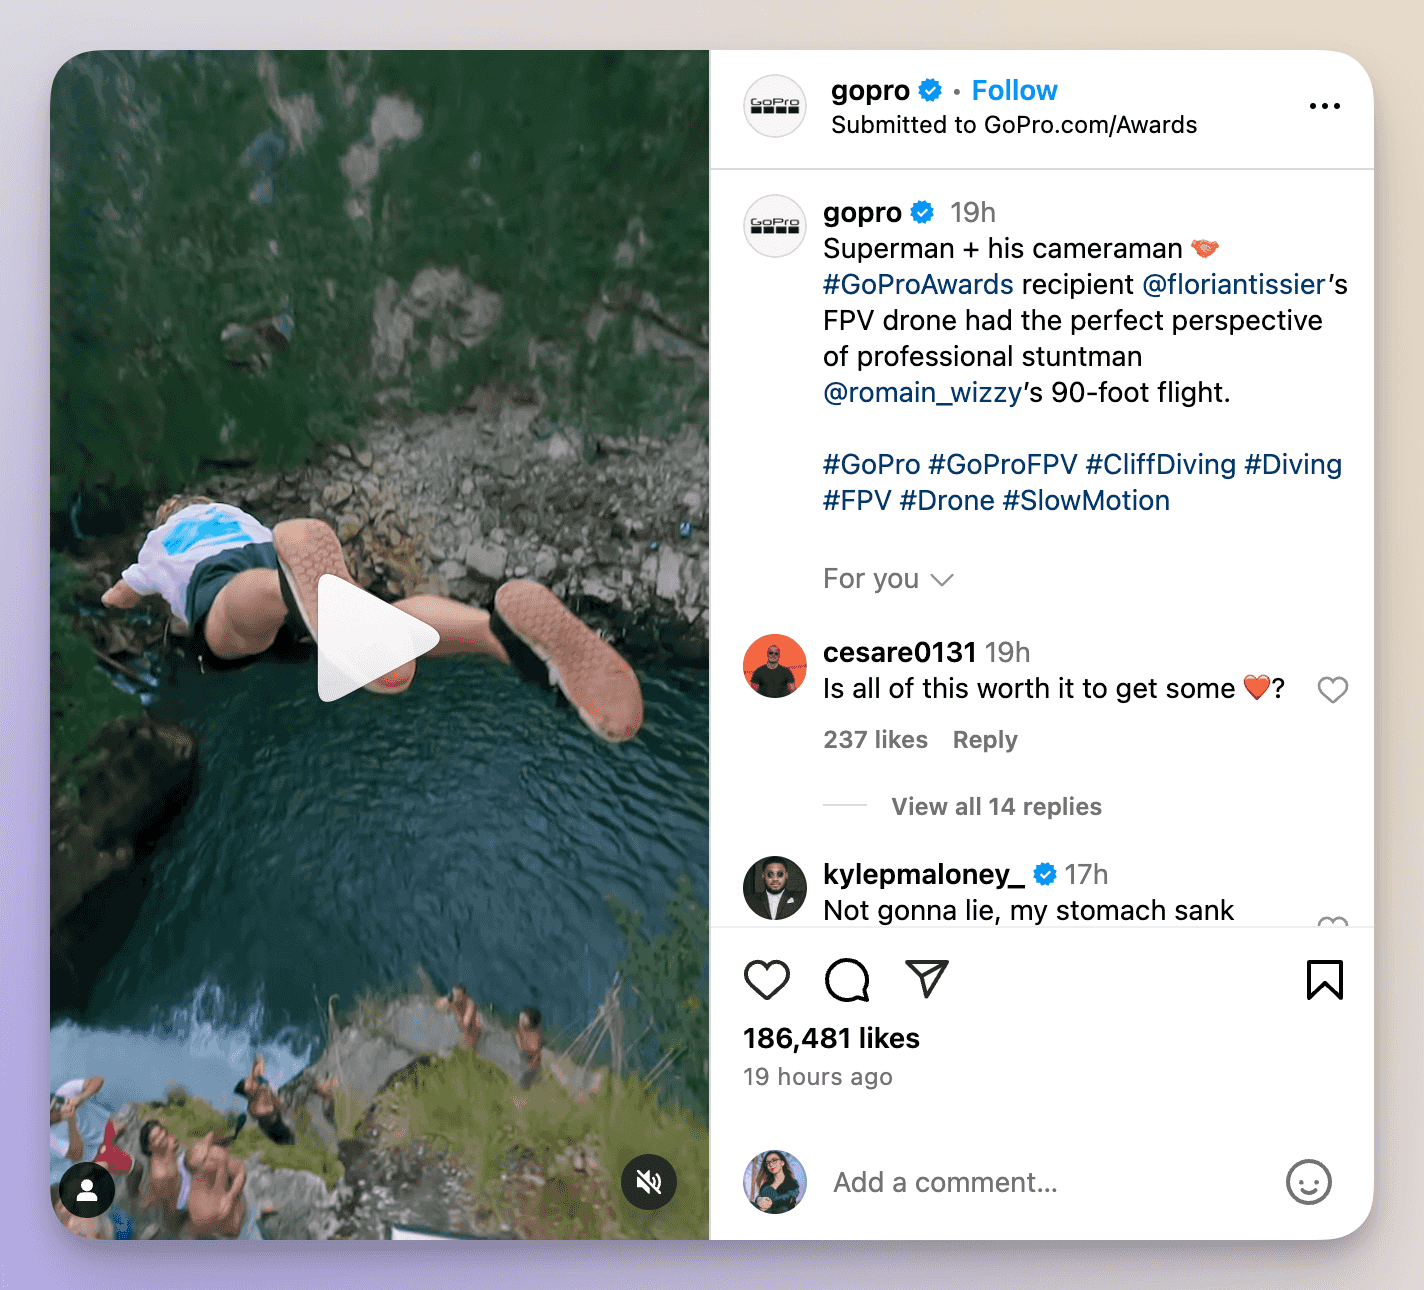
Feature UGC (user-generated content)
One of the most effective ways to increase your social media reach is by featuring user-generated content (UGC). This tactic not only builds trust but also encourages more engagement, which boosts reach further. When users see real customers using and endorsing your products, they’re more likely to engage with your posts and share them with their networks.
Understanding how to measure reach in these cases is crucial, as it helps track the impact of UGC on your brand’s visibility.
For example, GoPro regularly shares content created by their users, showcasing stunning footage captured with their products. This strategy has helped them grow a massive, engaged community and increase their reach organically.
Leverage influencer partnerships
Partnering with influencers is a proven way to tap into new audiences and increase your social media reach. Influencers can introduce your brand to their loyal followers, driving engagement and expanding your visibility.
To fully understand the impact of these partnerships, it’s important to measure reach effectively, allowing you to track how far your content is extending.
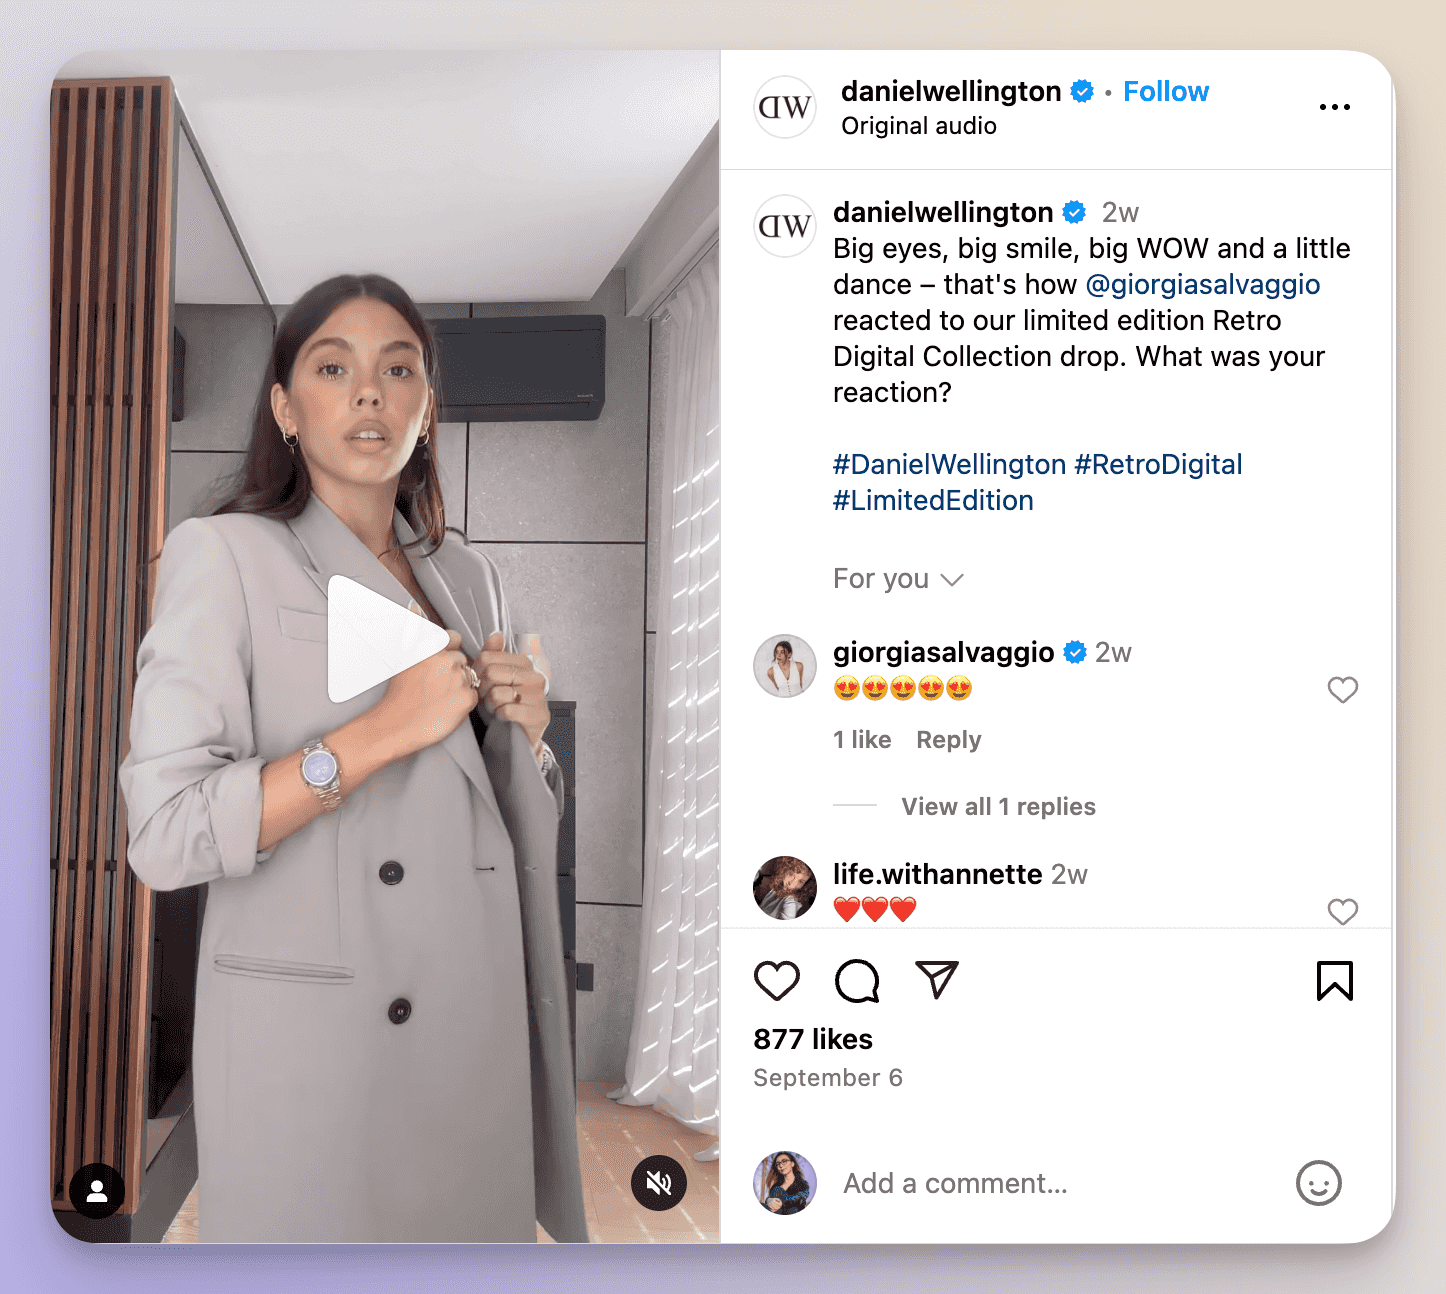
For example, Daniel Wellington, the watch brand, successfully leveraged influencer marketing to grow their reach. By gifting influencers their products and encouraging them to share photos with their followers, the brand quickly gained visibility and boosted sales.
Post at optimal hours
Timing plays a critical role in increasing your social media reach. Posting when your audience is most active ensures higher engagement, which signals to the platform’s algorithm to push your content to more people.
To optimize this strategy, using reach measurement tools can help track when your audience is most engaged and refine your posting schedule accordingly.F
For example, BuzzFeed has perfected the art of posting at optimal times across different platforms. By tracking their audience’s behavior and engagement patterns, they ensure their posts go live when they’ll get the most interaction, ultimately boosting their reach.
Have a strong Instagram SEO strategy
A strong Instagram SEO strategy can significantly improve your reach. By optimizing your profile, captions, and hashtags for relevant keywords, you can ensure your content gets discovered by users searching for specific topics.
For example, Fenty Beauty uses Instagram SEO strategically by incorporating relevant hashtags and keywords into their posts, making it easier for new audiences to discover their content. This has helped the brand grow its reach by appearing in more searches and on Instagram's Explore page, allowing it to tap into new markets and customer segments.

Conclusion
As social media reach continues to decline across platforms, brands must adapt with innovative strategies to stay relevant. The shift in organic reach, especially on Instagram, underscores the need for authentic engagement through influencer marketing and user-generated content.
Understanding reach trends and fine-tuning tactics will be critical for sustained social media success in 2024 and beyond.
By focusing on metrics beyond surface-level, such as engagement by reach brands can better evaluate their strategy's effectiveness in achieving the social media goals established and optimize base on their community's preferences.
FAQs about Social Media Reach
1. What is a good social media reach?
For brands with large audiences, a good reach for Instagram would be around 8% for an Instagram post and 1% for an Instagram Story. As for Facebook, a good reach would be around 6%.
2. What is social media reach and engagement?
Social media reach is sometimes calculated using engagement, and it is in fact a more accurate way of looking at engagement data.
Elena Cucu
Content & SEO Manager @ Socialinsider with 8 years of experience in marketing. I like to describe myself as a social butterfly with a curious mind, passionate about dancing and psychology.

Know what your competitors do — before your manager asks
Get instant social benchmarks & reports without manual work.