Competitive Benchmarking: Strategic Guide For Social Media Teams
Here's a competitive benchmarking framework, covering data and expert tips for better content creation and strategic channel decisions.


Are you tracking competitors, but are disappointed to see the data sit in spreadsheets nobody reads? That happens when reports are descriptive, but not prescriptive. Or when comparisons are either too limited or too broad.
Stakeholders want context and clear action points around the most important competitive metrics. In this article, I’ll walk you through how to run social media competitor analysis that shapes content, channel choices, and budget and share with you some insights that Yainire Martínez social & influencer creative manager at LLYC, share with me recently.
Key takeaways
-
What's the relevance of competitive benchmarks for social media leaders, brand strategists, and CMOs?: Competitive benchmarking helps leaders replace assumptions with evidence, enabling smarter decisions on channel strategy, brand positioning, and marketing performance relative to the market.
-
What does a benchmarking process look like? Six steps: define your scope, collect and curate the data, identify where you lead and lag, translate findings into actions, report to stakeholders, and set a regular cadence. Choose the right tools for each step to avoid errors and achieve real depth.
-
What are the most important metrics to consider when doing competitive benchmarking? The most important competitive benchmarking metrics fall into three tiers: strategic metrics (share of voice, engagement rate, audience growth), tactical metrics (posting frequency, content format mix, engagement by post type), and diagnostic metrics (sentiment analysis, content pillar performance, and top-performing content), which together explain not only what competitors are achieving but also why they're succeeding.
What is competitive benchmarking and how should teams approach it to be effective?
Competitive benchmarking involves measuring your brand's performance against direct competitors to identify gaps and opportunities to inform strategic decisions. It's less about copying what others do and more about understanding where you stand in your category.
Competition benchmarking should be a repeatable process: define who you're comparing yourself against, decide which metrics to measure, collect data consistently, and turn findings into concrete actions. Tools like Socialinsider are used to pull this kind of competitive insights data together in one place, so teams aren't spending hours manually tracking what each competitor posts and how it performs.
A few quick best practices for effective benchmarking:
- Pick competitors that matter, not just the obvious ones.
- Match social media metrics to goals.
- Look at lasting trends, not just snapshots.
- Understand the context around the numbers.
Relevance of competitive benchmarks for social media leaders, brand strategists, and CMOs
Competitive benchmarks give different roles different kinds of leverage by replacing guesswork with evidence. Here's what that looks like in practice across the business:
- Social media leaders use benchmarks to answer questions like: Is our engagement rate strong for the category? Is posting frequency optimal? Which formats are working for similar brands? Which platforms are our competitors successfully using that we are ignoring?
- Brand strategists rely on benchmarking against competitors to spot positioning gaps: topics nobody owns, audiences underserved, and fresh angles. A structured content competitor analysis often reveals opportunities that creative brainstorms miss.
- CMOs use insights to shape the marketing strategy. Aim for concision and context: "We grew engagement 11% last year" is weaker than "We grew engagement 11% while the category average grew 6%, due to our focus on short video content with curiosity hooks."
Competitive benchmarking vs. internal benchmarking vs. industry benchmarking: key distinctions
The three types of benchmarking answer different questions. Let’s see how they differ and when each one matters:
- Competitive benchmarking compares your performance to specific competitors. You pick a handful of brands (usually 3 to 10) that compete with you for the same audience, and you track relevant metrics. This is the most actionable type: if a competitor is doing something better, you can study exactly what they're doing and decide whether to respond.
- Internal benchmarking compares your current brand data to your historical performance or to performance across different parts of your organization (regions, product lines, or channels). It’s useful to see whether you’re growing, stagnating, or declining.
- Industry benchmarking zooms out to the category or vertical. Instead of comparing yourself to specific competitors, you compare against industry averages. This gives you context that's broader than competitive benchmarking but less specific. It's useful for setting realistic targets and for spotting big shifts in your category.
Important pre-analysis steps
The success of a benchmarking analysis depends on the work you do before you open a single dashboard.
In my view, by skipping pre-analysis, you risk ending up with reports full of numbers but no clear takeaways. So, let’s avoid that and learn how to do a proper pre-analysis setup.
Set benchmark questions before you start the benchmarking process
Define your benchmark questions before you collect data. Questions force you to commit to what you want to know, which then dictates everything else.
The strongest benchmark questions share three traits: they're specific, they're tied to a decision, and they have a clear answer format. Aim towards sharpness:
- Vague: "How are we doing on Instagram compared to competitors?"
- Sharp: "Is our Instagram engagement rate above or below the average of our top five competitors over the past 90 days, and which content formats account for the difference?"
Here are a few starter questions I usually use:
- Which competitors are growing their following fastest, and what content patterns correlate with that growth?
- How does our posting frequency compare to the category average, and is it more or less correlated with higher engagement?
- Which content pillars are competitors investing in that we're underweight on?
- Where are competitors getting their best engagement, and what does that suggest about audience preferences?
This disciplined approach turns social media analysis into strategic input rather than a stack of charts.
Choose the competitors you'll benchmark against
The mistake teams make most often is defaulting to the obvious list: the three or four brands everyone in the office mentions. Sometimes that's the right list. More often, it's incomplete. A useful competitor set usually includes 5 to 10 brands across different categories of competition.
Direct vs. indirect vs. aspirational competitors — don't mix them without segmenting
Direct, indirect, and aspirational competitors each tell you something different:
- Direct competitors are brands that sell similar products or services to a similar audience. These are the comparisons that matter most for benchmarking competitors on share of voice, market positioning, and execution.
- Indirect competitors compete for the same audience, but with different offerings. Benchmarking against this group helps you see broader audience behavior.
- Aspirational competitors are brands you're not in direct competition with — often larger, more established — but whose audience-building approach you want to learn from.
When you build your benchmarking report, make sure to keep these three groups in separate views.
Criteria checklist: audience overlap, platform presence, content volume, business model similarity
Before adding a brand to your competitor set, I advise you to run it through a short checklist to ensure it's a useful comparison:
- Audience overlap: Does this brand speak to a meaningfully similar audience? High overlap means the comparison is relevant, while low overlap means you're comparing apples to oranges.
- Platform presence: Is this brand active on the same platforms you care about? Make sure each competitor has enough activity on each platform you're benchmarking to produce meaningful data.
- Content volume: Are they posting consistently enough to generate a comparable dataset? As a rough rule, look for brands posting at least weekly on the platforms you're analyzing.
- Business model similarity: Do they operate on a similar business model? If the business model is very different, the brand might be a better fit as an indirect or aspirational comparison.
- Comparable size or trajectory: Are they within a reasonable size range, or on a similar growth trajectory? Either pick peers within your size band or normalize the comparison using rates (engagement rate, growth rate) rather than absolute numbers.
Best practices from social media experts
When I asked her about these, Yainire mentioned the following:
- “Smart competitor selection: The first step is choosing carefully who we measure ourselves against. We don't limit ourselves to direct rivals; we also include aspirational brands or 'attention leaders' that help us understand what appeals to an audience that isn't just interested in our specific product.
- Quantitative audit: We gather numerical data to understand, in broad strokes, what market position our competitors hold.
- Qualitative reverse engineering: We move on to understanding the why by closely analyzing the strategy they follow to achieve those results.
- Detecting gaps and opportunities: We cross-reference their data with ours to find a gap in the market and locate opportunities in areas they are not reaching.
- Action plan: As I always say, 'an analysis without action is just a beautiful PDF'. The process truly ends when we translate all these findings into actionable experiments for our own strategy."
Now that you know how to set up your social media benchmarking analysis, let’s turn to picking the most important metrics to measure.
What are the most important metrics to consider when doing competitive benchmarking?
The most important metrics to consider when doing competitive benchmarking are the ones tied directly to the questions you defined at the start. The trap most teams fall into is tracking everything because it's available, which produces long, irrelevant reports.
A more useful approach is to organize metrics into three complementary tiers:
- Tier 1, the strategic view that raises questions;
- Tier 2, the tactical viewpoint that points to patterns;
- Tier 3, the diagnostic view that explains what's happening.
Yainire explains the balance well:
"We usually focus mainly on quantitative metrics such as interactions, audience size, or the volume of content that competitors upload to social media. However, by looking only at those numbers, we leave behind the most important part: quantitative data gives us the what, but we need to understand the how and the why.
To achieve a deep diagnosis, finding a balance between quantitative and qualitative parameters is fundamental. Nowadays, the most critical qualitative metrics we must analyze are:
- Share of voice and sentiment: Not just how many people are talking about the competition, but under what tone and emotion.
- Content intent and format: Understanding the strategy behind what they launch.
- Community health: Evaluating the brand's two-way communication through its tone and its actual relationship with the audience.
- Third-party voices: Identifying and analyzing external advocates or communities that organically support the brand."
Let’s explore each tier in more detail:
Tier 1 (strategic): share of voice, engagement, audience growth rate
Tier 1 metrics give you the high-level view of how you stack up against competitors, and they're the ones that belong in any leadership-facing report.
- Share of voice measures how much of the conversation in your category your brand owns, relative to competitors. A growing share of voice means you're capturing more attention; a shrinking one means competitors are pulling ahead in visibility.
- Engagement at the strategic level is best viewed as engagement rate (interactions divided by followers or reach), rather than raw totals. A deeper social media engagement view matters here, as it normalizes the comparison across brands of different sizes.
- Audience growth rate shows how quickly each brand is adding followers relative to its existing base. Absolute follower counts can be misleading: a brand adding 10,000 followers per month looks impressive until you realize they already have 5 million, and the growth rate is well below the category average.
A profiles summary view, like the Socialinsider one below, pulls these strategic metrics together in one place, so you can see at a glance how each brand in your set is performing across followers, growth, engagement, posting volume, and reach:

In this view, you can see the divergence between the two brands: one is losing followers while the other is steadily adding to its base, even though the larger brand still leads on total engagement and reach. The leader on one metric isn't always the leader on another, and the gaps are useful insights.
Tier 2 (tactical): posting frequency, content format mix, engagement by post type
If Tier 1 tells you a competitor is outgrowing you, Tier 2 starts to show you why:
- Posting frequency tracks how often each brand publishes on each platform. Frequency alone doesn’t paint a complete picture, so it needs to be paired with engagement rate to be meaningful.
- Content format mix breaks down what share of each brand's output is Reels, carousels, images, videos, statuses, and so on. This often reveals where competitors are focusing and where you might want to spend more resources, too.
- Engagement by post type layers performance onto the format mix. A brand might be posting 60% Reels but getting most of its engagement from carousels, which suggests their volume and performance strategies aren't aligned.
A side-by-side dashboard of posting volume, like the one provided by Socialinsider, makes the tactical comparison easy to act on:

Clearly, one brand is posting more consistently and frequently than the other. The next step is to look at whether the higher-volume brand is also generating proportionally higher engagement, or whether they're diluting their performance by posting too often.
Tier 3 (diagnostic): sentiment analysis, content pillar performance, top post analysis
Tier 3 metrics turn benchmarking from a measurement exercise into data-driven marketing — the kind that changes how you plan.
- Sentiment analysis looks at the emotional tone of mentions and comments around each brand, not just the volume.
- Content pillar performance breaks each brand's output into thematic groups — product launches, behind-the-scenes, customer stories, education, seasonal — and shows which pillars are getting the most engagement.
- Top post analysis zooms in on the individual posts driving results for each brand. Looking at the top three to five posts from each competitor reveals useful patterns: a recurring format, creator partnership, or specific story angle.
I perosnally find it very insightful how Socialinsider’s content pillar view shows how each brand is distributing effort across themes and which pillars are pulling the strongest engagement for them:

A top post view rounds out the diagnostic picture, showing the content driving the biggest results for each brand:

Pulling this kind of view together manually across platforms is almost impossible. A dedicated competitor benchmarking tool saves you time and helps you get actionable insights fast.
Platform-specific social media benchmarks
This is something I say whenever I'm asked about benchmarks: what counts as "good" engagement or growth varies enormously between platforms. That’s why you need platform-specific social media benchmarks.
For a full, updated reference across platforms and industries, the Socialinsider social media benchmarks report is a good place to anchor your analysis. That's usually my starting point for every analysis.
Based on those, through the sections below I'll highlight a few patterns to keep in mind when you're framing your own benchmarking work.
Engagement benchmarks
Engagement benchmarks vary widely by platform. Across the major platforms, TikTok continues to sit well above the rest, while Facebook and X hold steady at much lower averages:
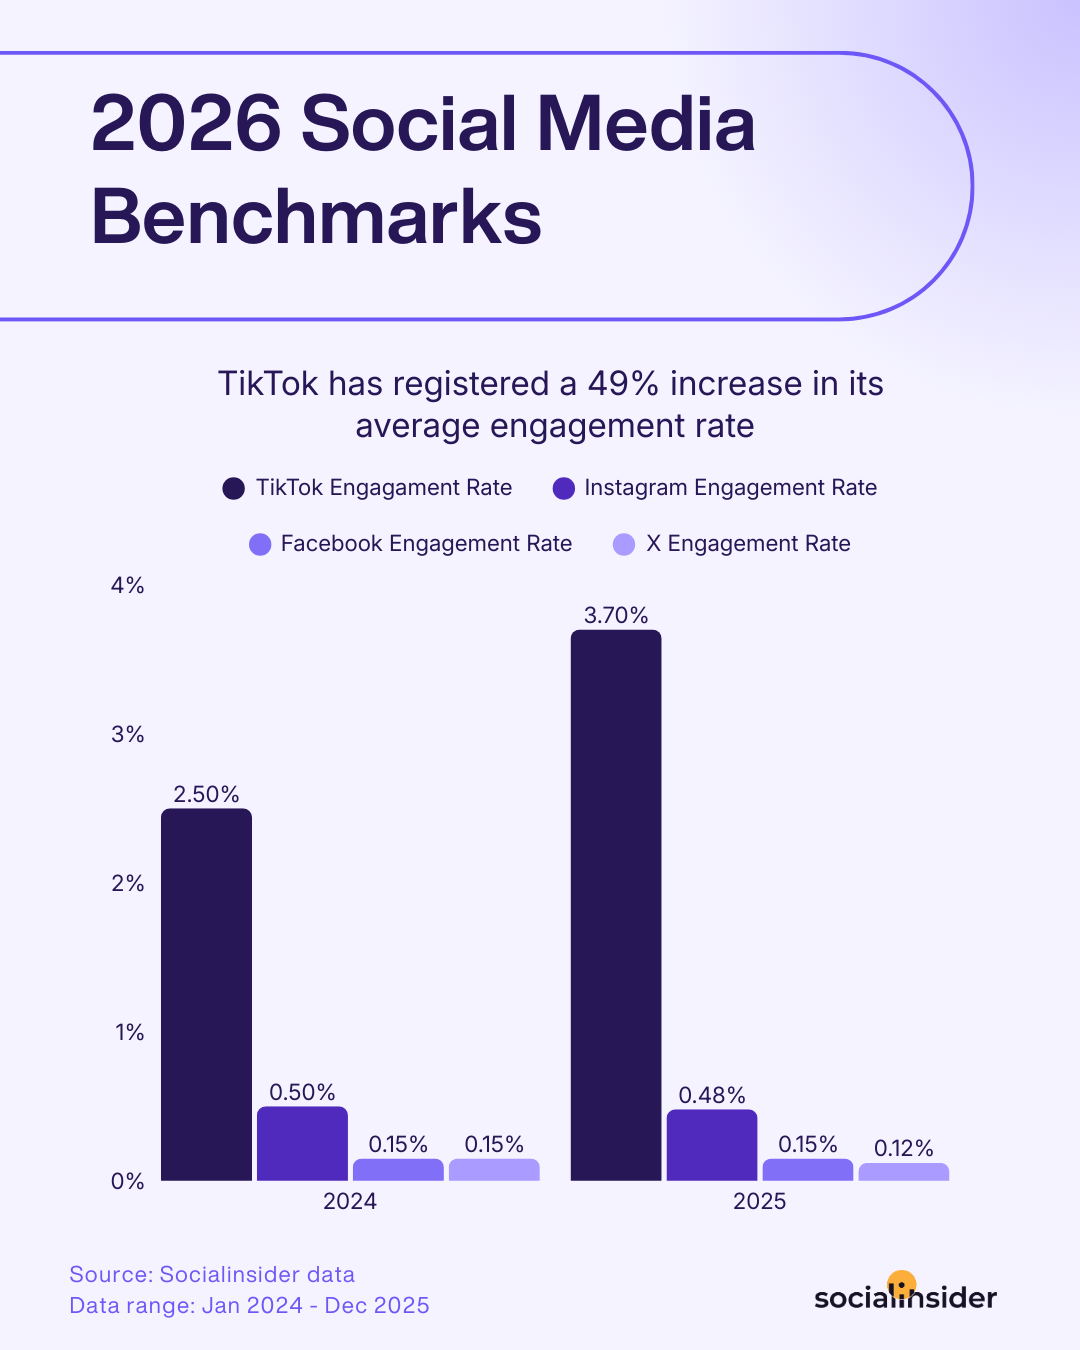
This doesn’t necessarily mean that one platform is better than another, but that engagement rate has to be interpreted in context and that performance on each platform needs different kinds of optimization.
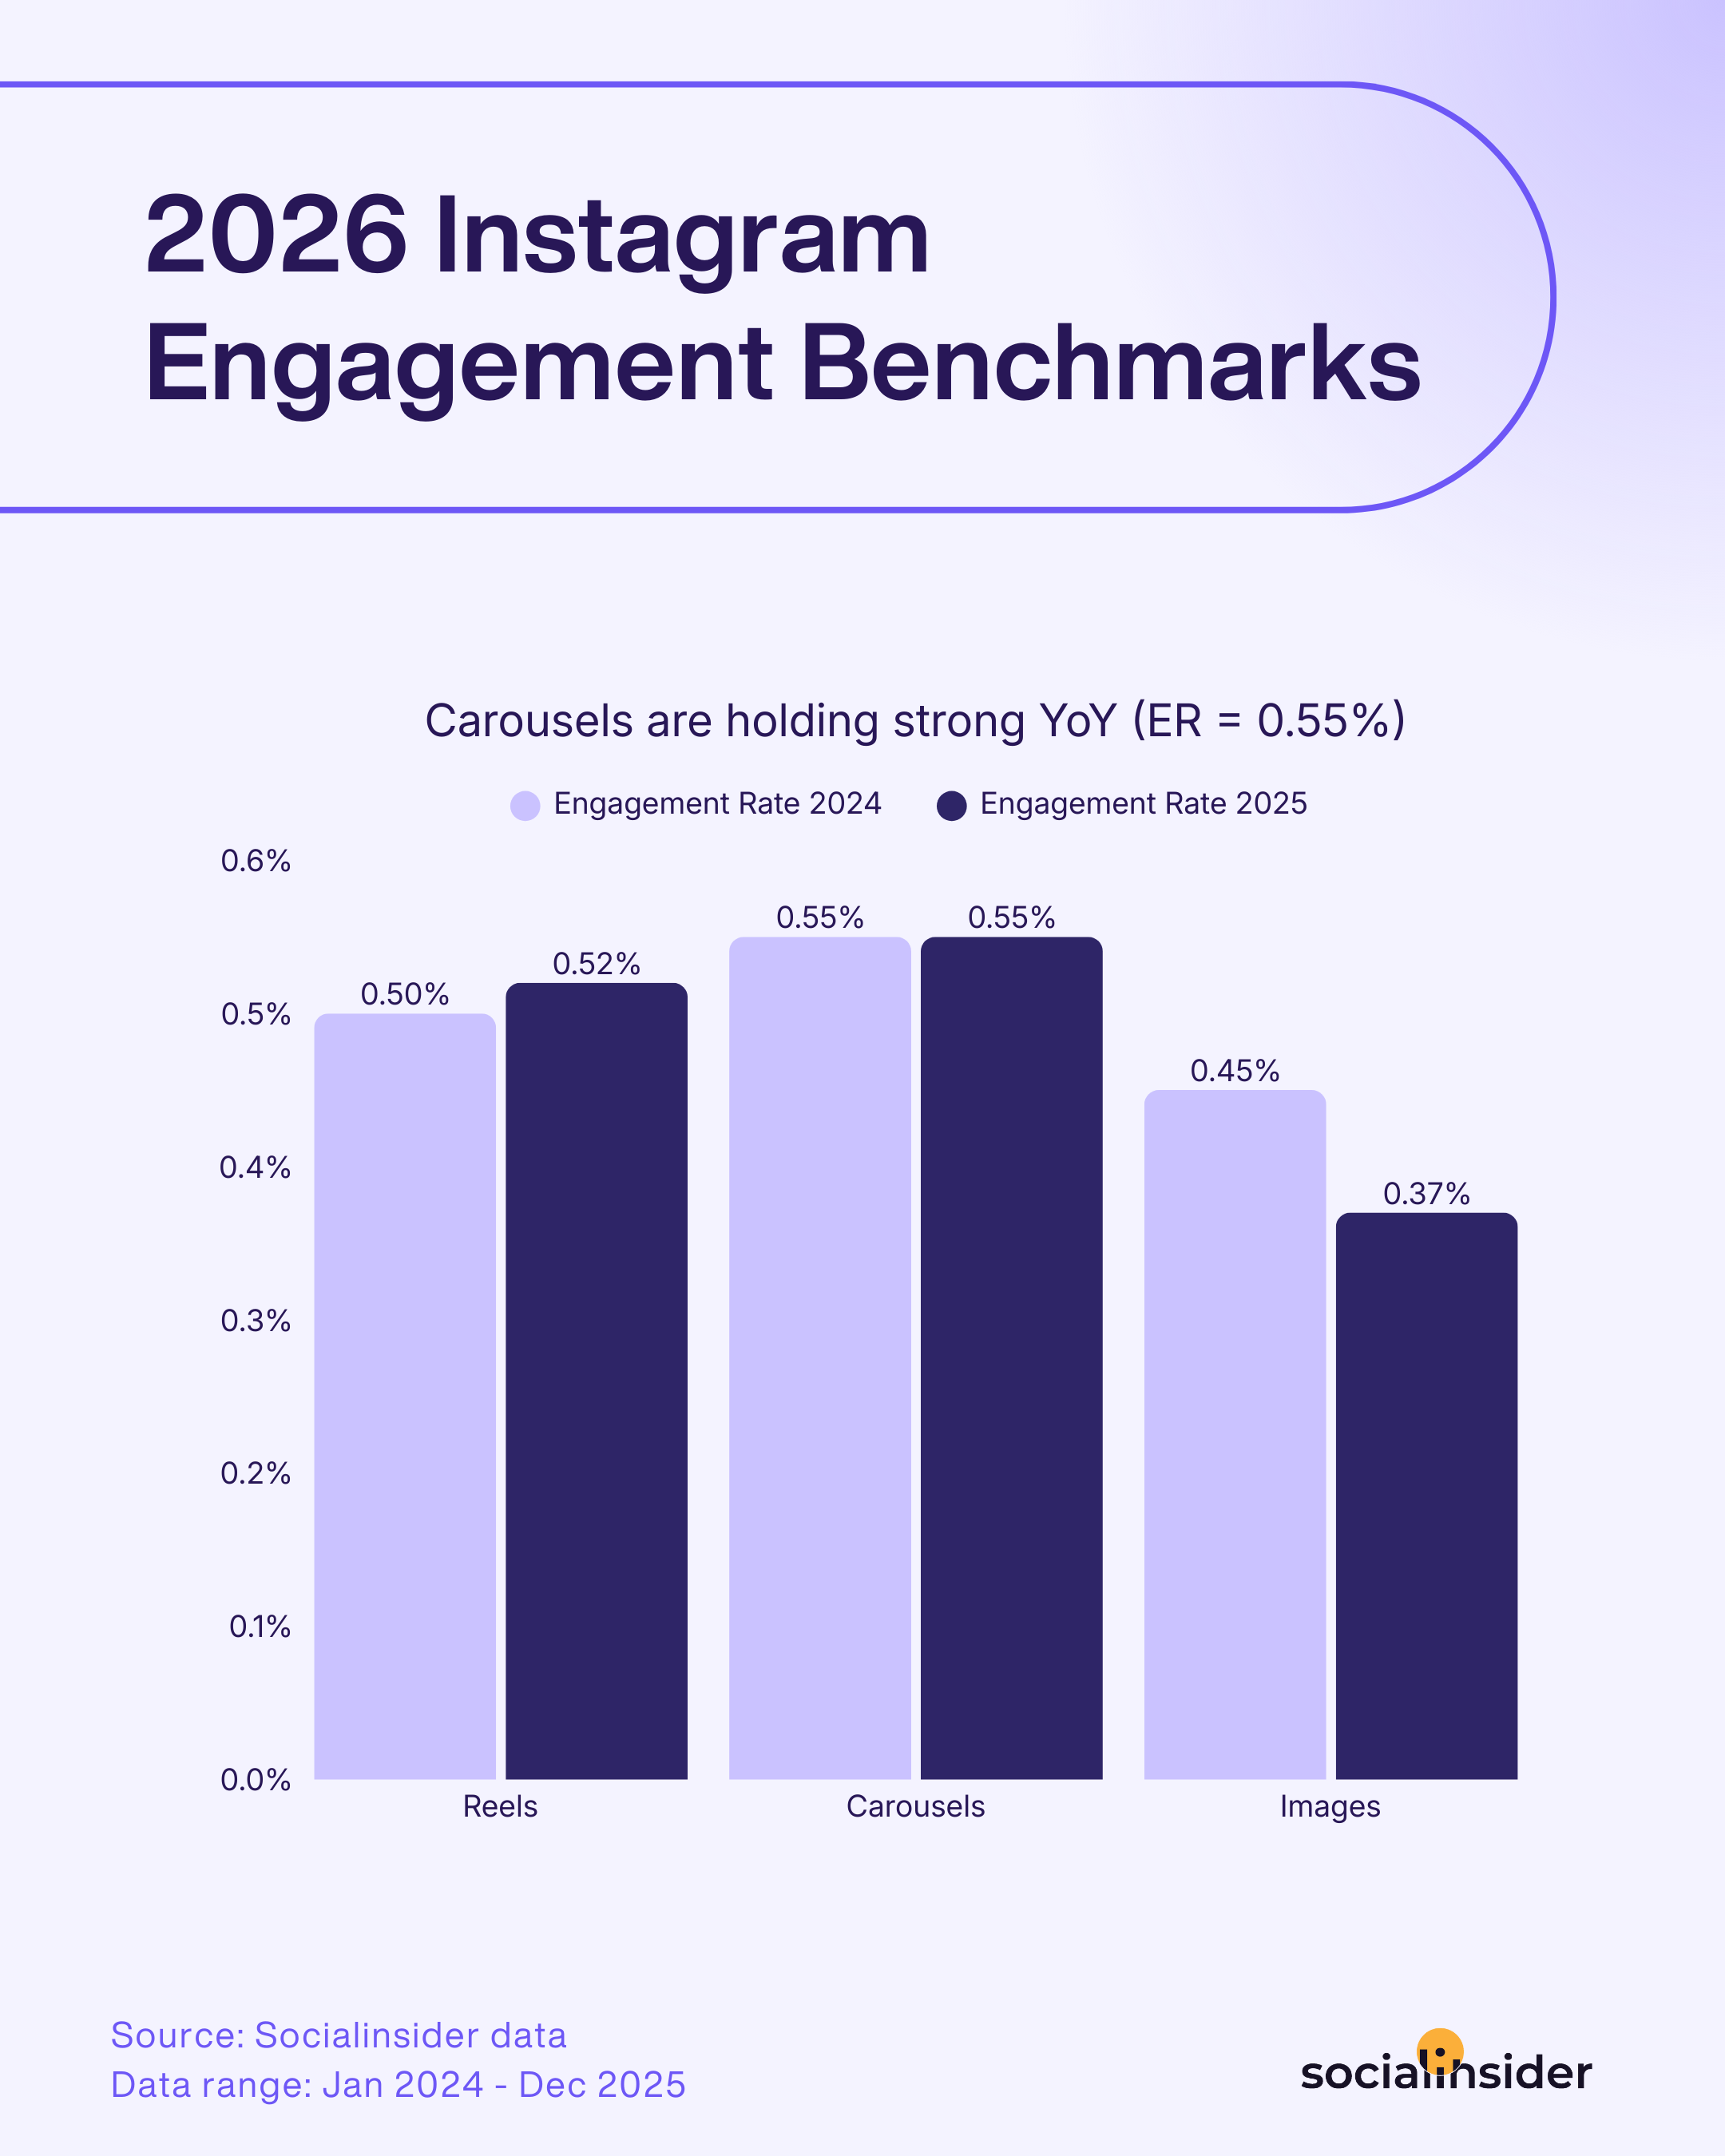
On Instagram, carousels continue to hold their position as the most reliable format for engagement, with Reels close behind and static images trailing:
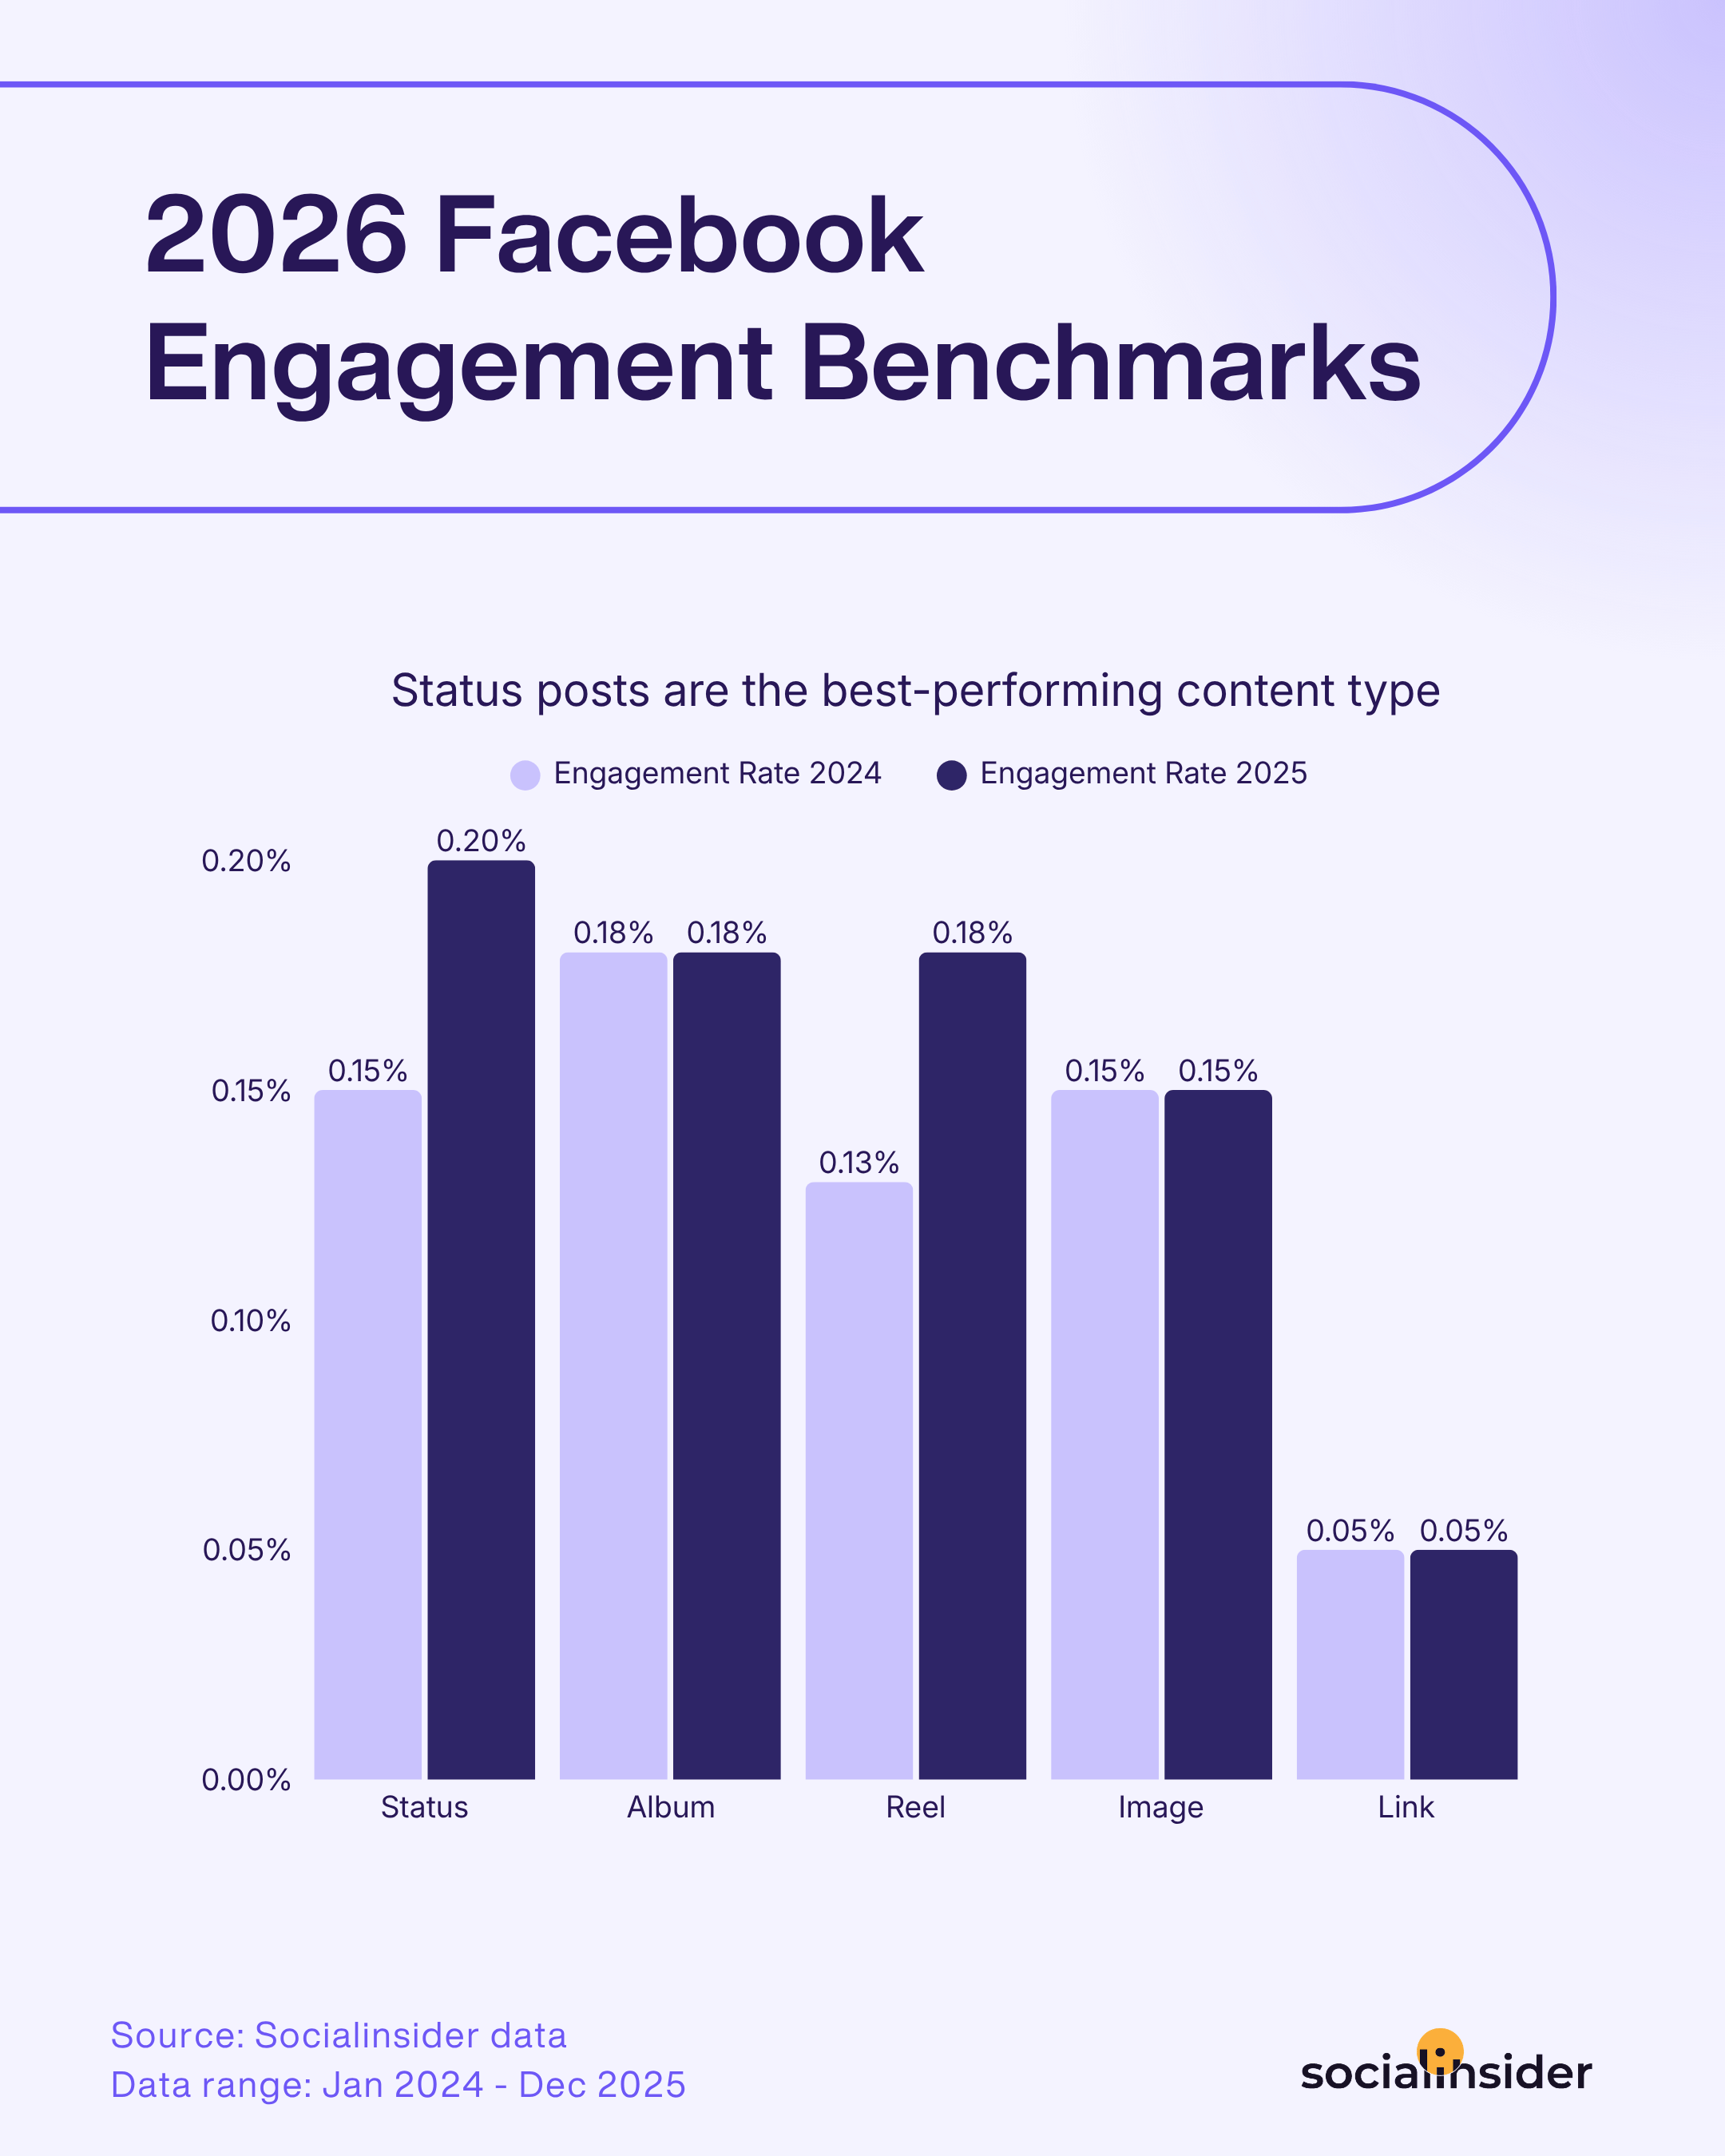
Facebook tells a different story. Status posts — the simplest, most text-driven format — are outperforming more produced content types, while Reels have closed the gap significantly year over year:
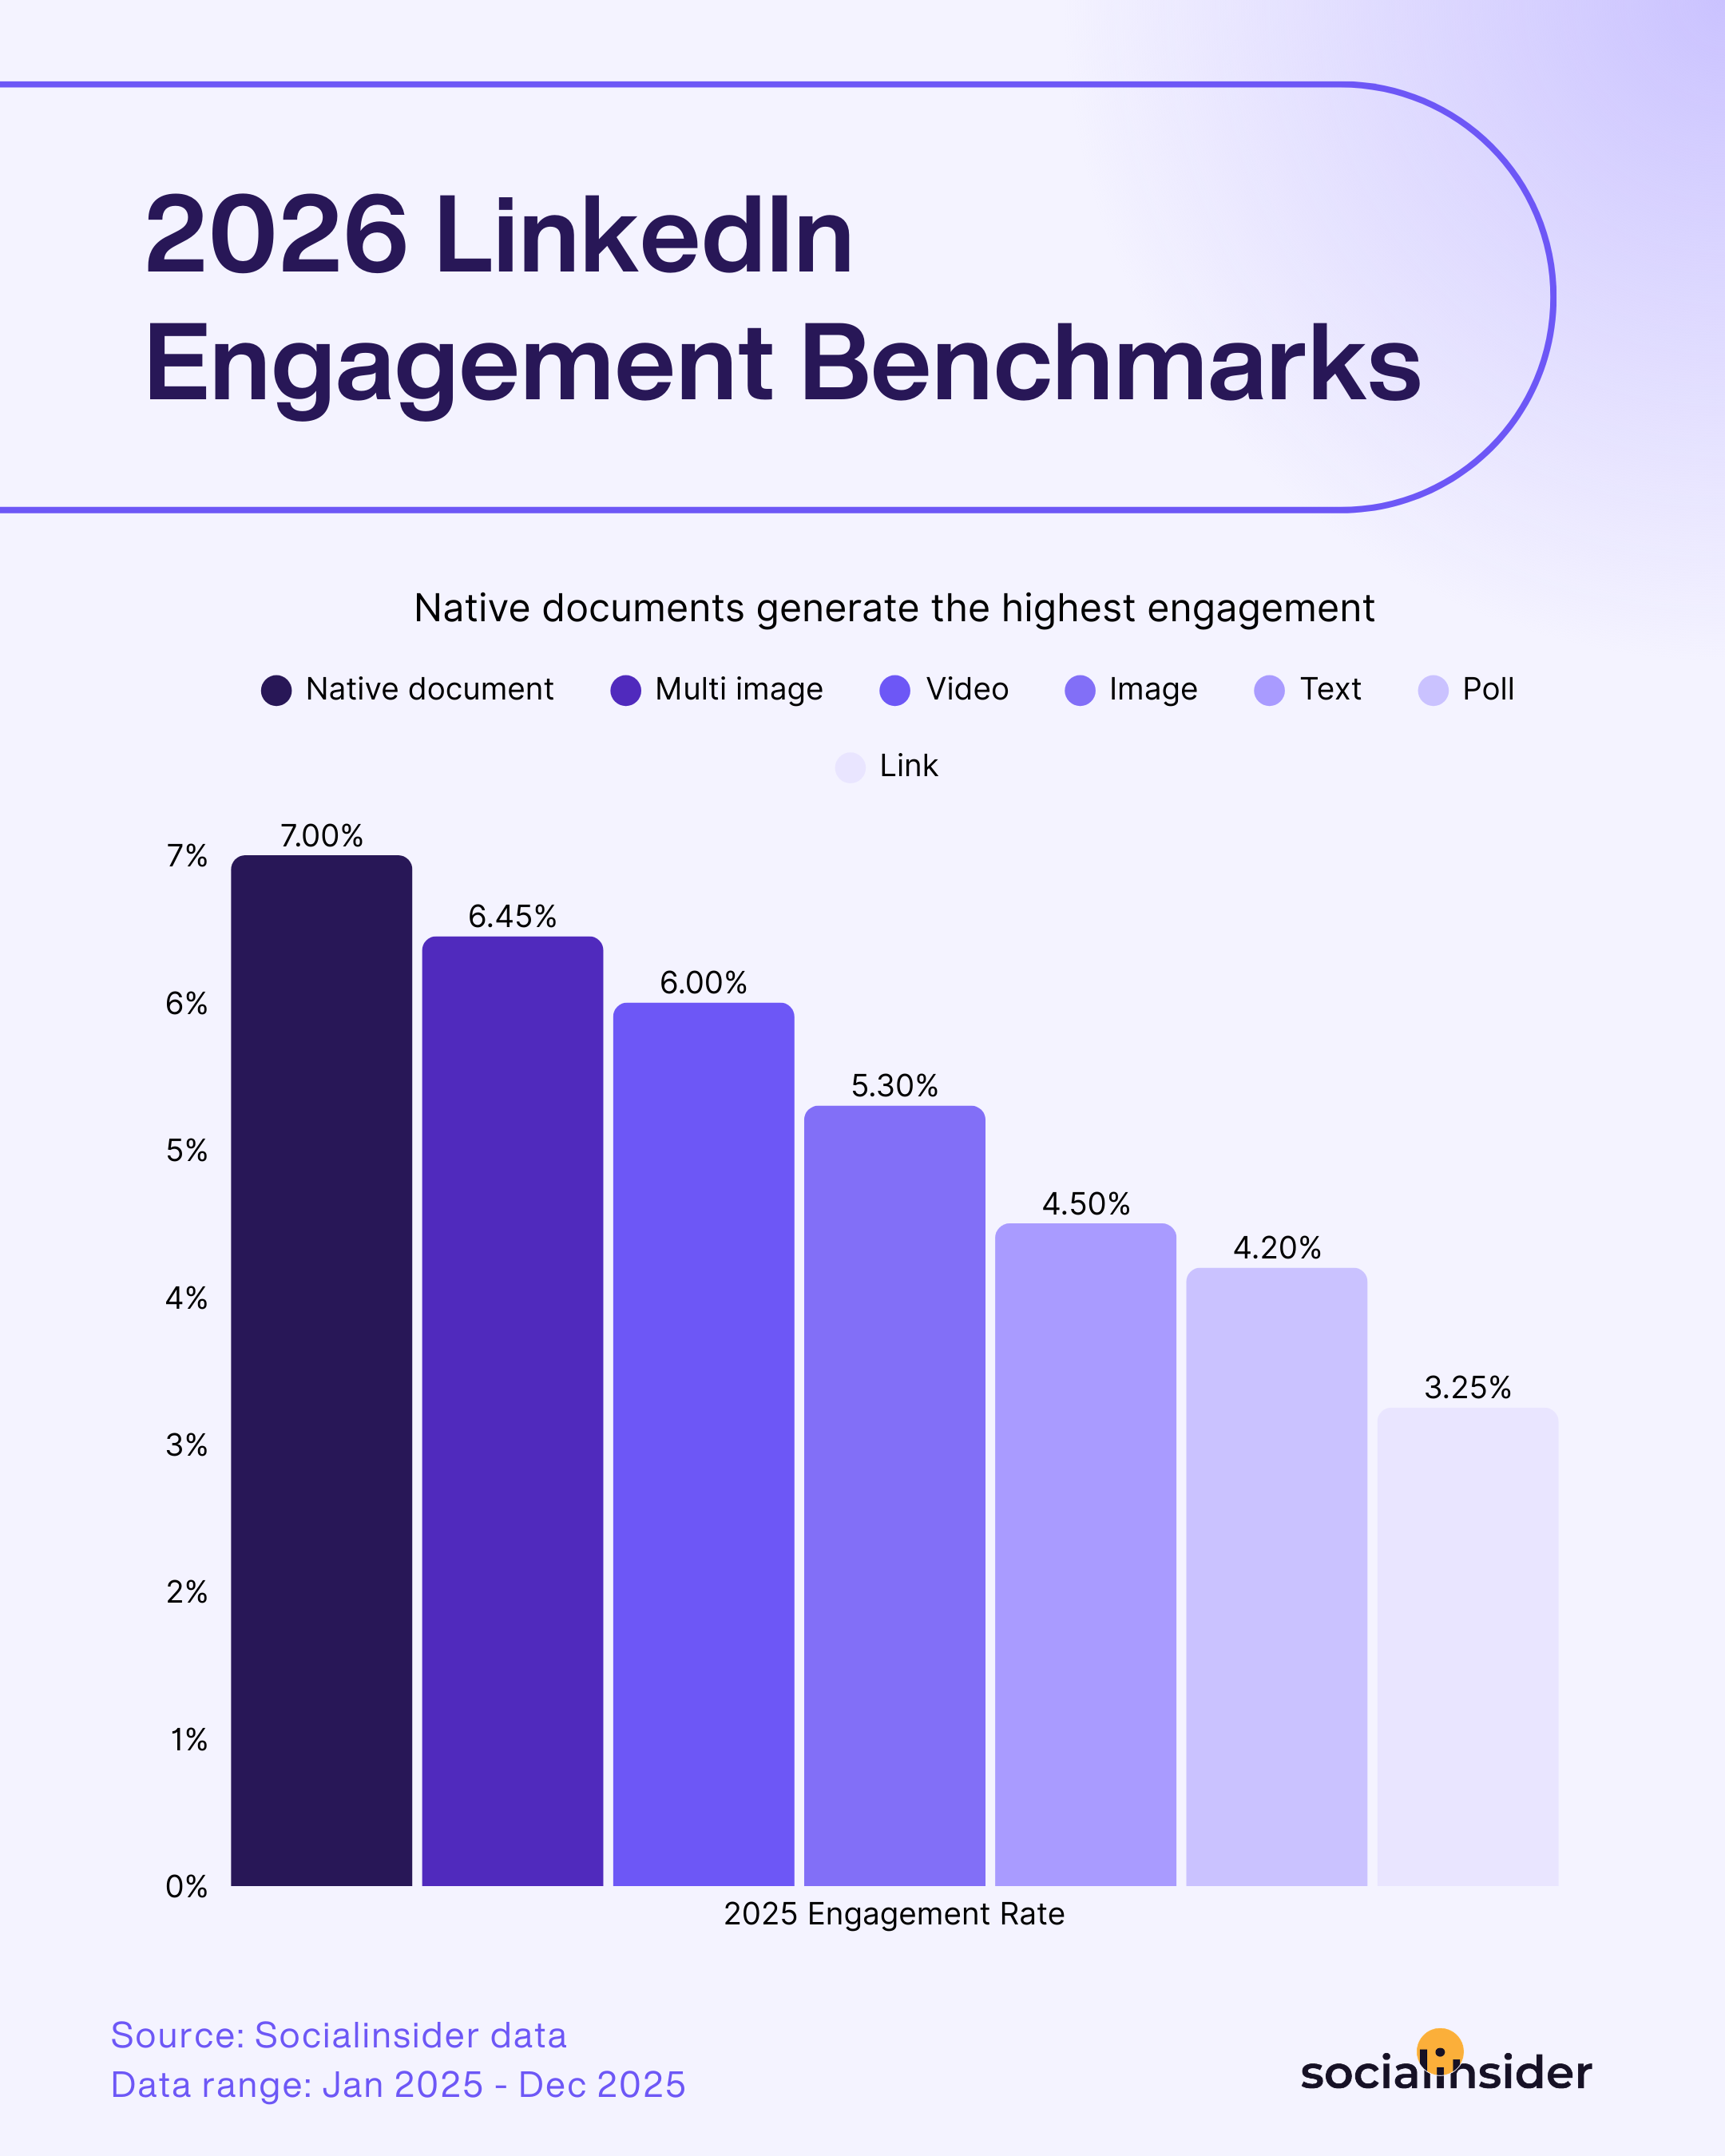
LinkedIn's format hierarchy is the most differentiated of any major platform, with native documents (carousels and PDFs) leading the pack by a meaningful margin:
Follower growth benchmarks
Follower growth benchmarks have shifted noticeably in the past year, and the patterns differ by platform and account size. According to recent Socialinsider data, growth has slowed across most platforms compared to the prior year, and the slowdown is sharper in certain follower tiers.
On Instagram, audience growth has cooled across every size band, with the steepest declines hitting mid-to-large accounts:
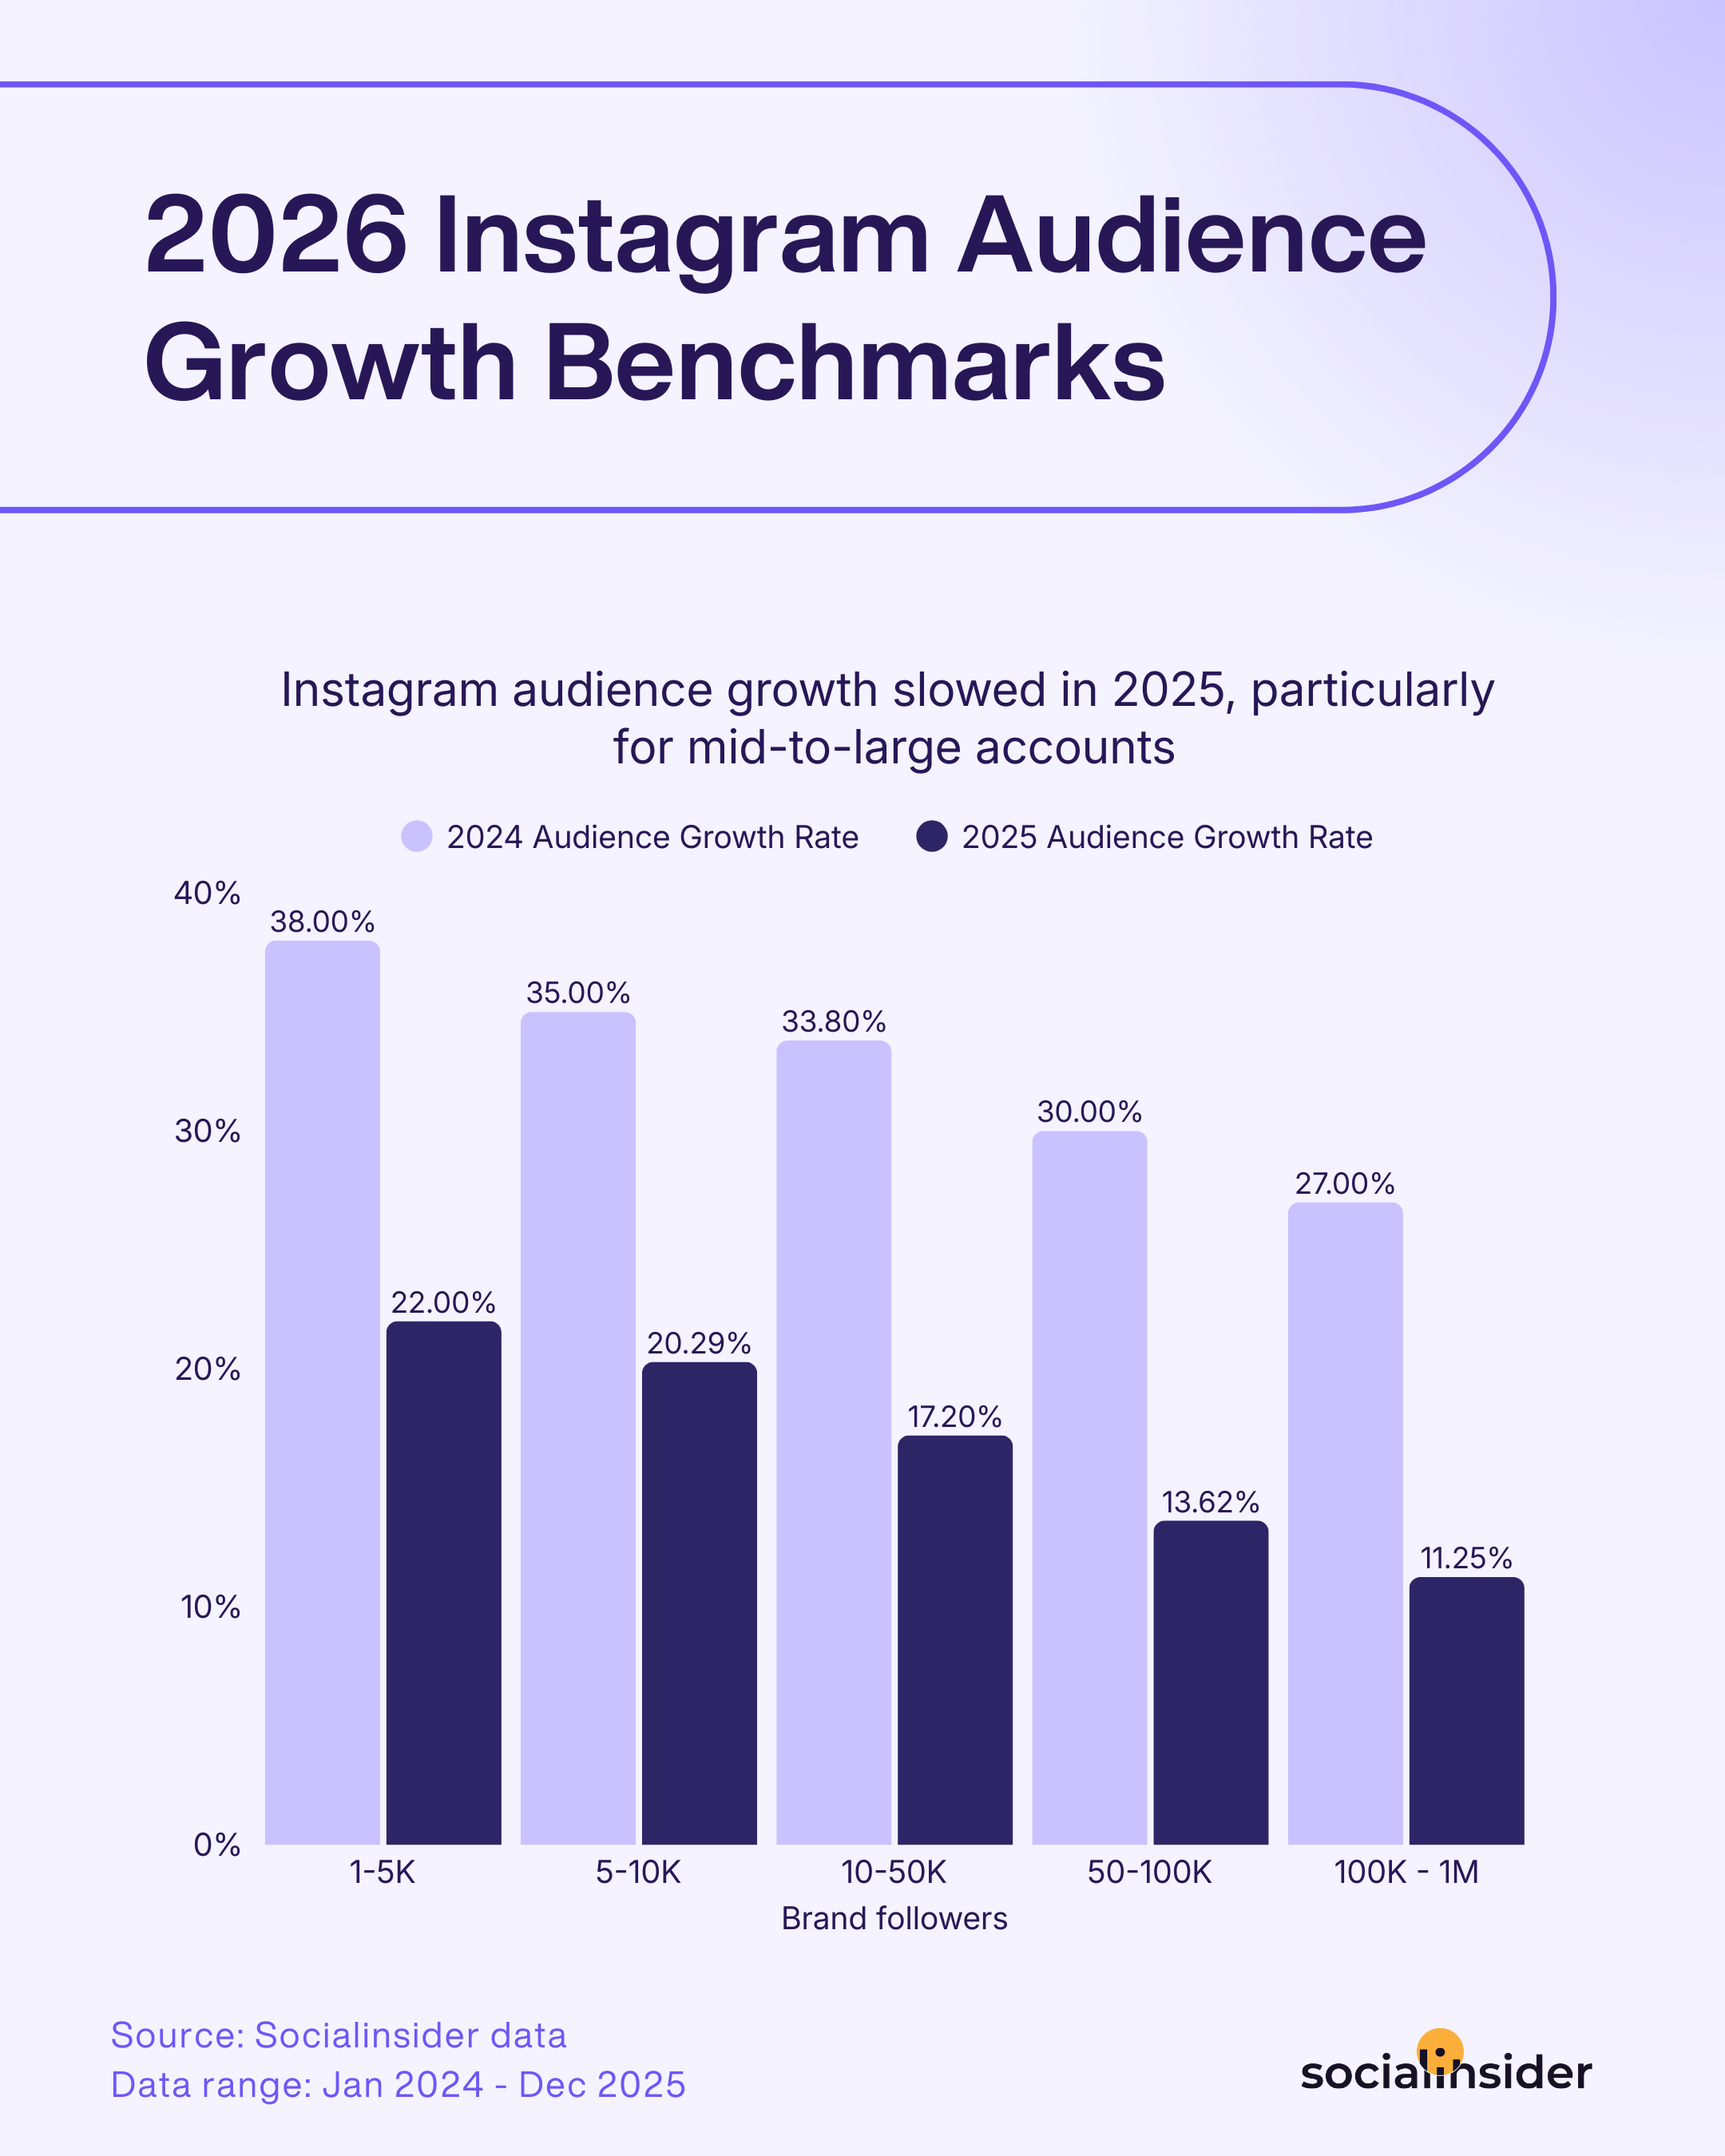
Lesson here: growth targets set against last year's numbers are likely to feel unreachable. If you're a 100K-1M account holding flat year over year, you're not falling behind, but tracking close to the category average.
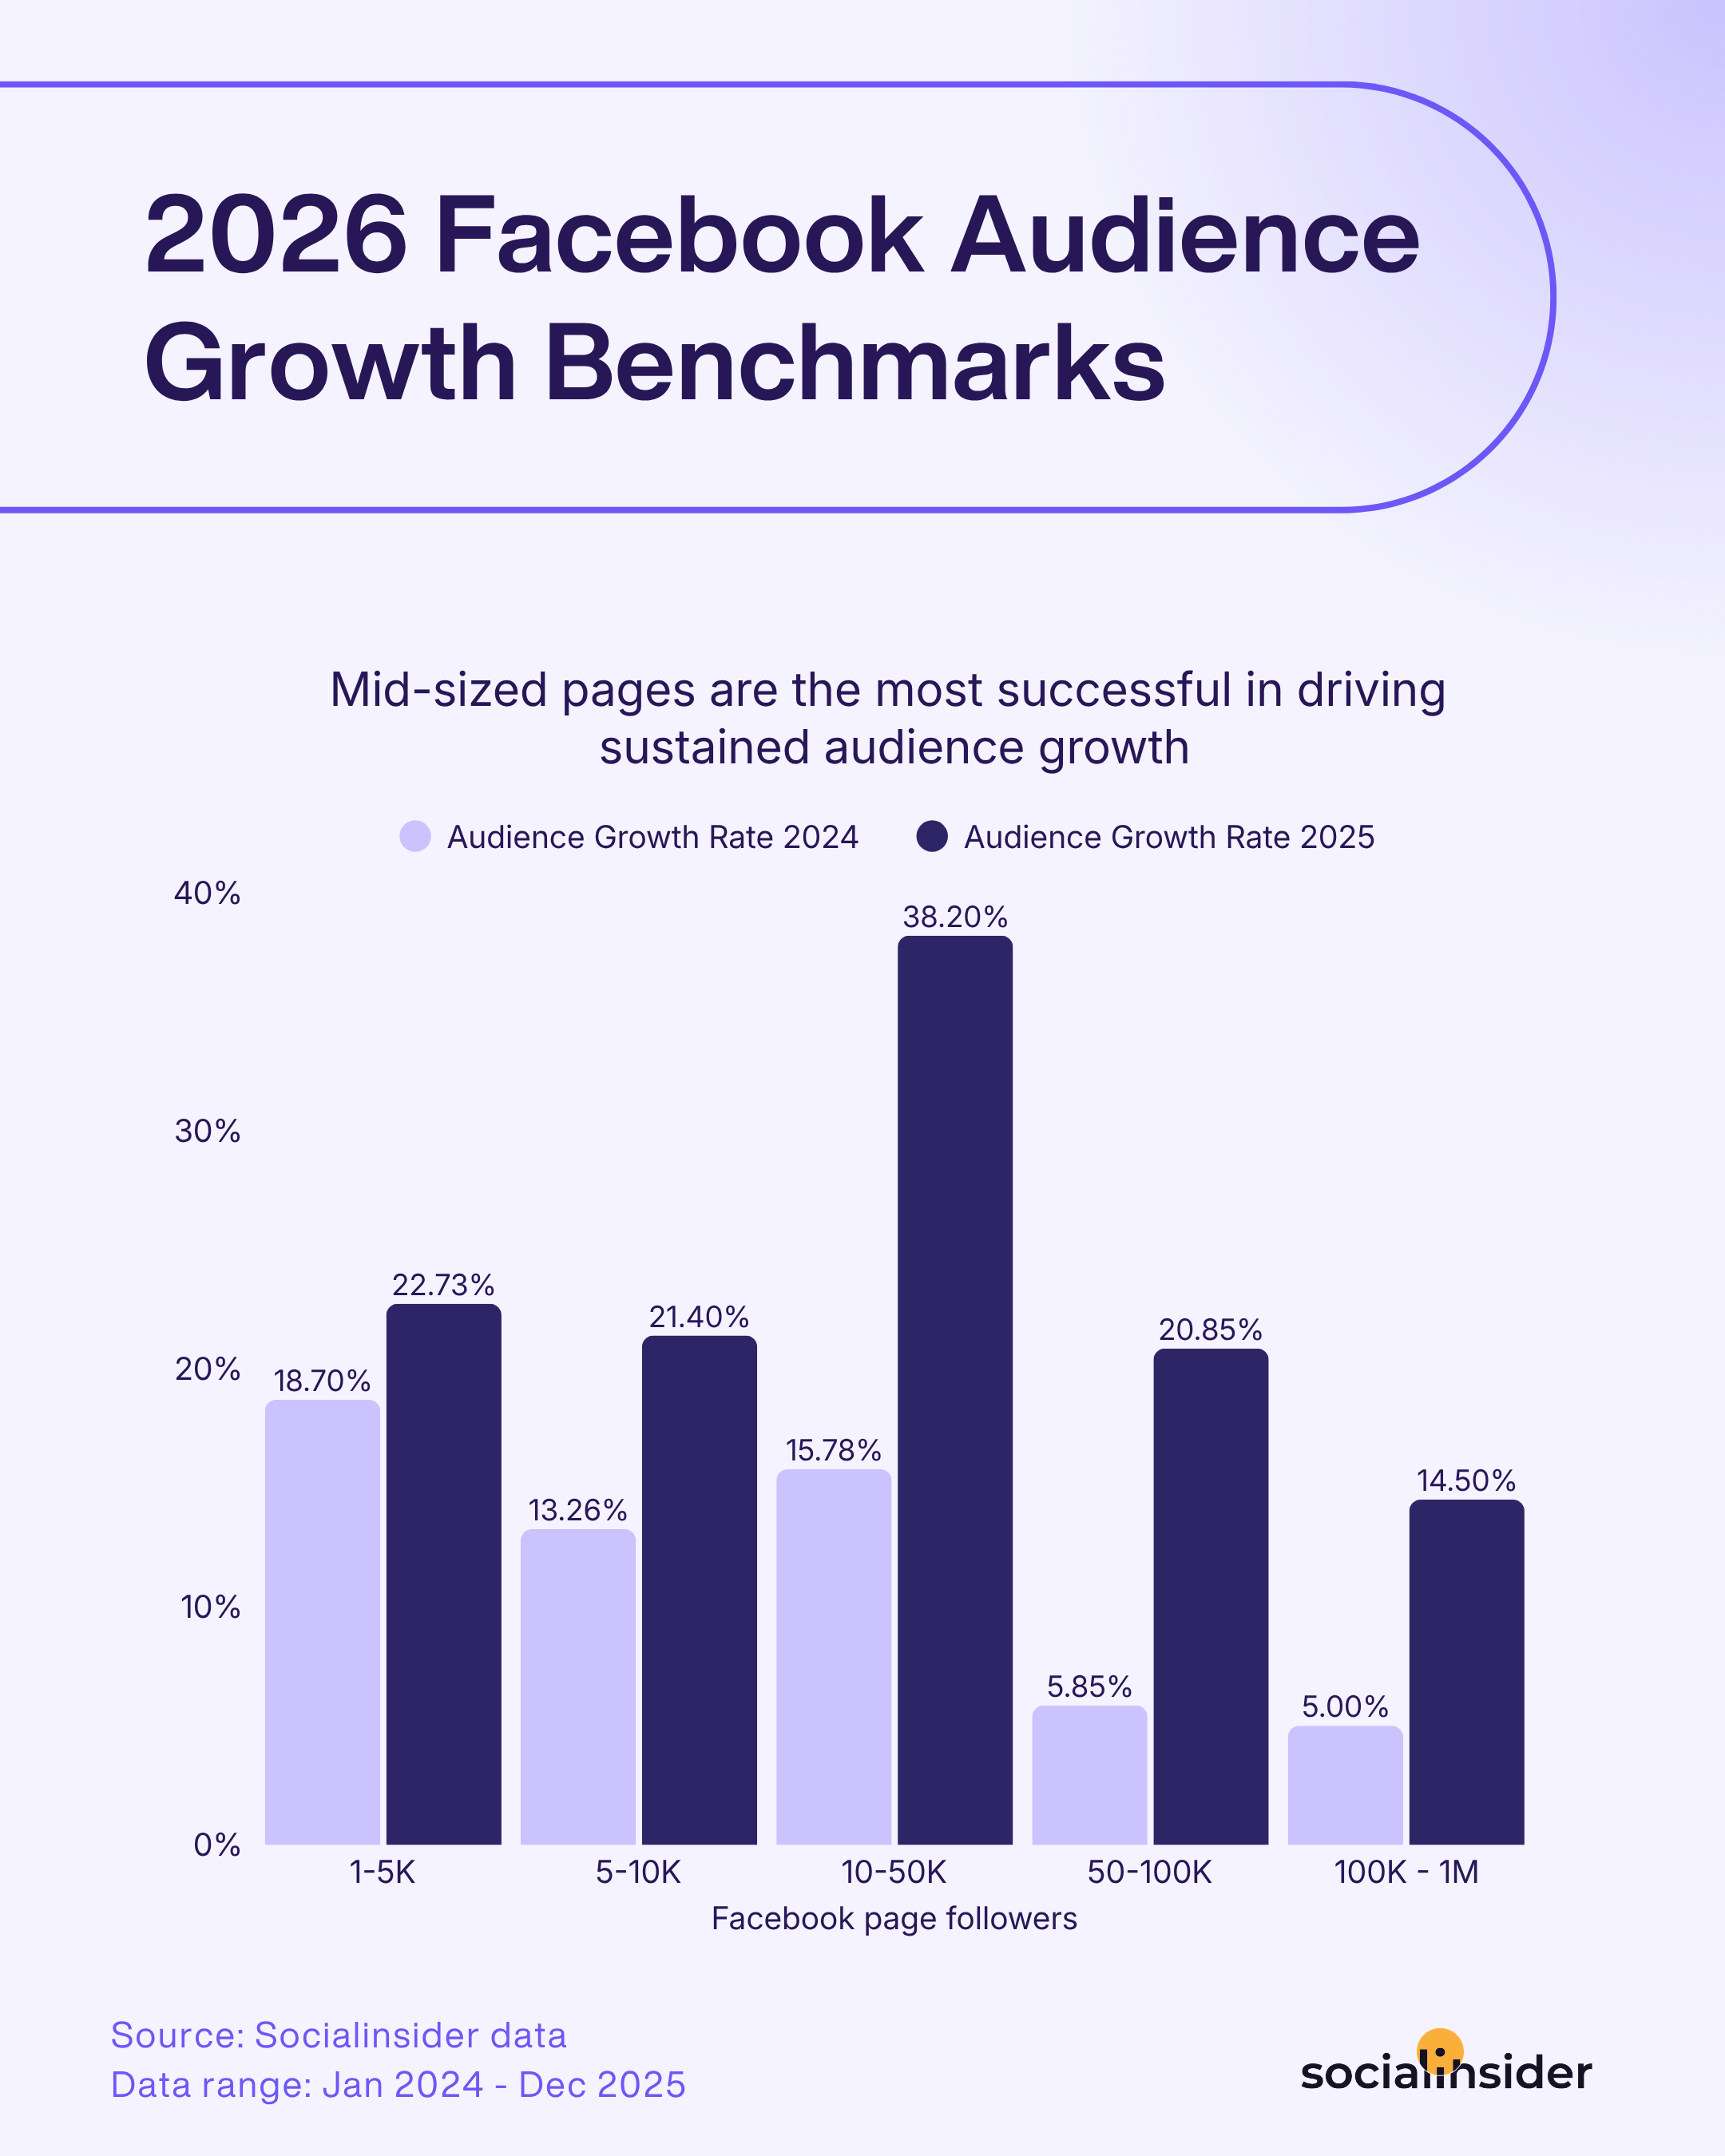
Facebook is the outlier in the growth story. Mid-sized pages in the 10K-50K range have grown significantly, while larger pages are growing modestly but more consistently than in the prior year. Socialinsider data shows that Facebook remains a viable growth platform for brands in the mid-size tier, even as Instagram and LinkedIn slow down.
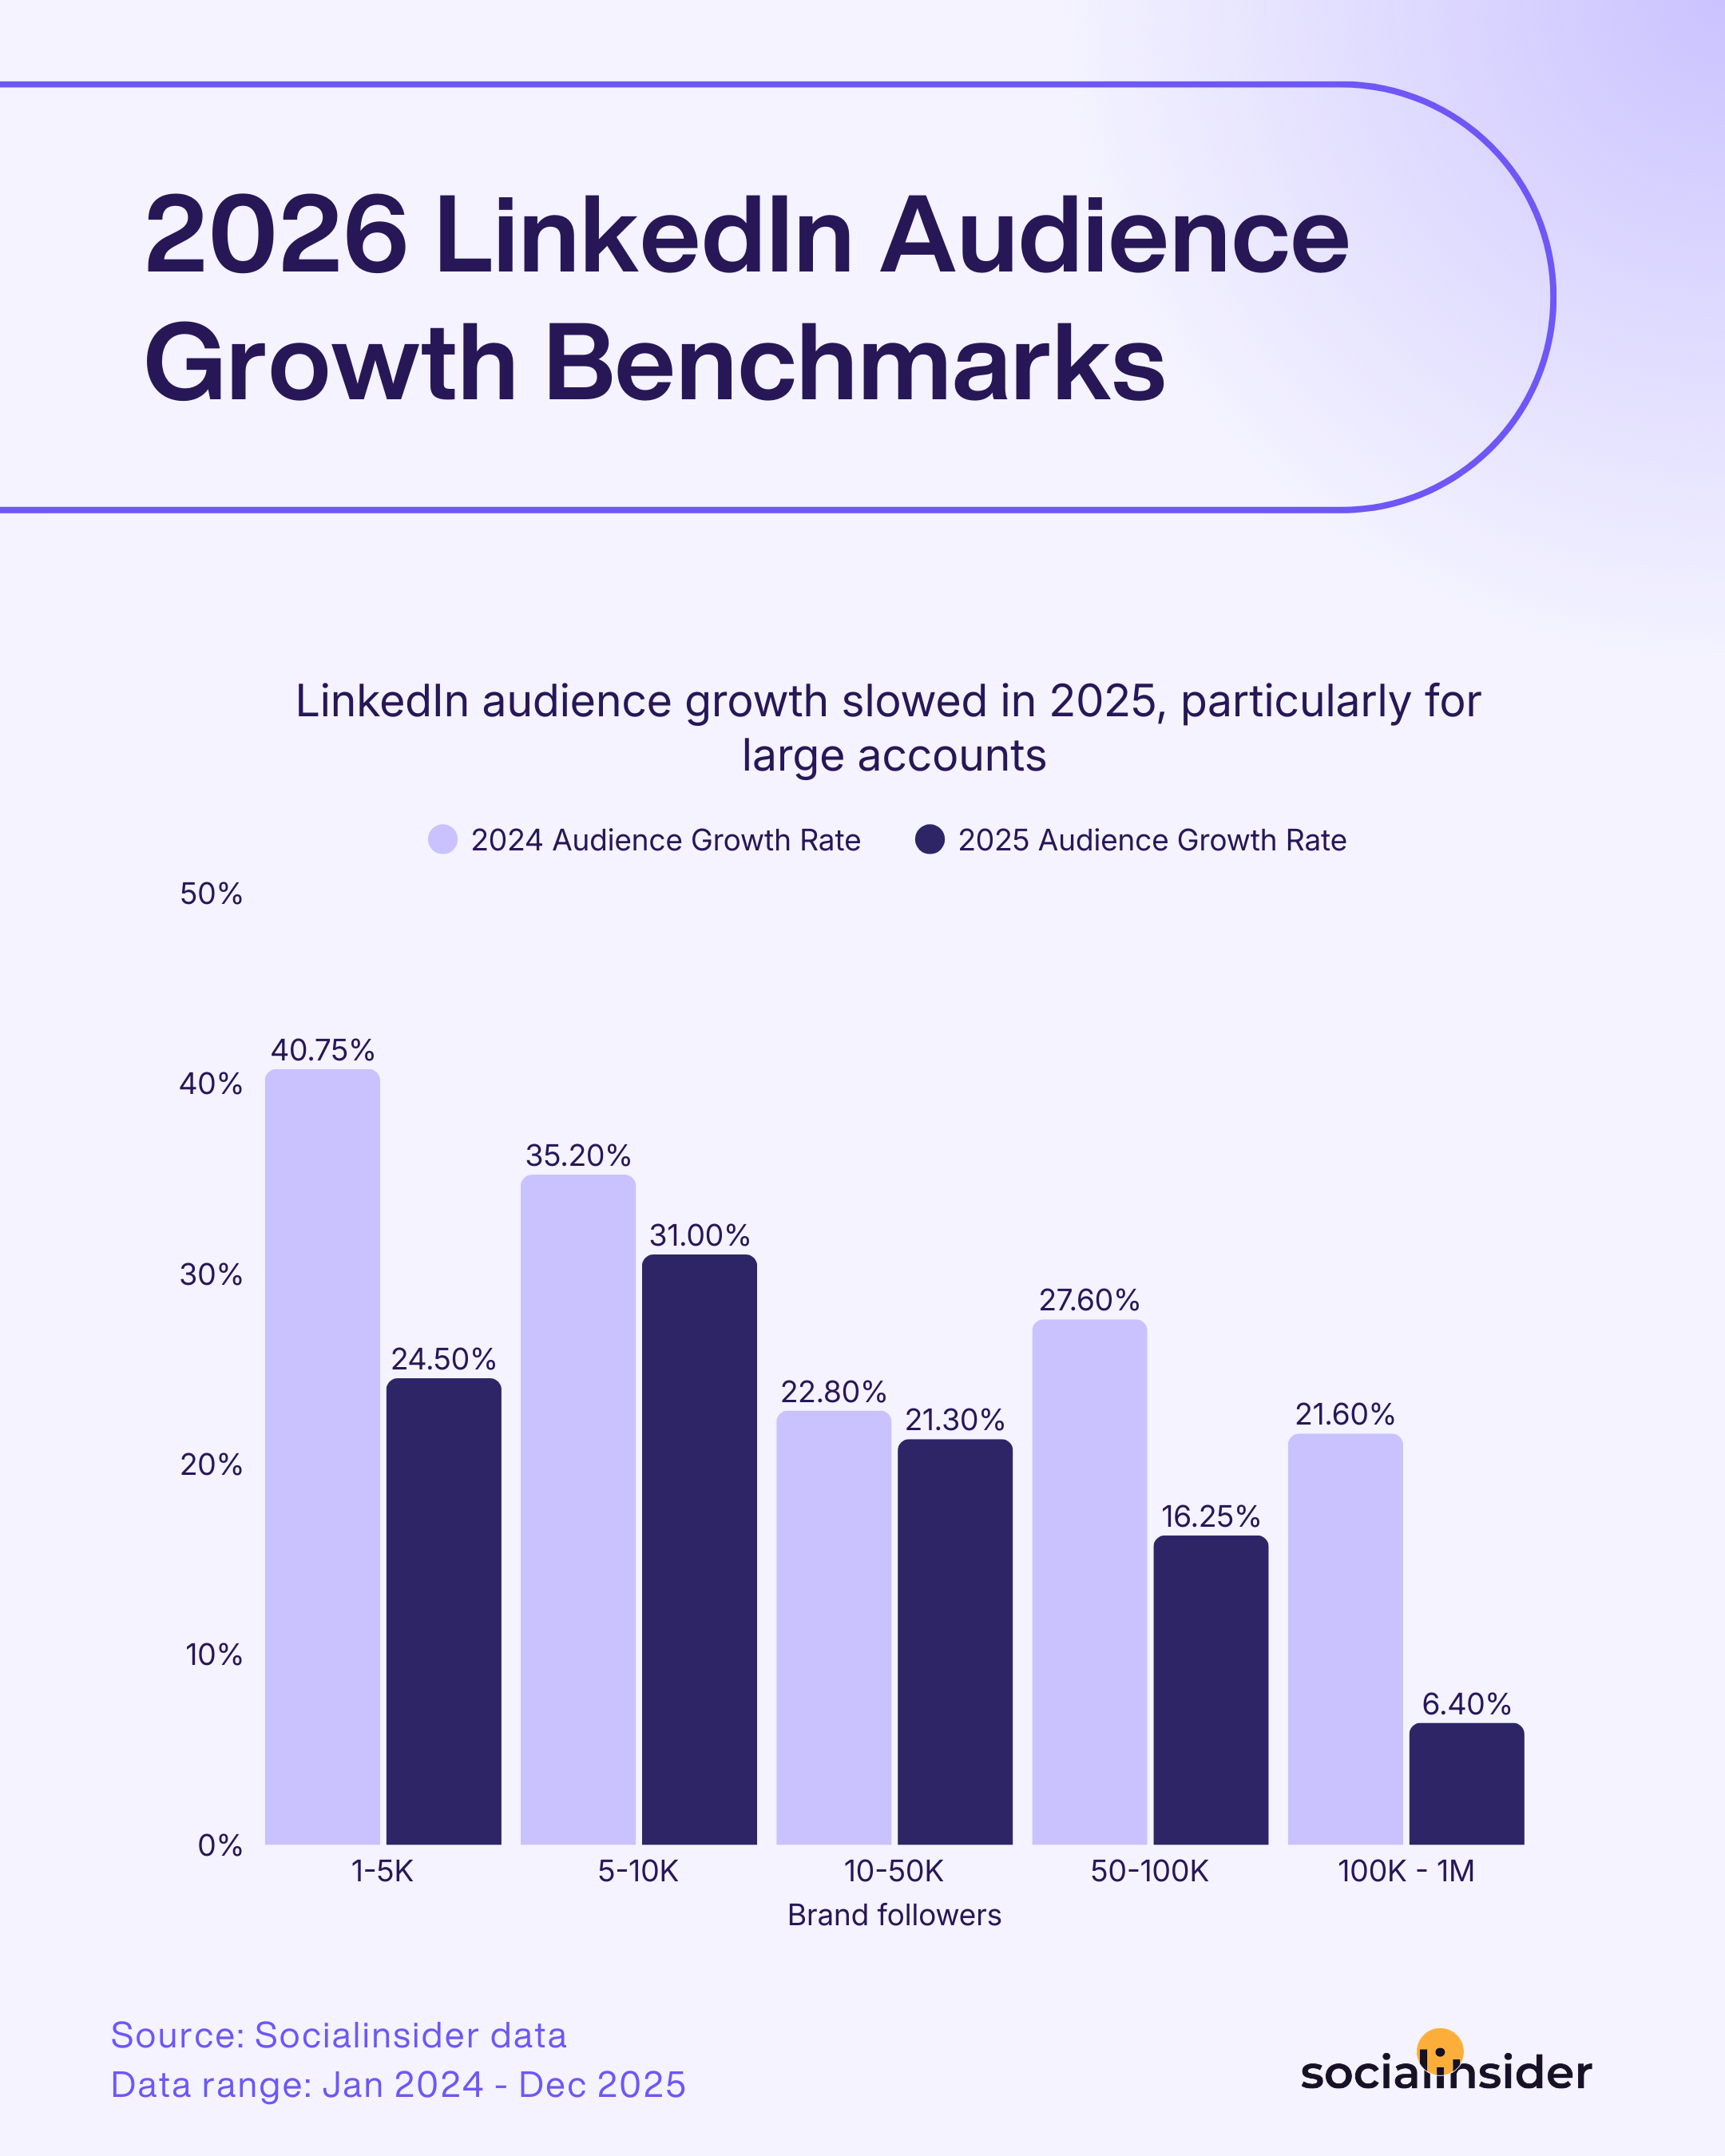
Socialinsider LinkedIn data suggests that audience growth at scale is getting harder, and brands with established large followings should expect more modest gains than in prior years. Smaller accounts are still growing meaningfully, just at a slower pace.
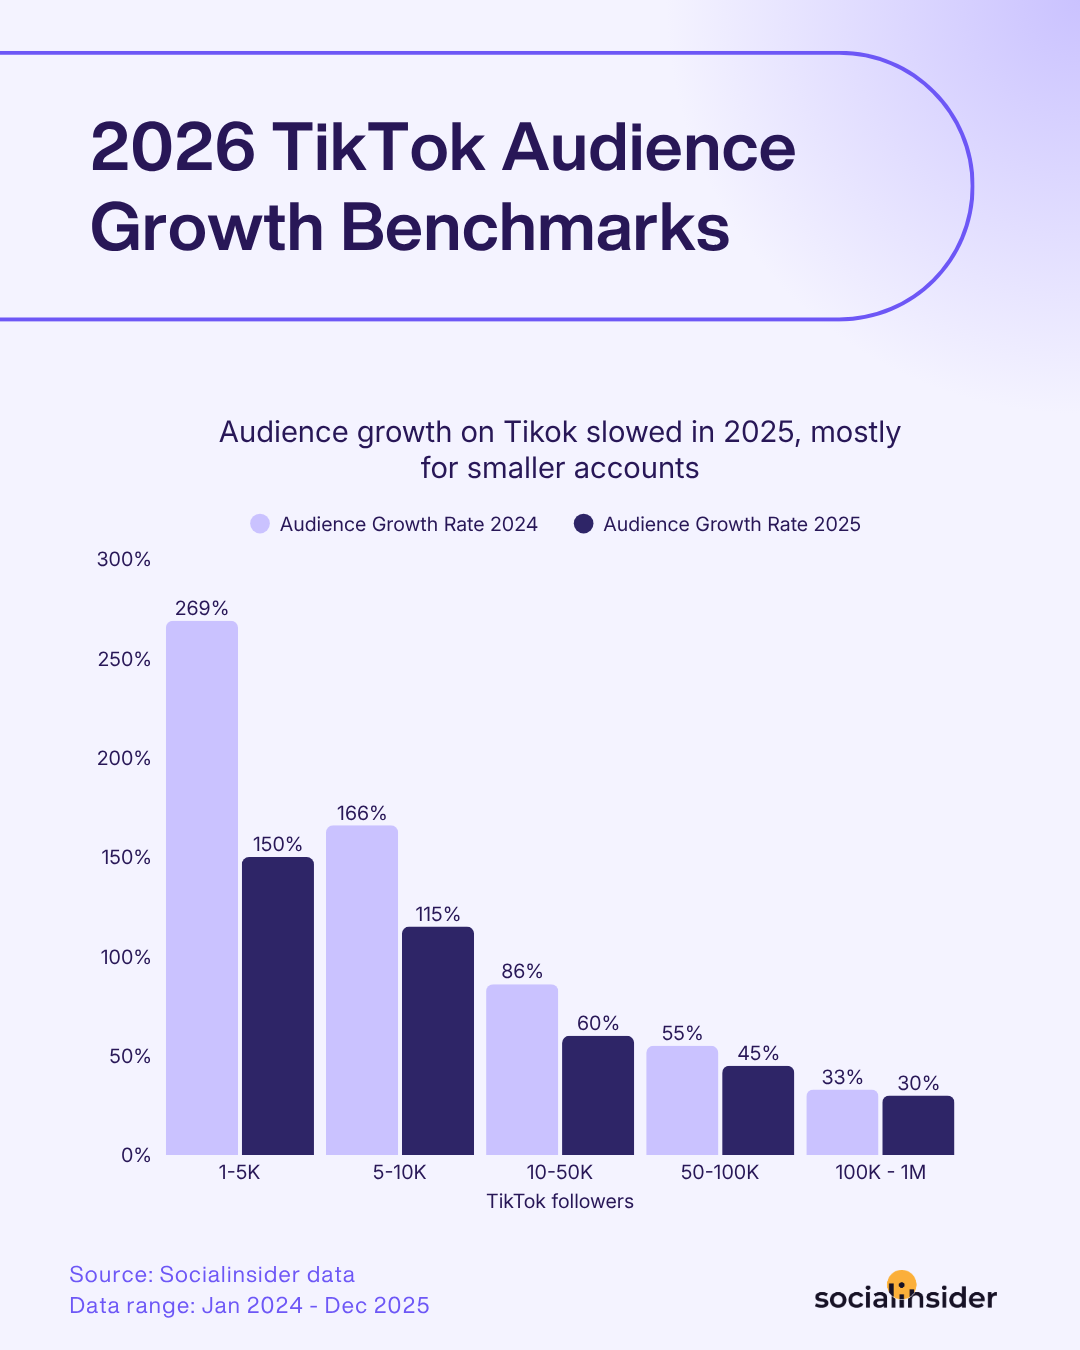
TikTok shows the same trend — growth is slowing — but the absolute numbers are still well above those of other platforms, especially for smaller accounts. Smaller TikTok accounts are still seeing triple-digit growth rates, which means TikTok benchmarking requires a different scale entirely from other platforms.
How to run a competitive benchmarking analysis?
Running a competitive benchmarking analysis comes down to six repeatable steps: define what you're measuring and why, collect clean data, identify your strengths and gaps, translate findings into actions, communicate the results, and establish a cadence that keeps the process producing value. Below, I explain each.
#1. Define your scope
Defining your scope keeps the analysis focused and the timeline realistic. A few best practices for setting a clear scope:
- Keep the competitor set tight. Five to ten brands are usually enough. Fewer, and you lack a meaningful average; more, and the analysis becomes hard to maintain.
- Pick platforms where the comparison is fair. If a competitor has a strong Instagram presence but barely posts on LinkedIn, including LinkedIn in your analysis will produce noisy data. Match platforms to where each competitor is active.
- Choose a long enough timeframe. A single month is rarely enough. Ninety days is a reasonable period for most analyses. Longer windows are preferable for data depth.
- List your metrics by tier. Group them into strategic, tactical, and diagnostic, as described in the previous section.
#2. Collect and curate the data
The goal of data collection and curation is to obtain a dataset you trust enough to make decisions based on. If you're second-guessing the numbers, you'll second-guess the conclusions too.
- Use a consistent calculation method across every brand. An engagement rate calculated as interactions over followers for one brand and as interactions over reach for another will produce a false comparison. Apply the same method every time.
- Pull both quantitative and qualitative inputs. Numerical metrics tell you what's happening; comments, sentiment, and visual content patterns tell you why. The most useful benchmarking reports include both.
- Centralize your social media data collection. Manually pulling data from each platform for each competitor is the fastest way to introduce errors and burn yourself out. My advice is to use a tool that aggregates data from multiple platforms and provides comparative dashboards.
#3. Identify where you lead, lag, and have untapped opportunity
Map your findings into one of the three following categories to make the analysis actionable. A finding that doesn't fit into any of them is probably an observation, not an insight.
- Where you lead is anywhere you outperform the competitor average, like a content pillar where your engagement is higher or a platform where your growth rate is stronger. The strategic move here is to define what works and why, and keep doing it.
- Where you lag is where your brand performance trails the category, like formats where competitors are getting more engagement or platforms where you're growing slower. The strategic question here is diagnosis: is the gap a resource problem, a creative problem, or a strategy problem? The answer determines what you do next.
- Where you spot untapped potential is something neither you nor your competitors are doing, like relevant themes everyone is ignoring or social media trends you’re skipping. The strategic question is whether the gap exists because no one has tried (opportunity) or because your audience isn't interested (trap).
#4. Translate findings into strategic actions (not just observations)
As Yainire put it earlier, an analysis without action is just a beautiful PDF. She explains how to avoid that and treat benchmarking strategically:
"To me, competitive benchmarking is not an optional step; it is the foundation of any digital ecosystem, and its influence on decisions is total:
- In content (avoiding homogenization): Comparative analysis is not used to determine 'what to publish,' but rather to identify what to stop publishing because the market is already saturated. It allows you to see if your content has fallen into the homogenization trap: if you cover your brand's logo and your competitor's logo, and the posts look exactly the same, you have a differentiation problem. By understanding which formats and narratives are overexploited, you consciously decide to look for the 'blue ocean' of content. If the entire sector is making hyper-edited videos with colorful captions, the analysis gives you the guideline of where not to go, allowing you to stand out with rawer, more native, and transparent formats.
- In business (spotting opportunities): It helps you detect positioning opportunities or service gaps. For example, if by analyzing the competition's comments you notice that their customers constantly complain about slow customer service, the business decision is clear: we will structure our value proposition and our communication around immediacy and human support.
In short, it helps us stop competing on price or volume and forces us to compete on relevance and originality."

To get to that kind of output, each finding in your analysis should be paired with a specific action, owner, timeframe, and metric. The actions then feed back into your social media content strategy, which is what makes the benchmarking process compound over time.
#5. Report insights to stakeholders
Reporting insights to stakeholders effectively determines whether your benchmarking work influences decisions or sits unread on a shared drive. A few principles for impactful benchmarking reports:
- Lead with the headline, not the methodology. Stakeholders want to know what you found and what you're going to do about it.
- Frame every chart with a takeaway. A chart without an interpretive sentence places the burden of analysis on your audience. Avoid that and clearly state the insight.
- Match the depth to the audience. A weekly review with the social team can go deep into post-level data. A quarterly readout with the CMO should stay at the strategic level. For executive reporting, the keyword is brevity.
- Show the trend, not just the snapshot. A single quarter of data is easy to argue with. A line showing three or four quarters of consistent movement is much harder to dismiss.
#6. Set a benchmarking cadence
Without a regular rhythm, benchmarking tends to be reactive, following a competitor’s move that catches leadership's attention. However, reactive analysis is typically rushed and incomplete, leading to unconvincing actions.
The right cadence depends on how fast your category moves and how much capacity the team has:
- Monthly cadence works well for fast-moving B2C categories: consumer brands, entertainment, and anything where trends turn over quickly.
- Quarterly cadence is the most common rhythm and a good default for most B2B brands. It gives you enough data to spot trends, leaves room for proper analysis, and aligns naturally with planning cycles.
- Semiannual or annual deep dives are analyses in which you step back from operational metrics to look at category-level changes, repositioning by major competitors, and big swings in audience behavior.
Helpful tools for competitive benchmarking
The right competitor benchmarking tool is one that pulls consistent data across platforms, maintains sufficient historical data to spot trends, and lets you analyze content at a sufficiently granular level to act on what you find. Without those three things, you'll spend more time wrestling with the data than learning from it.
Key capabilities to look for: historical data depth, cross-platform coverage, content-level analysis
- Historical data depth. Looking only at the last 30 days is seriously limiting. You need at least 6-12 months of data to spot real seasonality, big shifts, and to get context for changes.
- Cross-platform coverage. Most brands now operate across four to six platforms, and a tool that covers Instagram well but treats TikTok or LinkedIn as an afterthought will leave gaps in your analysis. Look for consistent metric definitions and reporting across platforms.
- Content-level analysis. Aggregate numbers are as important as content-level data. Being able to drill into individual posts, group them into pillars, and compare engagement by format across competitors is where you’ll find your action points.
Native platform analytics vs. third-party tools — where each falls short
Native platform analytics and third-party tools serve different purposes.
Native analytics (Meta Insights, LinkedIn Page Analytics, TikTok Studio) provide accurate data for your own accounts. Where they fall short is competitor data: you can't see another brand's reach, engagement, or audience demographics through their native tools. You're limited to what's publicly visible, and you have to pull it manually for each competitor on each platform.
Third-party tools are built to close that gap. For example, Socialinsider is a social media analytics and competitive benchmarking platform that tracks competitor performance across Instagram, TikTok, Facebook, LinkedIn, YouTube, and X, used by social media leader to compare follower growth, engagement rate, reach, posting frequency, content pillar mix, and video views across multiple competitor accounts simultaneously.
Its core capabilities include:
- Cross-platform competitor tracking across Instagram, Facebook, TikTok, LinkedIn, X, YouTube, and Pinterest from a single workspace, with consistent metric definitions across every channel.
- Historical data so you can spot seasonality and long-term trends, rather than being stuck in a 30-day view.
- Custom benchmark groups that let you build separate views for direct, indirect, and aspirational competitors, and compare yourself against each set individually.
- Content pillar analysis that automatically groups posts into themes and shows which pillars are pulling the strongest engagement for each brand.
- Top post and format breakdowns to study the specific content driving outsized results across your competitor set.
- Industry benchmarks built from aggregated data, so you can compare your performance against category averages, not just your direct peer set.
- Exportable reports that turn the analysis into shareable deliverables for stakeholders.
Common competitive benchmarking mistakes
The competitive benchmarking mistakes below come up across nearly every team that runs the analysis without a clear process:
- Benchmarking without goals = collecting data, not social media intelligence. If you start with metrics rather than questions, you'll end up with a report that describes the competitive landscape without telling you what to do about it.
- Not adding cross-platform data for the full context. Looking at one platform in isolation will almost always mislead you. A competitor that looks weak on Instagram might be putting their best work on TikTok. Pulling competitive insights from every channel your competitors are active in gives you the full view.
- Copying competitors instead of finding strong differentiation angles. Benchmarking shows you what competitors are doing well, and the instinct is to do the same thing. But if three competitors are all using similar narratives, copying them puts you in a crowded space. The stronger move is to find a gap that you can fill and own.
Expert Yainire Martínez de Ilarduya Sánchez completes the picture:
"The most common mistake is falling into the dictatorship of pure, out-of-context data. Digital marketing happens in a living environment, and looking at a competitor's chart without understanding its variables is a blind diagnosis.
Specifically, I see three major mistakes:
- Not calibrating the budget: Ignoring the paid media investment or other resources behind their numbers, which leads us to unfair comparisons.
- Ignoring the cultural context: Failing to consider the codes and the environment of the specific audience they are speaking to.
- Analyzing isolated impacts: Obsessing over individual posts while forgetting the overarching narrative or global storytelling that the brand has been building over the long term.
How to avoid it? By changing the perspective. We must stop doing 'copy-and-paste benchmarking' and start doing a critical analysis. Numbers only tell us what is happening; our job as strategists is to understand the where (cultural context), the with what (budget), and the why (narrative) to be able to make real business decisions."
Final thoughts
Competitive benchmarking only pays off when it leads to decisions. Clear questions, the right competitor set, layered metrics, and cross-channel interpretation will get you there.
Repetition is also essential. Teams that benchmark on a steady cadence, translate findings into experiments, and refine their approach in each cycle are the ones making the most out of competitive benchmarking.
Lastly, don’t be a data hero, collecting and curating everything manually. Nowadays, that’s a battle lost from the get-go. Leverage competitive benchmarking tools to get access to real insights.
Frequently asked questions on competitive benchmarking
Why is competitive benchmarking important?
Competitive benchmarking is important because it gives you context for decisions. Judging your performance in a vacuum is misleading. A 5% growth in engagement feels like a win until you learn the category grew 10%. Through benchmarking, you learn how you’re performing, where you're falling behind, and which opportunities competitors haven't claimed yet.
How should benchmarking inform your content calendar, budget allocation, and channel strategy?
Benchmarking should shape each of these decisions differently:
- Content calendar: Use it to optimize content formats and themes. Saturated formats are a sign to differentiate or move on, while strong-performing pillars in the category point to gaps worth filling in your own social media content mix.
- Budget allocation: Concentrate resources where competitors get strong returns on modest effort, not where they're posting heavily, but engagement stays flat.
- Channel strategy: Benchmark each platform separately. Growth and engagement patterns vary widely, and the data tells you which channels are gaining traction in your category and which to deprioritize.
Sabina Varga
Content marketing expert with 15 years of experience in digital marketing. I dream of beach life but love the city as a multitasking mom juggling playgrounds, books, brunches, and travels.

Know what your competitors do — before your manager asks
Get instant social benchmarks & reports without manual work.