Social Media Value: How to Measure What Your Likes, Followers, and Shares Are Worth
Social media value breaks into three layers: attention, engagement, and business value. Learn the KPIs, benchmarks, and framework to measure it.


I can only imagine how many times you've made a post, watched the likes and followers climb, and still wondered if any of it moved the business forward, which is really the reason behind measuring social media value.
A like can feel good, and a growing follower count can feel like progress. These engagement metrics matter; I still get a small thrill when my own posts pick up likes, and I won't lie, a follower jump puts me in a good mood for the rest of the day.
But that doesn't answer the question: did any of it translate into revenue, leads, or growth?
In this guide, I'll walk you through how to measure social media value, put a real worth on the likes and followers you're already tracking, and turn that into a number your CMO or client can act on.
Key takeaways
- Social media value measurement differs by organizational level: CMOs track revenue attribution, cost per lead, and market share, while social media teams track engagement rate, reach, and follower growth.
- Social media value breaks down into three layers that build on each other: attention value (reach, impressions, share of voice), engagement value (likes, comments, shares, saves), and business value (traffic, leads, revenue attribution, brand lift).
- Building an earned media value measurement framework requires five sequential steps: mapping social goals to business objectives, choosing one primary KPI per platform, establishing industry and historical baselines, setting a reporting cadence matched to stakeholder decision cycles, and translating metrics into business language for leadership.
What "value" means at different levels of an organization
A CMO measures social media value in revenue, leads, market share, and customer acquisition cost. A social media team measures it in engagement rate, reach, follower growth, and impressions.
The table below compares what each level tracks and what counts as a win for them:
Instead of checking Instagram's dashboard, then TikTok's, then LinkedIn's separately, a tool like Socialinsider pulls brand performance metrics, like engagement rate, reach, and follower growth from every platform into one place, so interpreting social media analytics starts from one clean set of numbers. If you're not sure where to start, here's how to use Socialinsider to get there.
The harder part is turning that combined data into a number tied to data-driven marketing goals. That's what earned media value measurement is built to solve, starting with the three layers social media value breaks down into.
Three important layers of social media value
There are three layers to social media value, and leaving one out skews your social media metrics.
Layer 1 — Attention value: reach, impressions, share of voice
Attention value measures if content got in front of people. It's the first layer because nothing downstream works if nobody saw the post in the first place.
Reach counts how many unique people saw the content. Impressions count how many times it was displayed, including repeat views from the same person.
These are also the numbers most social media data collection tools pull first, since they're the easiest to track consistently across platforms.
Share of voice adds more context. It compares your visibility against competitors, ideally through cross-platform analytics rather than one channel at a time.
- Rising reach with falling share of voice means a competitor is growing faster than you.
- Flat reach with rising share of voice can mean the whole category is quieting down, not just your content.
None of these metrics say anything about quality yet, but they're the starting point for estimated media value, since reach and impressions are the first inputs in that calculation.
Layer 2 — Engagement value: what engagement actually signals about audience quality
Engagement value measures what happens after someone sees your content: If they liked it, commented, shared it, or scrolled right past.
Not all engagement carries the same weight. A "like" takes almost no effort and mostly signals passive approval. A comment or share takes more effort, which means the content made someone stop and react.
This is also where audience engagement strategies start to matter, since the goal isn't just getting more reactions; it's getting the reactions that reflect genuine interest.
Engagement rate ties this back to attention value from the first layer. A small audience with high engagement often signals a more invested community than a large audience with low engagement, which is part of why reach alone can be misleading.
None of this tells you if any of it turned into revenue, which is the business value.
Layer 3 — Business value: traffic, leads, revenue attribution, brand lift
Business value measures what social media did for the business. It includes:
- Traffic: tracks if people left social media and landed on your site
- Leads: tracks if that visit turned into a name, email, or form submission.
- Revenue attribution: ties that lead, or that sale, back to the specific post or campaign.
Brand lift is the odd one here; it measures if people are more aware of or more favorable toward the brand after seeing the content, usually through surveys or search volume changes.
This is the layer most reporting skips, because revenue attribution and brand lift take more work than traffic or leads, and that is what measuring earned media value comes down to once you have all three layers in place.
What is a follower, a view, or a share actually worth?
None of the numbers from the last three layers mean much until you attach a dollar figure to them. That's where proxy value comes in, assigning an actual worth to a follower, a view, or a share based on your own conversion data.
So, what is earned media value? It is the estimated dollar amount you would have paid to achieve the same reach or engagement through ads, informed by your own performance and conversion data.

Take, for example, Socialinsider's Instagram Organic Value calculator, shown in the image above. It splits organic value into three categories, each carrying its own dollar figure:
- Engagement
- Awareness impact, broken down further into reach and views
- Audience growth
In awareness impact, reach, and views each carry a per-unit price. Add every category together, and that's how you land on one earned media value index, a single number that represents everything social earned you that period.
If you know your average lead is worth $50 and social drives 2% of your leads, you can work backward from there to figure out what a single engagement is roughly worth to you.
To learn more on how to use it yourself, Socialinsider's Organic Value guide walks through how the calculations work.
Additional metrics that prove social media value
Beyond the three layers, a few specific metrics come up often enough that they deserve their own breakdown, starting with engagement rate.
Engagement rate (by platform, by content format)
Engagement rate tells you if a piece of content is performing well relative to the size of the audience it reached or if it just looks good because the account is big.
The number that counts as "good" changes depending on the platform and the content format, which is why comparing your engagement rate to a single flat benchmark across all your channels leads to the wrong conclusion.
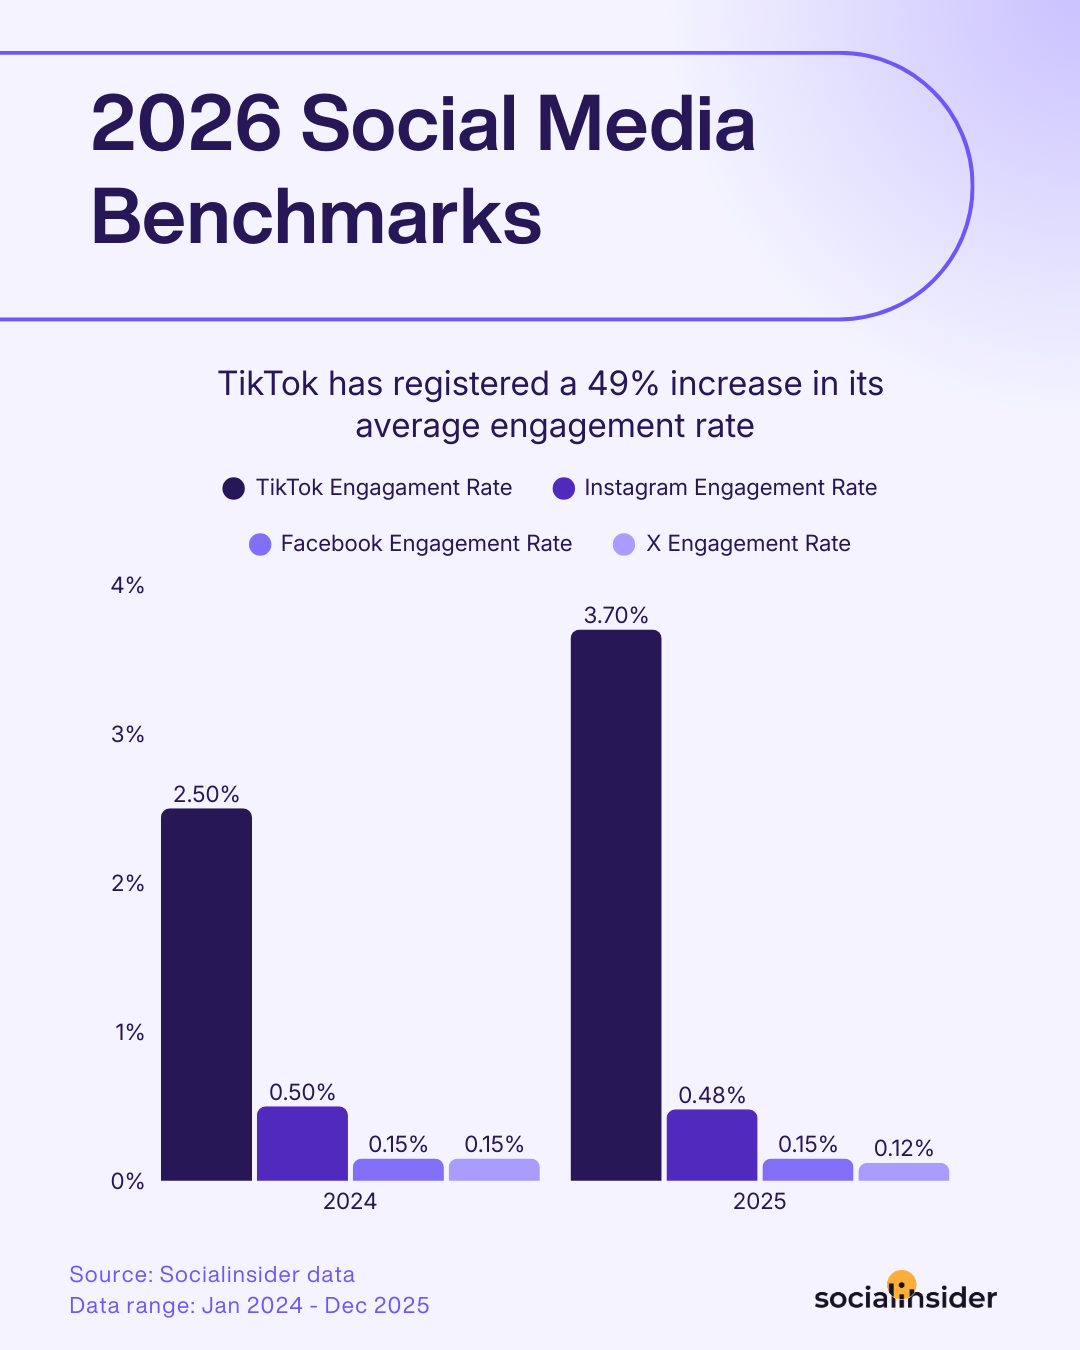
The chart above shows why a single flat benchmark across platforms doesn't work. In 2025, TikTok's average engagement rate sat at 3.70%, compared to 0.48% on Instagram, 0.15% on Facebook, and 0.12% on X. TikTok's rate alone grew 49% from the year before, while the others barely moved.
Judge a TikTok post against a flat 1% benchmark, and it looks mediocre. Judge it against the right platform benchmark, and it's actually underperforming for its own channel.
A benchmark gives a number a reference point to be judged against rather than leaving it to stand alone with no context. That comparison is an important part of measuring earned media value accurately.
Socialinsider's social media benchmark reports break down average engagement rate by platform and content format, and knowing how to use that data properly turns a benchmark from a nice-to-have into an actual decision-making tool.
Social-driven traffic and conversion tracking (UTMs, dark social considerations)
UTMs are tags added to a link that show your analytics tool precisely which post, platform, or campaign sent someone to your site.
Dark social is the opposite. It's traffic that came from social, but through a channel your tools can't track, like when someone copies your link and pastes it into a WhatsApp chat, a text message, or a private group instead of clicking directly on the platform.
Your analytics tool has no way to see where that click came from, so it gets counted as "direct traffic."
The practical takeaway is that your traffic numbers are almost always undercounting what social drives, which means earned media value from social media gets underestimated too, unless you're actively tagging every link you can. This is also why cross-platform social media marketing efforts tend to look less effective on paper than they are in reality.
How to build an earned media value measurement framework
This is the point where mapped goals, chosen KPIs, and benchmarks stop being separate ideas and start working as one system. Each step below builds directly on the one before it.
Map social goals to business objectives
Start by taking a social goal like growing engagement, growing reach, or growing followers and tying it to a specific business objective.
Once a social goal is mapped this way, every metric inherits a business reason for existing. This mapping step is the start of a repeatable social media process for earned media value in social media.
Choose primary vs. secondary KPIs per platform
With the goal mapped, the next step is picking one primary KPI per platform.
On Instagram, that might mean saves are primary, and likes are secondary. I check saves before I even look at likes; a save tells me someone found the content worth coming back to, while a like just tells me they scrolled past and tapped once.
Treating every metric as equally important is the same mistake as using one flat benchmark across platforms. It buries the number that counts under a pile of numbers that don't.
Establish baselines using benchmarks (industry + historical)
Once the right KPI is chosen, it needs to be measured against something, which is where baselines come in.
- Industry benchmark: how your numbers compare to everyone else in your space.
- Historical benchmark: if you're improving against your own past, regardless of what the industry average is doing.
Together, these two baselines turn the KPI chosen into a number that shows if your social media marketing is working.
Set a reporting cadence that matches your stakeholders' decision cycles
Once a baseline exists, decide how often to report it based on your stakeholders' calendar, not yours.
A CMO reporting to a board might only need numbers monthly or quarterly. A social media team optimizing content week to week needs numbers far more often, which is just a matter of following social media analytics best practices for who's using the data and when.
Translate metrics into business language for leadership reports
The final step is translating metrics into the language a CMO already thinks in.
- Reach = Awareness
- Engagement rate = Audience quality
- Follower growth = Owned audience growth
- Saves/shares = Purchase intent signals
A CMO shouldn't have to translate "engagement rate" into a business term themselves; that's friction that slows down the decision, and you don’t want that.
Platform-by-platform value signals: what to measure where
The metric that proves value on one platform isn't always the metric that proves it on another, so the platform has to shape what you measure.
Instagram: saves and shares as deeper intent signals over likes
On Instagram, saves and shares double as a signal to the algorithm; Instagram's own ranking system weighs them more heavily than likes when deciding how far to distribute a post.

Here's an example for our own account. As you can see, shares grew far faster than saves did over the period previously. A rise in shares meant people were motivated enough to actively pass the content to someone else, while the steadier rise in saves shows a smaller group planned to come back to it later.
A save tends to signal that someone plans to act on the content later, which is closer to purchase or usage intent than general Instagram engagement. That's why it's a stronger business signal than a like.
LinkedIn: engagement quality, profile visits, follower seniority
The metrics worth paying attention to on LinkedIn are engagement quality, profile visits, and follower seniority.
- Engagement quality: who's reacting to your content.
- Profile visits: If someone was curious enough to click through and learn more about your page.
- Follower seniority: If the people following you are in a position to make a purchase decision.
Together, these three form the real base of a LinkedIn growth strategy, not follower count alone.
TikTok: watch time and completion rate
As someone who's an avid TikTok user/creator myself, I can confidently tell you that watch time and completion rate are the metrics you should measure.
- Watch time: how long people stayed on the video.
- Completion rate: what percentage of viewers watched all the way to the end.
A video can rack up thousands of views while most people drop off in two seconds; raw view count won’t show you that. This is what Socialinsider's TikTok analytics are built to surface.
These two numbers also feed into estimated media value on TikTok, since the platform's algorithm rewards watch time with more distribution, meaning a high completion rate often predicts future reach before it shows up in your numbers.
Facebook: reach trends, community engagement, and dark social referrals
Facebook rewards patience more than most platforms, which is why reach trends, community engagement, and dark social referrals matter more here than any single post's numbers.

A recommendation that I have for you is to look beyond a month's performance and analyze the trend in the long run.
X/Twitter: share of voice, brand mention sentiment
Share of voice and brand mention sentiment matter on X because conversations there move fast and often happen without you tagging along.
- Share of voice: how much of the conversation around your category is about your brand versus competitors.
- Brand mention sentiment: If people are talking about you positively, negatively, or neutrally.
A brand could be mentioned constantly and still be losing if most of those mentions are complaints. Share of voice alone would show growth. Sentiment tells you if that growth is good news.
Final thought
Social media value was never really about the numbers themselves; it's about what you do with them once you have them. Once you know what a follower or a share is actually worth, reporting stops being a defense of the budget and starts being proof that it's working.
If you want to see this kind of breakdown for your own accounts, try Socialinsider for free for 14 days.
Gift Ilevbare
Gift Ilevbare is a freelance writer and social media strategist for B2B SaaS and B2C brands.

Know what your competitors do — before your manager asks
Get instant social benchmarks & reports without manual work.