19 Valuable Instagram Metrics for Successful Marketers
Explore key Instagram metrics that matter. Gain insights into your performance and learn how to effectively engage your followers for growth.

One thing I've learned after years of building Instagram strategies for brands: metrics alone don't make you smarter about your strategy. What matters is reading into your social media analytics.
Instagram has metrics on everything. But as social media professionals, it's up to us to choose them wisely and know how to interpret the signals they're giving us.
In this guide, I'm breaking down the Instagram metrics worth your attention — what they measure, when to track them, and how to use them to make better decisions. Let's get into it!
Key takeaways
- Don’t track everything at once: Focus on the metrics that align with your goals and contribute to a better strategy on Instagram.
- Put your numbers in context: Numbers alone tell you close to nothing — compare them with your competitors’ results, industry benchmarks, and your own previous performance.
- Use competitor insights to set realistic benchmarks: Industry-wide data is helpful, but tracking specific competitors gives you actionable context. Socialinsider automates competitor tracking so you can focus on strategy instead of manual data collection.
- Tie your metrics back to business outcomes: Engagement is great, but conversions, ROI, and ROAS show real impact. Connect your Instagram efforts to revenue whenever possible to prove value to stakeholders.
How to tie your Instagram metrics to business growth?
Social media metrics are many, and Instagram offers a lot of data for you to track and use to refine your strategy.
But tracking all of it at once doesn’t give you clarity — it only gives you data fatigue.
To tie your metrics to business growth, you need to understand where each metric comes from and what it tells you about your performance. Seeing these cause-and-effect connections helps you figure out which thread to pull to get the result you're after.
For example, if reach is up but engagement is flat, your content is getting in front of people but not resonating. If follower growth is strong but conversions are weak, your CTA might be too weak, or you're attracting the wrong audience.
Understanding these relationships turns raw numbers into things you can apply to your strategy.
What Instagram metrics will help you make informed decisions?
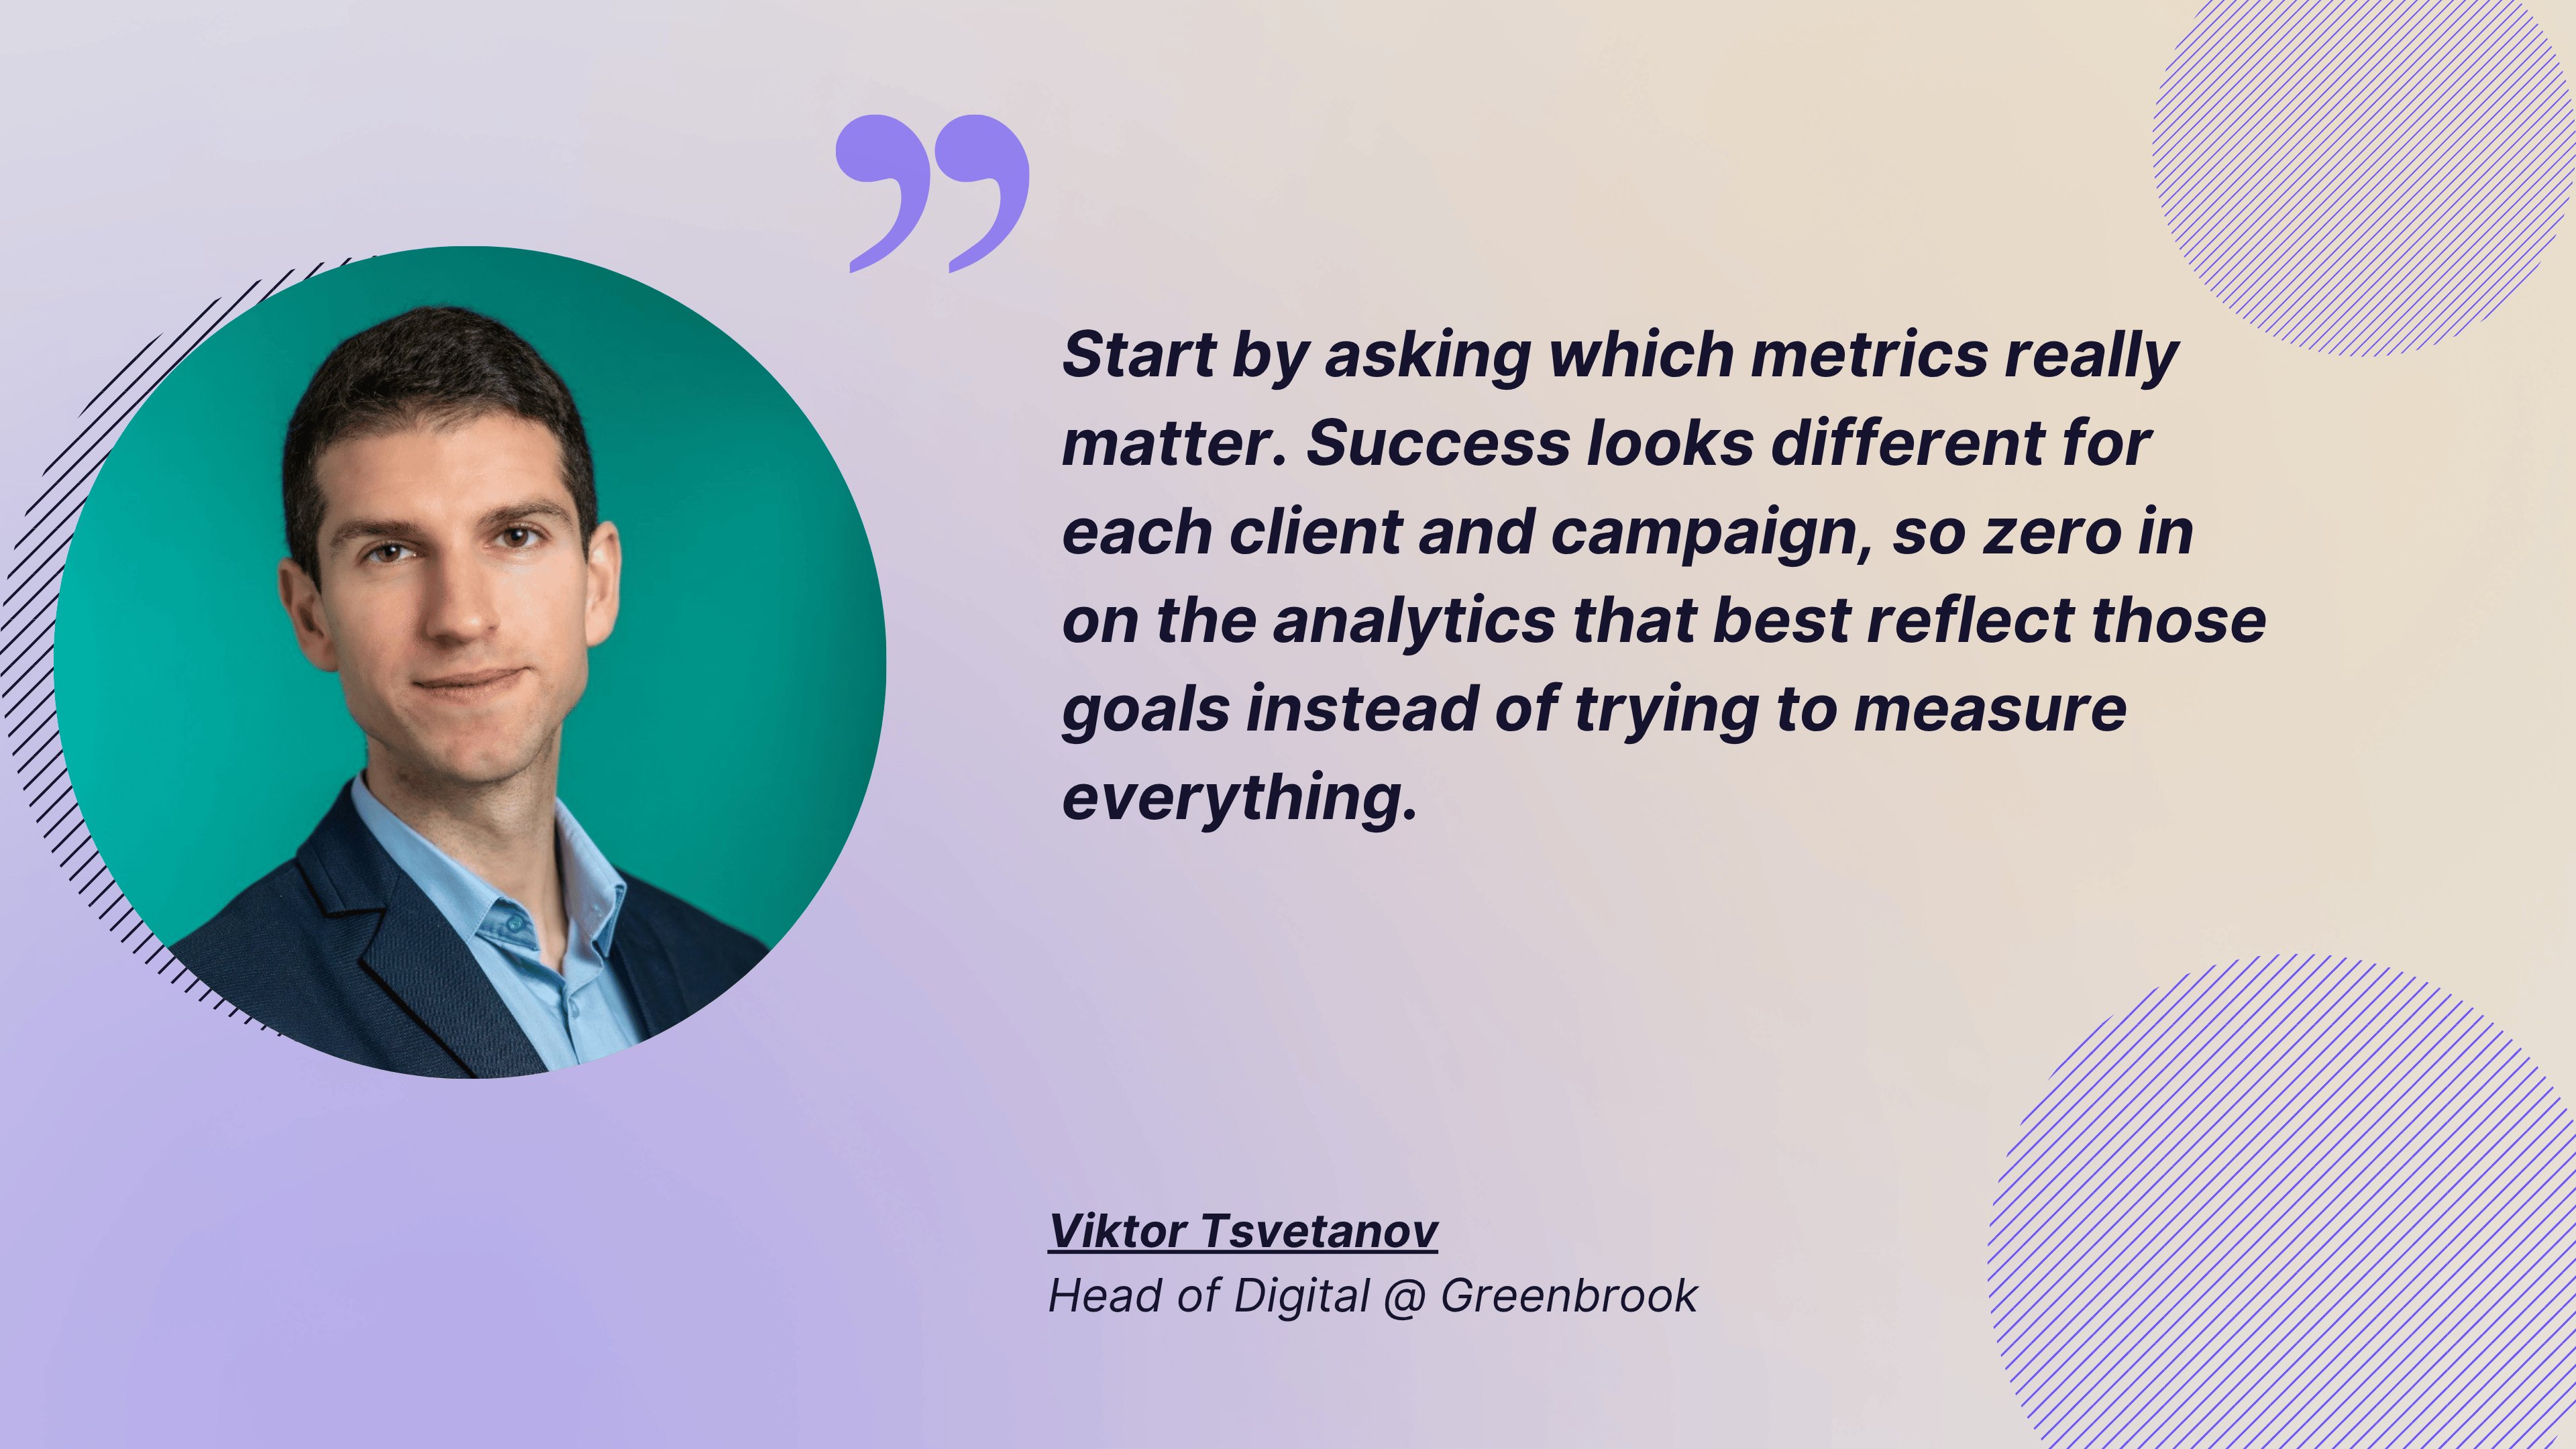
When it comes to choosing the right social media metrics to track, Victor Tsventavov puts it well:
Start by asking which metrics really matter. Success looks different for each client and campaign, so zero in on the analytics that best reflect those goals instead of trying to measure everything
Goals always define what you need to track above all else. Brand awareness and conversions will have different core metrics to determine whether your campaign is working or not, and if you’re tracking the wrong thing, it’s easy to miss a signal or misinterpret what the data’s telling you.
Let me break down the key Instagram metrics by category so you can use the data to create a better social media strategy.
Reach and visibility metrics
Reach and visibility metrics tell you how far your content is traveling. Whenever I work with brands on Instagram, these metrics always make it to the top of the executive reports.
Reach and views show how many people are seeing the posts, giving us context about what to expect from other metrics. If visibility metrics are down, it’s usually the first sign that the strategy is not delivering.
Reach
Reach on Instagram shows how many unique accounts saw your content. Think of reach as the size of your actual audience for a specific piece of content.
Instagram CEO Adam Mosseri has explained that there are two types of reach: connected reach and unconnected reach.
- Connected reach is people who follow you or have interacted with your account before.
- Unconnected reach includes everyone else — people discovering your content through Explore or Reels recommendations.
This division doesn’t affect your reach numbers per se. But since these two types of reach affect your ranking, it can help you choose the right social media tactic.
According to Mosseri, for growing connected reach, the main ranking factor is likes, and for unconnected reach, sends are slightly more important.
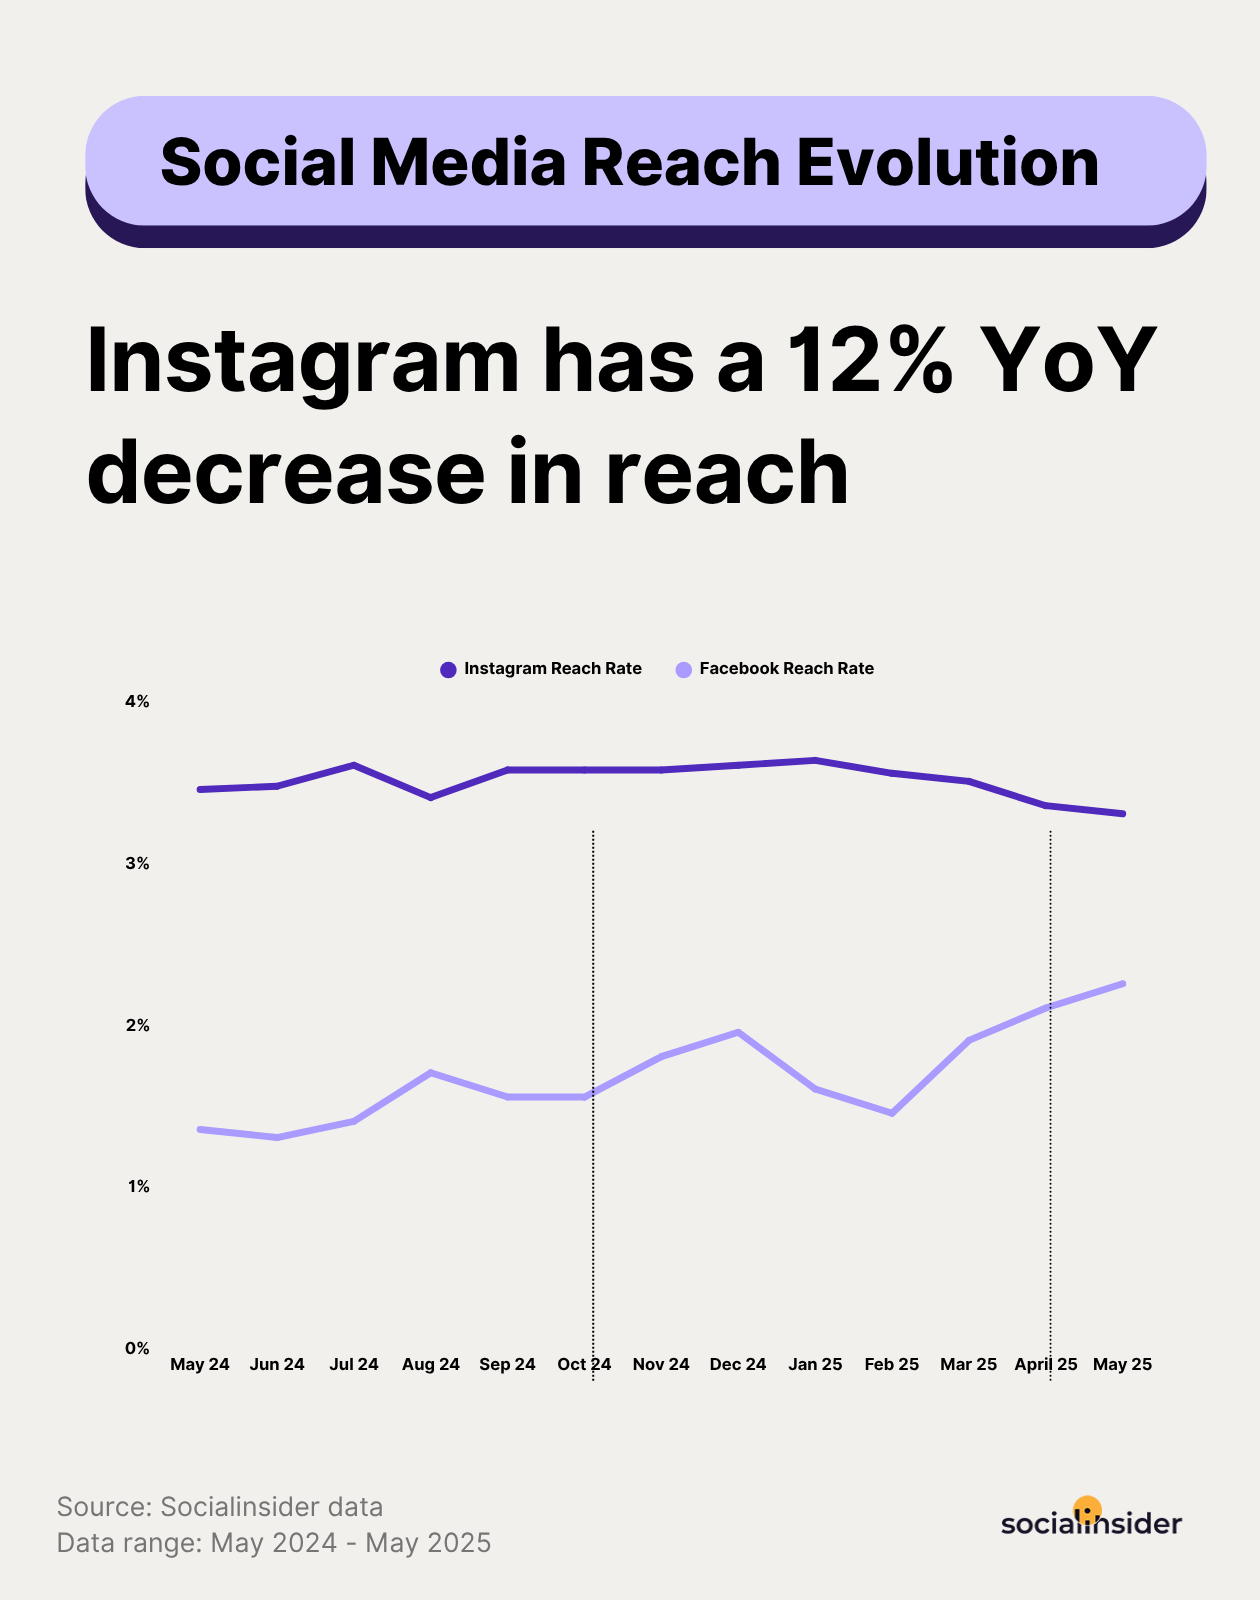
Keep in mind that algorithm changes hit the reach metric the hardest. Instagram frequently tweaks how it ranks content, and it can cause sudden reach drops or spikes. So if you notice a shift, it's not always about your content quality. Sometimes it's just the platform adjusting how it distributes posts.
Reach is my go-to metric when I need to measure the success of a brand awareness campaign, where I need to focus on calculating the new audience.
Views
Instagram views measure how many times your content was watched or seen in total. This metric recently replaced impressions as one of Instagram's core metrics, and the shift matters.
The difference between views and impressions lies in active attention. Views count when someone actively watches your video or stops to look at your image, while impressions used to count every appearance on screen, even if people scrolled right past.
Instagram made this change to give creators and marketers a clearer picture of the real attention you're getting, not potential exposure.
I've found views especially useful for video content. When my view count is strong, I know the hook did its job and stopped people from scrolling long enough to count it as a view.
But if views are lagging behind reach, that's my sign to rethink the opening seconds.
Instagram audience metrics
Understanding who engages with your content is just as important as knowing how many people see it.
Audience metrics help you verify you're reaching the right people and whether your strategy is building a real following.
Audience demographics
Instagram helps you analyze your social media audience on the platform. To do so, it offers three main criteria: location, gender, and age. This data shapes your content strategy and allows you to verify if you're reaching the right people.
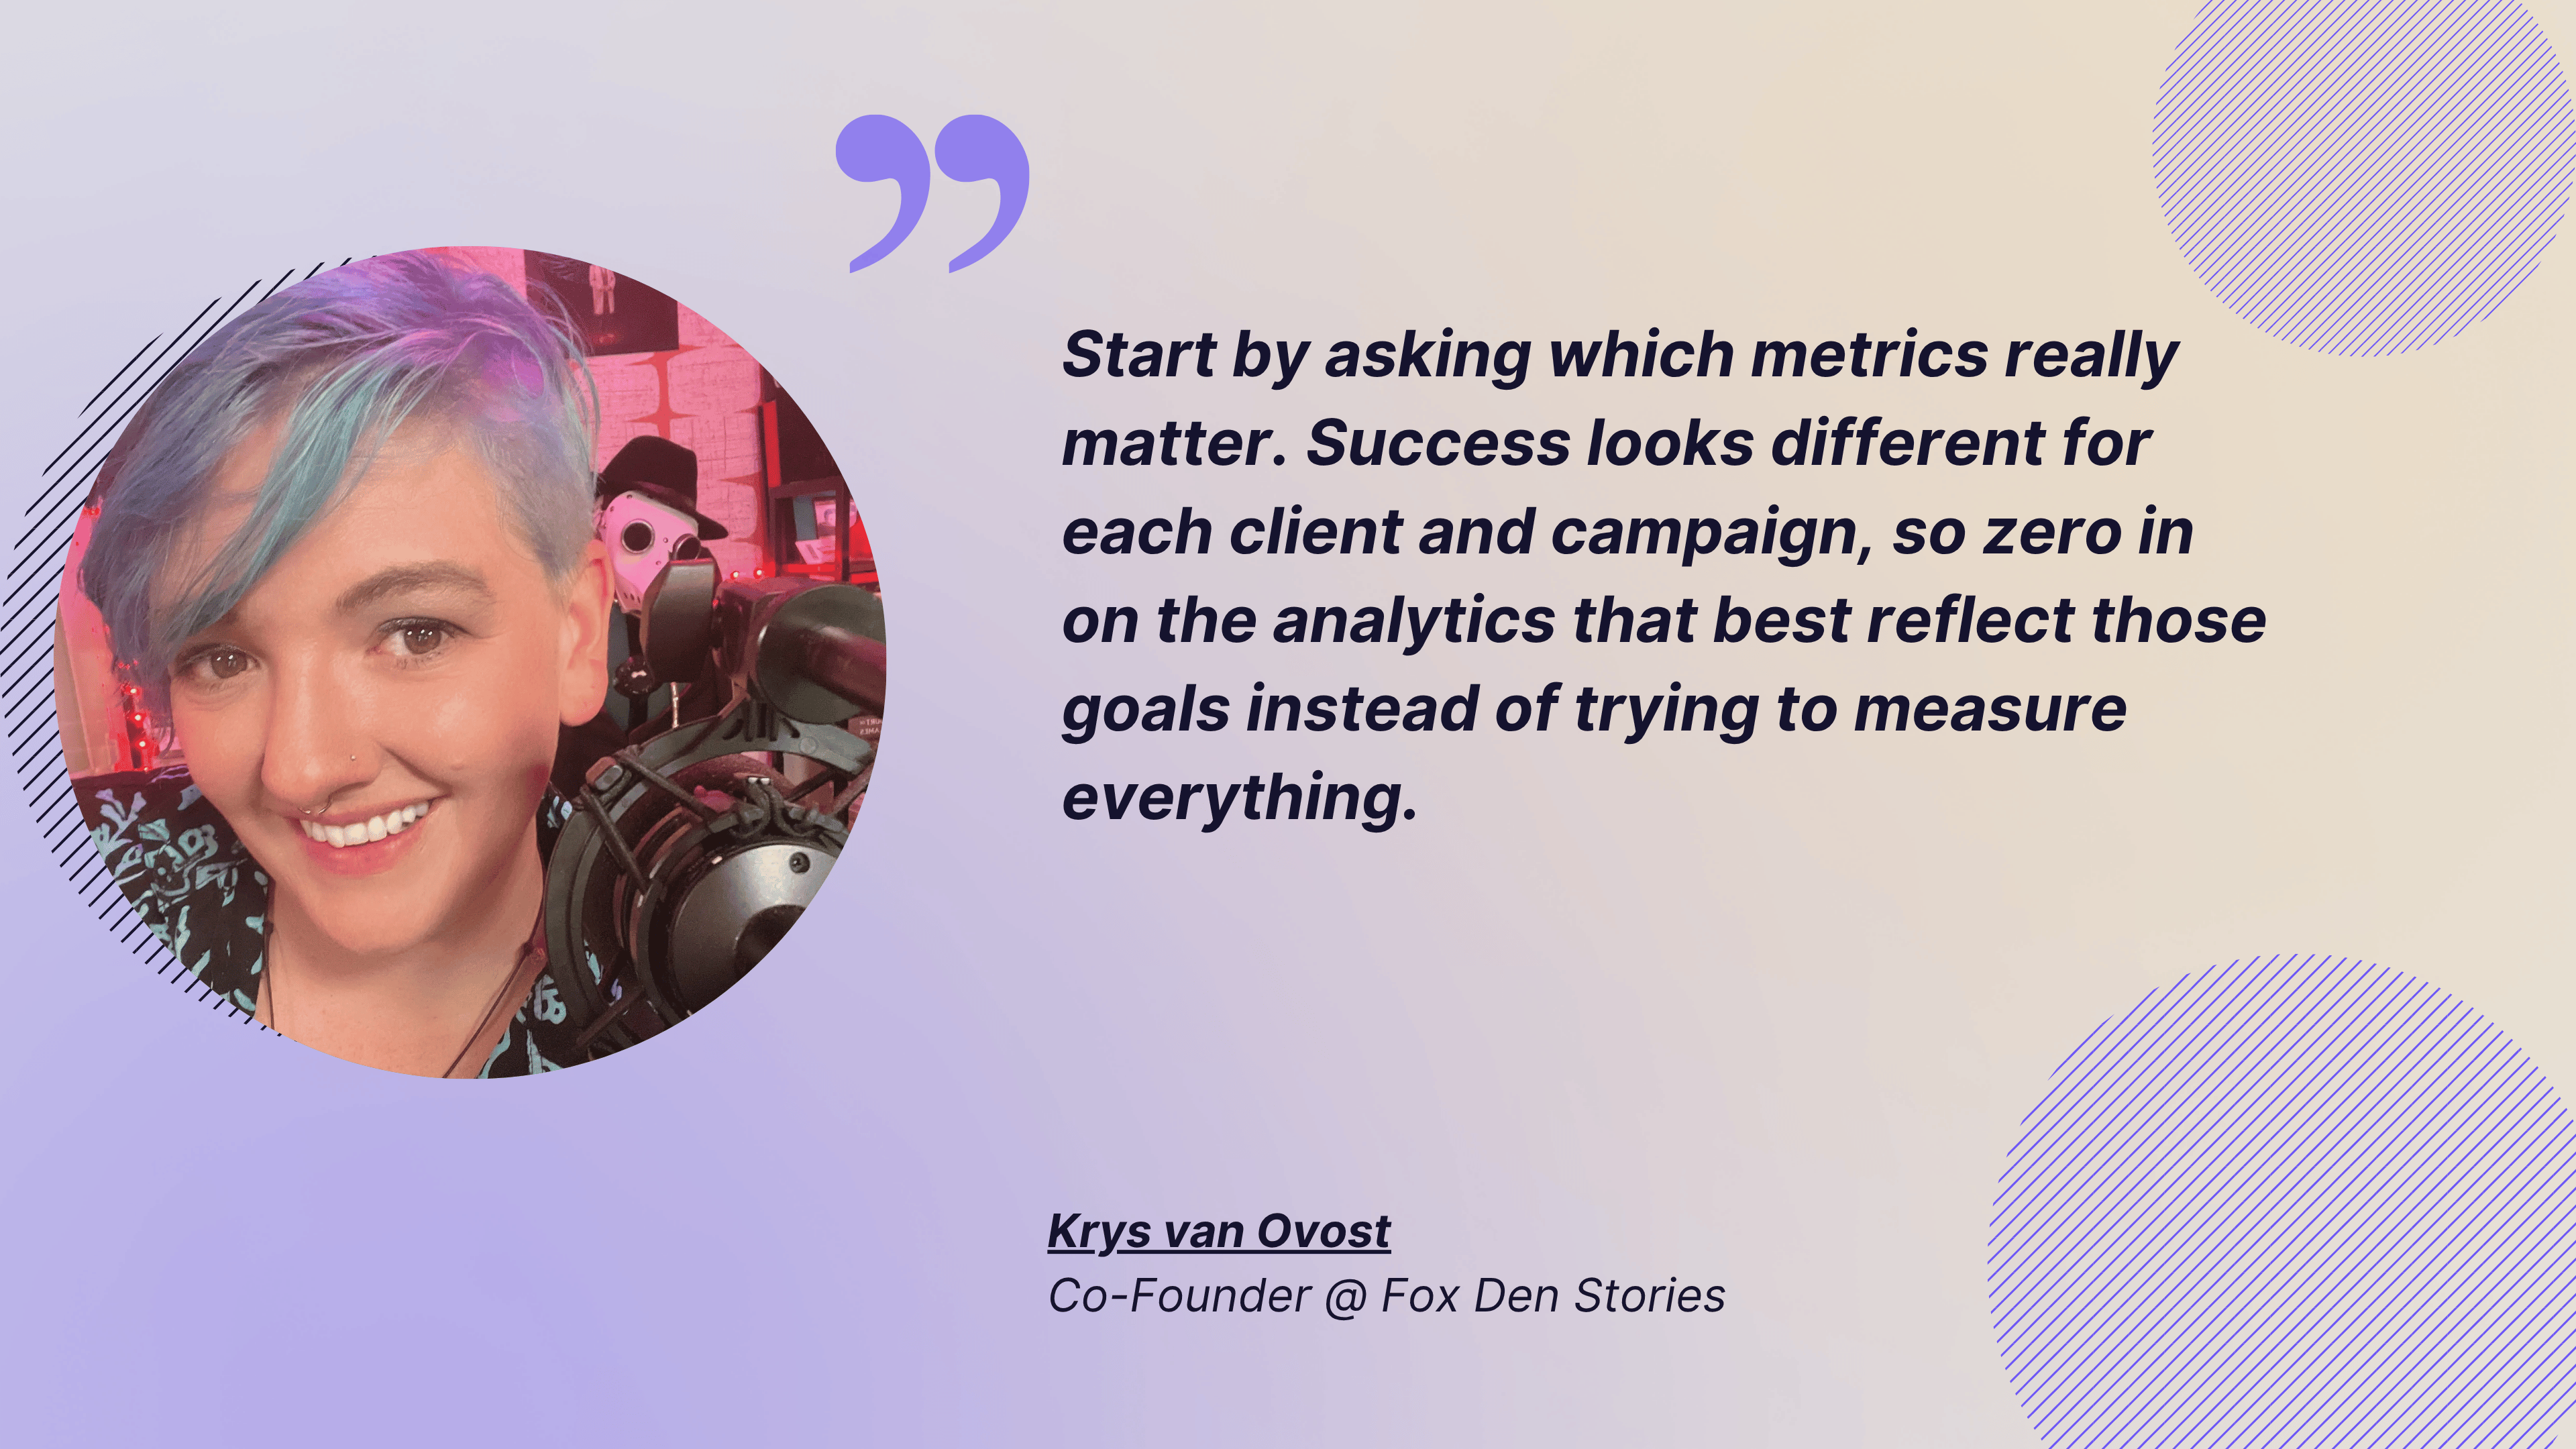
Kris Vanovost says:
I focus particularly on views, more specifically on who is looking at the socials and what demographic they are part of. If I am targeting millennial women, but the views are mostly from Gen Z men, something is majorly wrong.
A mismatch between your target audience and your actual audience usually signals a problem with your content or targeting.
But sometimes, it can also reveal an opportunity.
I had a client who was laser-focused on the U.S. market. That's where their buyer personas lived, and that's where we aimed all our Instagram content.
But as we analyzed the data, we kept seeing strong engagement from Brazil — consistently high views, shares, and comments.
Instead of reworking the content strategy fully, we dug deeper and found out that our product had real relevance in Brazil. We adjusted the strategy to include this territory as a secondary market, which opened up some additional revenue streams.
Follower growth
Follower growth is pretty self-explanatory. This metric shows if your Instagram account is growing, diminishing, or stagnating. This is especially important when you’re tracking organic growth.
Some people dismiss follower count as a vanity metric. But the follower growth history reflects whether your content strategy and brand awareness efforts are working.
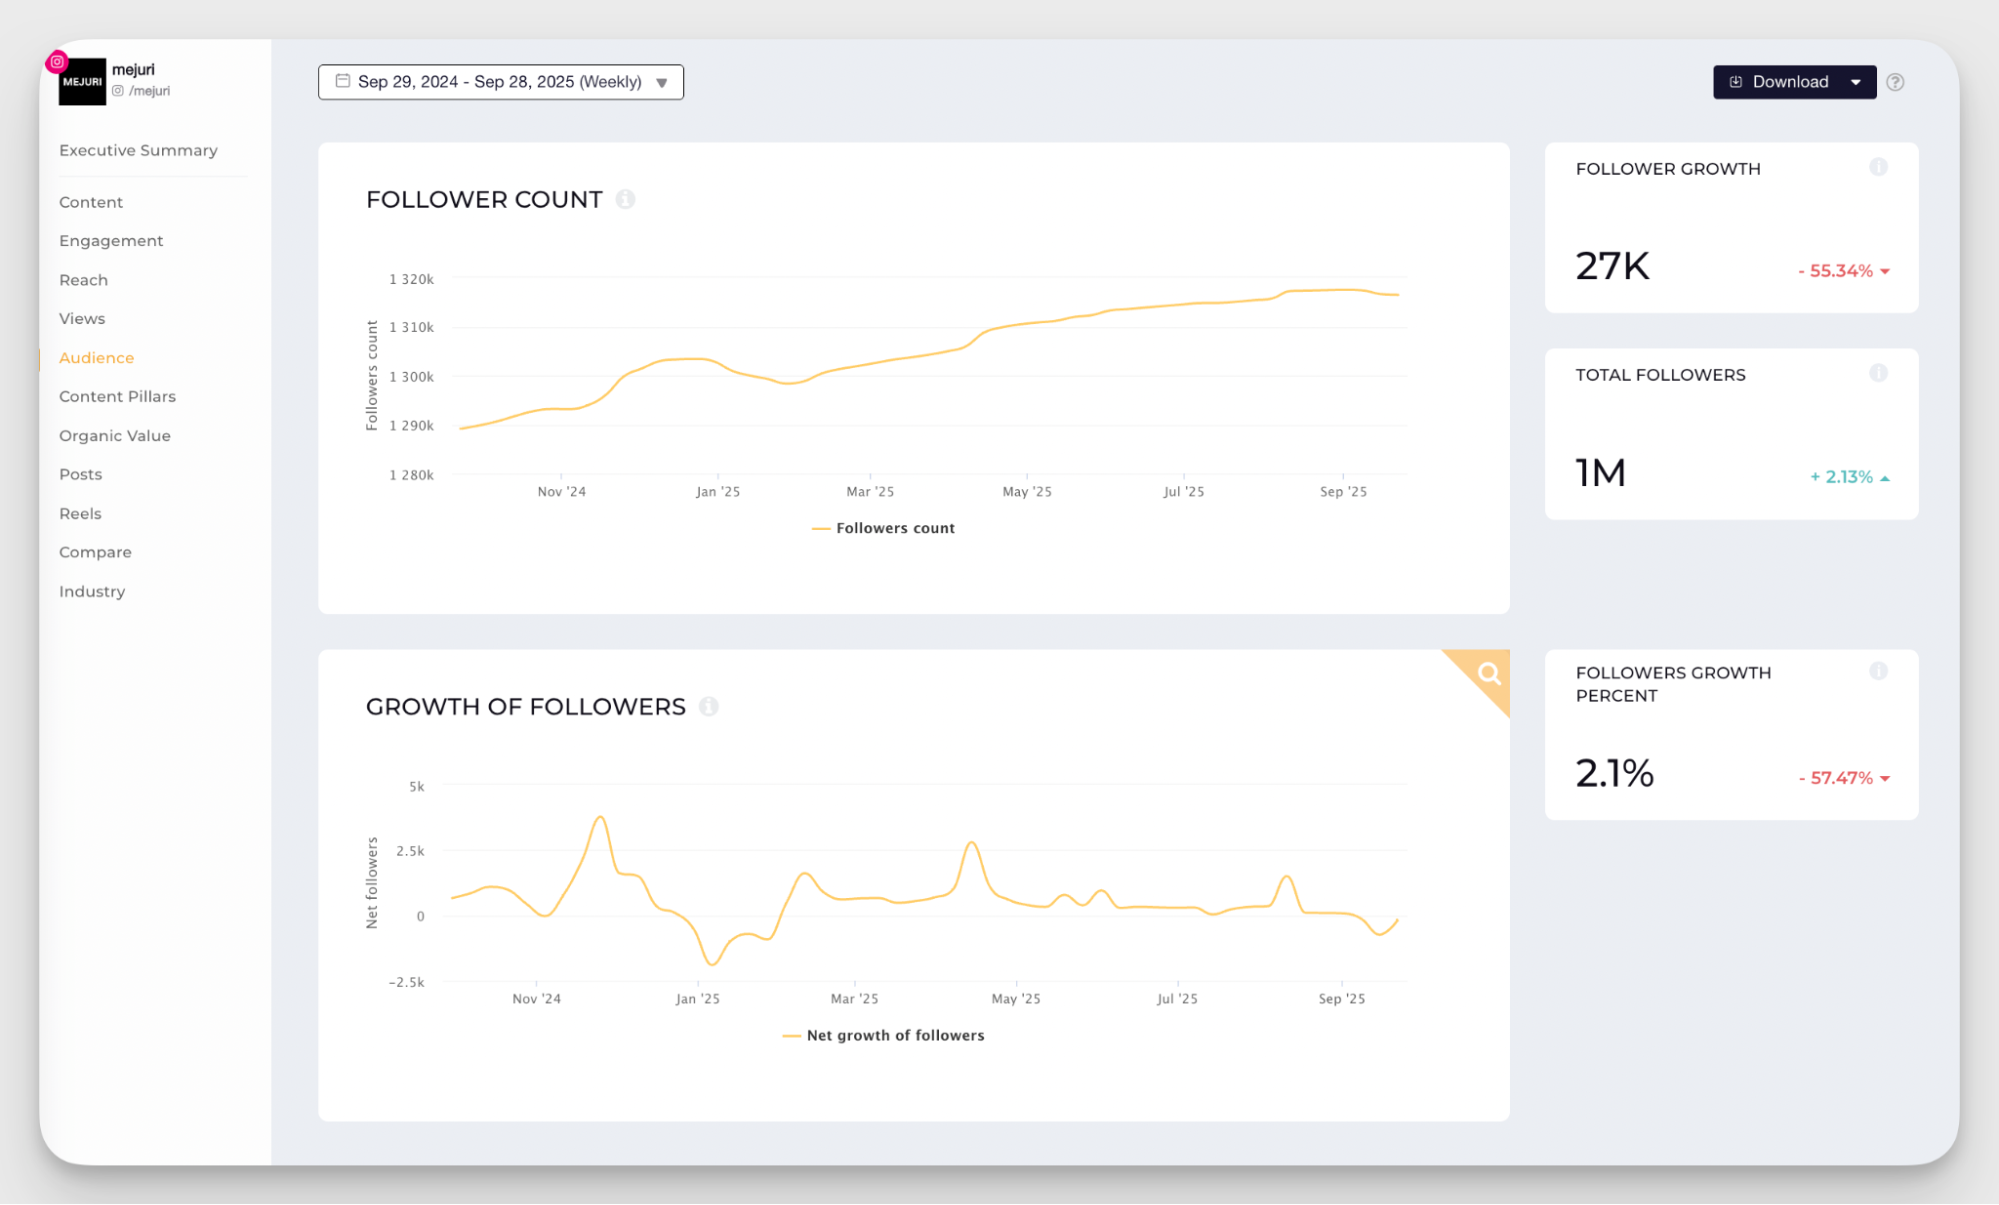
A 100-engaged followers beat 10,000 ghost accounts any day. But if you've been stuck at a 100 for months, that's not a great look either. Growth matters because it shows momentum. If people care enough to hit follow, they're making the first step into the funnel. And if your content isn't converting anyone into followers, that's a red flag.
I always balance follower growth with engagement rate. As long as engagement stays above the benchmark, I'm comfortable with steady growth.
Instagram core engagement metrics
Whenever I run an Instagram audit, I always pay special attention to engagement data.
Engagement metrics give context to both follower count and reach. It shows the living pulse of your accounts and helps evaluate whether your followers and viewers are active.
Likes, comments, saves, and shares
Instagram engagement actions — likes, shares, comments, and saves — show whether people are invested enough in your content to interact with it.
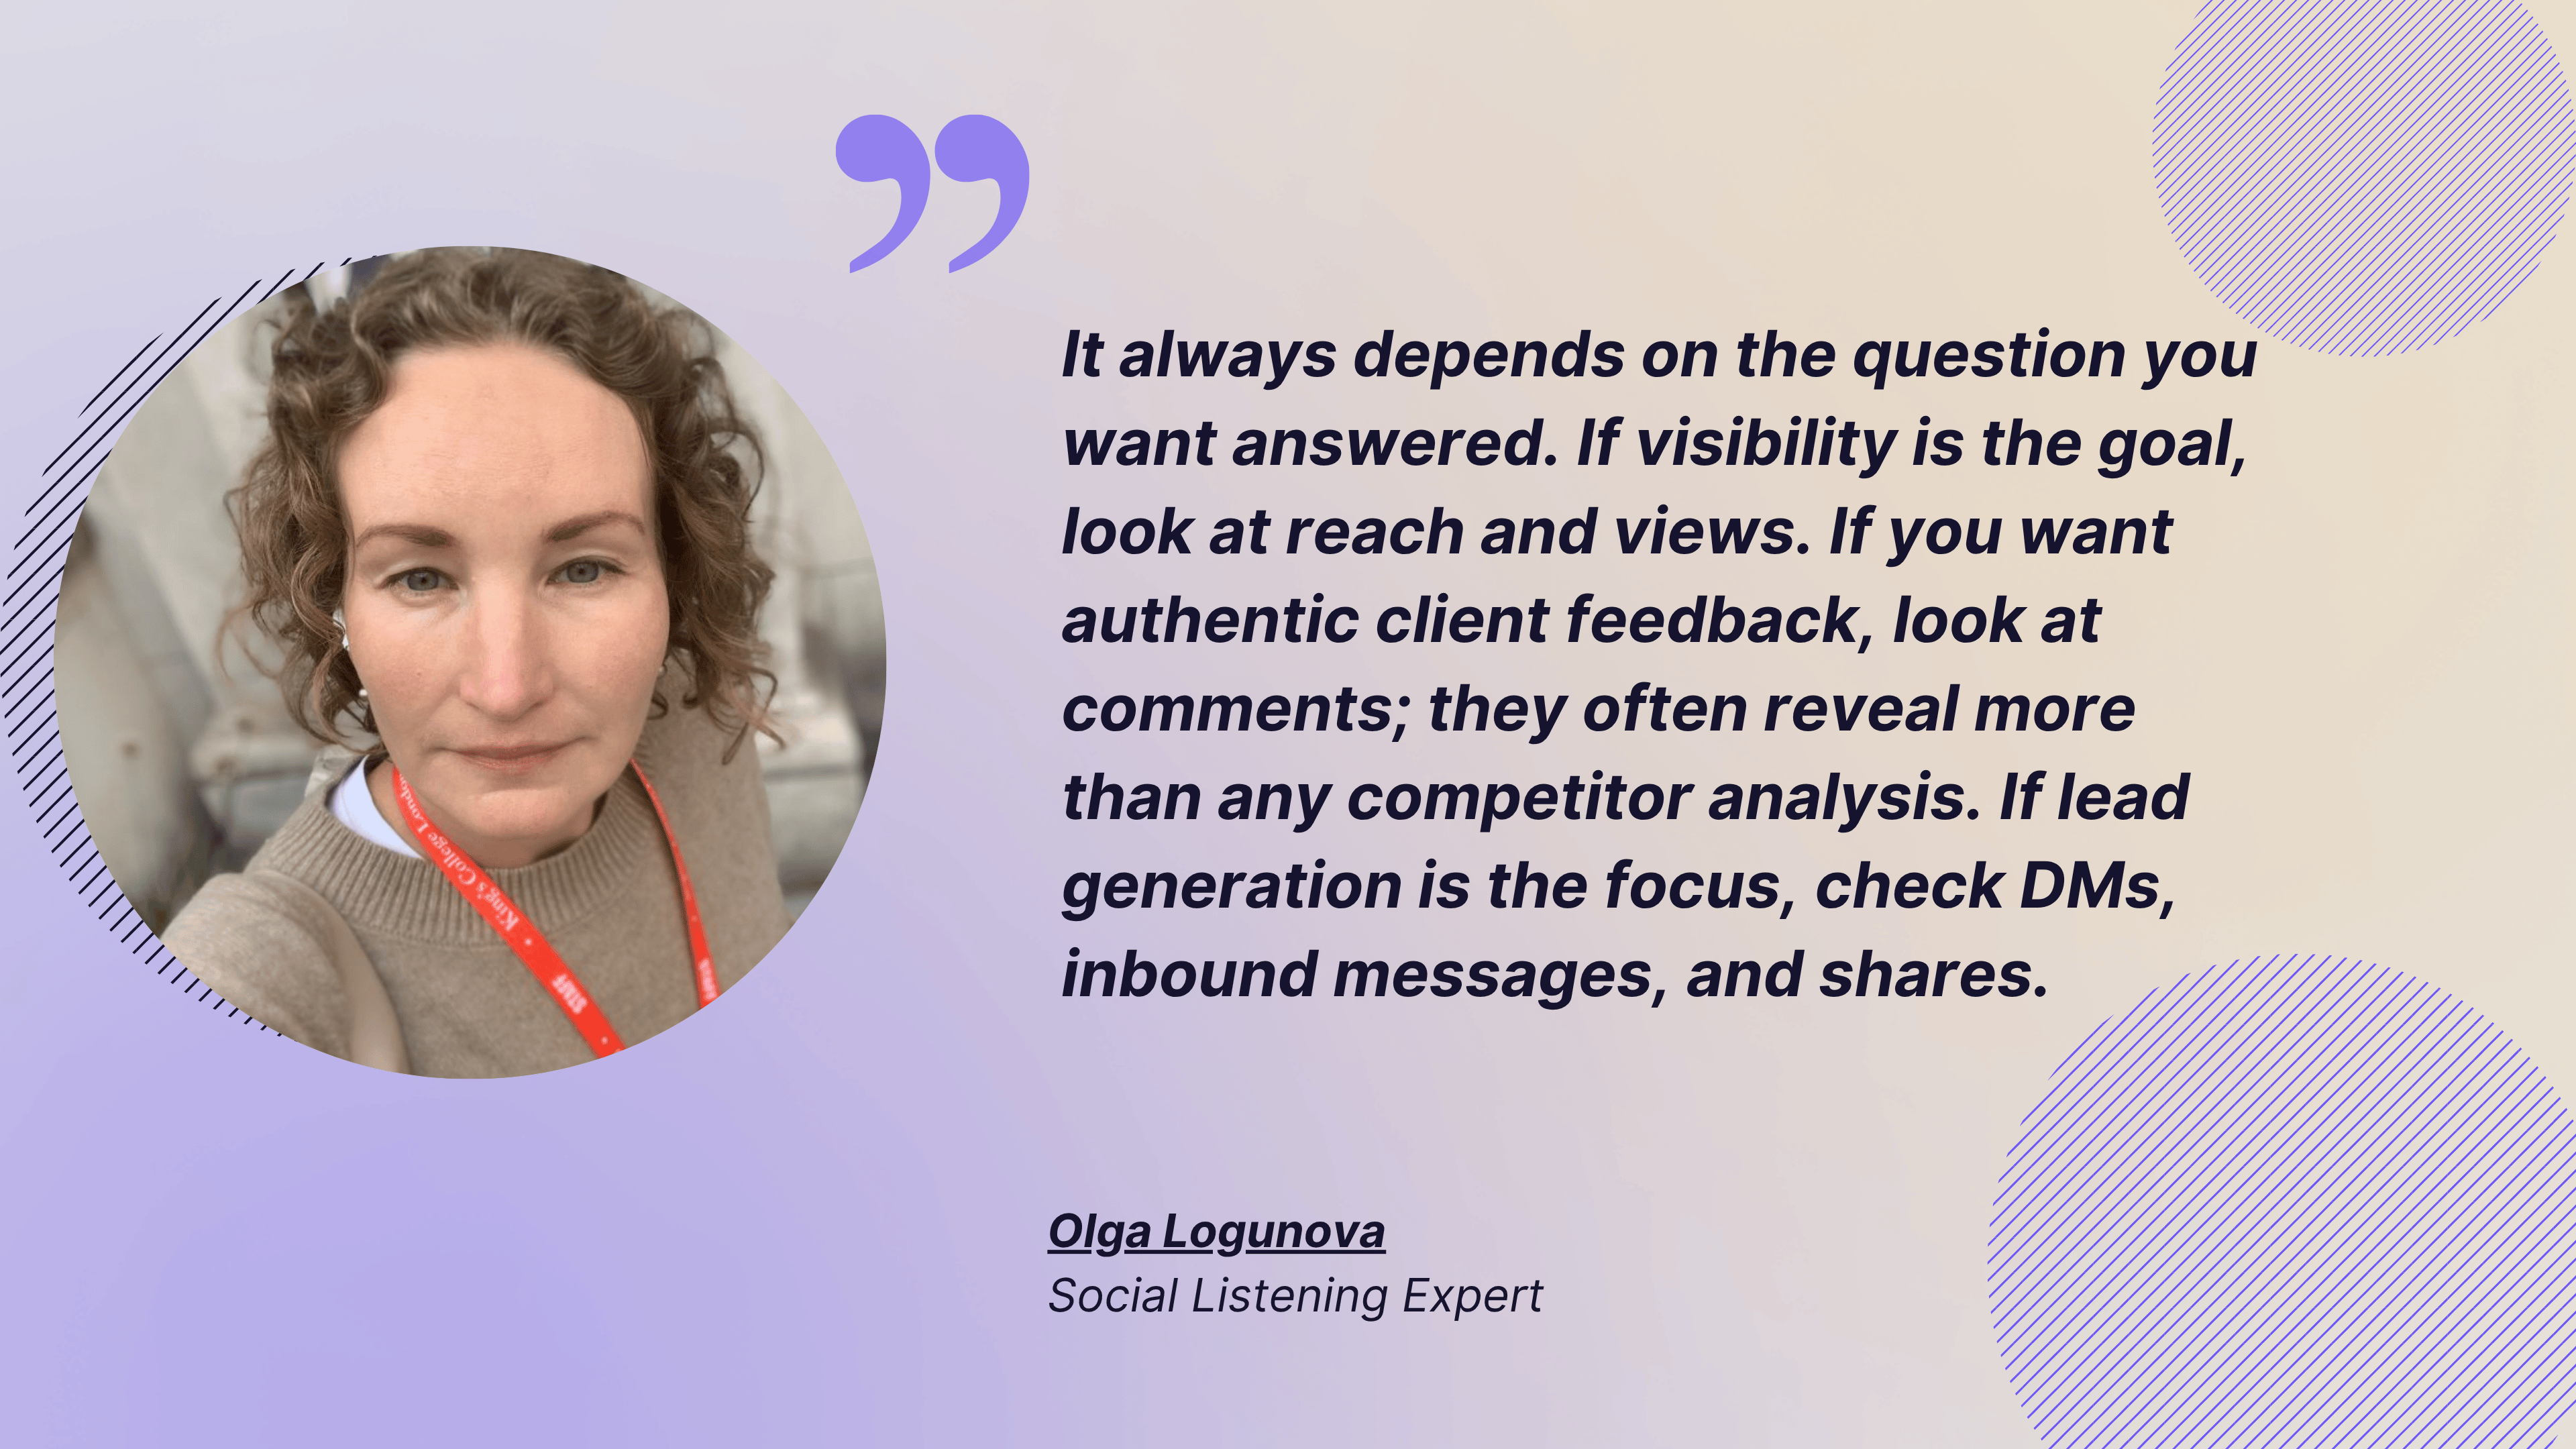
When asked about which engagement actions to track first and foremost, Olga Logunova says:
It always depends on the question you want answered. If visibility is the goal → look at reach and views. If you want authentic client feedback → look at comments; they often reveal more than any competitor analysis. If lead generation is the focus → check DMs, inbound messages, and shares. In short, the most important metrics are the ones directly tied to your objective.
On Instagram, every action has a certain weight that tells the algorithm whether this content is resonating well and is worth ranking higher. And although Instagram doesn’t publish the exact breakdown, Adam Mosseri and the platform itself drop enough hints.
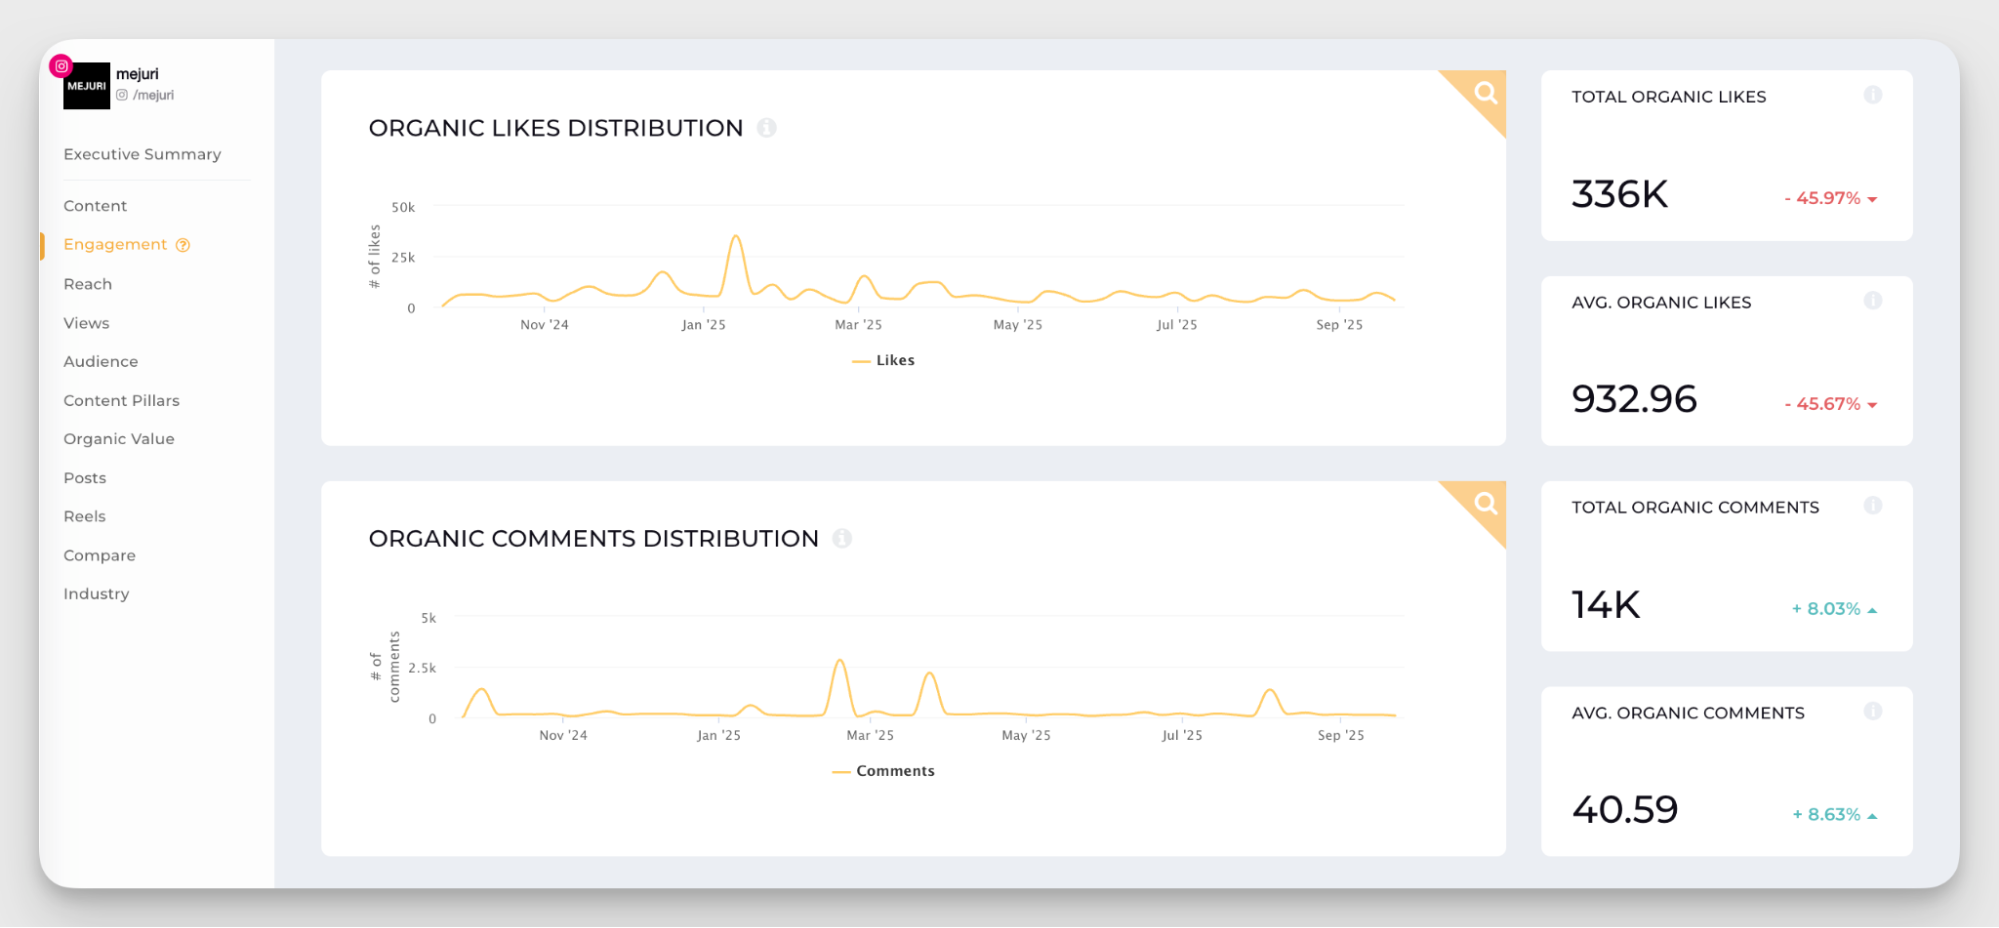
Generally, shares are one of the most valuable actions. Instagram aims to promote content users want to share with their network, so if shares and reposts are growing, your content is becoming more visible for Instagram users.
Next come comments. When users take time to leave a comment, it means they’ve at least stopped scrolling to do so. Comments also act as a unique source of feedback. You can gauge the sentiment and evaluate how your post, campaign, or product resonates with your audience.
I personally like to keep an eye on saves. Saves are especially important when we’re talking about evergreen brand content and lasting value. When your posts get a lot of saves, it signals that the content you’re offering is truly valuable, not just funny or trendy.
If you’re testing content pillars such as educational content or how-to guides, saves are your most vocal in-feed action.
Finally, likes usually sit at the bottom of the ranking hierarchy, but they're not useless. As Adam Mosseri mentioned, likes still matter for connected reach — they help you stay visible to your existing followers. As lightweight as likes are, they still push content forward and help evaluate the success of your posts.
Engagement rate
All the engagement actions mentioned above boil down to one very important metric — engagement rate.
We can’t say if 100 likes or 100 saves is good unless we take into account how many people saw our post overall. This is where the engagement rate comes to help us evaluate our efforts and make a decent comparison.
There are three types of engagement rate calculations you can use on Instagram:
- Engagement rate by followers. Calculated as ((Likes + Comments + Saves + Shares) / Number of followers) x 100. Most useful when you need to gauge how well your current follower base is interacting with your content.
- Engagement rate by reach. Calculated as ((Likes + Comments + Saves + Shares) / Reach) x 100. Helps evaluate the success of brand awareness campaigns or generally gauge how well people are responding to content, even if they don’t follow you.
In my practice, engagement by reach has been the golden standard for a while. It gives you a solid understanding of how many people saw your content overall and how many of them converted into some sort of action.
Additional engagement metrics for powerful insights
Core engagement metrics usually make it to the top of executive reports. But there are more potential insights you can get from reading your Instagram analytics.
And if reach or the number of likes are “external” metrics for executives, these additional content metrics are “internal” — they help your content team see patterns in the way your followers consume social media content.
Content format performance
When you run a social media analysis for Instagram (or other platforms), one of the most useful things you can do is compare how different content formats are working for you.
Single images, carousels, Reels, and Stories each have their own strengths, but what works best depends on your audience. Best practices and benchmarks are helpful starting points, but they don't always hold true for everyone. The only way to know what works for your account is to track it.
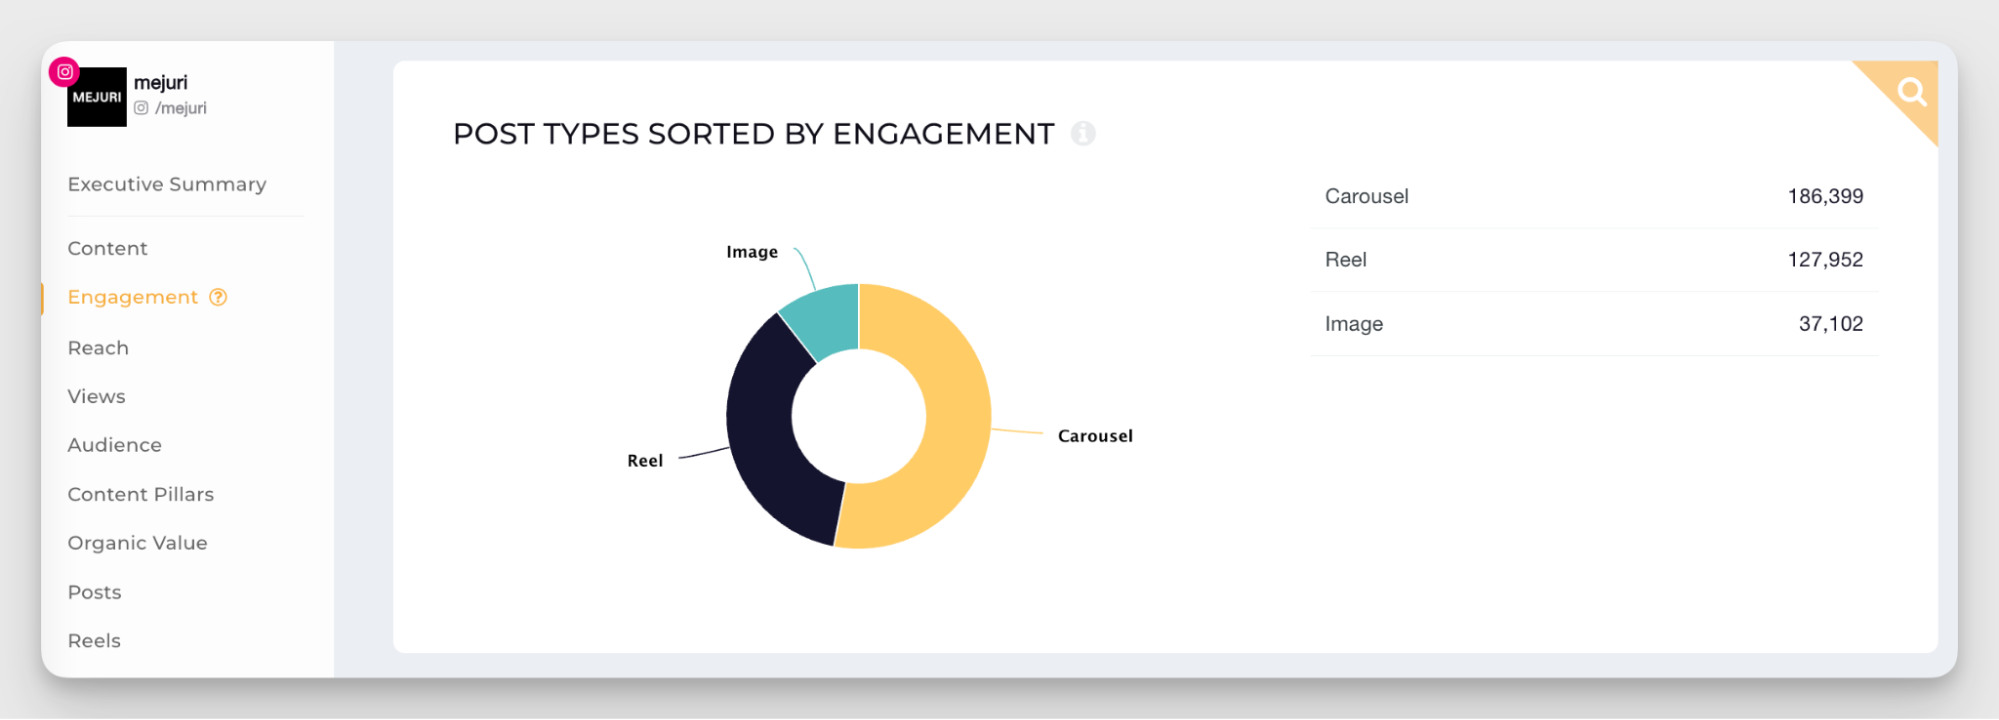
I also like to analyze what kind of audience interacts with each format. Reels tend to attract new viewers — people discovering your content through the algorithm. Carousels and single-image posts usually perform better with existing followers who are already invested in your brand.
Best-performing content pillars
Content pillars are the recurring themes or topics that you use on your Instagram account.
Pillars are like a handrail that helps you navigate your own content and divide posts into thematic buckets: educational tips, behind-the-scenes, user-generated content, product highlights, and more.
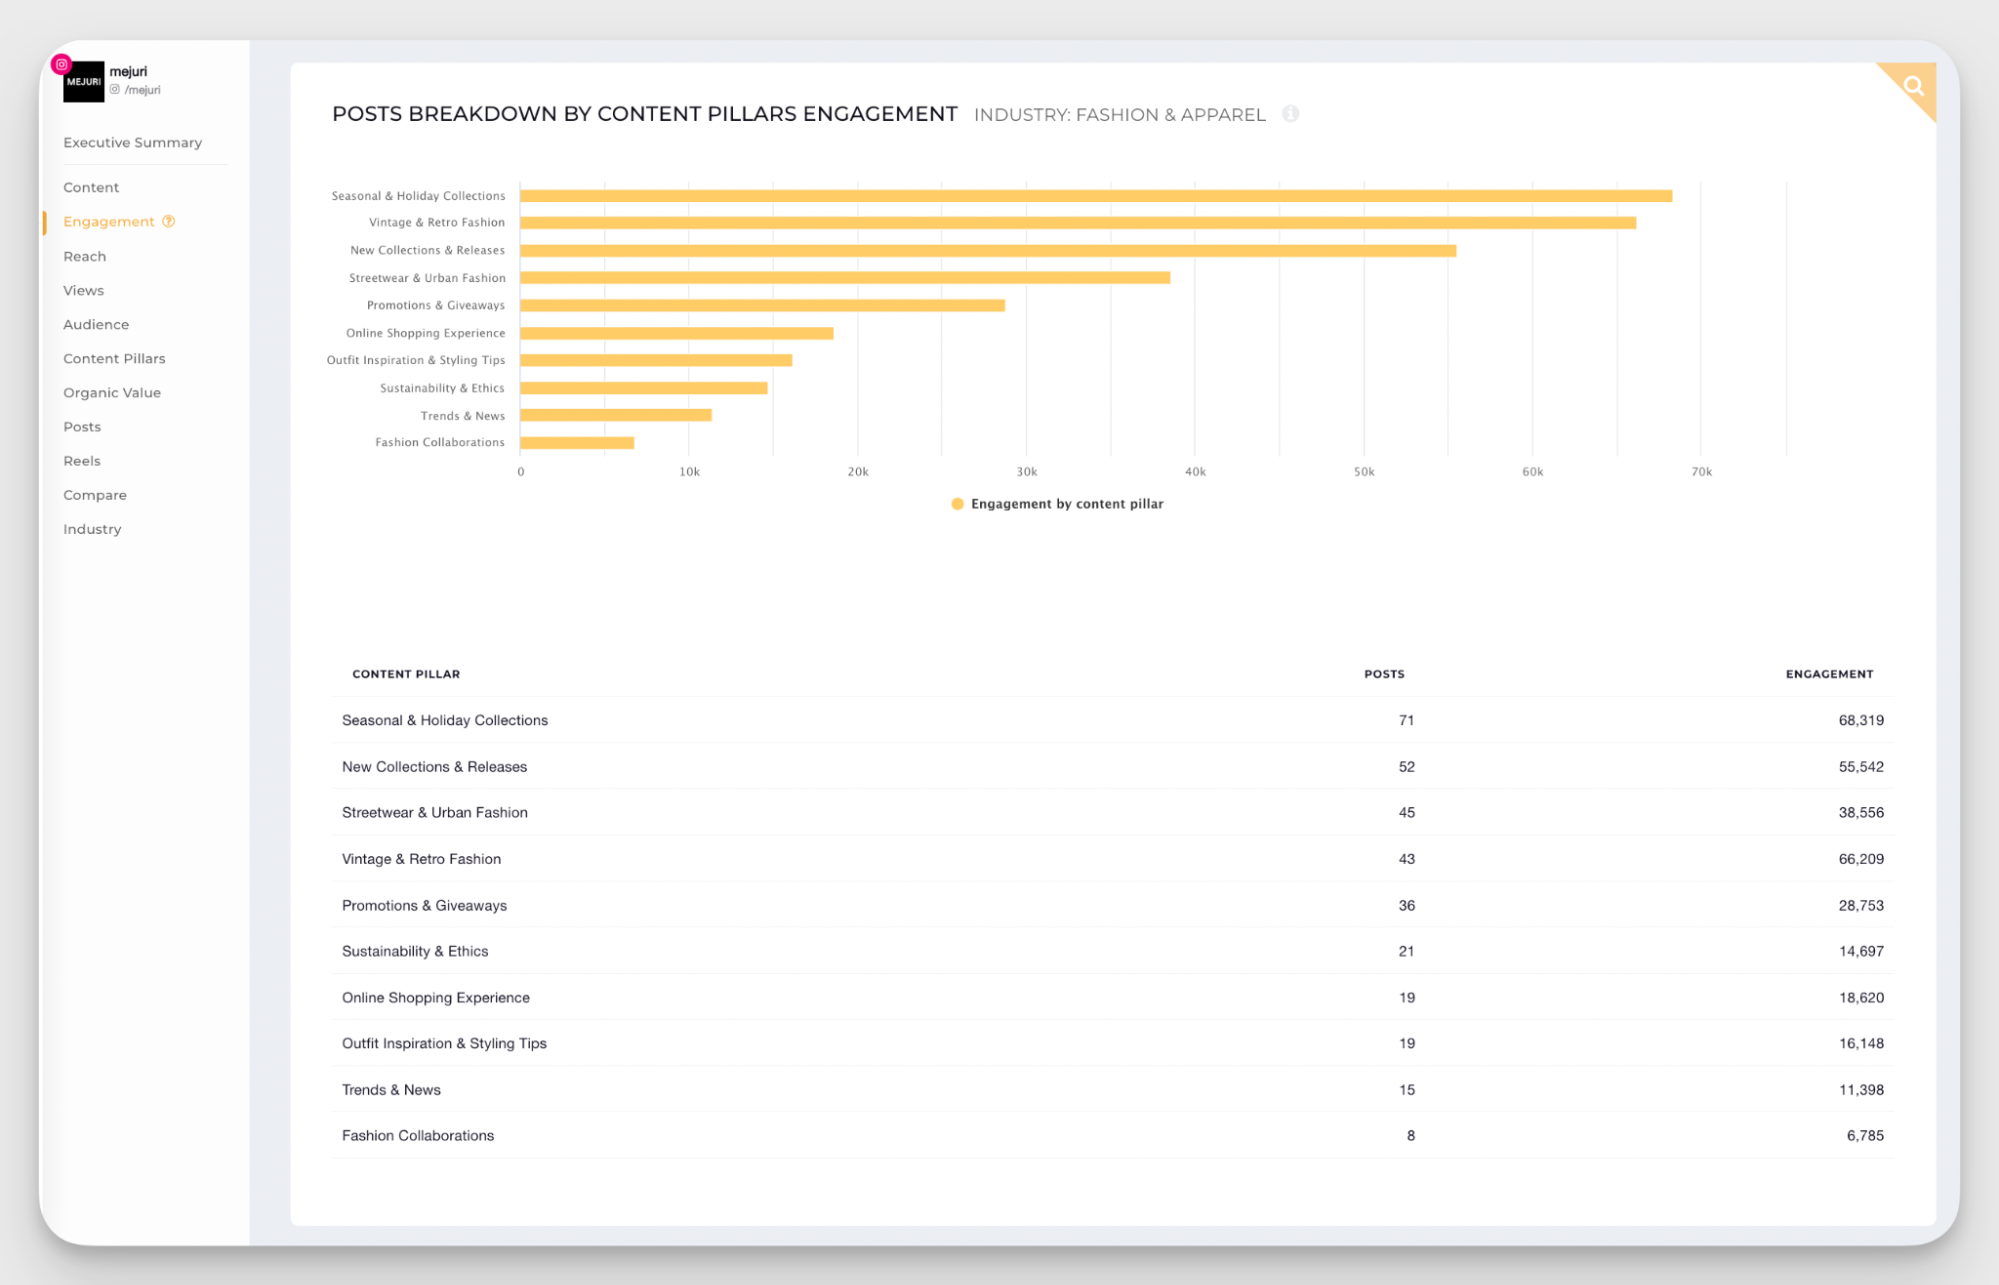
Tracking which pillars perform best helps you see patterns in what your audience wants from your profile. Maybe you've been pushing product posts hard, but educational content is consistently getting double the engagement. That's a signal to shift focus.
I use this data to optimize my Instagram strategy. If one pillar is underperforming, I either need to rethink how I'm presenting it or accept that my audience just isn't interested. And if a pillar I've barely touched is outperforming everything else, that's a cue to explore it more.
Top posts
Top-performing posts are simple but powerful. They give you the context on what's working and why for your content analysis.
On Instagram, top posts help you identify which combination of factors drove success. Was it a Reel using trending audio? A carousel with educational content? A single image with a strong caption hook?
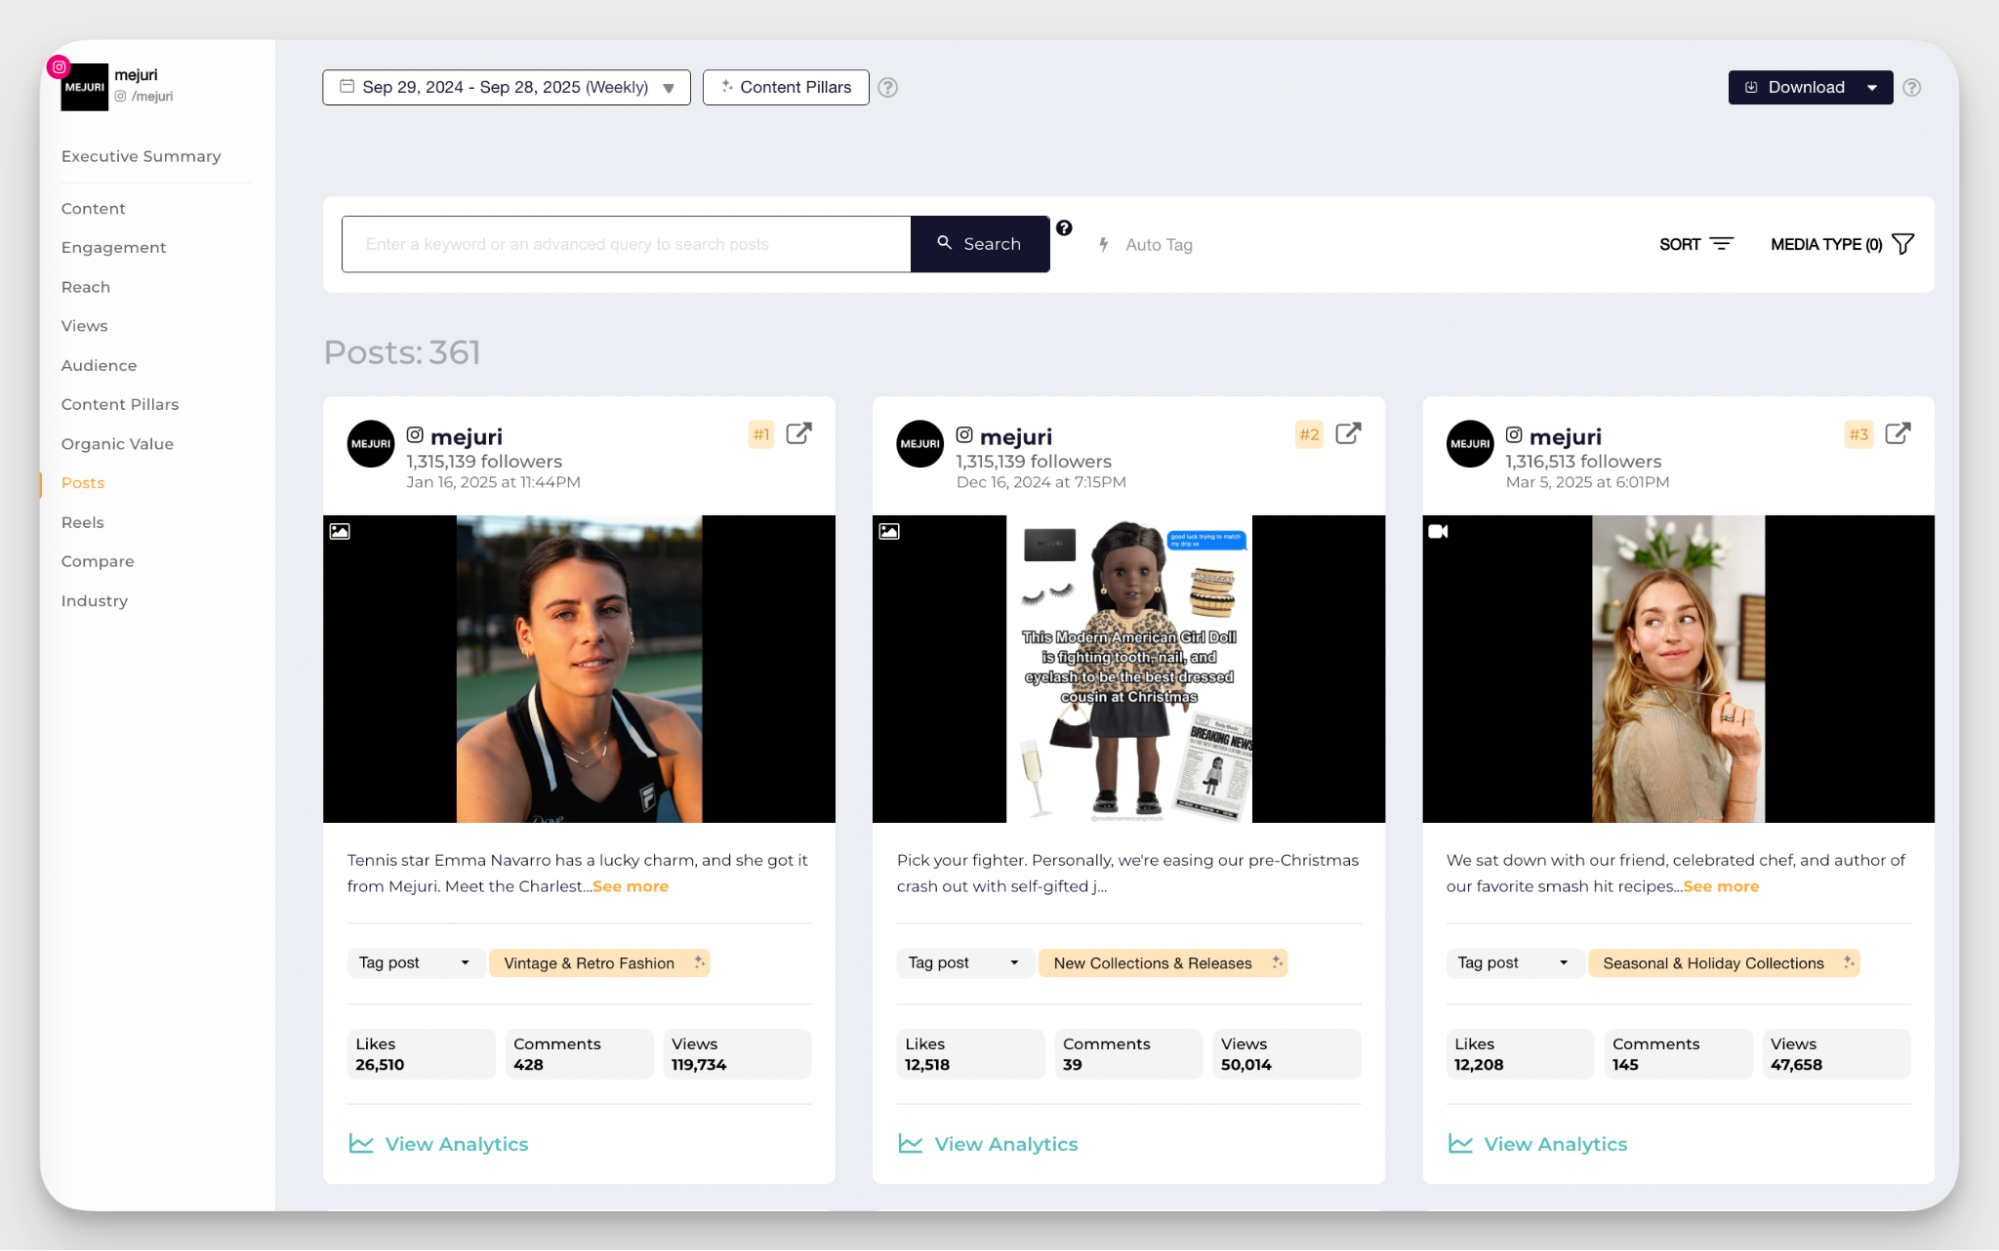
Socialinsider helps you quickly identify the top-performing posts of any Instagram account. Choose the account you want to analyze and navigate to the Posts tab. Here, you can see the top performers sorted by the metrics of your choosing: engagement, engagement rate, estimated reach, views, likes, or comments.
After tracking your best performers for a while, you can form a pattern. If educational carousels keep landing in your top 10, that's not luck or coincidence, but strategy.
I always review top posts at the end of each month or campaign. The goal is not to recreate the viral moments, but rather to understand what resonates so I can apply it moving forward. It’s also good to double down on your best performers.
Reels-specific metrics
Reels are one of Instagram’s most beloved features. And while the native platform offers quite detailed Reels analytics, you can always gain more insights with analytic tools like Socialinsider.
Views
Views are one of the basic video metrics on Instagram. It shows how many times your Reel was actively watched. This means people stopped scrolling and watched at least part of it.
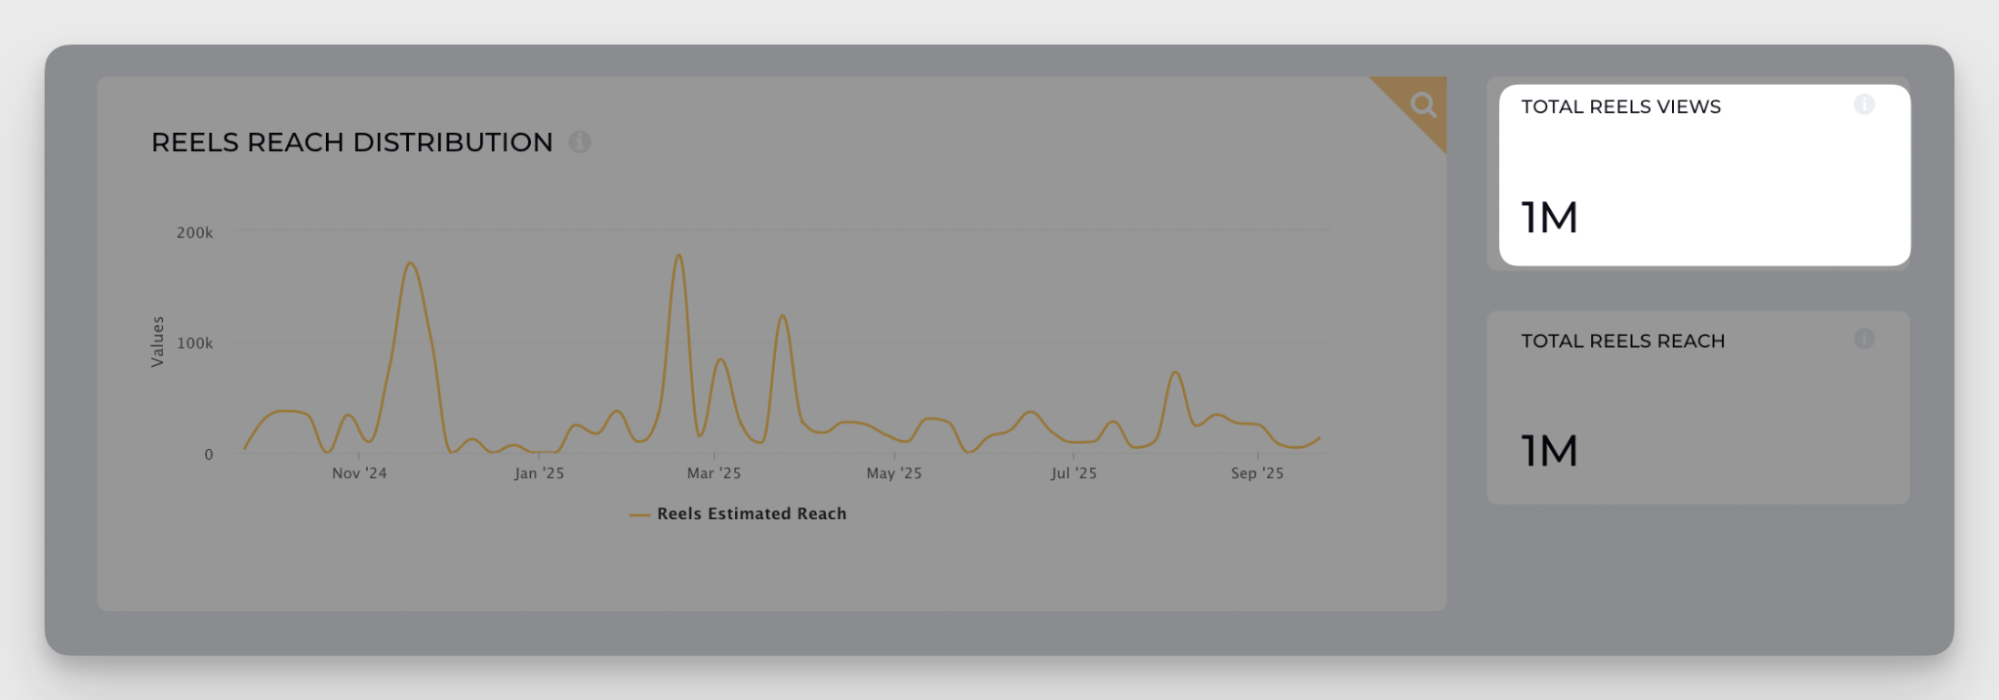
Some strategic decisions call for a bigger picture.
These advanced metrics give you a birds-eye view of the landscape. Instagram analytics tools like Socialinsider analyze thousands of accounts over time so you can get more context for your performance data.
Here’s what can help you understand your existing data better:
Instagram breaks views down into followers and non-followers. I always check this split to see what type of content attracts new audiences versus what resonates with my existing community. This little trick helps you understand what type of content to use when your priorities switch.
Watch time
Watch time shows how long people watched your Reel in total, plus the average watch time per viewer.
Average watch time and the view rate past the first 3 seconds are critical for evaluating your hooks. If people are skipping after 2 seconds, your opening isn't grabbing attention fast enough. This metric tells you where you're losing people.
I use this data to test different hooks and see what keeps viewers engaged. A strong hook gets people past those first few seconds. After that, it's about maintaining momentum.
Top sources of views
This metric shows where your views are coming from: the Reels tab, Explore, your profile, Stories, or somewhere else.
I once worked on an account where nearly 40% of Reel views came from Stories. That was a huge insight. It told us that our followers were actively engaging with Stories. We stopped worrying about "over-posting" to Stories and started treating them as a key distribution channel.
Valentin Oprea puts it well:
Don't look at just one thing, such as views or likes, but see the whole picture and make an informed decision.
Understanding where your views come from helps you double down on what's working. If Explore is driving most of your traffic, your content is reaching new people. If it's mostly your profile, you're engaging your existing audience but not expanding much.
Story-specific metrics
Tracking Instagram Stories analytics helps you see which stickers drive the most interaction and which Stories ideas keep people engaged instead of swiping away.
Story statistics
For each Story, Instagram provides detailed metrics:
- Total views — how many people watched the Story
- Interactions — replies, sticker taps, link clicks
- Navigation — how people moved through your Story (tapped forward, tapped back, exited, or went to the next account's Story)
- Audience demographics — who's watching (age, gender, location)
This data shows whether people are engaged or just passively swiping through. High forward taps mean people are moving through your Stories quickly. High exits mean they're leaving before finishing.

Interactive stickers (polls, questions, sliders)
Interactive stickers give you direct feedback and boost visibility. You can see how many people interacted with polls, questions, sliders, or links, and what they answered.
Stickers and polls are a direct line to your audience. I use polls and questions regularly because they make Stories feel like a conversation, not a broadcast.
The more people interact with your Stories, the more Instagram shows them to others. So if the number of interactions is consistently high, that means you might expect a growth in views, too.
Instagram conversion and sales metrics
Paid and organic efforts work together on Instagram. As social media managers, we focus heavily on organic, but paid campaigns contribute real value to your channels too.
Paid campaigns make it easier to prove how effective social media marketing really is. Since they’re money-based, paid metrics give you clear conversion data and make the impact of social media on business more visible to executives.
Here's an insight Vanjela Bellovoda gave me:
Each strategy has its own metrics, so make sure you use the right tool to measure the metrics for that particular strategy, instead of measuring everything and getting nowhere.
Here are the key conversion metrics to track on Instagram.
Link-in-bio CTR and leads generated
Your link in bio is one of the few places Instagram lets you drive traffic off-platform. Click-through rate (CTR) tells you how many people who visited your profile clicked that link.
If CTR is low, your call-to-action might not be compelling enough, or your content isn't priming people to take action. If CTR is strong but conversions are weak, the problem is on your landing page, not Instagram content.
Leads generated measure how many people took the next step — signed up, downloaded something, or filled out a form. This metric connects Instagram directly to your funnel.
Instagram ads conversions
Conversions are the easiest way to measure social media success in connection to real money. Through the Meta ads platform, you can see how many people took a specific action after seeing your ad — whether that's a purchase, sign-up, or app download.
Conversions are tied to your campaign objective. If your goal is traffic, you're tracking clicks. If it's lead generation, you're tracking form submissions. If it's sales, you're tracking purchases.
Instagram Shopping sales
If you're in e-commerce, Instagram Shopping sales are a direct line between content and revenue. Instagram tracks product views, clicks, and purchases made through your shop. You can tag products on photos, Reels, and Stories, and set up checkout directly in Instagram.
Bear in mind that the metric only applies if you've connected a product catalog and enabled shopping features. Instagram shopping also has location restrictions.
Customer acquisition cost (CAC) from Instagram traffic
CAC tells you how much you're spending to acquire one customer through Instagram. Divide your total Instagram ad spend by the number of customers acquired.
If CAC is higher than your profit margin, your social media campaign isn't sustainable. If it's low, you've found a channel worth scaling. CAC also varies wildly by industry, so compare yours to competitors’ benchmarks in your niche.
ROI (return on investment)
ROI measures the overall profitability of your Instagram efforts. It's calculated as (Revenue - Cost) / Cost x 100.
For organic content, "cost" includes the time and resources spent creating and managing the account. For paid campaigns, it’s your ad spend plus any production costs.
ROI is the metric executives care about most because it directly ties your work to business results. If you can prove positive social media ROI, congratulations — you've justified the investment in social media!
ROAS (return on ad spend)
ROAS is specific to paid campaigns. It shows how much revenue you're generating for every dollar spent on ads. It's calculated as Revenue from Ads / Ad Spend.
For example, a ROAS of 4:1 means you're making $4 for every $1 spent. Anything above your break-even point is profitable.
ROAS is more granular than ROI because it isolates ad spend from other costs. I use ROAS to evaluate individual campaigns and decide which ones to scale or kill.
Advanced Instagram metrics for data context understanding
Some strategic decisions call for a bigger picture.
These advanced metrics give you a birds-eye view of the landscape. Instagram analytics tools like Socialinsider analyze thousands of accounts over time so you can get more context for your performance data.
Here’s what can help you understand your existing data better:
Industry benchmarks
Benchmarking key performance metrics — engagement rate, views, follower growth rate — helps you understand broader trends and see whether those trends apply to your account.
For example, you might notice your engagement rate dropping. That's concerning. But if engagement is declining across Instagram as a whole, the context changes. The platform is shifting, so fluctuations affect all of us.
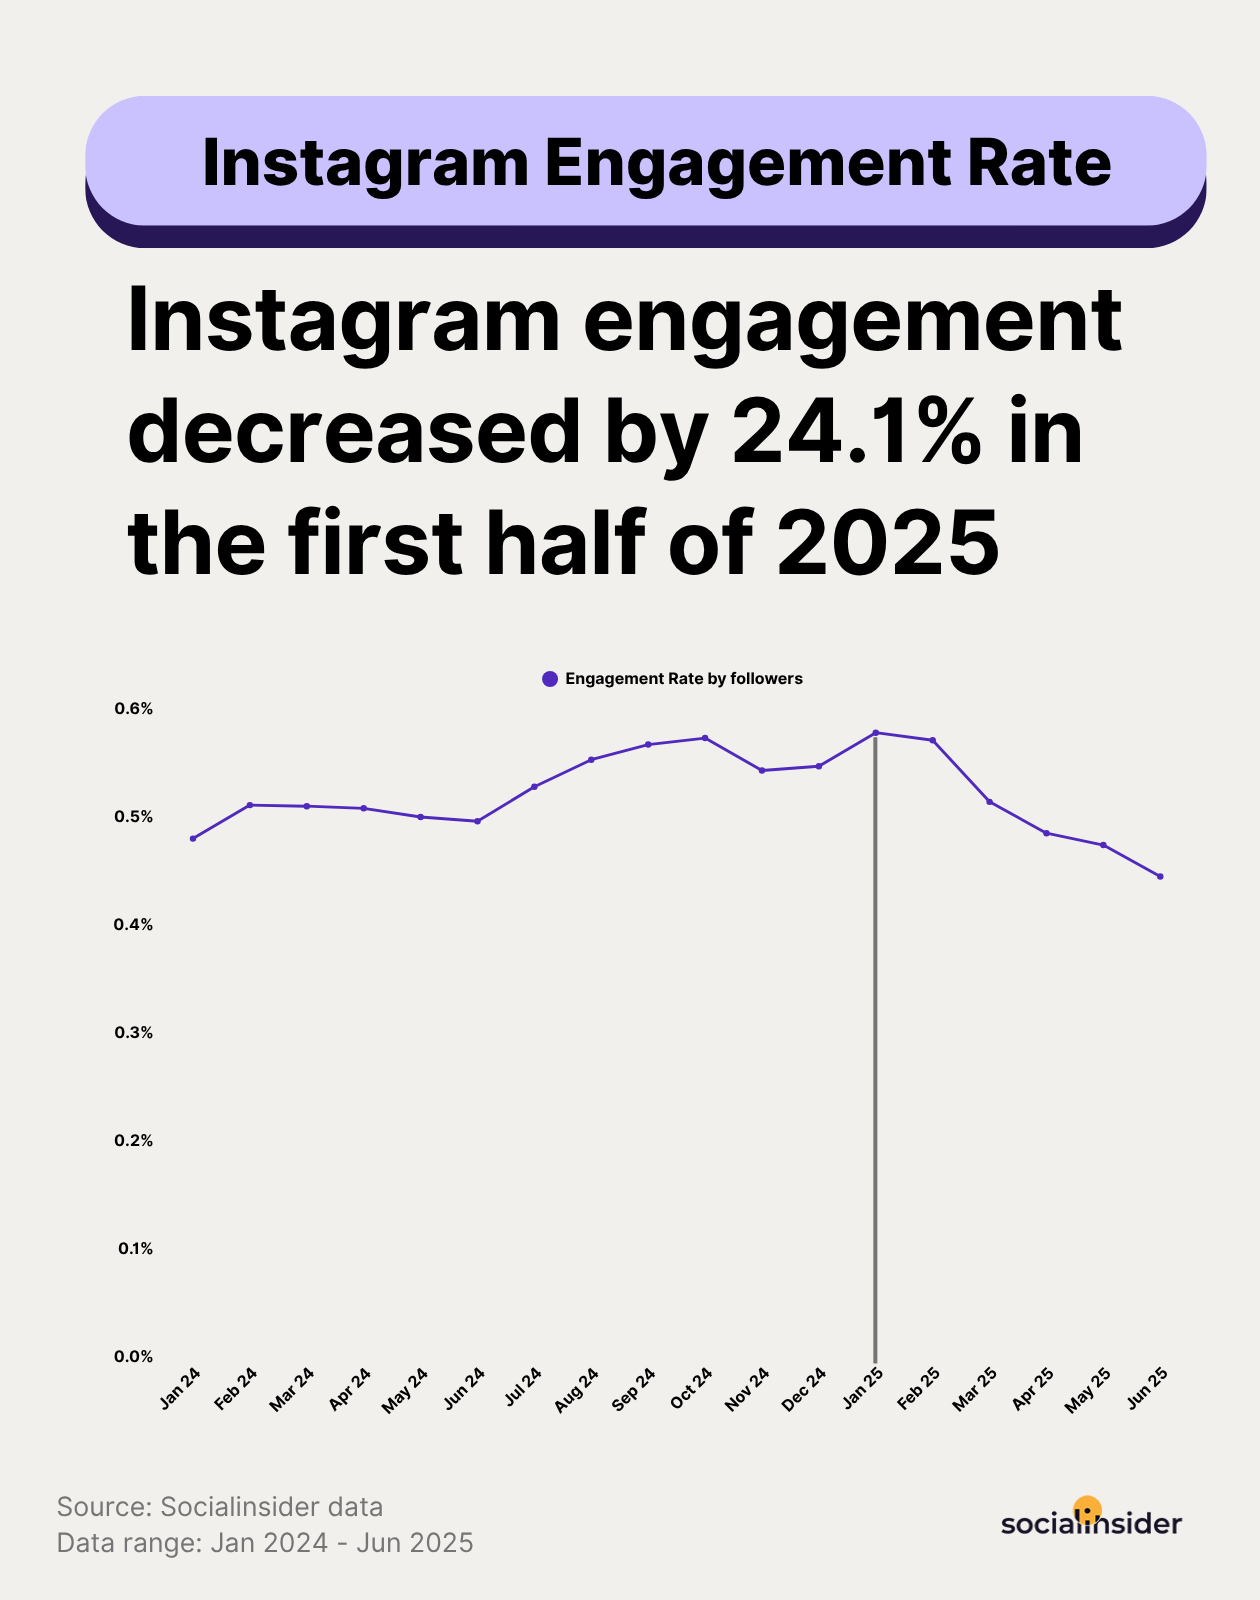
That doesn't mean you ignore the problem — you still need to adapt and find ways to improve. But knowing the overall trend helps you set realistic expectations and avoid panicking over industry-wide changes you can't control.
I use benchmarks to ground my performance reviews. If my engagement rate is 3% and the industry average is 1.5%, I know I'm doing well.
Competitive insights
Reach estimations, organic value, content pillar performance, and other competitive insights serve as both a reference point and a source of inspiration.
Tracking specific competitors gives you much more context than broad industry benchmarks. Accounts vary by industry, size, and target audience, so you need finer-grained data to evaluate your results correctly and set realistic KPIs.
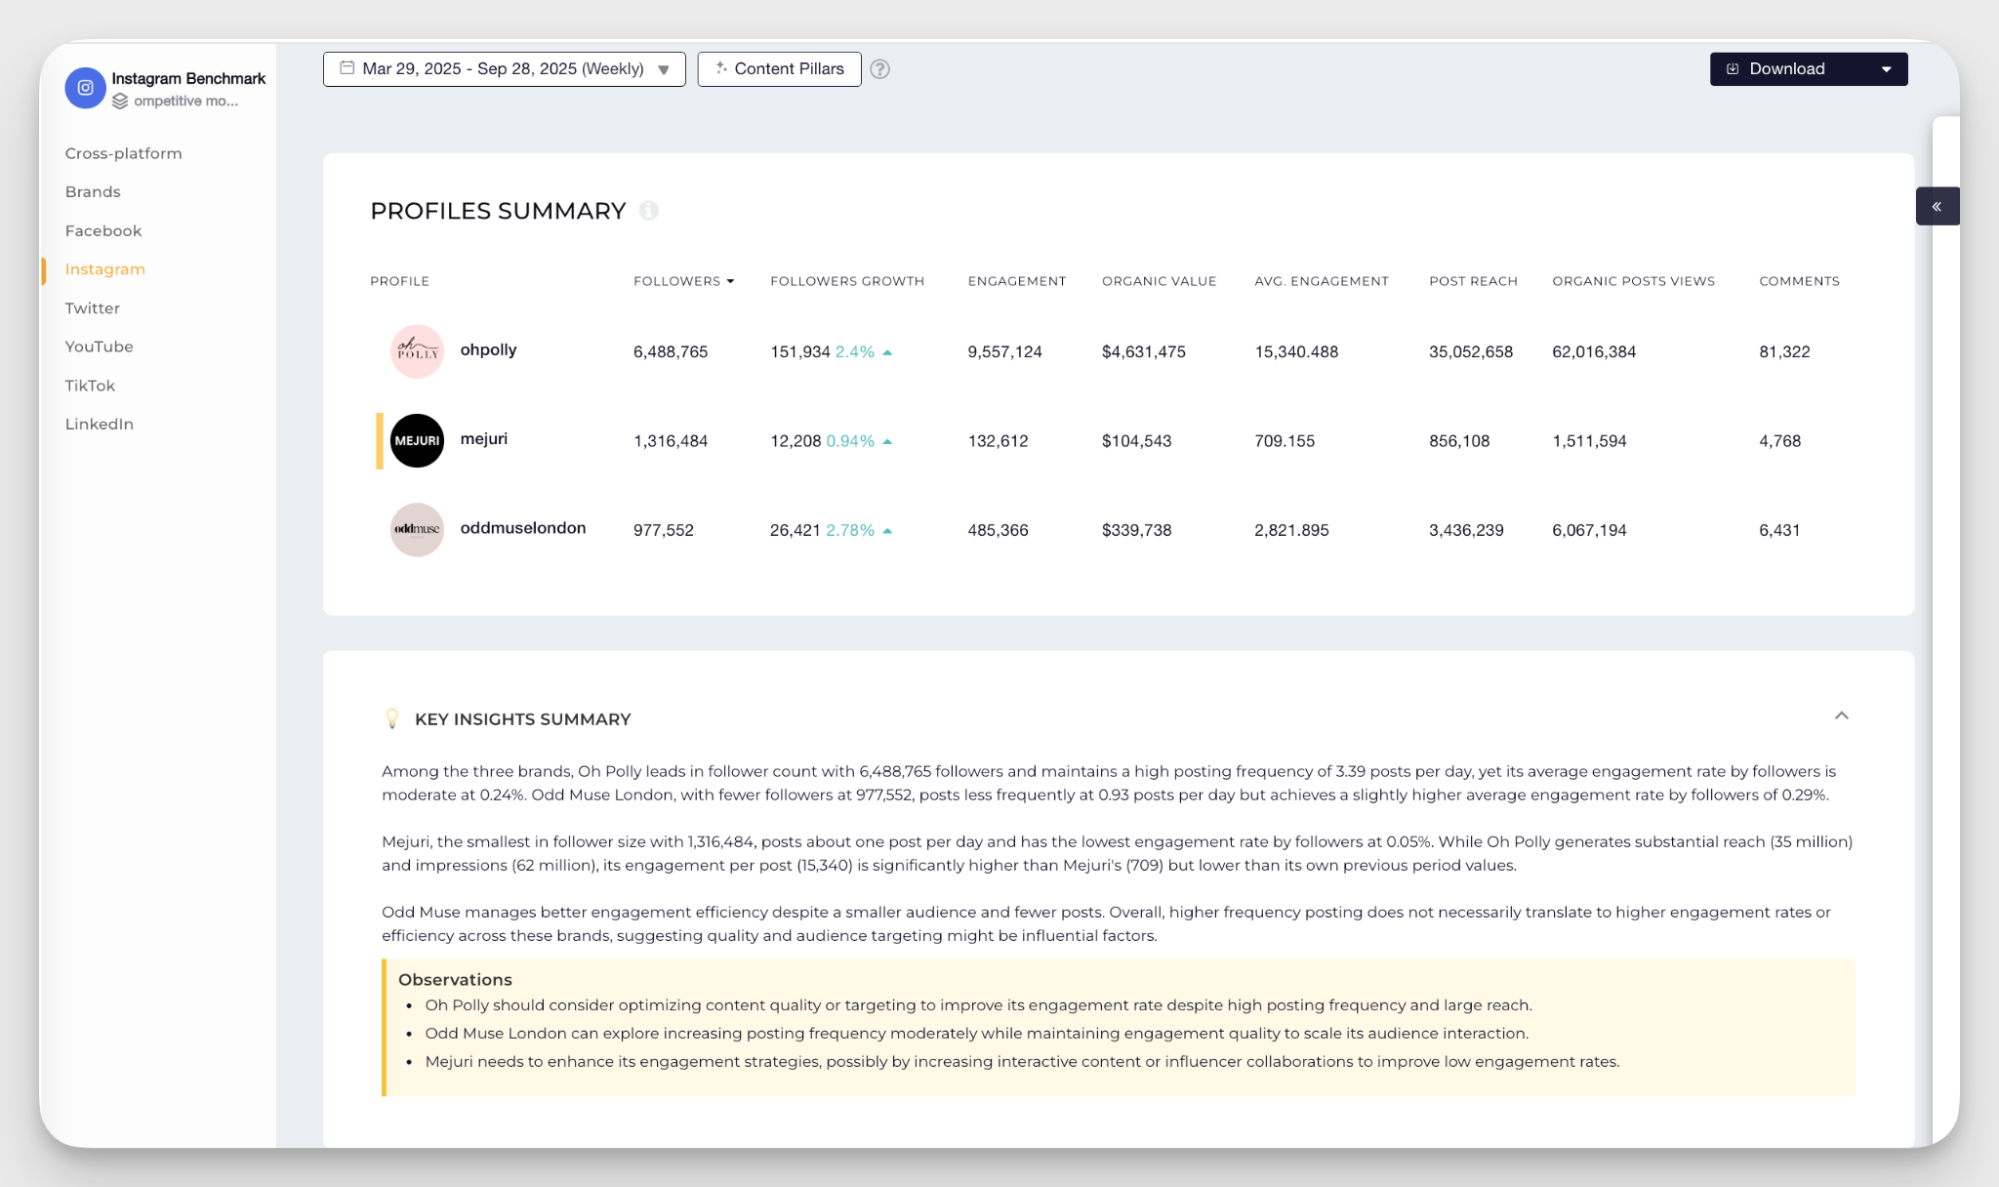
It’s especially true for niche industries. They often get lumped into the broader category, but have very specific audience behaviors and content dynamics.
For example, using “technology” follower growth as a benchmark for a gaming account won’t really give you enough context. What will give you enough data (and possibly highlight opportunities on the way) is tracking several similar game accounts on Instagram.

You need to perform competitor research regularly to keep your insights fresh, but it's tedious to do manually. Tools like Socialinsider handle the heavy data lifting — tracking competitors' posting frequency, best performing content pillars, engagement patterns, and organic value.
How to easily track your important Instagram metrics?
You can track basic Instagram metrics through the native analytics tool. But I believe analytics is way too important and vast to gather manually.
Here’s where Socialinsider comes into play. It consolidates your Instagram data, adds competitive insights, and gives you the tools to analyze performance at scale. It gives you the right context for your data, making it insights rather than just numbers.
Adding your Instagram profile
Getting started is straightforward. Connect your Instagram account through Meta's Business Suite integration. Socialinsider pulls your data directly from Instagram's API, so you're working with accurate, up-to-date metrics.
Once connected, you can add competitor profiles to track alongside your own. This lets you benchmark performance, spot gaps in your content strategy, and simply keep an eye on how your fellow businesses are doing.
What's inside Socialinsider?
Socialinsider organizes Instagram analytics into clear sections:
- The Content tab keeps all the info about the posts: organic post distribution, cadence of posting, total number of posts, posting times, performance by content type (Reels, carousels, single images), top performing posts, and hashtags.
- The Engagement tab breaks down organic engagement distribution, average engagement rate by followers, reach, and impressions, total number of organic engagements, content pillar analysis, and engagement by content type. You can also find the best time to post based on compiled data.
- The Reach and Views tabs give you context about total organic reach and views, organic reach rate by followers, post types sorted by reach, and average number of views.
- Audience insights show follower count, follower growth trends, and total followers. For your owned profiles, you can also access the geographical distribution of followers, demographic data, and most active times.
- The Content Pillars tab analyzes the performance of content pillars, including the breakdown of the number of posts for each, engagement rates, and Reels views.
- Organic value is one of my favorite tabs — it gives you an estimation of how much ad money you would need to get the same results you’re getting. It’s a very useful estimation of your organic efforts.
- The Posts tab gives you an overview of all the posts in the selected period with post-level engagement data and auto-tags.
- The Reels tab oversees the Reel-related data, like the number of Reels, the Reels distribution graph, engagement rate, likes, and total Reels reach.
- Competitor benchmarking in tabs ‘Compare’ and ‘Industry’ compares your performance against competitors or industry averages. You can see how your engagement rate, posting frequency, and content strategy stack up.
Need to present all of it nicely? Set up your report in the Executive Summary tab and export it in the most convenient format.
Final thoughts
Data fatigue is real, and tracking a thousand metrics on Instagram doesn't make your social media marketing more data-driven.
What helps you make data-backed decisions is understanding which metrics to track and where they're coming from. Focus on the data that matters to your current goals, and make sure to digest it and interpret the signals first.
FAQs on Instagram metrics
What Instagram metrics social media managers should measure?
Social media managers will want to measure metrics like:
- Likes
- Comments
- Shares
- Saves
- Top posts
- Reach
- Views
- Follower growth
What Instagram metrics marketing managers should measure?
Marketing managers will want to measure metrics like:
- Reach
- Views
- Engagement
- Traffic
- Leads
What Instagram metrics CMO should measure?
CMOs will want to measure metrics like:
- Traffic
- Leads
- Conversions
Can you download Instagram metrics?
Yes! Using a third-party Instagram analytics tool like Socialinsider, you can easily export and download your reports to present with your team.
Kseniia Volodina
Content marketer with a background in journalism; digital nomad, and tech geek. In love with blogs, storytelling, strategies, and old-school Instagram. If it can be written, I probably wrote it.
Analyze your competitors in seconds
Track & analyze your competitors and get top social media metrics and more!
You might also like
Improve your social media strategy with Socialinsider!
Use in-depth data to measure your social accounts’ performance, analyze competitors, and gain insights to improve your strategy.
