Instagram Reels Analytics Guide: How to Decode Reels Performance
Explore our Instagram Reels analytics guide to decode Reels performance. Use these insights to create a data-driven Reels strategy.


When Addam Mosseri, Head of Instagram, explained why carousels usually outperform Reels, I couldn’t help but wonder: why all the hype and talk about how amazing Reels are, then?
As a consumer, most of the time I spend on social is allocated to the Reels feed, so I felt something wasn’t clicking. And when I had to write Socialinsider’s Instagram benchmarks study, I went to have a chat with Miruna - Socialinsider’s very own Social Media Manager, to shed some light on this.
What were the learnings Miruna gave me? It all depends on the way you’re looking at the picture, and what you’re trying to achieve. For example, as she mentioned, “Reels are great for growth and discovery”. And this got me thinking even further of how a social media manager looks at Reels’ performance.
So, if you need a hand on understanding Reels analytics and how to interpret your data, here are Miruna’s insights, after a year on the battlefield and conquering social media data measurement.
Key takeaways
-
Reels are built for growth and discovery, while carousels and images lean more on engagement with your existing audience.
-
Watch time and average watch time reveal more about audience preferences than raw views ever could.
-
Reach trends over time matter more than a single viral Reel.
-
Native Instagram insights help with quick checks, while third-party tools offer deeper competitive and strategic analysis.
What do Instagram Reels analytics represent?
Instagram Reels analytics reveal how your short-form videos perform, showing audience engagement, reach, and content effectiveness.
Recently, Instagram simplified its metrics. Impressions and plays have been replaced by a single Views metric, making it easier to track how many times your Reel was actually watched. These insights go beyond vanity numbers, helping you refine your creative strategy.
For example, at Socialinsider, we use Instagram Reels analytics to help answer questions such as:
- How many people watched my Reel? (Views)
- Did viewers watch until the end? (Average Watch Time, Retention)
- Are my Reels driving profile visits or followers? (Subscribers gained)
Which Reels drive the most engagement? (Likes, Comments, Shares, Saves)
How do Reels analytics differ from other content types’ metrics?
Not all Instagram analytics speak the same language. While images and carousels mostly tell you how your existing audience interacts, Reels are your growth engine. They’re designed for discovery, which is why you get metrics like new followers per Reel, total watch time, average watch time, and replays.
While talking to Miruna, she mentioned what makes Reels analytics different.
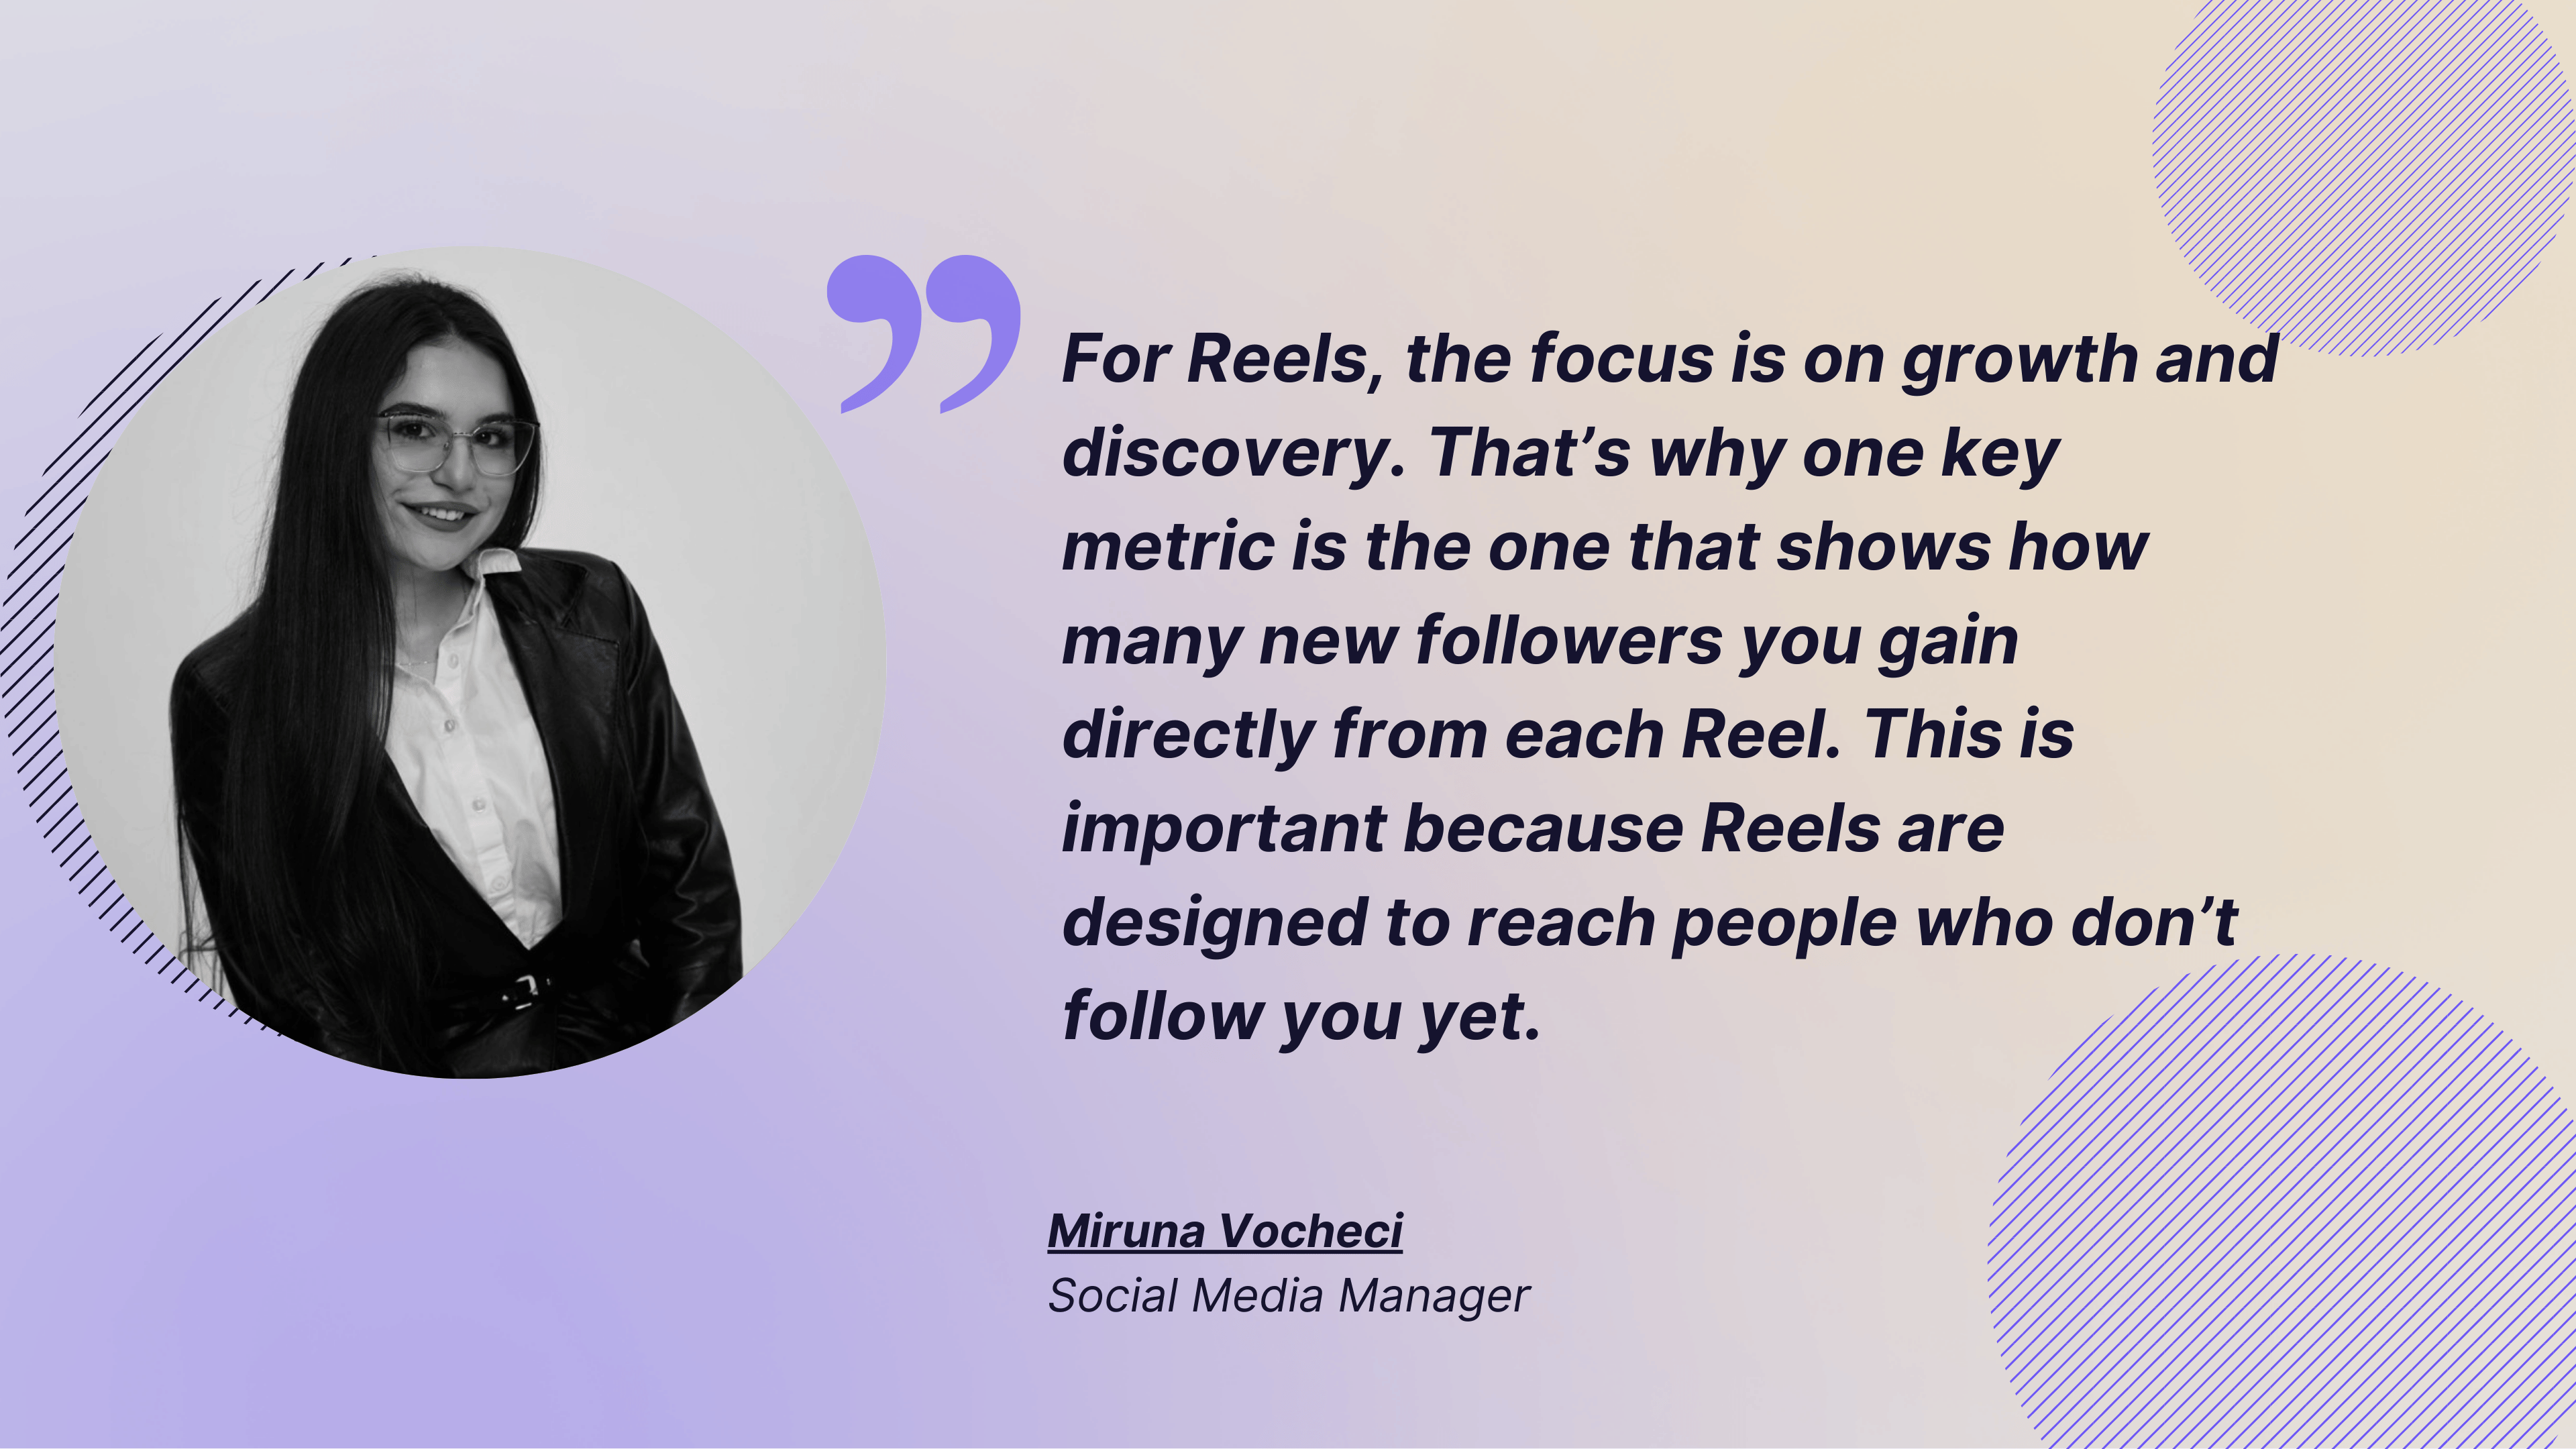
For Reels, the focus is on growth and discovery. That’s why one key metric is the one that shows how many new followers you gain directly from each Reel. This is important because Reels are designed to reach people who don’t follow you yet. Add in video-specific stats like total watch time and average watch time, and you’ll see exactly how engaging your video is. If most viewers make it to the end, you nailed the length, idea, and execution. - Miruna Vocheci
Carousels lean more into relationship building. Their swipe format rewards multi-frame storytelling, so performance depends on how well you can keep people moving through slides. Beyond likes and saves, watch for drop-off between slides, a hidden but telling metric in Insights.
Images are your instant hit makers. They either stop the scroll or they don’t. While engagement rate and reach matter, timing and first-frame impact play a bigger role here than with any other format.
Here’s a summary table showing how key metrics differ from format to format.
How to see Reels analytics data on Instagram
Before we proceed to the detailed steps to access your metrics, you will need a business or creator account. If you have a personal account, switch to a professional account first.
Once you are set up, you can access Reel-specific metrics in two ways:
- Track overall Instagram Reels metrics under Account Insights
- Track individual Reels metrics
Let’s go through each of them.
Track overall Reels metrics
Want to see how Reels as a content format is working for you? What does the overall engagement look like? Here’s how to check that.
- Go to your profile and tap the hamburger menu (☰) in the top-right corner.
- Scroll down and tap Insights.
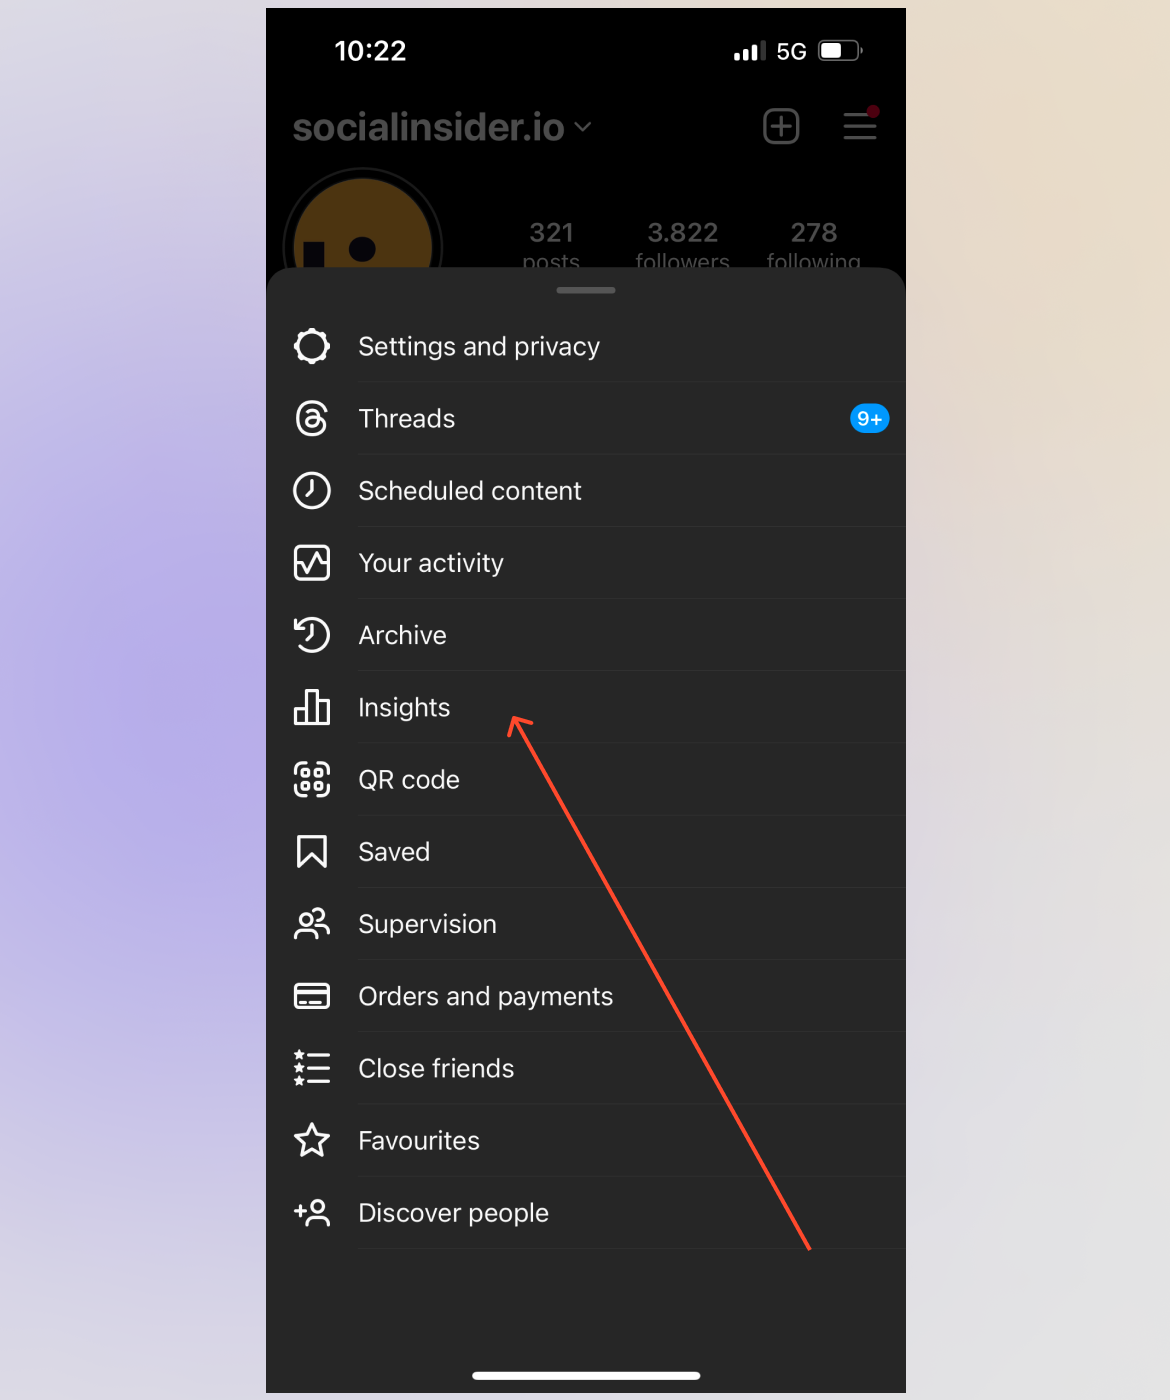
- Under Content you’ve shared, choose Reels to see analytics for all your recent videos. From here, you can check metrics like views, likes, comments, shares, and saves, and even sort Reels by newest, highest, or lowest.
Track individual Reels metrics
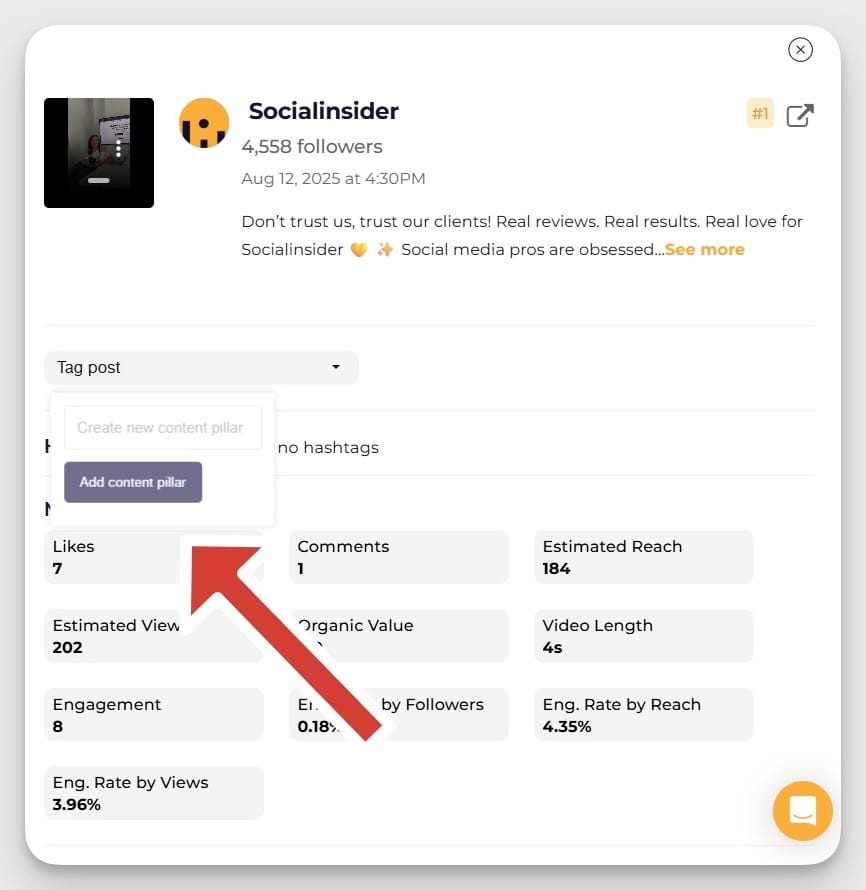
Want to see how a specific Reel is performing? Is the hook getting attention, or is the content pillar striking well? Here’s how you can check that.
- Open the Reel directly from your profile’s Reels tab.
- Tap the three dots (⋯) on the post.
- Select View Insights at the bottom to view metrics for the selected Reel.
How to see Reels analytics data using Socialinsider
Socialinsider offers in-depth Instagram analytics and has a dedicated section for Reels insights. Here’s how you can access it.
- Connect or add your account to Socialinsider
- Click on the account you want to check analytics from the left-sided menu
- Go to the Reels tab
Here's the data you'll get access to.
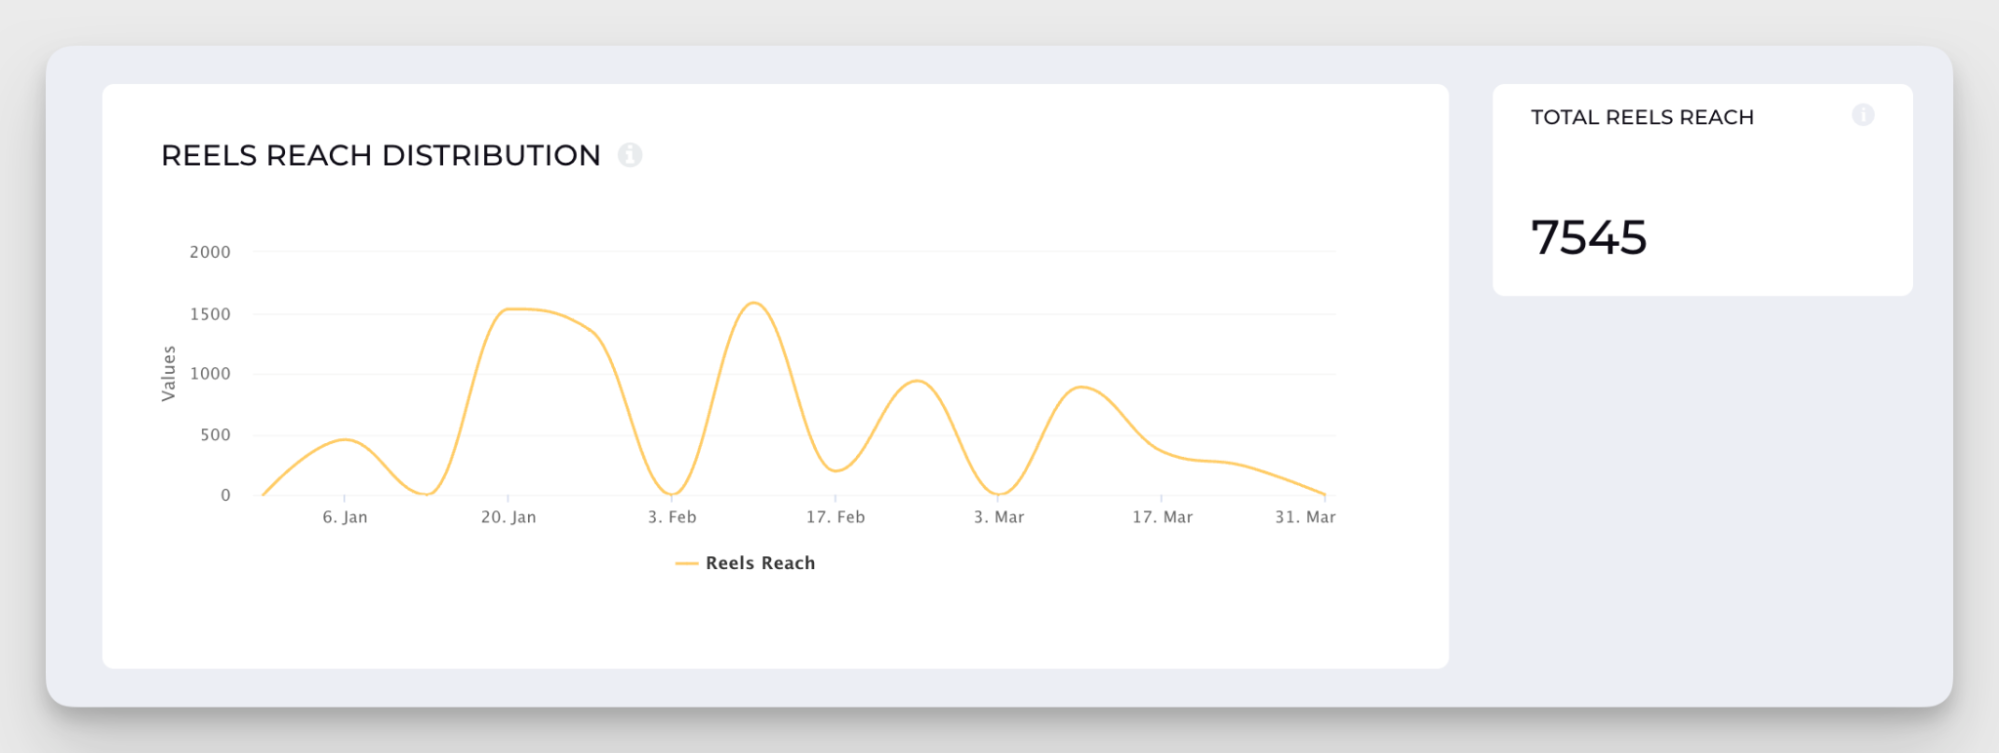
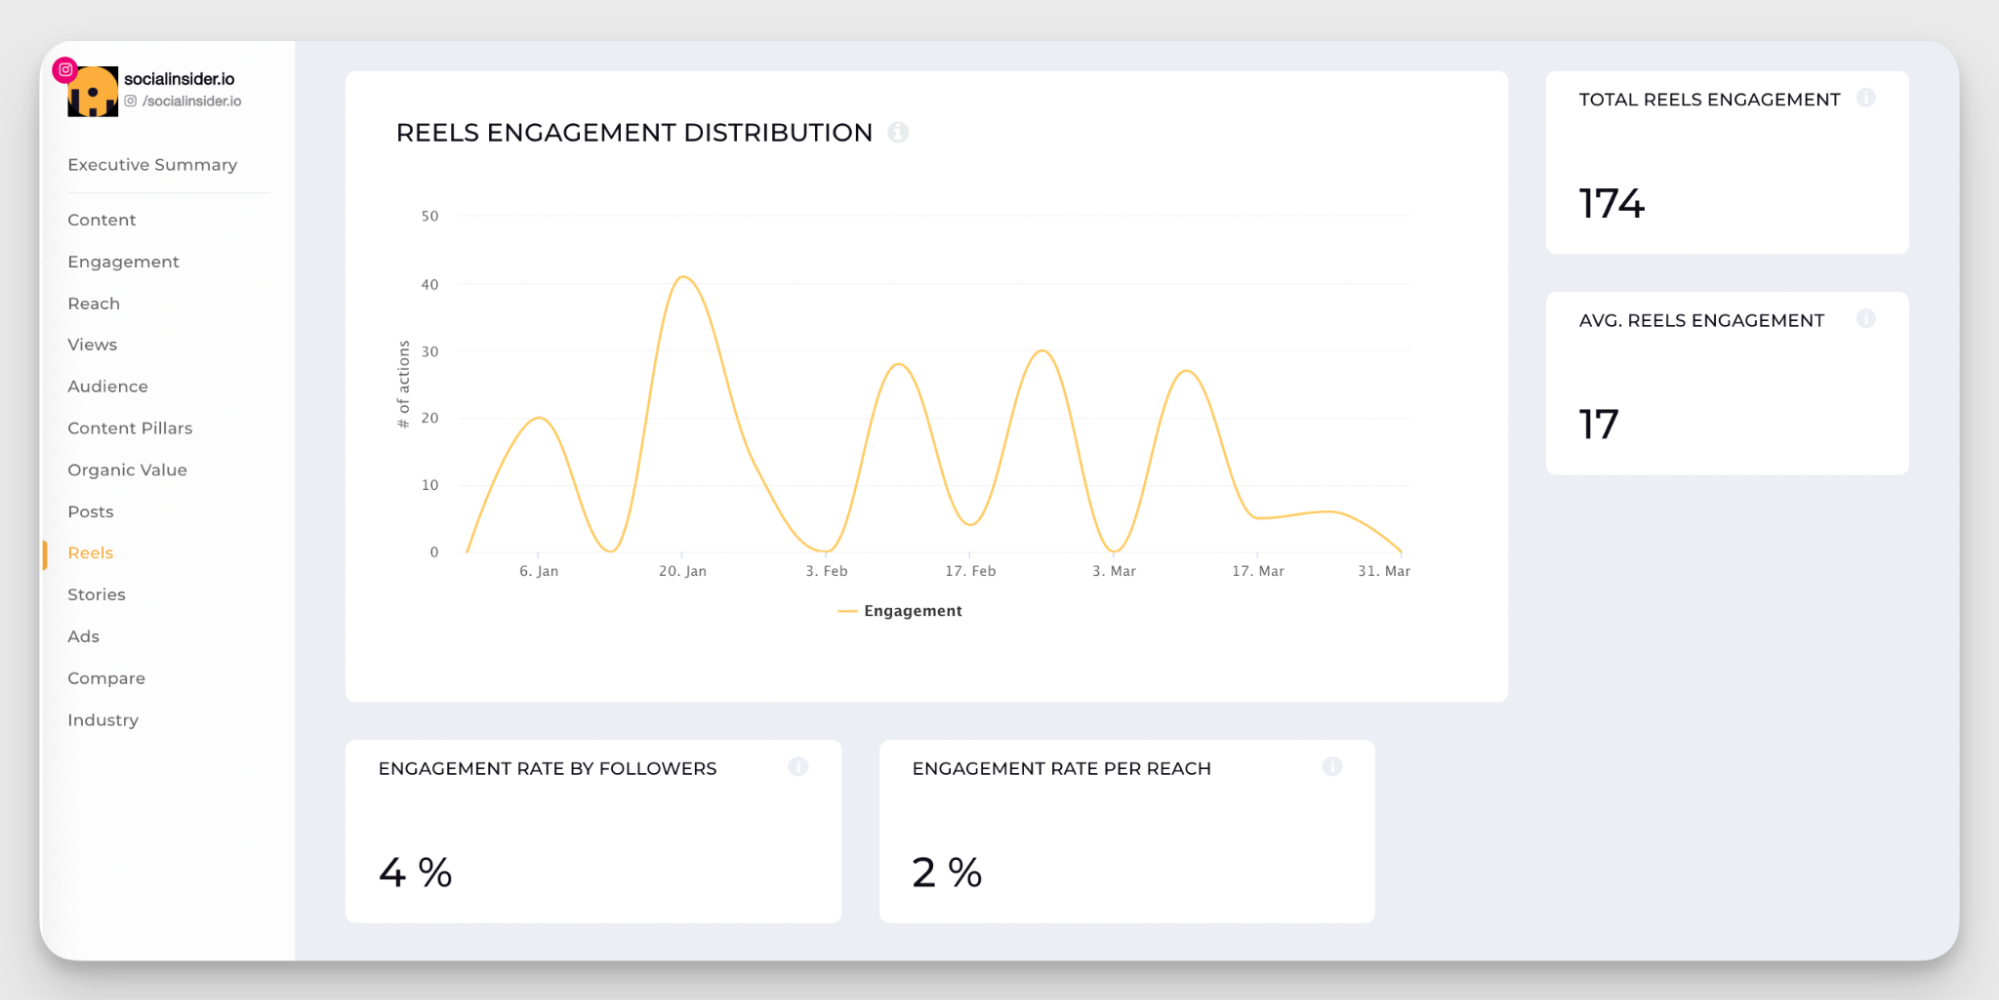
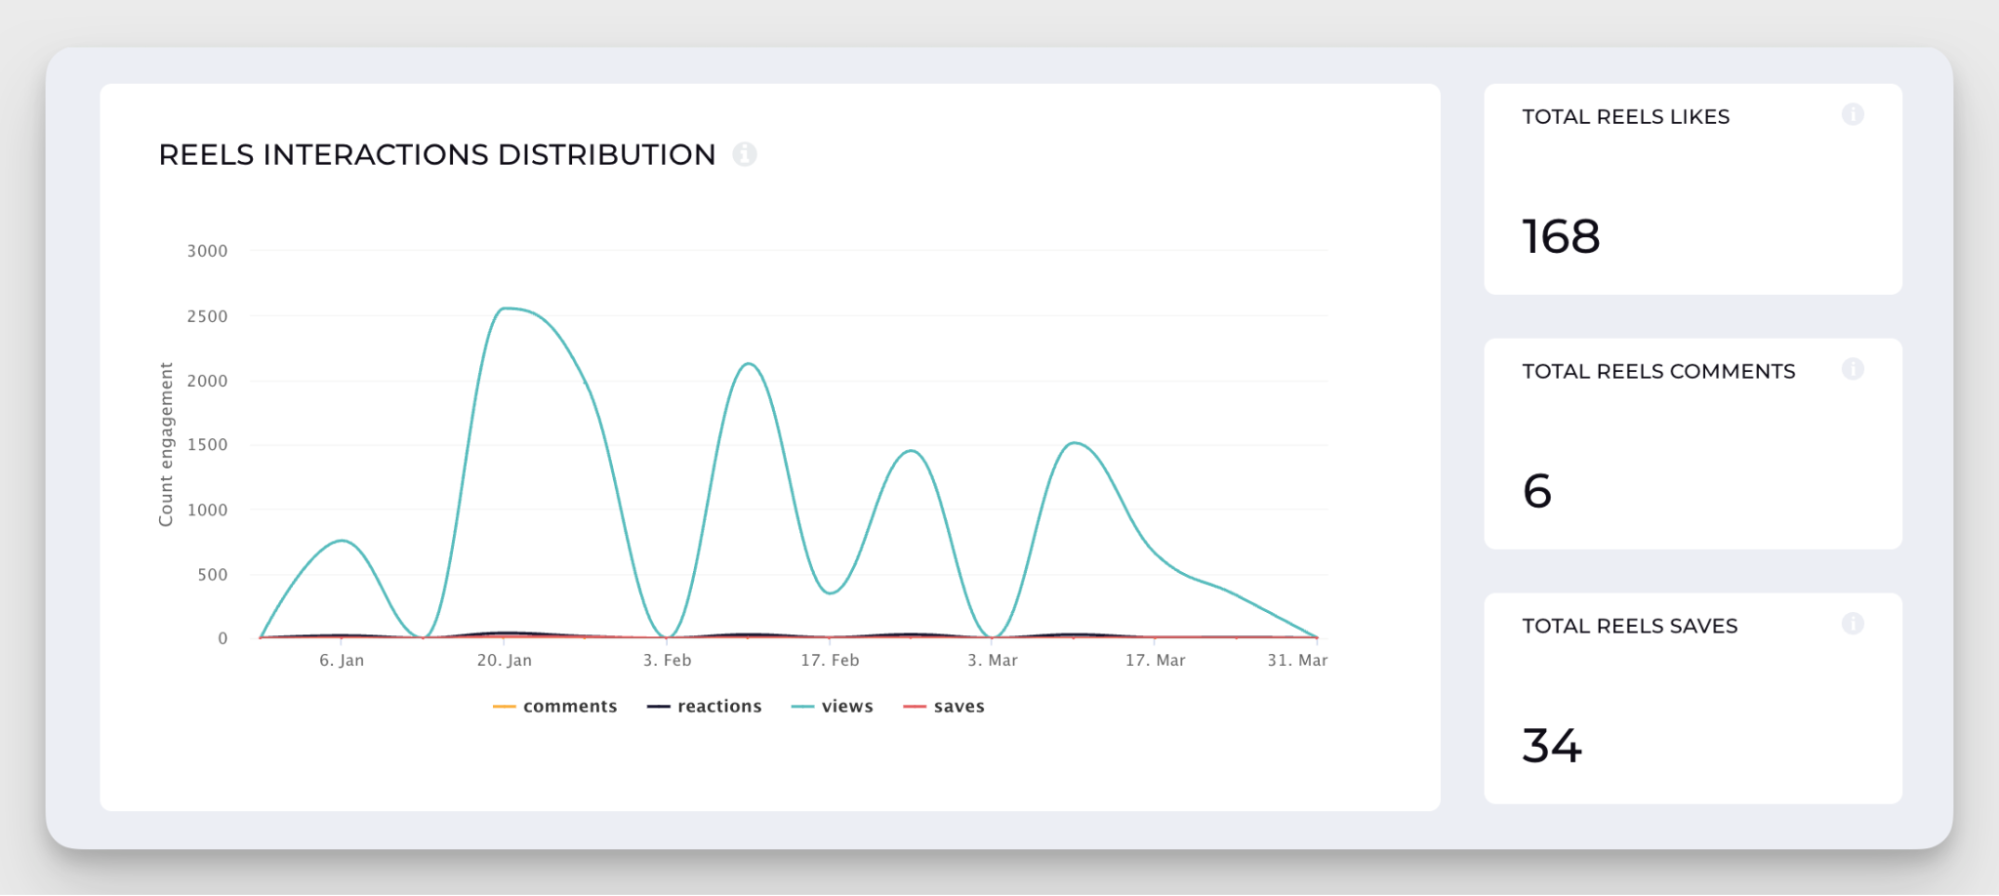
Reach
- Reels reach distribution over time: When and how your Reel got pushed. Use it to test post timings and trends.
- Total Reels reach: Number of unique accounts that viewed your Reel.
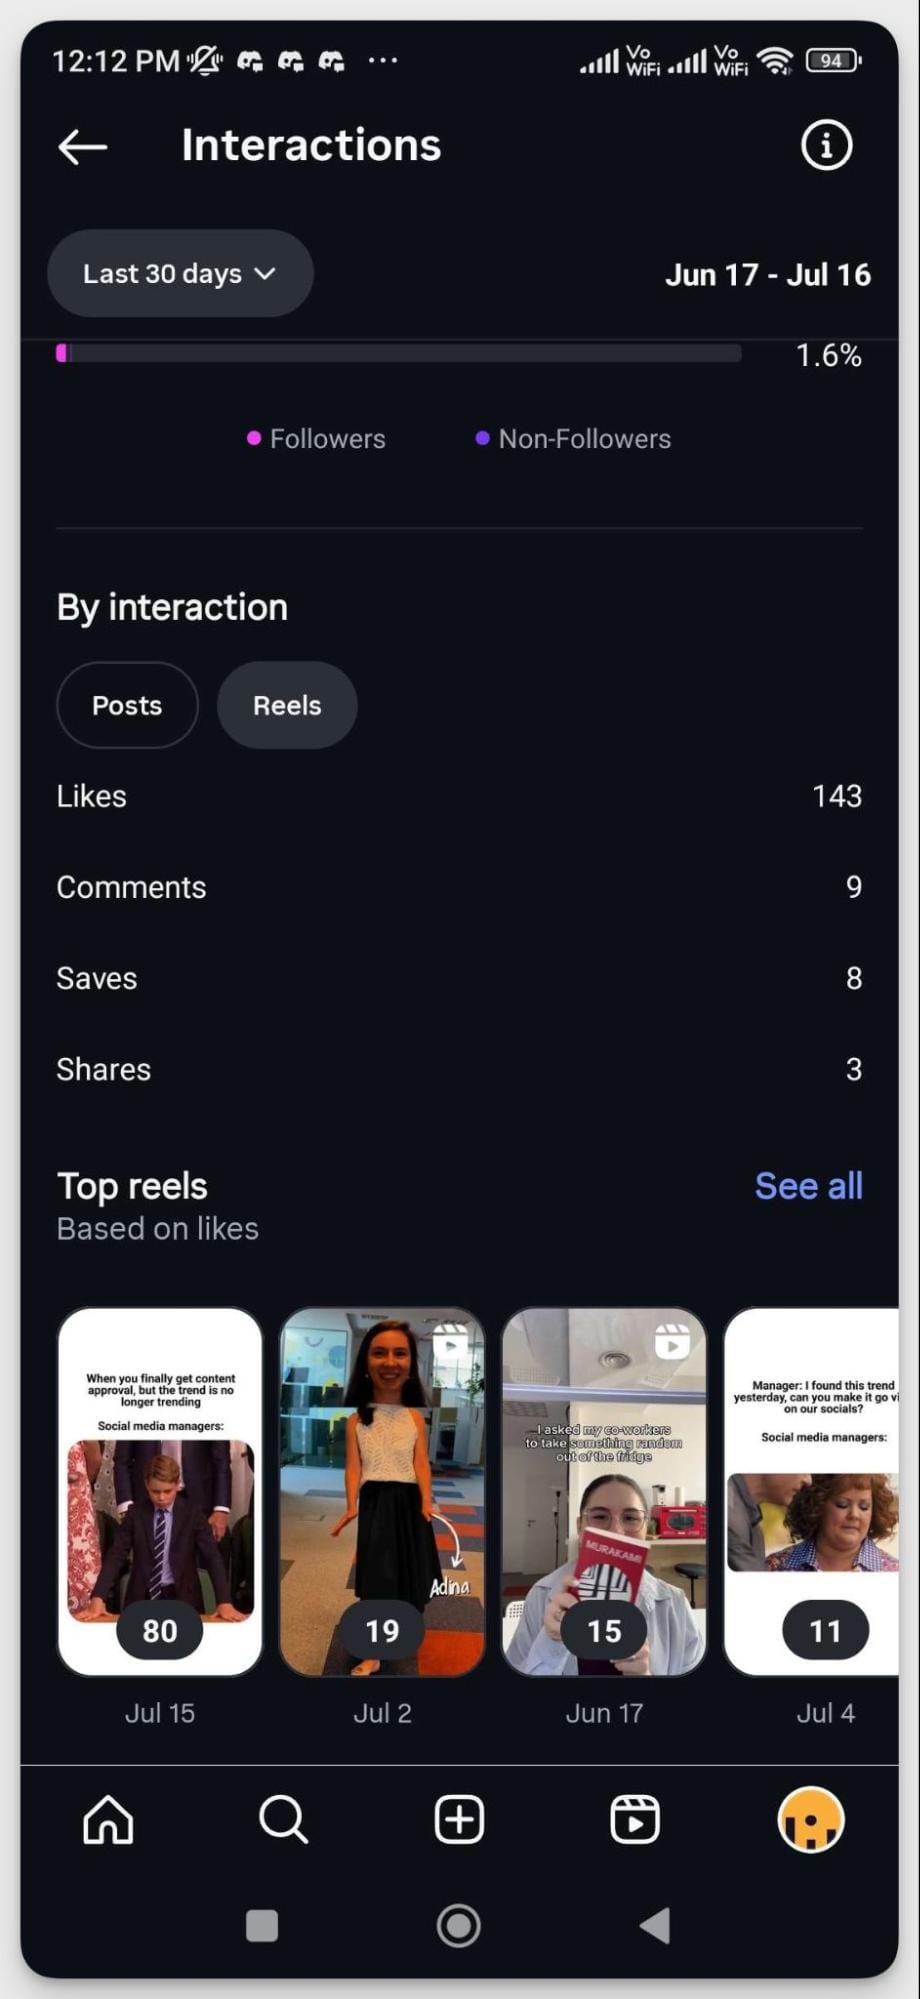
Engagement
- Total Reels and average engagement/Reel: Measures consistency and per-Reel performance.
- Engagement rate by followers: Shows how many of your own followers care enough to interact.
- Engagement rate by reach: Tracks how appealing you are to new viewers.
Interactions
- Likes: Quick approval clicks.
- Comments: Proof people felt strongly enough to respond.
- Saves: Number of users who bookmarked your Reel to view later.
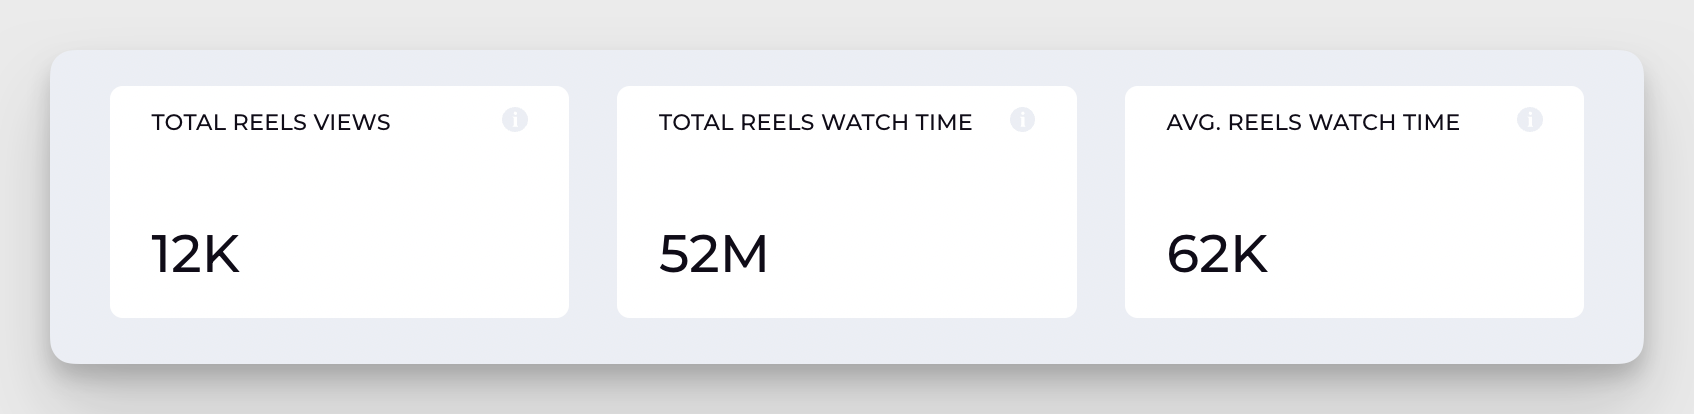
- Views: Total count of times your Reel was played.
- Watch time: The combined total minutes viewers spent watching your Reel.
Average watch time: Shows how much of your Reel people actually sat through.
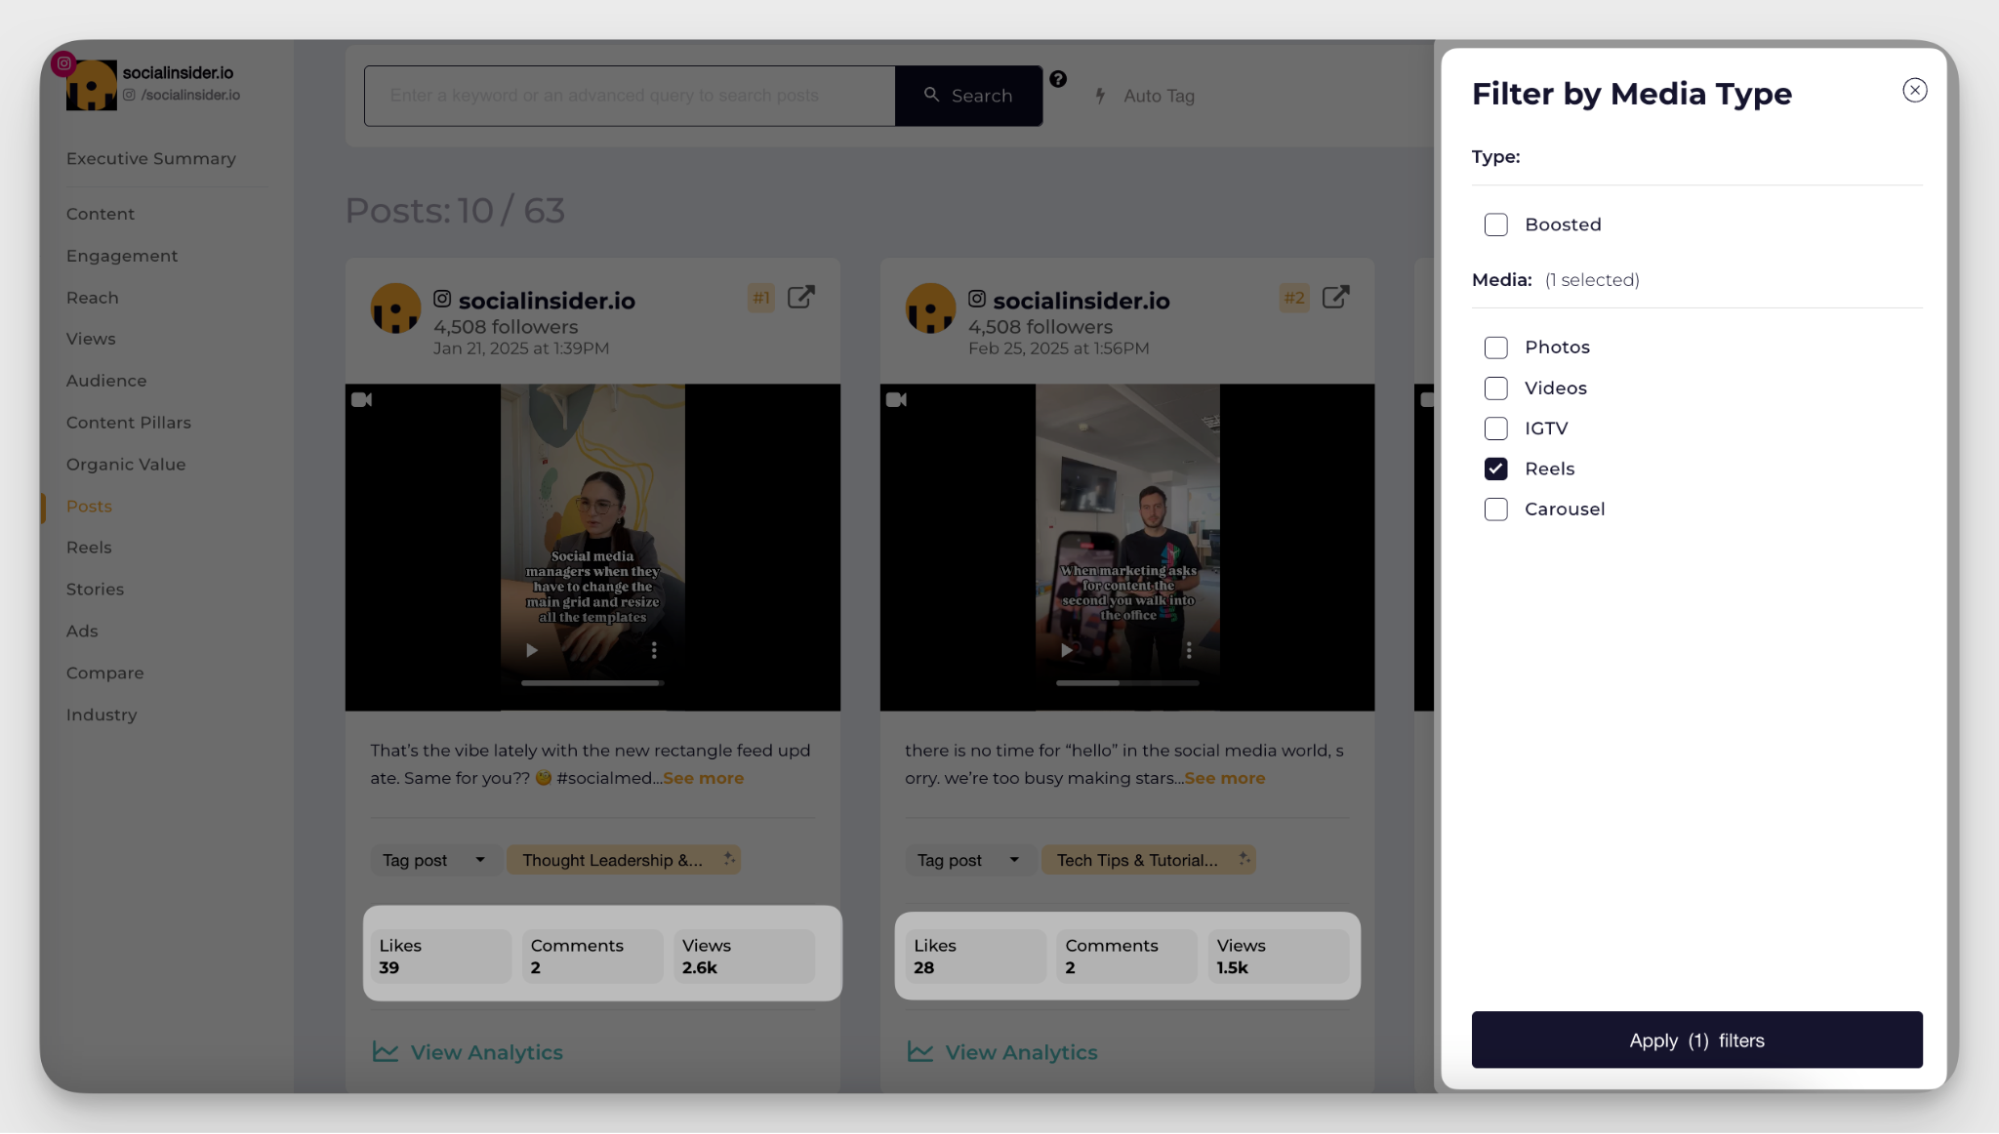
- To get individual Reel analytics, go to the Posts section and filter by Media type to select Reels. Select the specific Reel you want to get metrics for.
Important metrics to track to evaluate your Reels’ performance
1. Views for brand discovery
What it means: Instagram Reel Views show how many times your Reel was played. You can view this metric in Socialinsider by going to the Posts section and filtering media type.
How to analyze it: Pair views with average Reel watch time or completion rate signals. For example, a Reel may get 10K views, but if average watch time is just 3 seconds, it means people are dropping off quickly.
How brands should use it: Use views to test different hooks, intros, and creative formats. If views spike but watch time lags, refine your overall content. If both climb, double down on that content style for brand discovery. Hear from Miruna, who uses views to dig deeper into what worked.
A view is often the first touchpoint. It’s an algorithm connector. If your posts get more views, it likely means you did something right with your Reel. Maybe the algorithm picked it up and showed it to more people or pushed it onto the Explore or Reels tab
So, when you analyze your Reels and look at the view metric, ask yourself: why did the algorithm decide this Reel was worth showing? Was it the editing style, the trend you used, the sound choice, or the hook in the first few seconds? - Miruna Vocheci
2. Watch time and average watch time for content effectiveness and audience preference
What it means: Watch time is the total minutes viewers spent on your Reel, while average watch time tells you the average length each person watched.
How to analyze it: While talking to Miruna, she emphasized comparing both these numbers side by side to reveal the real insights. Here’s how.
A high total watch time with a low average watch time means your Reel was distributed but failed to retain attention. A low total watch time but high average watch time shows your content retained those who did see it, but it didn’t reach enough people. And when you see a sharp drop-off in the first few seconds, that usually points to a weak hook or a mismatch between the viewer’s expectations and the content delivered.
How brands should use it: Use these insights to fine-tune pacing, structure, and video length.
I’ve noticed some clear patterns in watch time related to video length. After analysis, for the next Reel, you can understand what the best length is for your audience and what they prefer. In my opinion, these metrics tell you more about audience behavior and preferences rather than whether the post was well-performing or not, and that’s far more useful when planning content strategy. - Miruna Vocheci
3. Reach for strategy effectiveness
What it means: Reach measures the unique number of people who saw your Reel.
How to analyze it: The real value of reach comes from looking at trends over time. A single Reel with high reach could be a one-off spike thanks to a viral sound, but sustained growth across multiple Reels shows consistency in your strategy.
As our social media manager puts it:
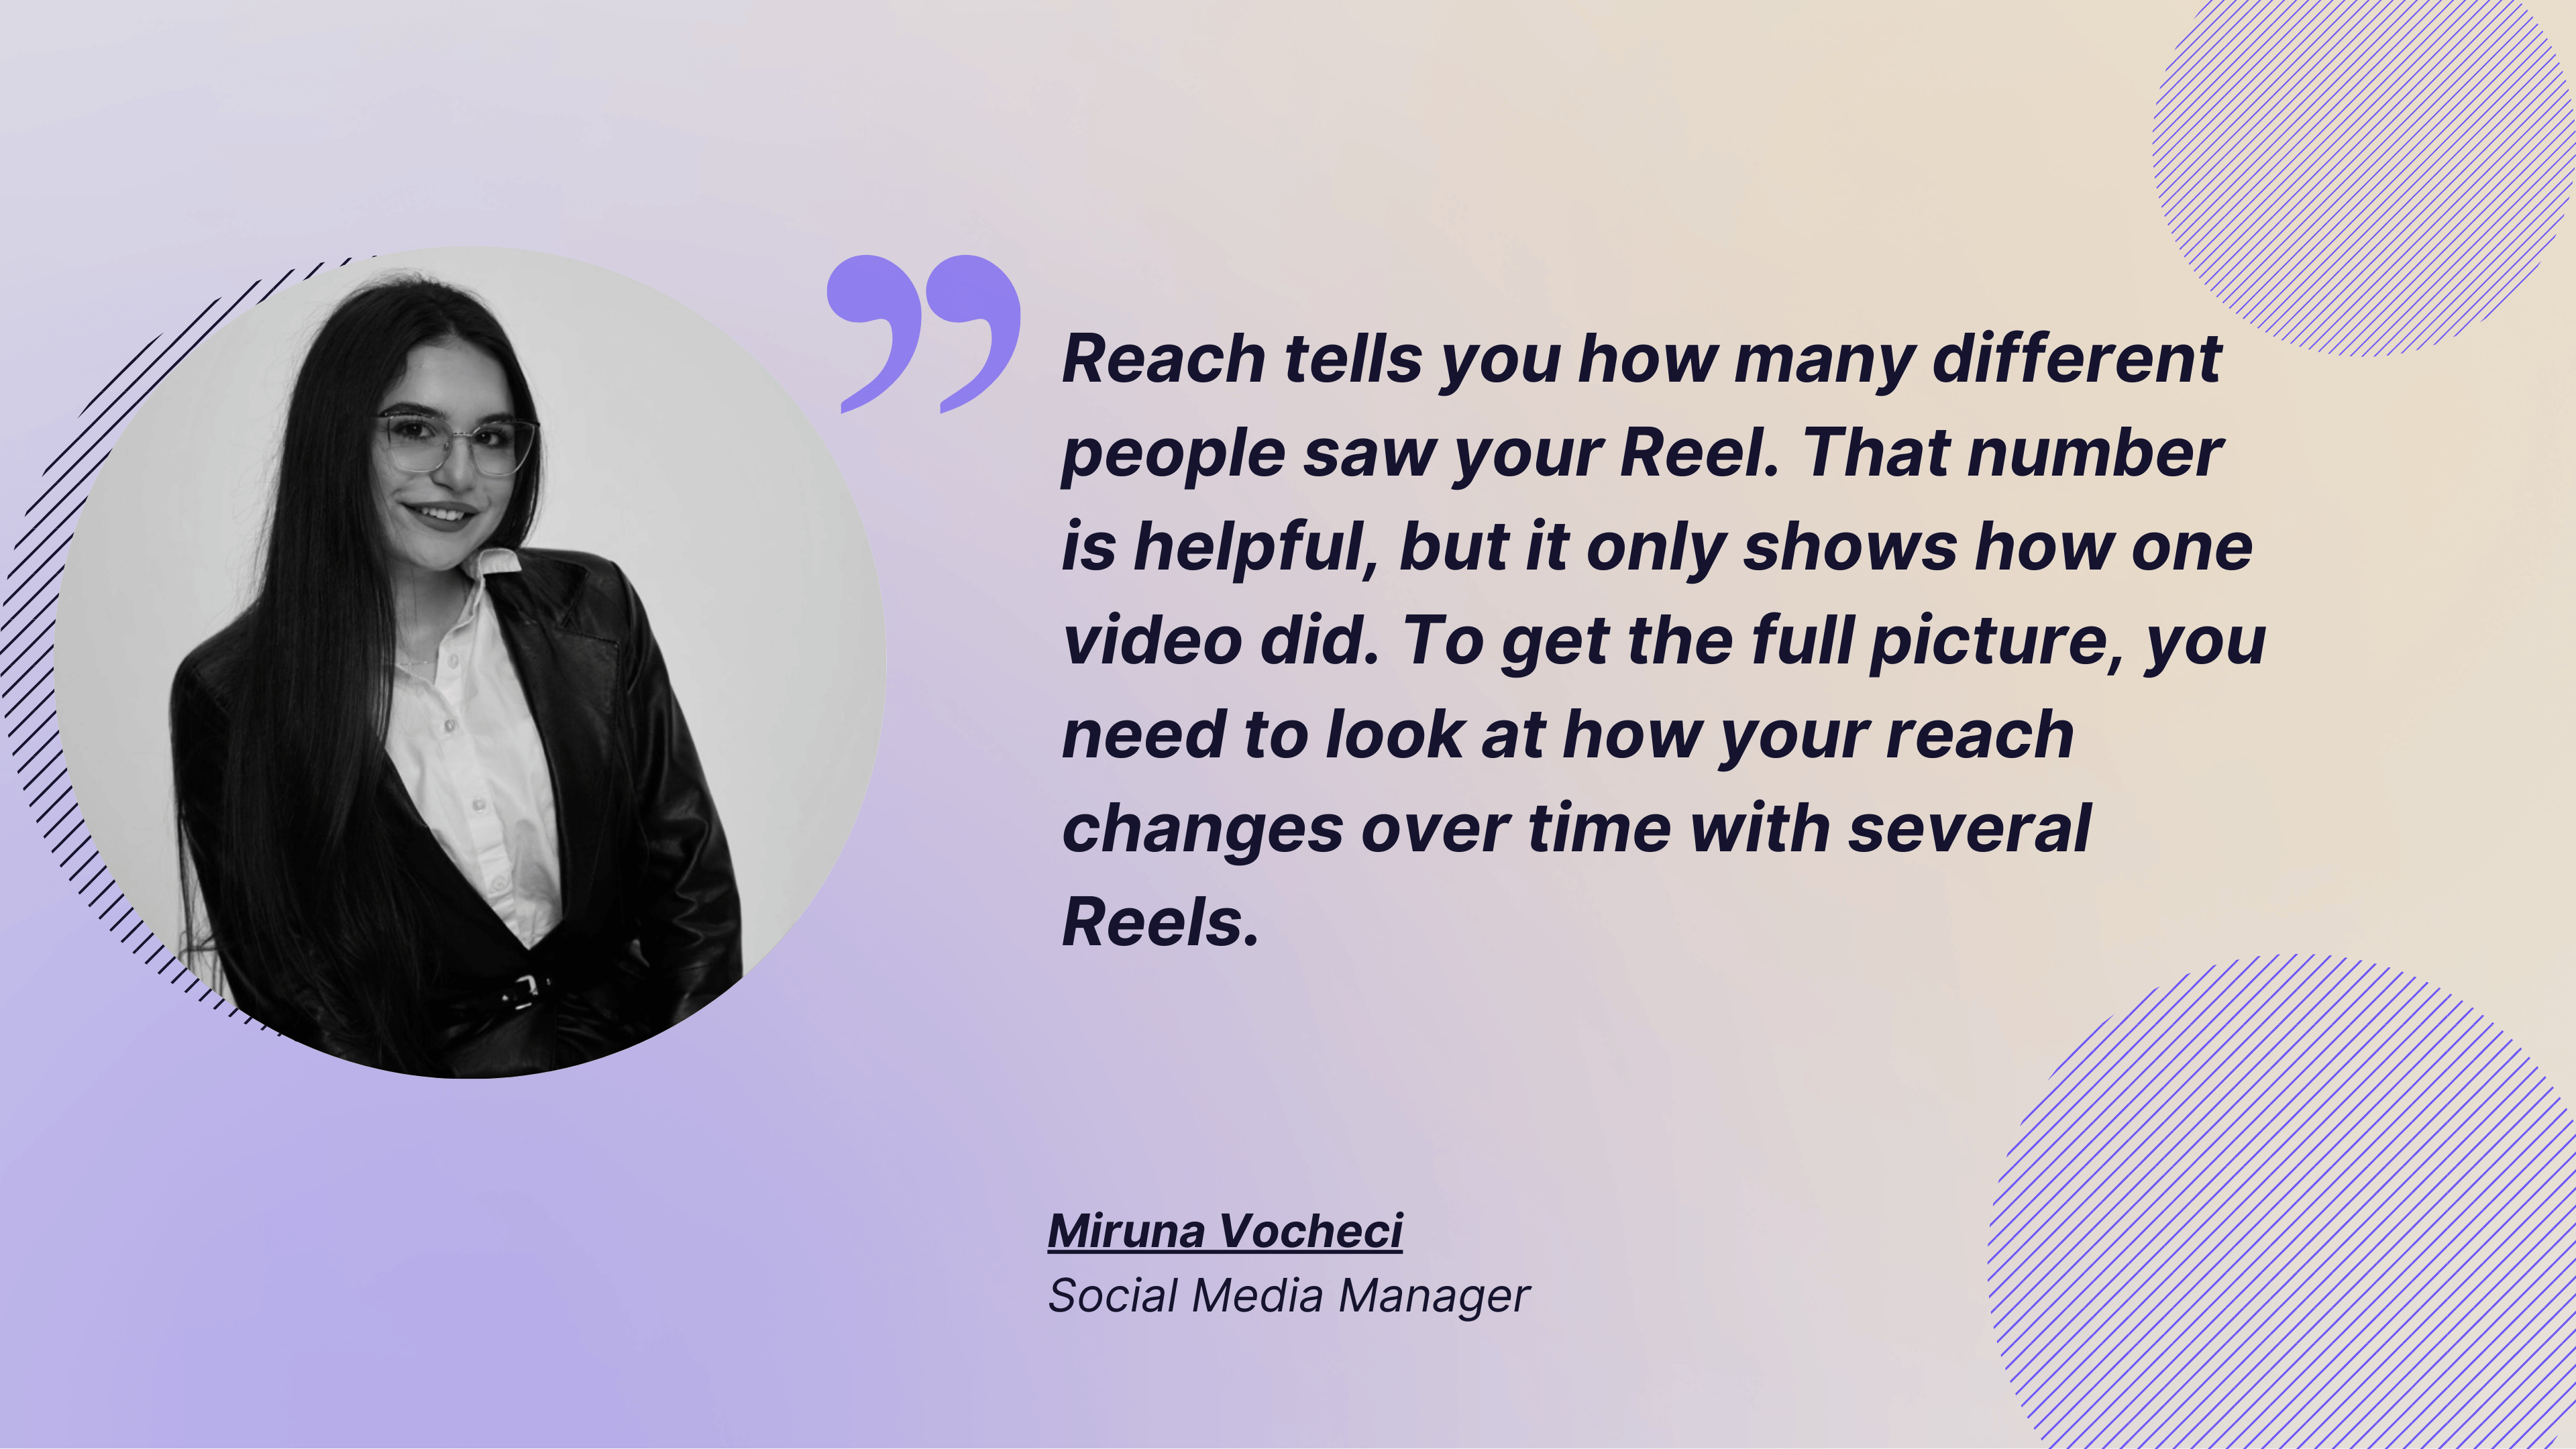
Reach tells you how many different people saw your Reel. That number is helpful, but it only shows how one video did. To get the full picture, you need to look at how your reach changes over time with several Reels. Maybe one Reel followed a viral trend and got more reach, but was it just luck, or is it constant? For me, the raw reach number shows how a single Reel performed, but the trend shows what’s really happening with your content overall. - Miruna Vocheci
Socialinsider shows you this data with a click.
How brands should use it: If reach is climbing, double down on what’s working, whether that’s a certain hook, audio, or posting time. If it’s slipping, test new formats, adjust captions, or ride a trending sound to revive momentum.
4. Engagement for audience content preference
What it means: This is measured by likes, comments, shares, and saves. They reveal whether your content is sparking curiosity, conversations, or actions beyond a passive view.
In addition to individual Reel engagement data, you can use Socialinsider to get engagement metrics for all your Reels over a certain time period.
How to analyze it: I generally compare engagement metrics with other analytics to get a fuller picture.
- High average Reel views + low engagement → People saw my Reel but didn’t find it compelling enough to act.
- Moderate reach + high engagement rate → A smaller audience, but one that’s deeply invested in my content.
- High comments vs. low likes → Viewers felt strongly, positively or negatively, which can spark discussion and visibility.
How brands should use it: If saves dominate, double down on practical, value-packed content. If shares outperform, experiment with bold hooks or relatable humor. And if engagement lags despite high reach, revisit your storytelling.
5. New followers from Reels for attracting your ICP
What it means: This metric shows how many people decided to follow you after watching a specific Reel. As Miruna says, “New followers from Reels is a metric that feels like a reward; your content is not only being seen but also inspiring people to want more from you.”
How to analyze it: For that specific Reel, connect this with other Instagram metrics to reveal more insights. Here’s how.
- High reach + low follows → Your content is being discovered but isn’t compelling enough to convert.
- High engagement + high follows → The Reel not only sparked interaction but also trust and interest.
- Low views + high follows → A smaller audience, but one that found the content strong enough to commit.
How brands should use it: Track which Reels consistently bring in new followers and reverse-engineer why. Was it the topic, the tone, or the pacing? Use this metric to identify your most ‘conversion-worthy’ creative patterns. Then build more content in that direction to grow your community faster.
Advanced Reels analytics that can help you shape your Reels strategy
Top sources of views
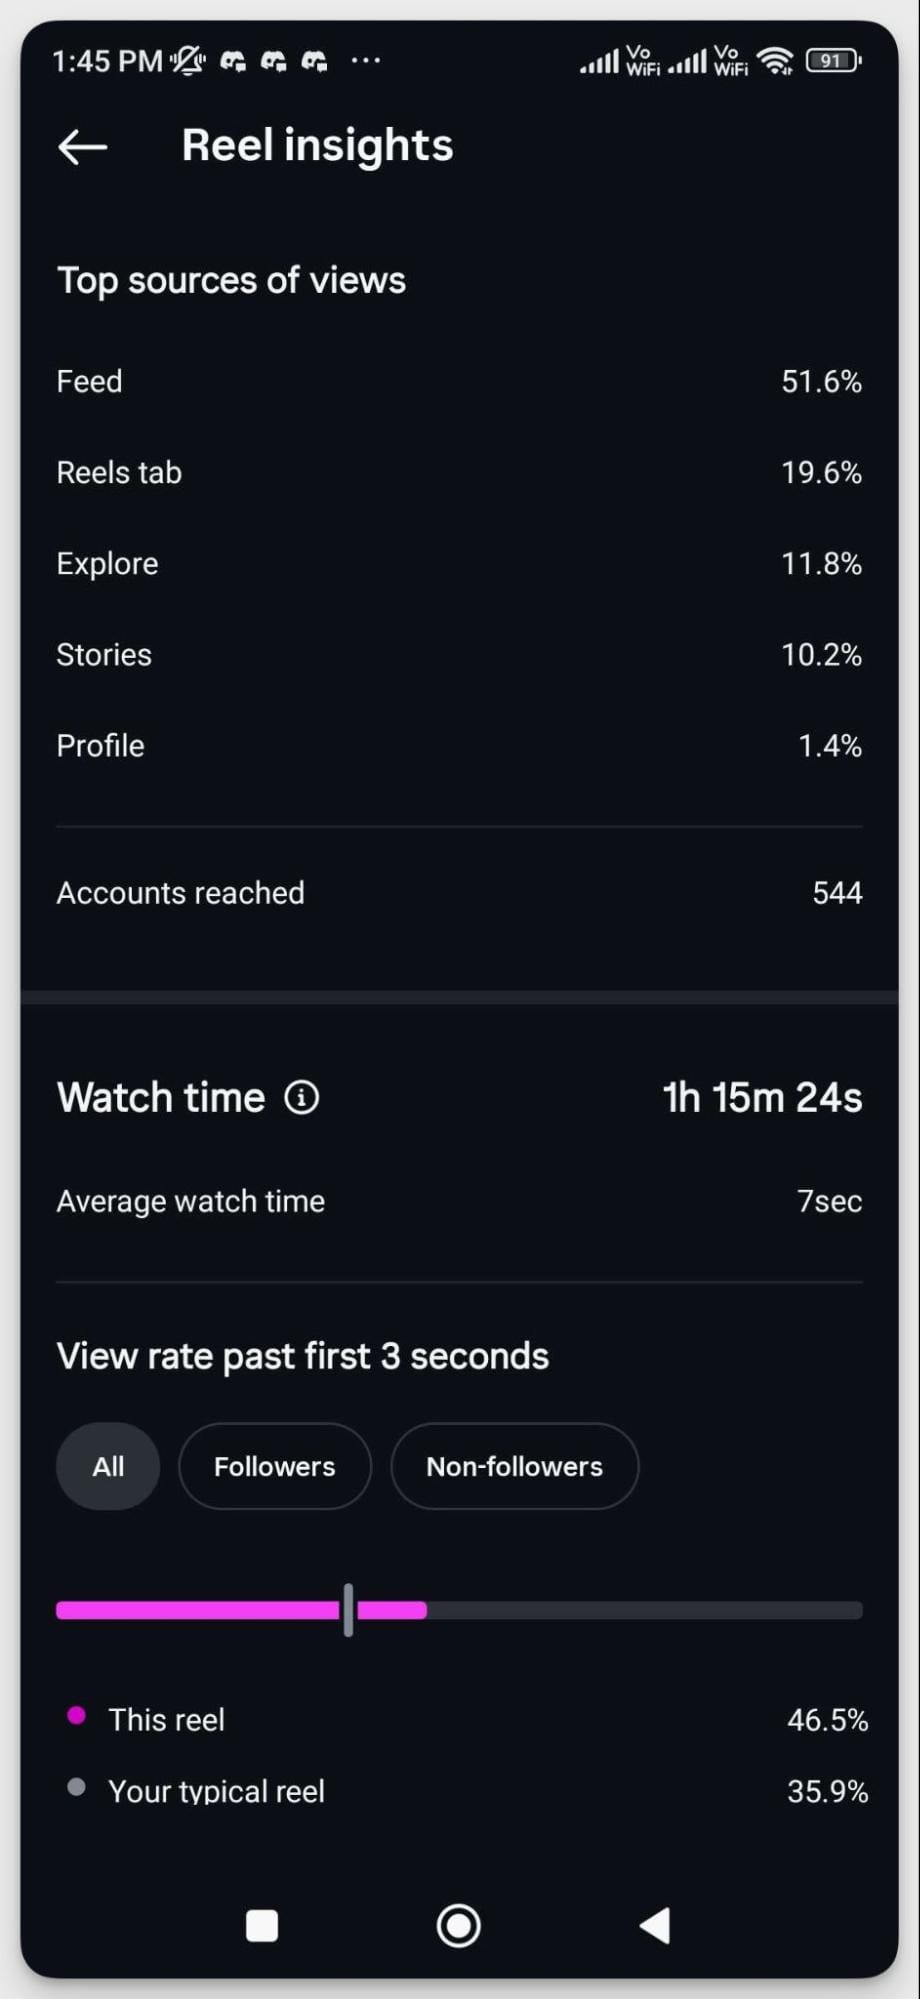
What it means: This metric shows how people actually discovered your Reel. The top sources usually are: Feed, Reels tab, Explore, Stories, profile, and Search. You can find this in Instagram’s native analytics.
How to analyze it: Look at how your view sources differ from one Reel to another.
If Explore is driving the bulk, you know the algorithm is picking up your content and pushing it to new audiences. If most views come from the Home feed, you’re resonating with your followers but not breaking out. Heavy Profile views mean people are intentionally seeking you out, while Shares suggest your Reel is traveling by word of mouth.
How brands should use it: Your top sources reveal how people find you, whether through discovery, community, or direct interest. Compare it to your goals. For example, if you’re trying to gain followers, you’ll want most views to come from discovery sources like Explore.
Instagram Reels length
What it means: Reels length shows you how much room you have to tell your story. Too long, and viewers swipe away. Too short, and you might leave impact on the table.
According to Socialinsider’s data, 1-minute Reels hit the sweet spot for both views and engagement.
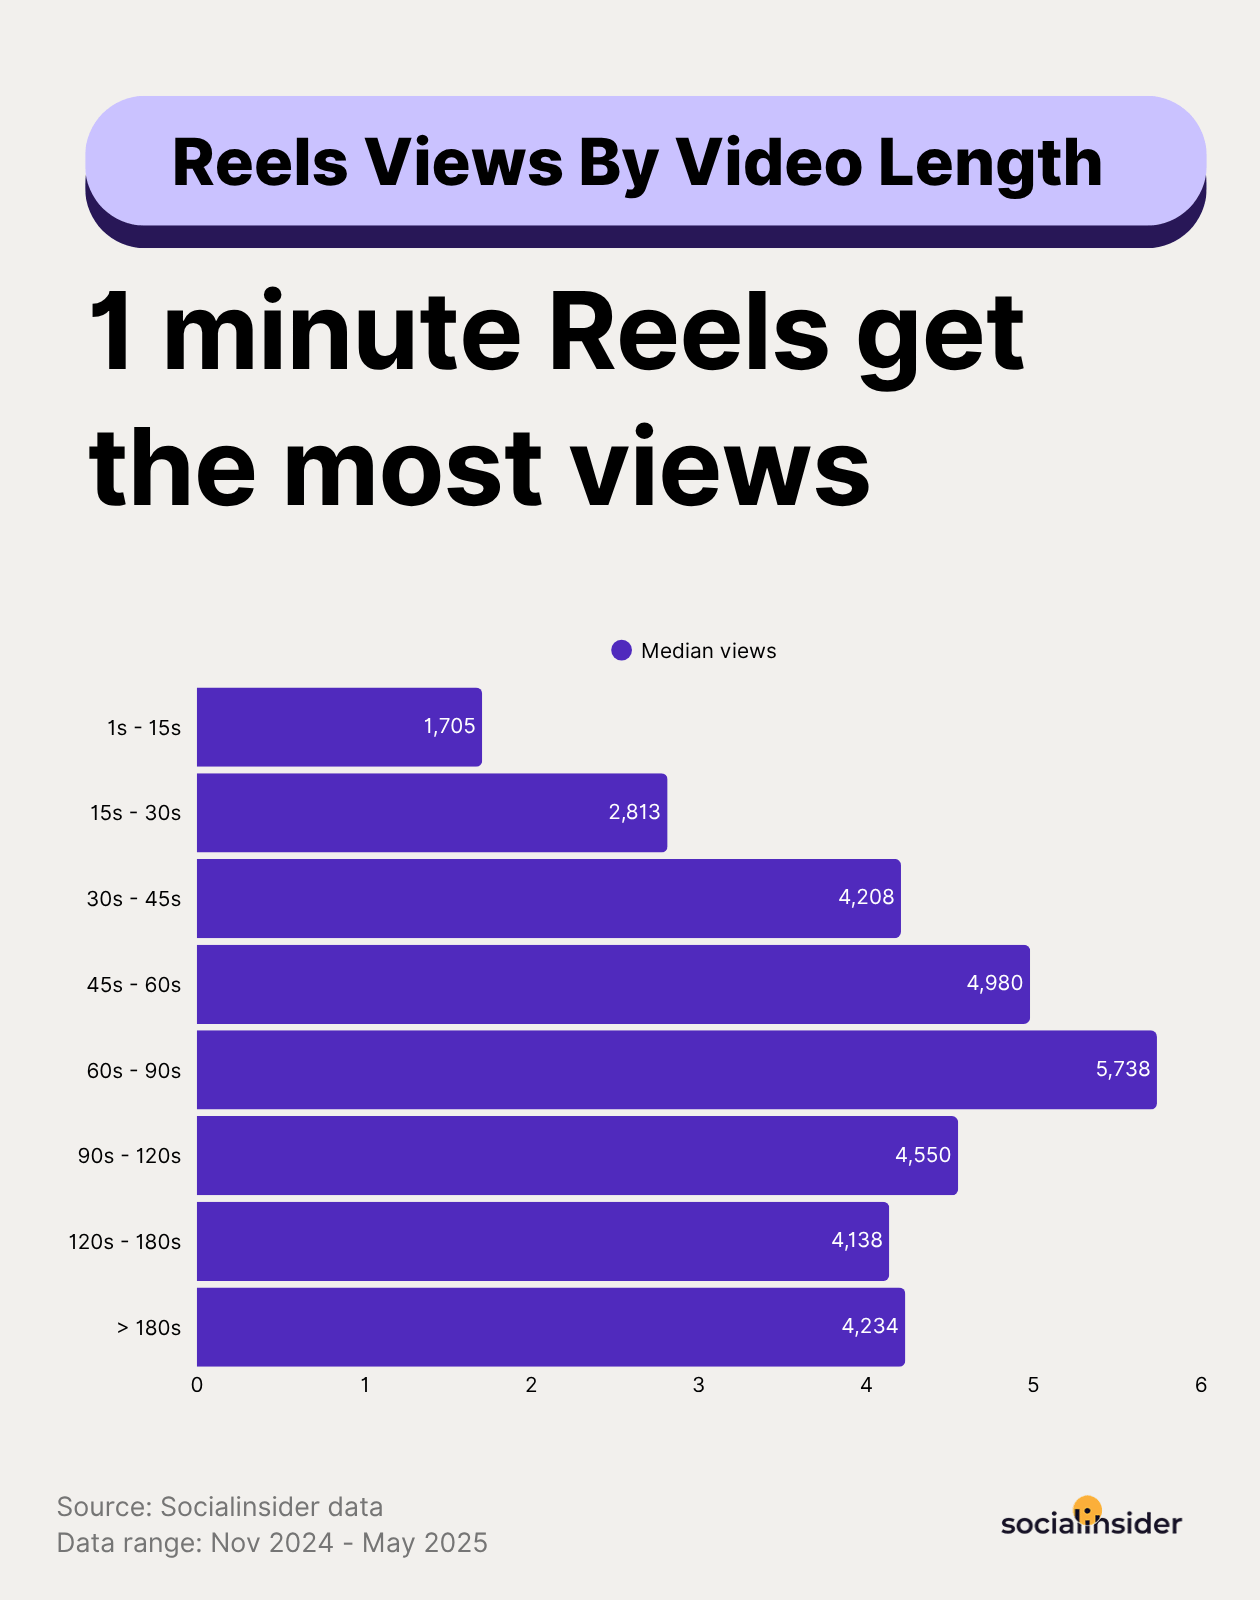
How to analyze it: Look at watch time alongside length. A sharp drop in the first few seconds? Your hook is weak. High completion on shorter Reels? Your audience may prefer snappy content. Low completion on long ones? You’re losing them halfway.
How brands should use it: Treat length as a variable you can experiment with. Start testing around that 1-minute mark, then adjust. If your storytelling needs more time, earn it with a killer hook and tight pacing. If quick hits work better, lean into short, high-impact Reels.
Top performing content pillars
What it means: Top performing content pillars show you which categories of your Reels (like tutorials, behind-the-scenes, memes, product showcases) actually move the needle.
How to analyze it: With tools like Socialinsider, you can tag your Reels into different content pillars and track performance across them.
This makes it easy to see not just which single Reel popped off, but whether, say, your ‘educational’ content outperforms your ‘trendy’ content over time.
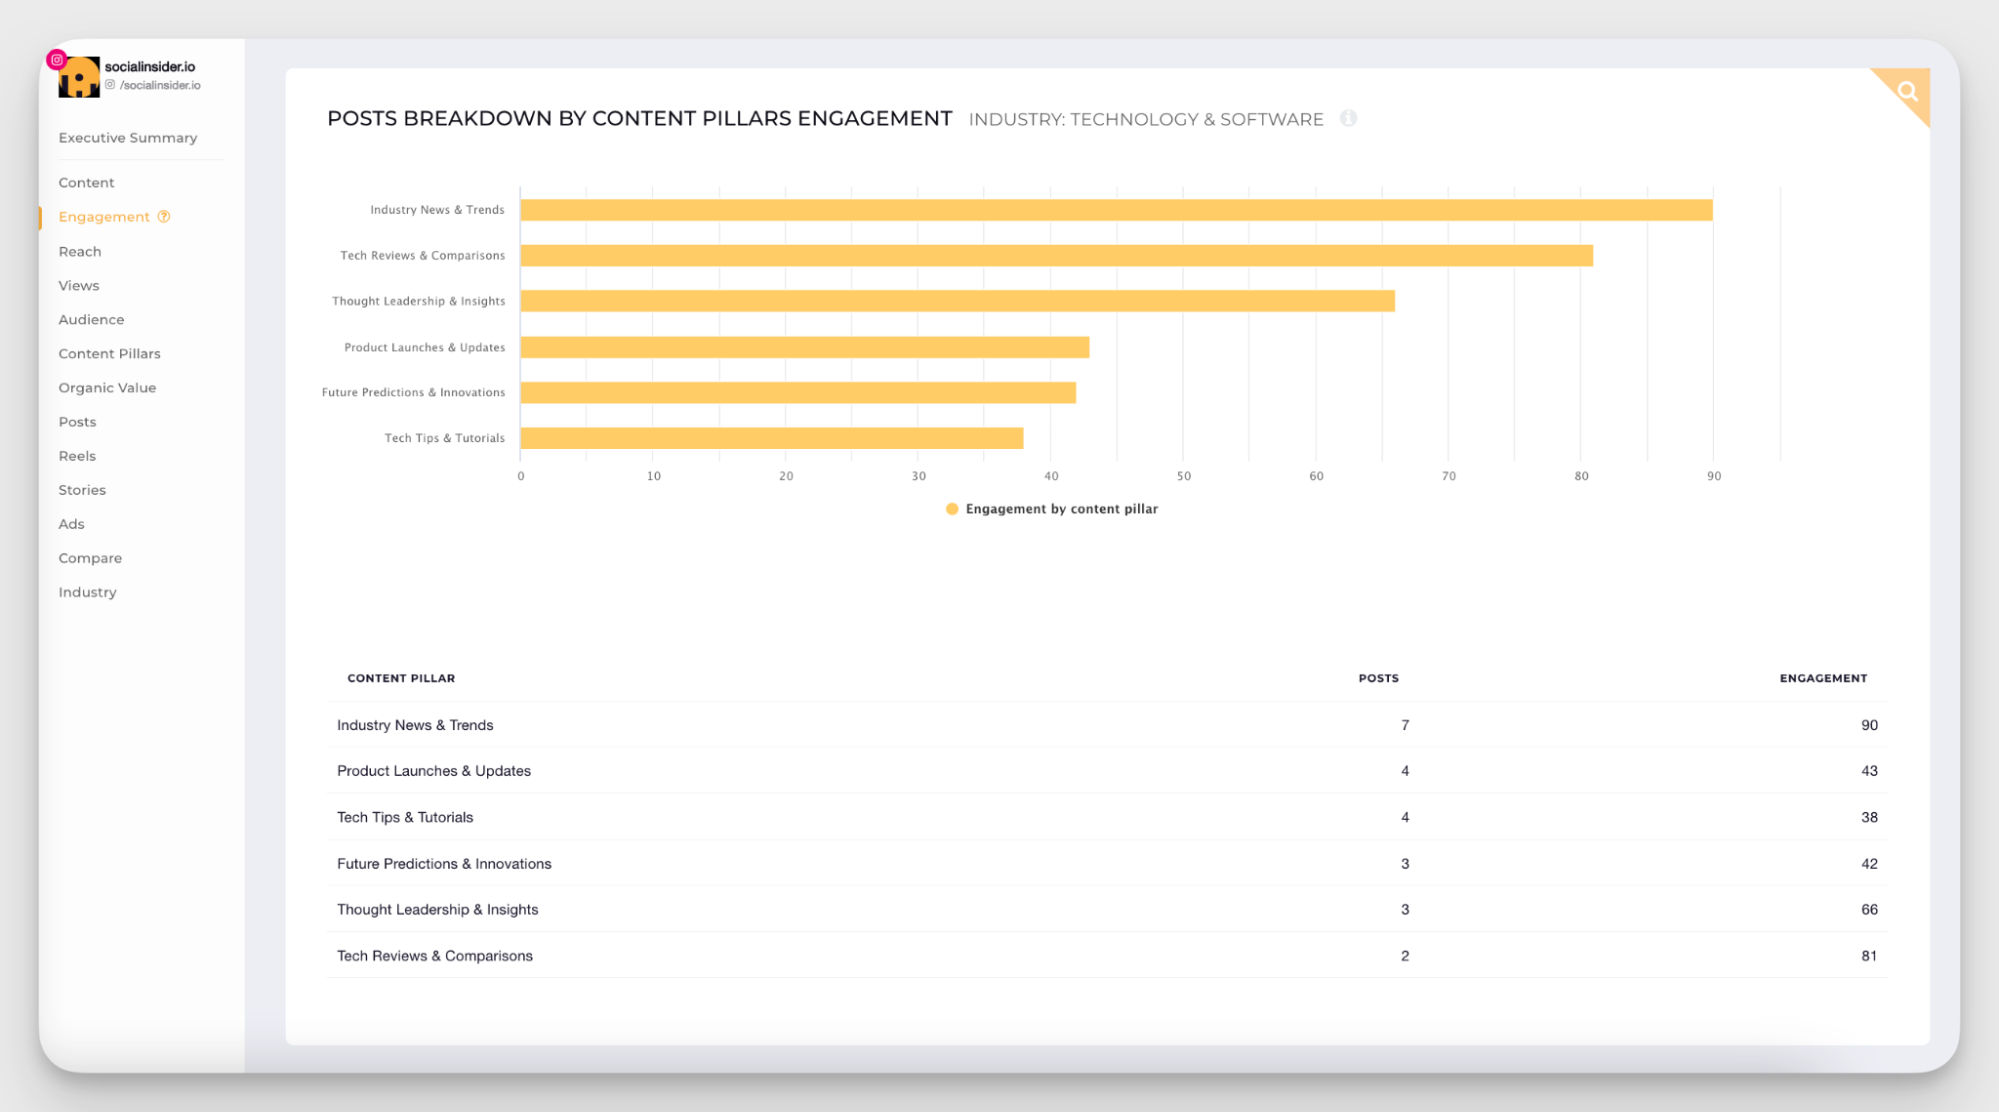
I use this breakdown myself. Sometimes, the Reels I thought were just fillers ended up pulling the most new followers simply because they hit the right pillar.
How brands should use it: Experiment with different content pillars, use Socialinsider to categorize Reels into these pillars, and compare analytics over time.
Competitive Reels insights
What it means: Competitive insights let you peek over the fence at how other brands’ Reels are performing. Instead of guessing what’s trending or what format lands, you learn directly from what’s working (or flopping) in your niche.
How to track and analyze it: Start by studying your competitors’ top Reels: were they behind-the-scenes clips, POV storytelling, or group-based content? You can do this by adding your competitor’s social profile to Socialinsider. Sort that data by engagement to get their Top Reels.
How brands should use it: Look for repeating patterns. Also note posting strategies - how many Reels do they publish a month, and what percentage of their total content do Reels make up? For example, if their BTS Reels are pulling major saves, test your own spin on ‘day-in-the-life’ content. If they’re pumping out 10 Reels a month and you’re at 2, consider whether your cadence is holding you back.
When to choose native Instagram insights vs third-party tools for Reels analytics?
Here’s how third-party tools and native insights differ from each other on certain features and aspects.
When to pick native Instagram analytics over third-party tools?
- If you need instant performance analysis for Reels: Native Insights update in real time, while third-party tools have sync delays.
- When accuracy matters most: You’ll always see the full, unfiltered dataset (third-party tools are bound by API limits).
- For exclusive metrics: Instagram keeps some insights (like certain reach/impression breakdowns) locked in the app.
- If you need to check performance for Reels quickly: Basic charts and a fixed timeframe are enough for quick health checks.
When to pick third-party tools over native Instagram analytics?
- If you want flexibility: Set custom date ranges instead of being boxed into Instagram’s presets.
- For reporting and collaboration: Export data into CSV/PDF, set up automated reports, or share dashboards with your team.
- When managing multiple platforms: Compare Instagram performance with TikTok, YouTube Shorts, or LinkedIn in one view.
- To track competitors: Benchmark your Reels performance against other accounts, something Instagram doesn’t allow.
- For advanced analysis: Use custom metrics, trend visualizations, and alerts to spot opportunities and risks faster.
Top 4 Reels optimization best practices from Socialinsider’s social media expert
Miruna talks about her go-to best practices while managing our social media accounts.
Test different hooks within your main content pillars to see what grabs attention most
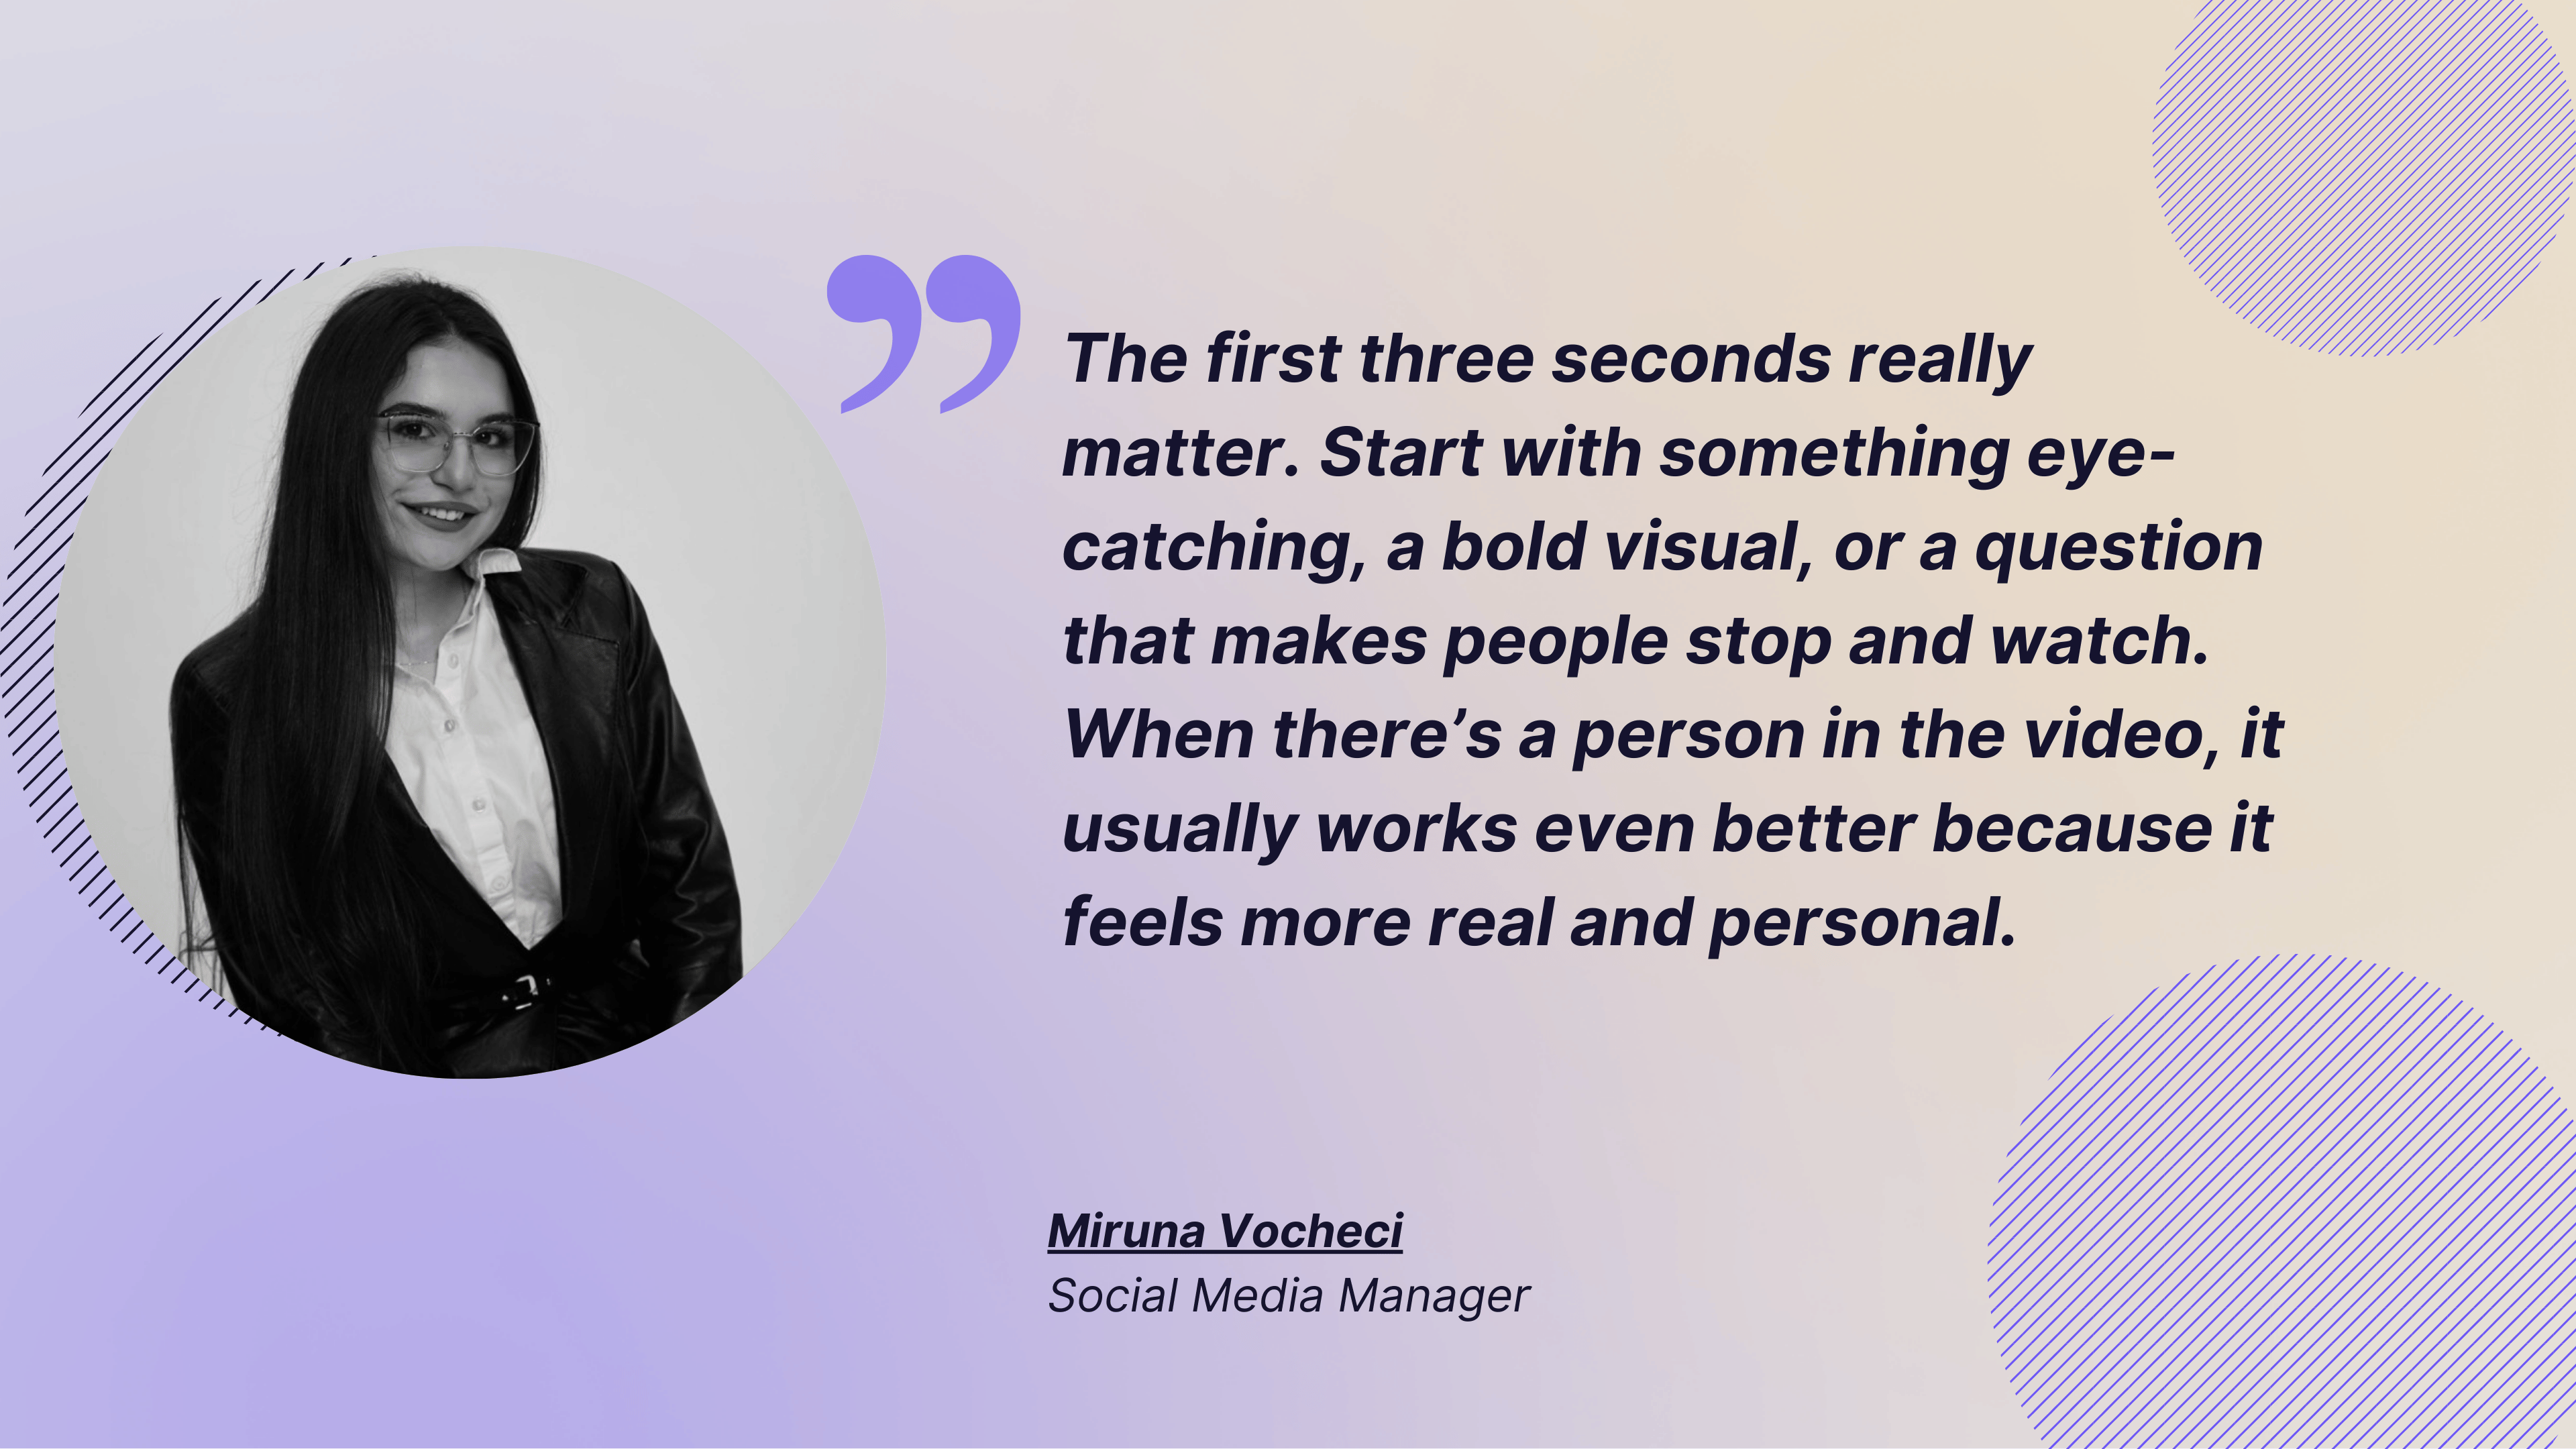
The first three seconds of your Reel are make-or-break. As Miruna mentions:
“The first three seconds really matter. Start with something eye-catching, a bold visual, or a question that makes people stop and watch. When there’s a person in the video, it usually works even better because it feels more real and personal. - Miruna Vocheci
Think of your content pillars (like tutorials, behind-the-scenes, or customer stories) as the themes. Within those themes, play around with different openers: a punchy question, a surprising fact, or a quick visual tease. Compare performance to see what consistently hooks people in.
While playing with the hook, don’t forget the details:
Optimize text and caption within the video, place your text where it won’t get covered by buttons or other stuff on the screen.
Be relatable and human
Ever saw a Reel that felt like it was made just for you? That’s the power of relatable, human-centric content. Here’s what Miruna had to say about it.
I know it sounds cliche, but you won’t click with everyone, and that’s okay. Think about the main groups in your audience and what they like. Maybe it’s Gen Z humor and jokes, everyday office life, or helpful tips and hacks. Focus your Reels around those groups so your content feels real and speaks directly to the people who matter most. - Miruna Vocheci
Here’s one example from our page.
Approach audios strategically
Audio can be a great discovery tool for your Instagram page. The right sound can place your Reel on the audio’s own page, where people actively scroll for inspiration.
Miruna also talks about how it can help engage people better.
It makes your Reel more engaging, because people usually recognize the sound based on a trend. And even though Adam Mosseri said that trending sounds don’t directly affect reach compared to original audio, I think they still help your content feel relevant and catch viewers’ attention, which is super important. - Miruna Vocheci
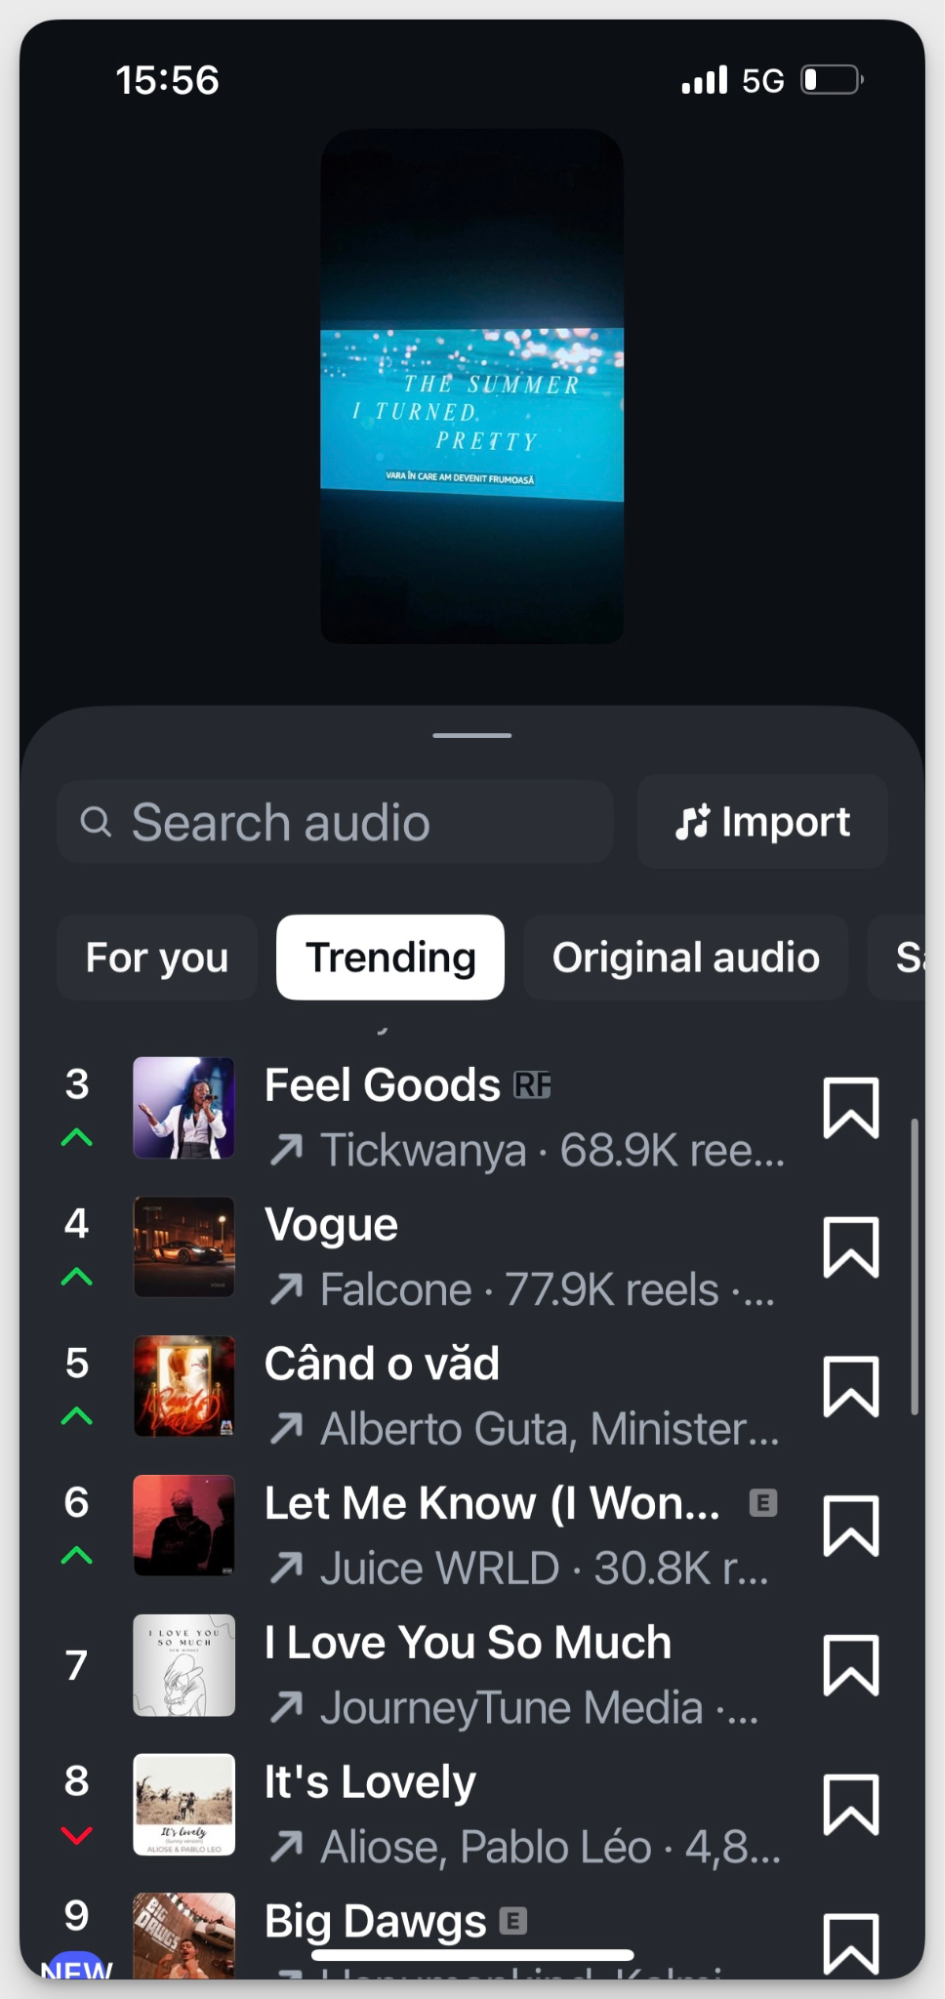
To find trending audio, you can either head over to the Insights section:
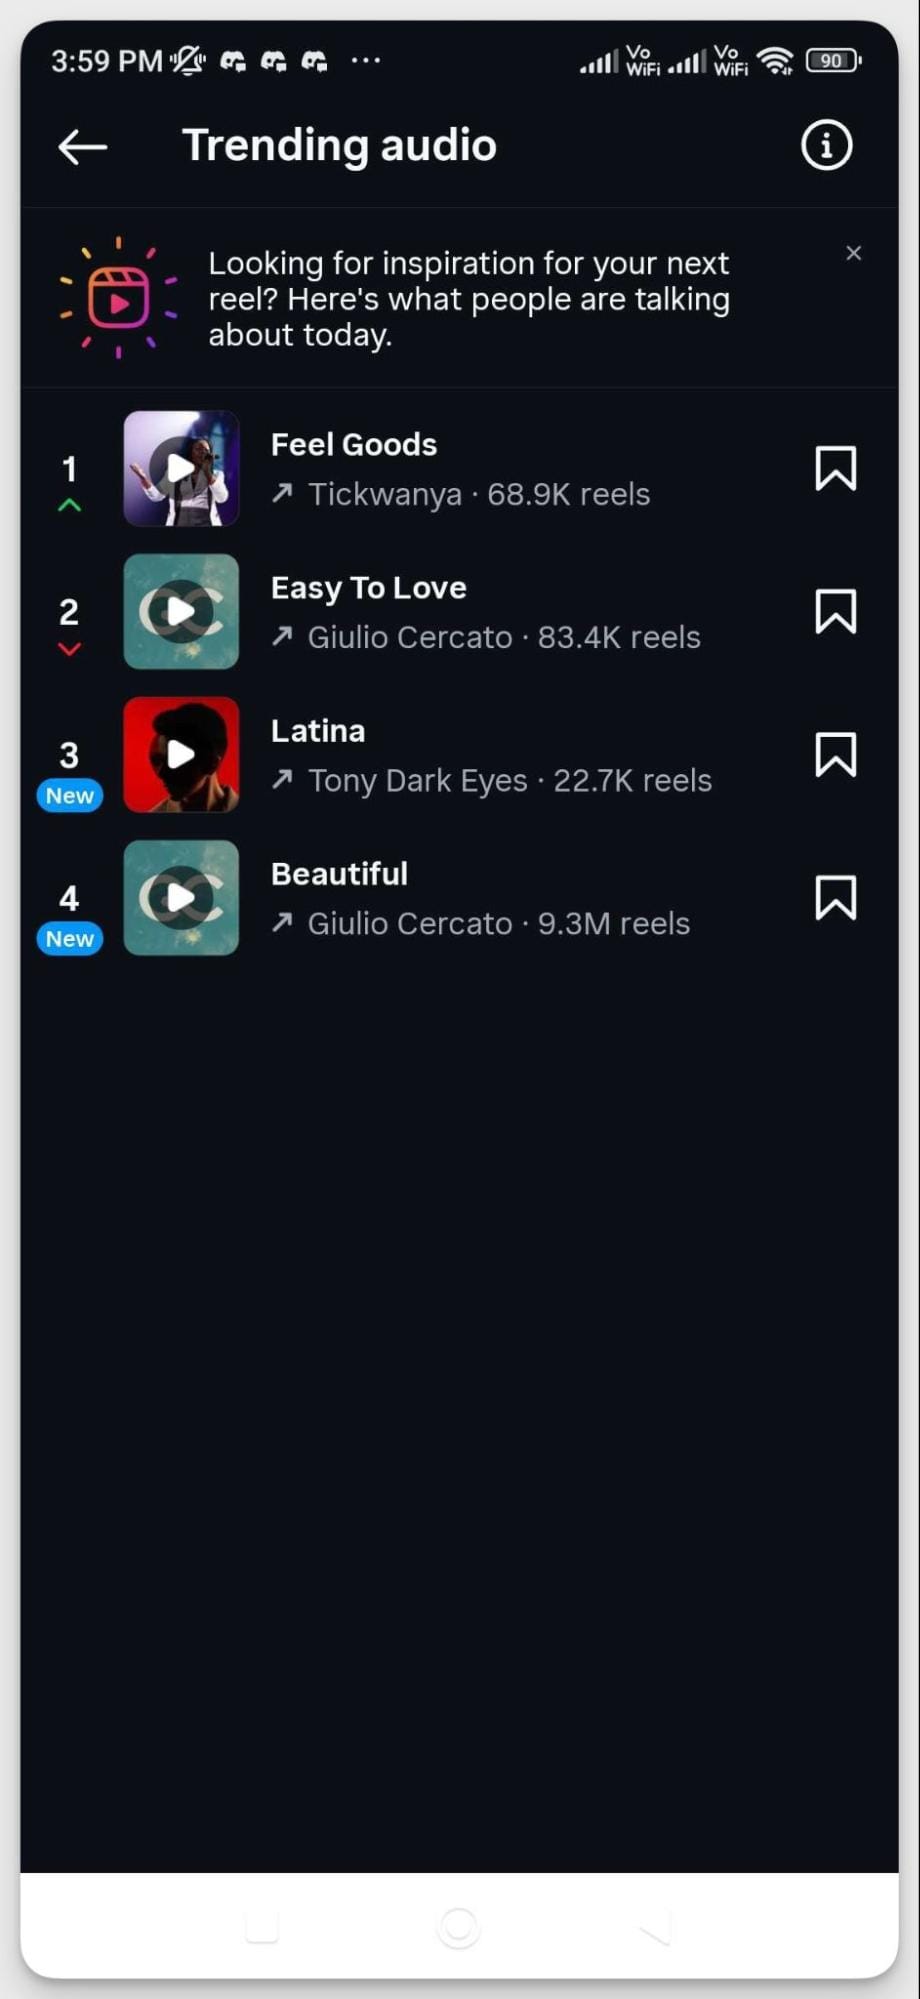
Or directly choose a trending sound when uploading your Reel.
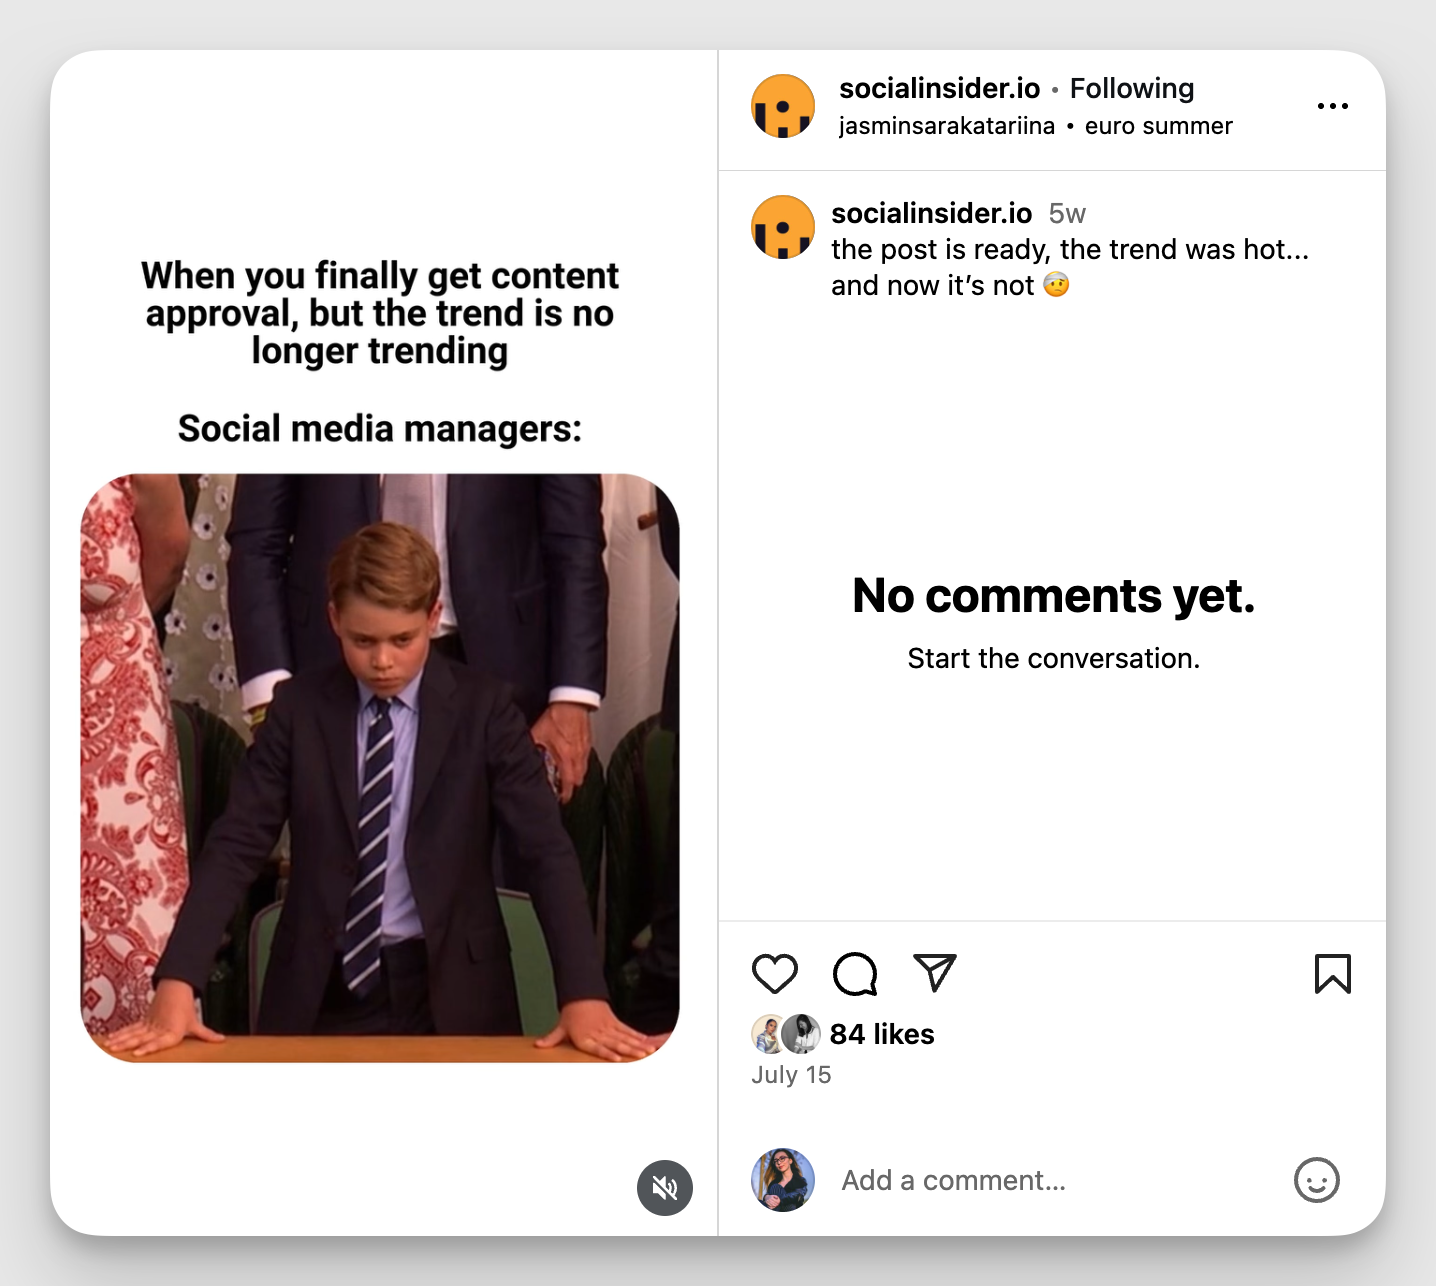
Jump on relevant trends
Trends move fast on Instagram. Blink and you’ve missed them. But when you jump on the right ones, your Reels feel fresh, relatable, and part of the cultural moment. The key word here is ‘relevant’.
Three questions Miruna suggests to answer if the trend fits your brand personality:
- Is this trend really a good fit for my brand?
- Will my audience relate to it or enjoy it?
- Can I put my own unique spin on it to make it feel like my version?
If the answer to all these questions is a ‘yes’, go for it. But what if you’re unsure? Miruna has a hack for that too:
If you’re unsure, you can always test trends first in your Stories to see how your audience reacts.
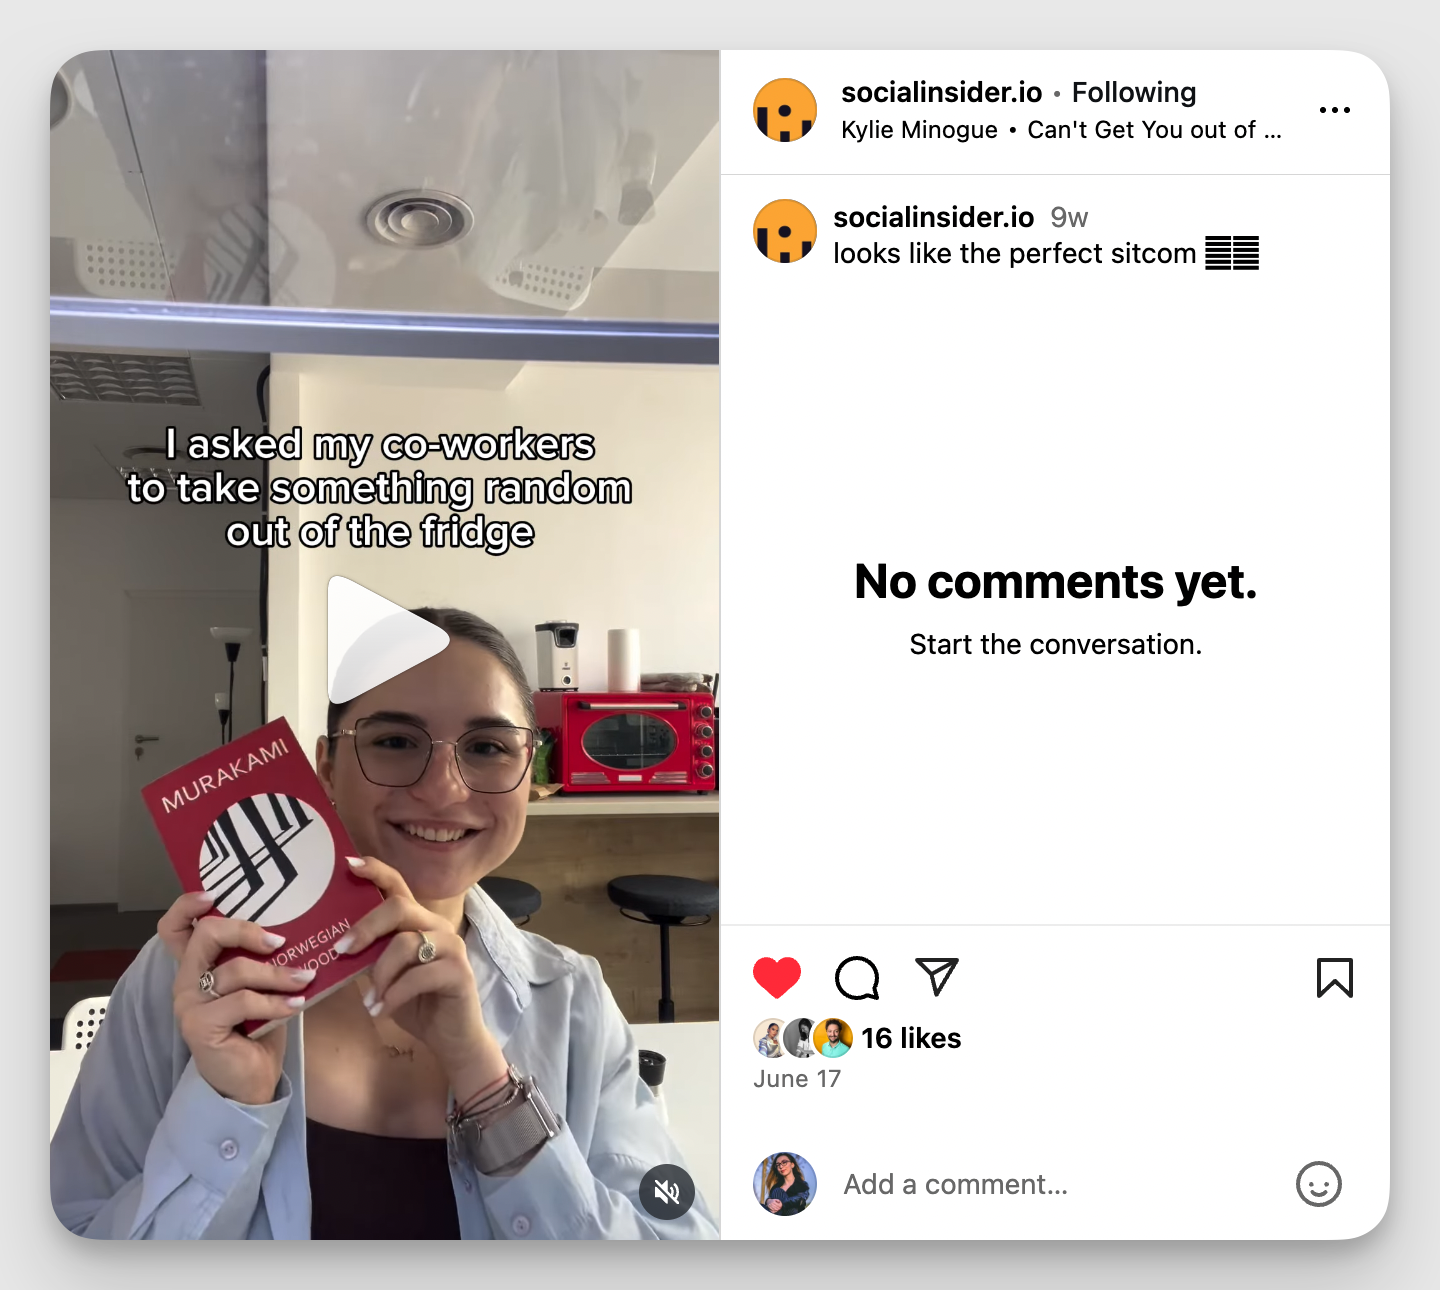
Here’s a fun example from our account.
Final thoughts
Instagram Reels aren’t just about getting views—they’re about leveraging insights to understand what fuels discovery, engagement, and follower growth. By keeping an eye on key metrics like watch time, reach, and new followers, you can align your Reels with your broader content goals.
Native analytics give you quick checks, while tools like Socialinsider provide deeper competitive and strategic insights. And when you combine data with creativity—testing hooks, using audio wisely, and jumping on trends that fit your brand—you’ll set the stage for Reels that deliver both impact and long-term growth.
Nidhi Parikh
Nidhi Parikh is SaaS writer that believes scrolling through social media is research for work. When not working, find her binge watching the latest series or reading anything she can get her hands on.

Analyze your competitors in seconds
Track & analyze your competitors and get top social media metrics and more!
You might also like


Improve your social media strategy with Socialinsider!
Use in-depth data to measure your social accounts’ performance, analyze competitors, and gain insights to improve your strategy.