Social Video Analytics Guide: Track, Analyze & Optimize
Master social media video analytics with our expert guide. Gain insights to refine your strategy and maximize viewer engagement effectively.

Try remembering the last time you scrolled through social media without seeing a video. You probably can’t.
Video runs the internet, and 93% of marketers already consider video marketing a key part of their strategy.
It’s also a part of our daily grind at Socialinsider. And I’ve realized something: making videos is half the job. Knowing what works? That’s the game.
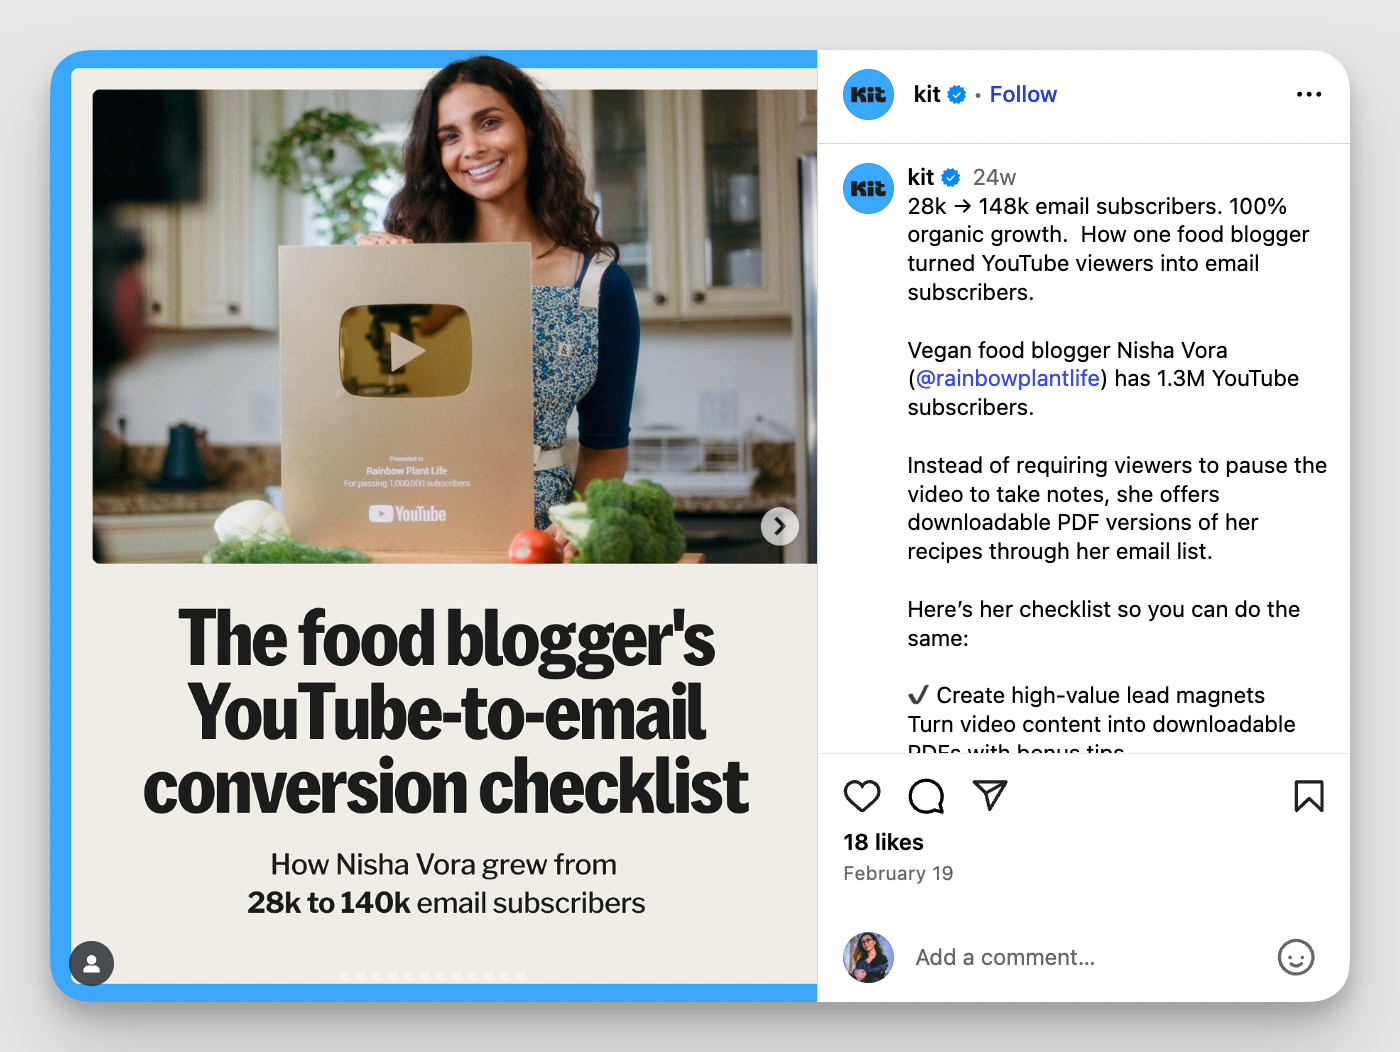
To help with that, I reached out to someone who knows video inside out: Thom Gibson, former social media strategist at Kit. He grew Kit’s YouTube from 27K to 40K+ subscribers using a smart blend of content and analytics.
I asked him to spill his secrets — what makes videos click, and how data shaped Kit’s strategy.
Let’s get into it.
Key takeawways
-
What type of social video analytics should you track: Choose metrics based on the specific goal of your video, not a one-size-fits-all approach.
-
Platform-specific video analytics: Tailor your analysis to each platform’s unique metrics and audience behavior to maximize performance.
-
How to track your social media video marketing analytics: Combine native platform data with third-party tools for deeper insights, historical context, and easier reporting.
-
How to use social media video analytics to refine your overall video strategy: Let performance data shape your creative decisions, from CTA placement to video format and structure.
Why social media video analytics data matter?
Posting videos without tracking their performance is like throwing darts in the dark. Here’s why smart brands keep a close eye on social media video analytics:
- Not all views are equal. 10K views sound great. Until you realize 90% dropped off in the first 3 seconds. Analytics tells you how many people are actually watching.
- Content fatigue is real. What worked last month might flop today. Metrics help you understand your audience and stay ahead of the curve.
- Virality naturally comes. Analytics help you focus on what really matters — consistent performance. It shows you which formats, hooks, and lengths actually convert.
- Different platforms, different rules. What kills on Reels might bomb on YouTube. Tracking lets you tailor content instead of recycling it blindly.
Still not sold on the power of social video analytics? Let’s talk numbers.
Thom used data to help boost Kit’s YouTube click-through rate, with some videos hitting a wild 15-20% CTR.
Thom talked to me about the CTAs Kit used before he joined:
Before I started at Kit, the general practice was at the end of a video, there was a graphic that went up on screen that had CTAs like, ‘Subscribe here’ or ‘Watch another video’ or ‘Sign up for a free trial.’ All these things were there on the screen.
Here’s an example of what their on-screen CTAs looked like.
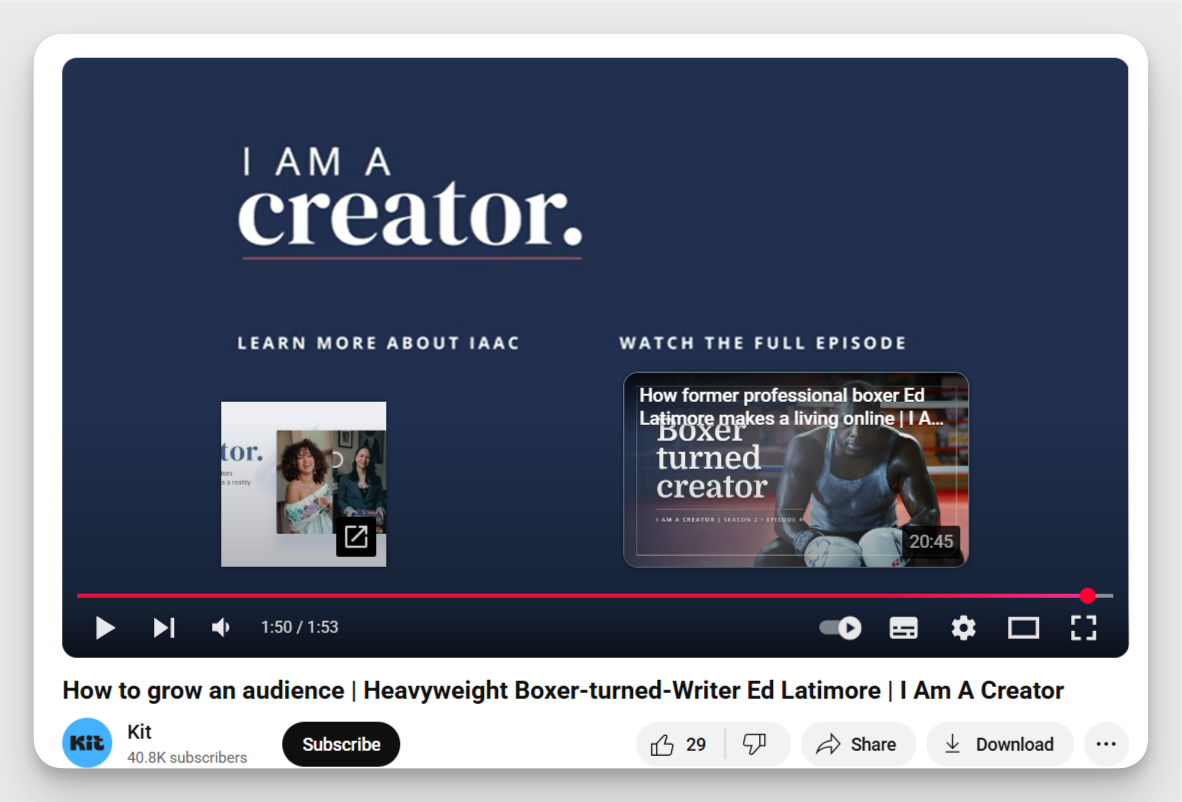
The problem? Viewers had no reason to act. The CTAs were just... there.
So, Thom and the team ran a simple experiment: Along with the static CTA, they added a verbal CTA that gave people a compelling why: why to watch the next video, or why to care about the free trial.
Here’s what that looked like in action:
What type of social video analytics should you track?
Trying to have one-size-fits-all metrics hardly works in video. Instead, do what Thom did: track metrics depending on the goal of the video.
Different goals have different kinds of metrics we look for. When we were at Kit, there were some videos that I knew would not go viral or get a high viewership, say tens of thousands of views. For example, some of our product update videos. But we knew it would be interesting and valuable for our core audience: people using the platform all the time. So I was less concerned about how much viewership it got. But the big metric I would see is whether people are commenting. Are they excited about some of these updates? Are they letting us know what else they want to see.
Depending on your goal, here are some metrics you can include in your list.
Engagement metrics
- View count and reach: View count tells you how many times your video was watched. Reach shows how many unique people saw it. Think of view count as how many times someone hit “replay,” and reach as how many eyeballs you actually earned.
Here’s how you can track it with Socialinsider.
- Watch time and average view duration: Watch time shows the total minutes people spent watching your video. Average view duration reveals how long viewers stayed before dropping off. If it’s low, your hook might be weak or the content drags. These two together expose whether you're holding attention or just filling feeds.
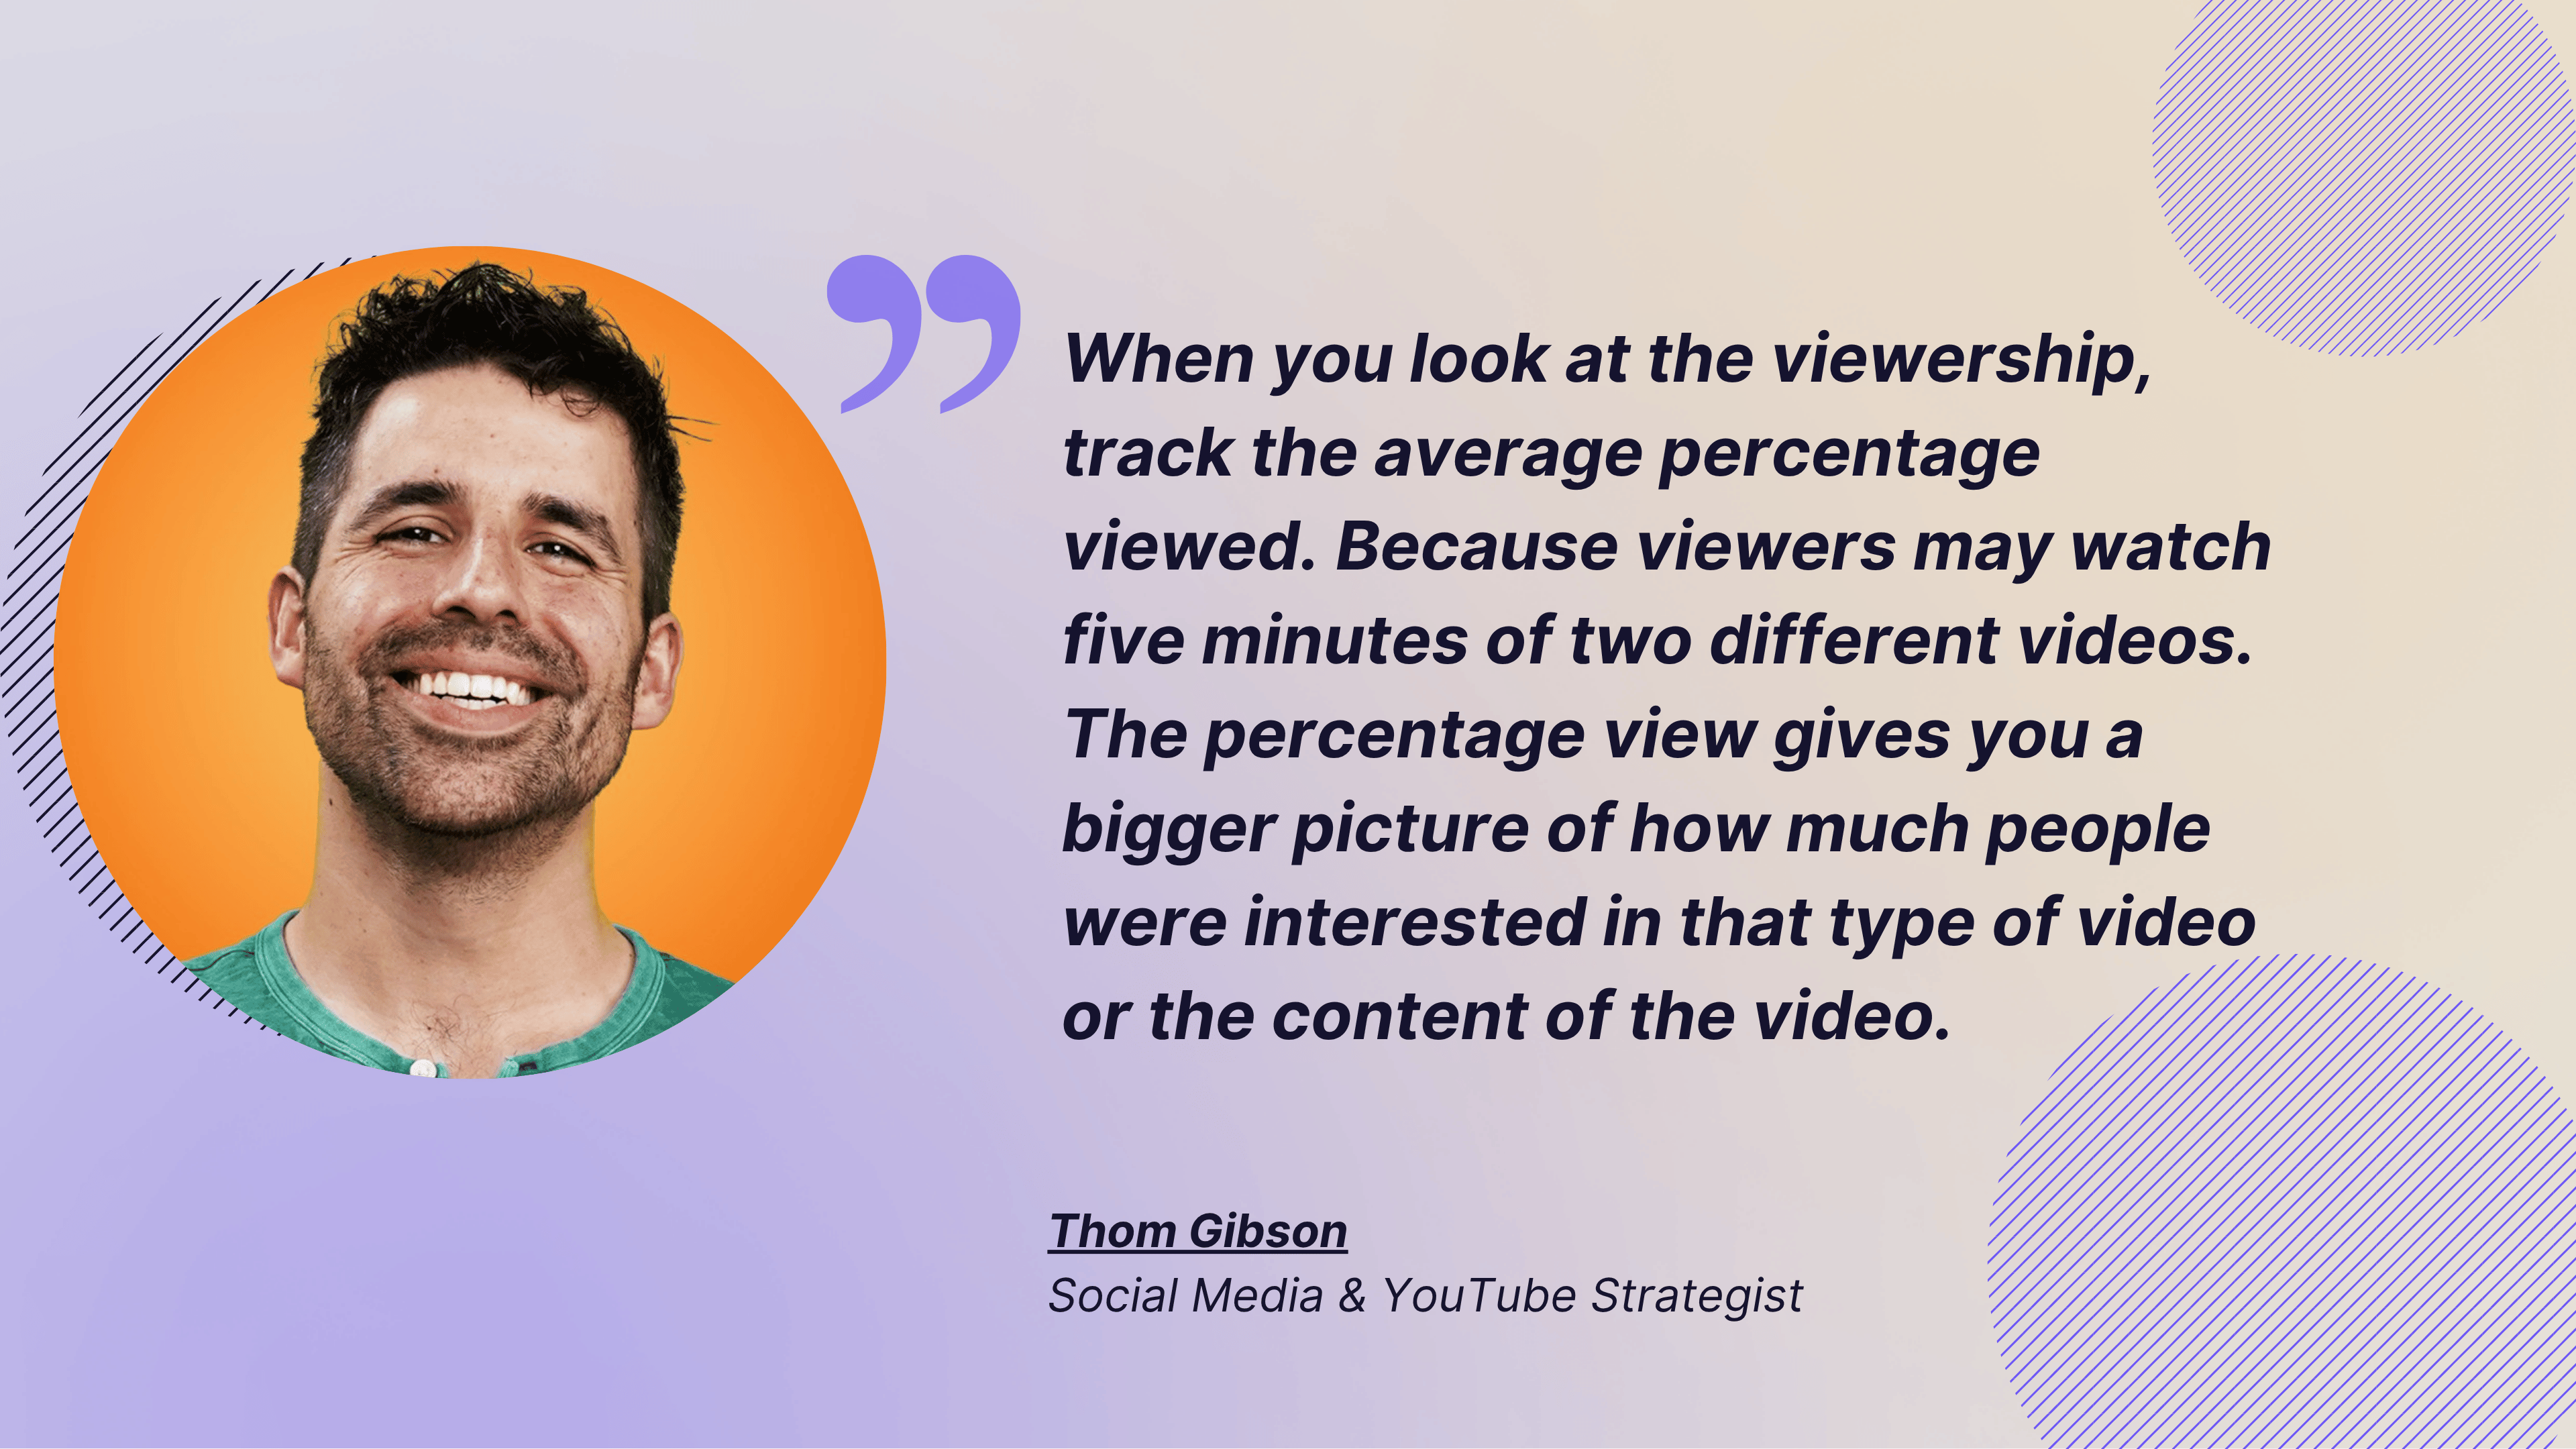
Thom also referred to checking the average percentage viewed for videos:
When you look at the viewership, track the average percentage viewed. Because viewers may watch five minutes of two different videos. But one video may be seven minutes long while another may be an hour long. The percentage view gives you a bigger picture of how much people were interested in that type of video or the content of the video.
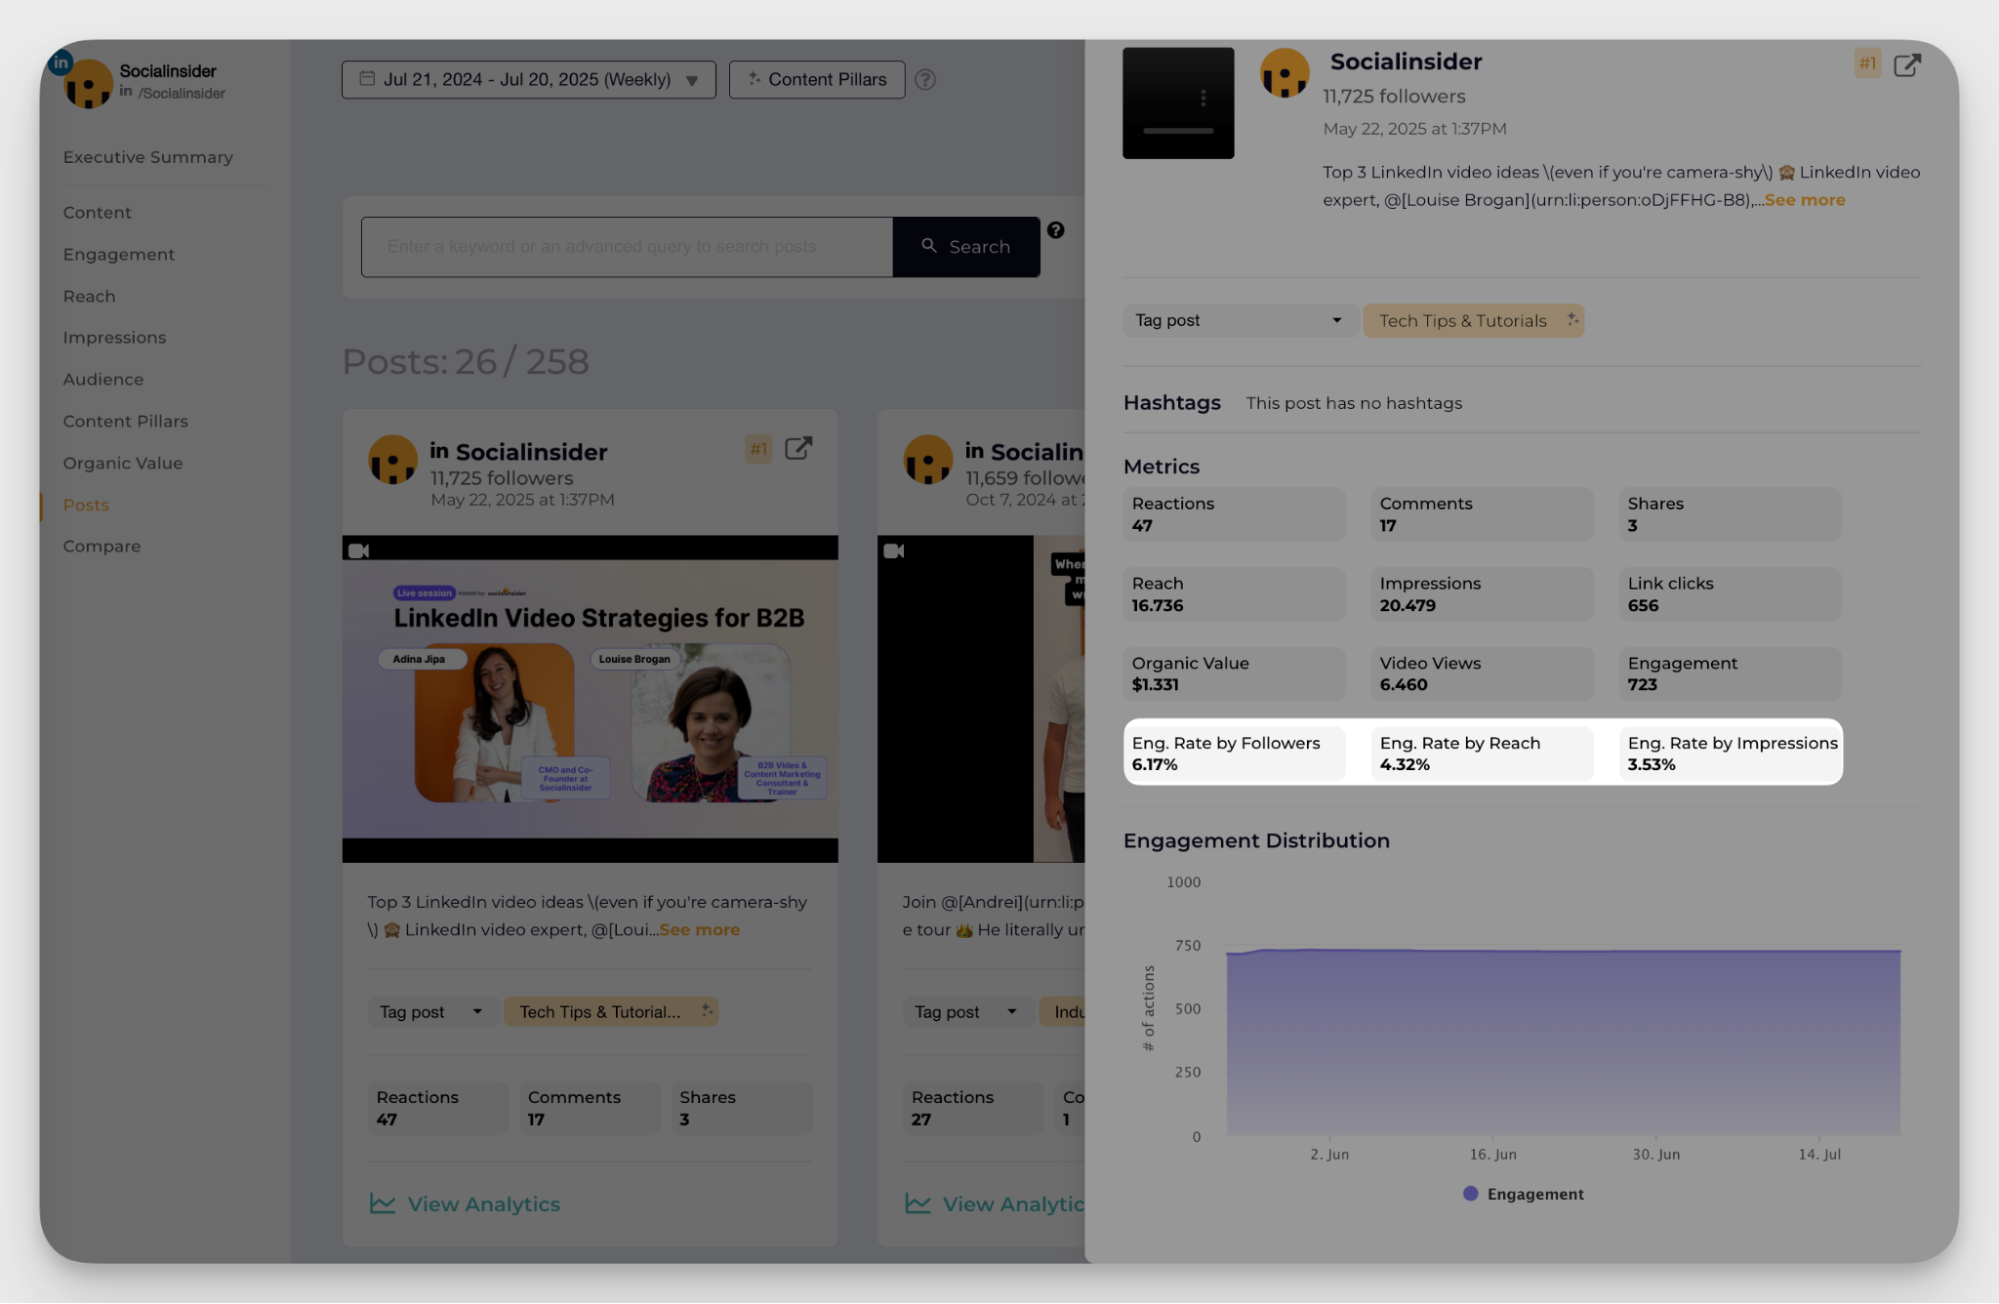
- Engagement rate calculation and benchmarks: Engagement rate tells you who’s really paying attention.Each gives a different angle: by followers shows loyalty, by reach shows how compelling your content was to actual viewers, and by impressions includes repeat views.
Instead of doing this manually, Socialinsider tracks and calculates everything for you.
First, filter the content to show just videos.
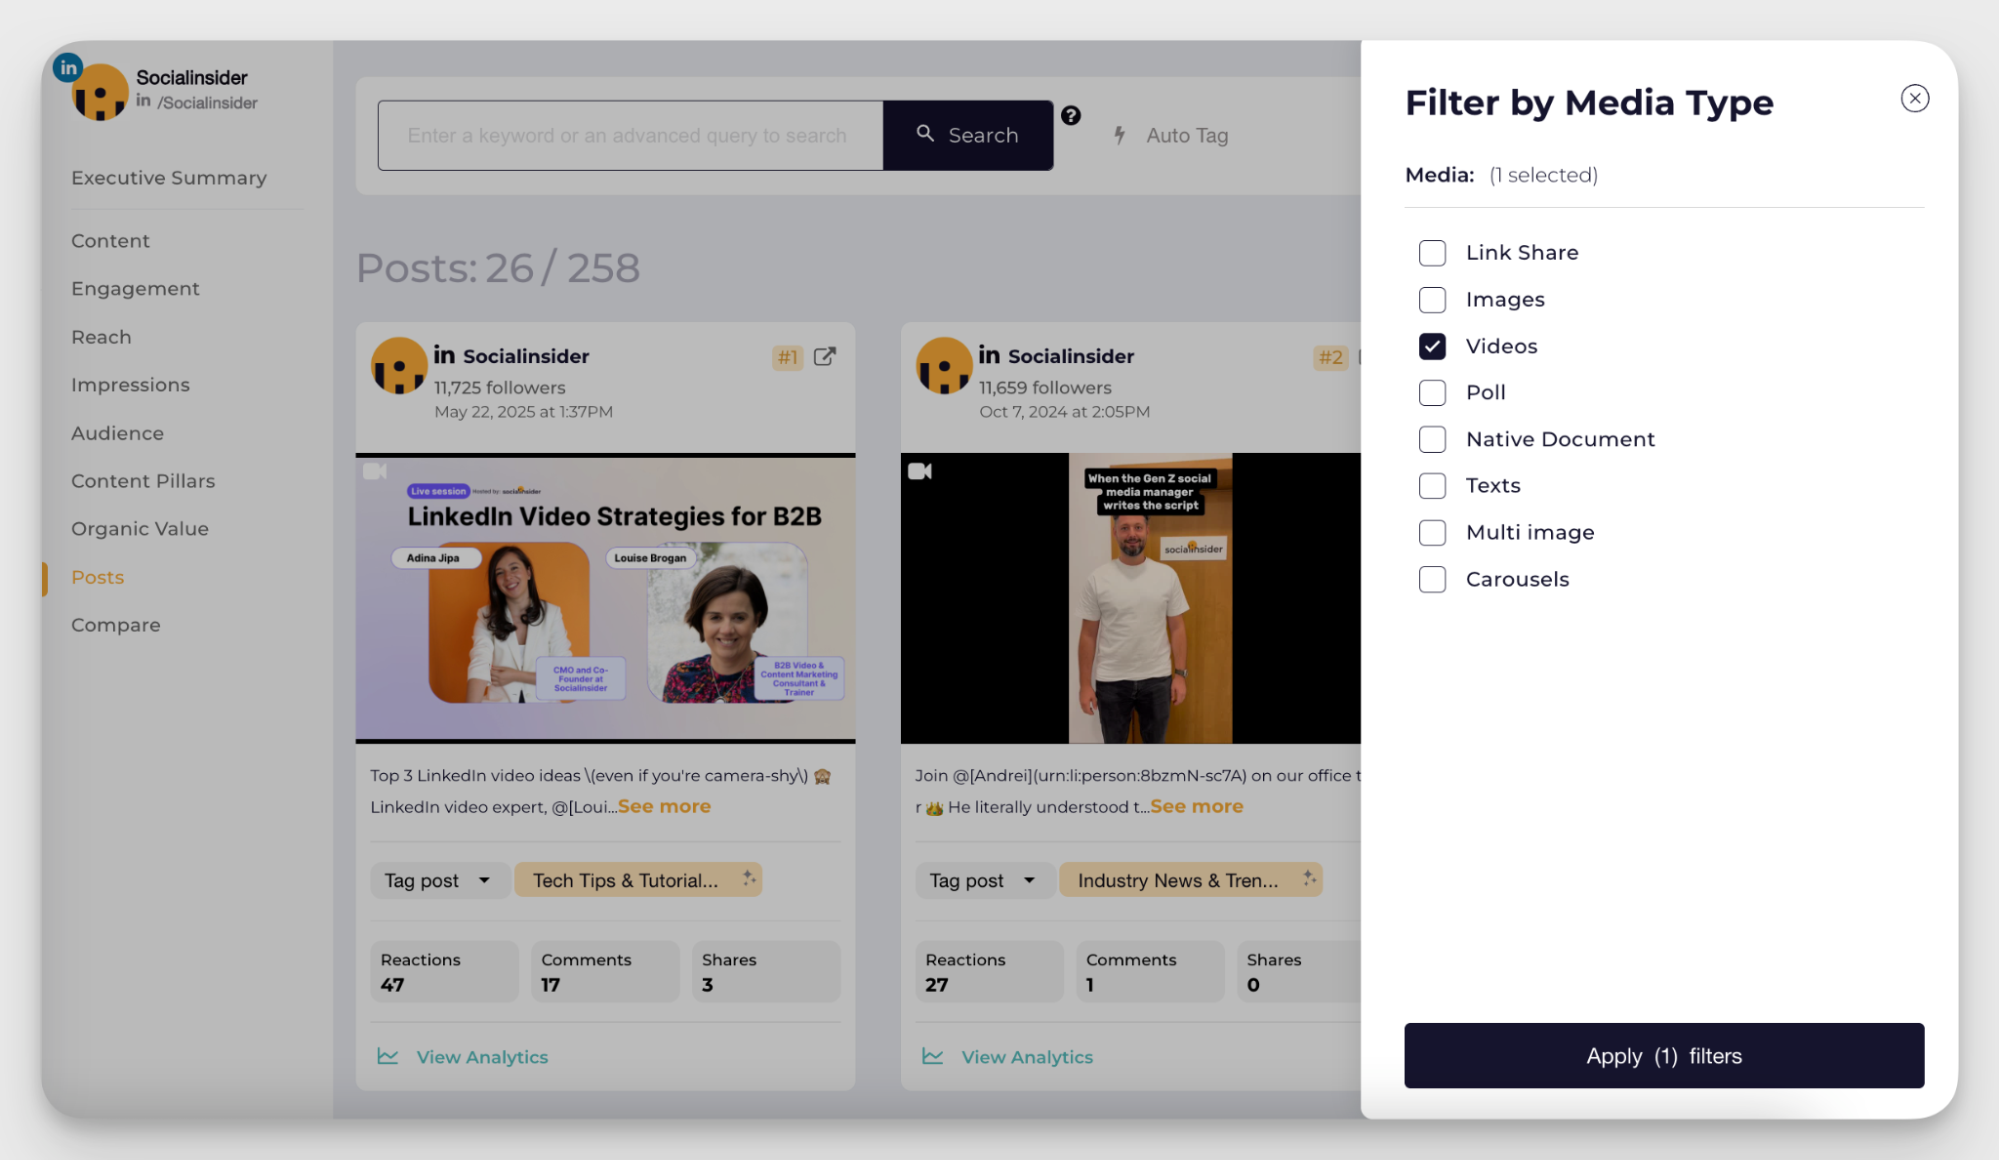
Next, click the video you want to analyze and get the engagement metrics.
- Click-through rate (CTR): Click-through rate (CTR) shows how many viewers clicked on your video after seeing its thumbnail or title on the platform.
When I asked Thom how they handle a low CTR, he said:
We used to compare videos that had a low click-through rate with the percentage viewed. For example, a low CTR but a higher percentage viewed means people who are clicking on the video are finding it valuable and watching a lot of the video. So maybe this is one of those videos we experiment on to get more attention. Maybe it just hasn't found as many people because we don't have a very compelling title or thumbnail.
Audience behavior metrics
- Drop-off point analysis: This shows you where viewers lose interest and click away. It’s key to figuring out what’s falling flat and what’s keeping people glued.
Thom shared that while some creators found clear dip patterns, his own data wasn’t always so obvious.
I’ve struggled with really identifying drop-off points to clear things in a video. Did people drop off because they got bored? Was it because I was overexplaining things? Was what I was saying not relevant? Instead, what I did find helpful was noticing when the audience retention graph goes completely flat. I found whenever I was giving specific examples of how Kit creators were doing something and SHOWING some of the emails they were using, those sections were very flat, which means people did find those valuable.
For Thom, doubling down on those high-retention moments, often real-world examples, became more valuable than chasing the drop-offs.
- Replays and rewatches: These are your video’s biggest compliments. They show who loved your content enough to hit that replay button. A high rewatch rate means something clicked. It could be a killer hook, a slick tip, or pure value. Whatever it was, do more of it.
- Social sharing and brand conversation: Shares mean your content hit hard enough for someone to pass it on. Brand conversations? That’s your name showing up in comments, captions, and DMs.
You can track shares on Socialinsider and rely on social listening tools to track brand mentions.
Conversion metrics
- Video-driven conversions: This measures how many viewers took meaningful action after watching, like signing up for a trial, making a purchase, or filling out a form. This metric ties your content directly to results.
If your video gets views but zero conversions, you should focus on creating content that grabs attention but also moves people to take the next step.
- Cost per acquisition (CPA): CPA tells you how much you’re spending to turn a viewer into a customer. This metric shows whether your content is driving efficient results or just racking up expensive attention.
- Return on Ad Spend (ROAS): ROAS shows how much revenue your video ad brings in for every dollar spent. The higher the number, the stronger your video’s business case. It’s the clearest sign your video is pulling its weight.
Platform-specific video analytics you should focus on
I’ve learned the hard way that you can’t treat video metrics the same across every platform. What works on YouTube won’t fly on Instagram, and TikTok plays by its own rules. Here's a breakdown of the platform-specific video analytics I always keep an eye on.
YouTube video analytics
- Watch time analytics: On YouTube, watch time is king. Total watch time tells you how long people are glued to your content overall, while average view duration shows how long each viewer sticks around.
High total watch time with low average duration? Time to tighten up your intros. Both metrics help YouTube decide if your video deserves more reach.
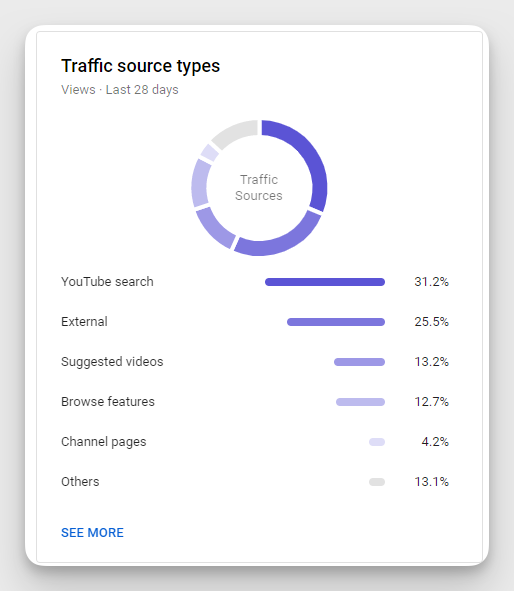
- Traffic source breakdown: YouTube’s traffic source breakdown shows where your views are coming from: Search, Suggested, Browse (Home/Subscriptions), or External. If Search leads, your SEO game is strong. High Suggested traffic? The algorithm likes you. External clicks mean you’re winning off-platform too. These social media insights help you double down on what’s really driving views.
You can find this insight on YouTube Studio.
- Subscriber growth attribution: Look at the videos driving the most subscribers. Are they following a certain theme? What are the common elements that you can use to attract more people? Dig deep and utilize those insights to guide your content strategy.
TikTok analytics
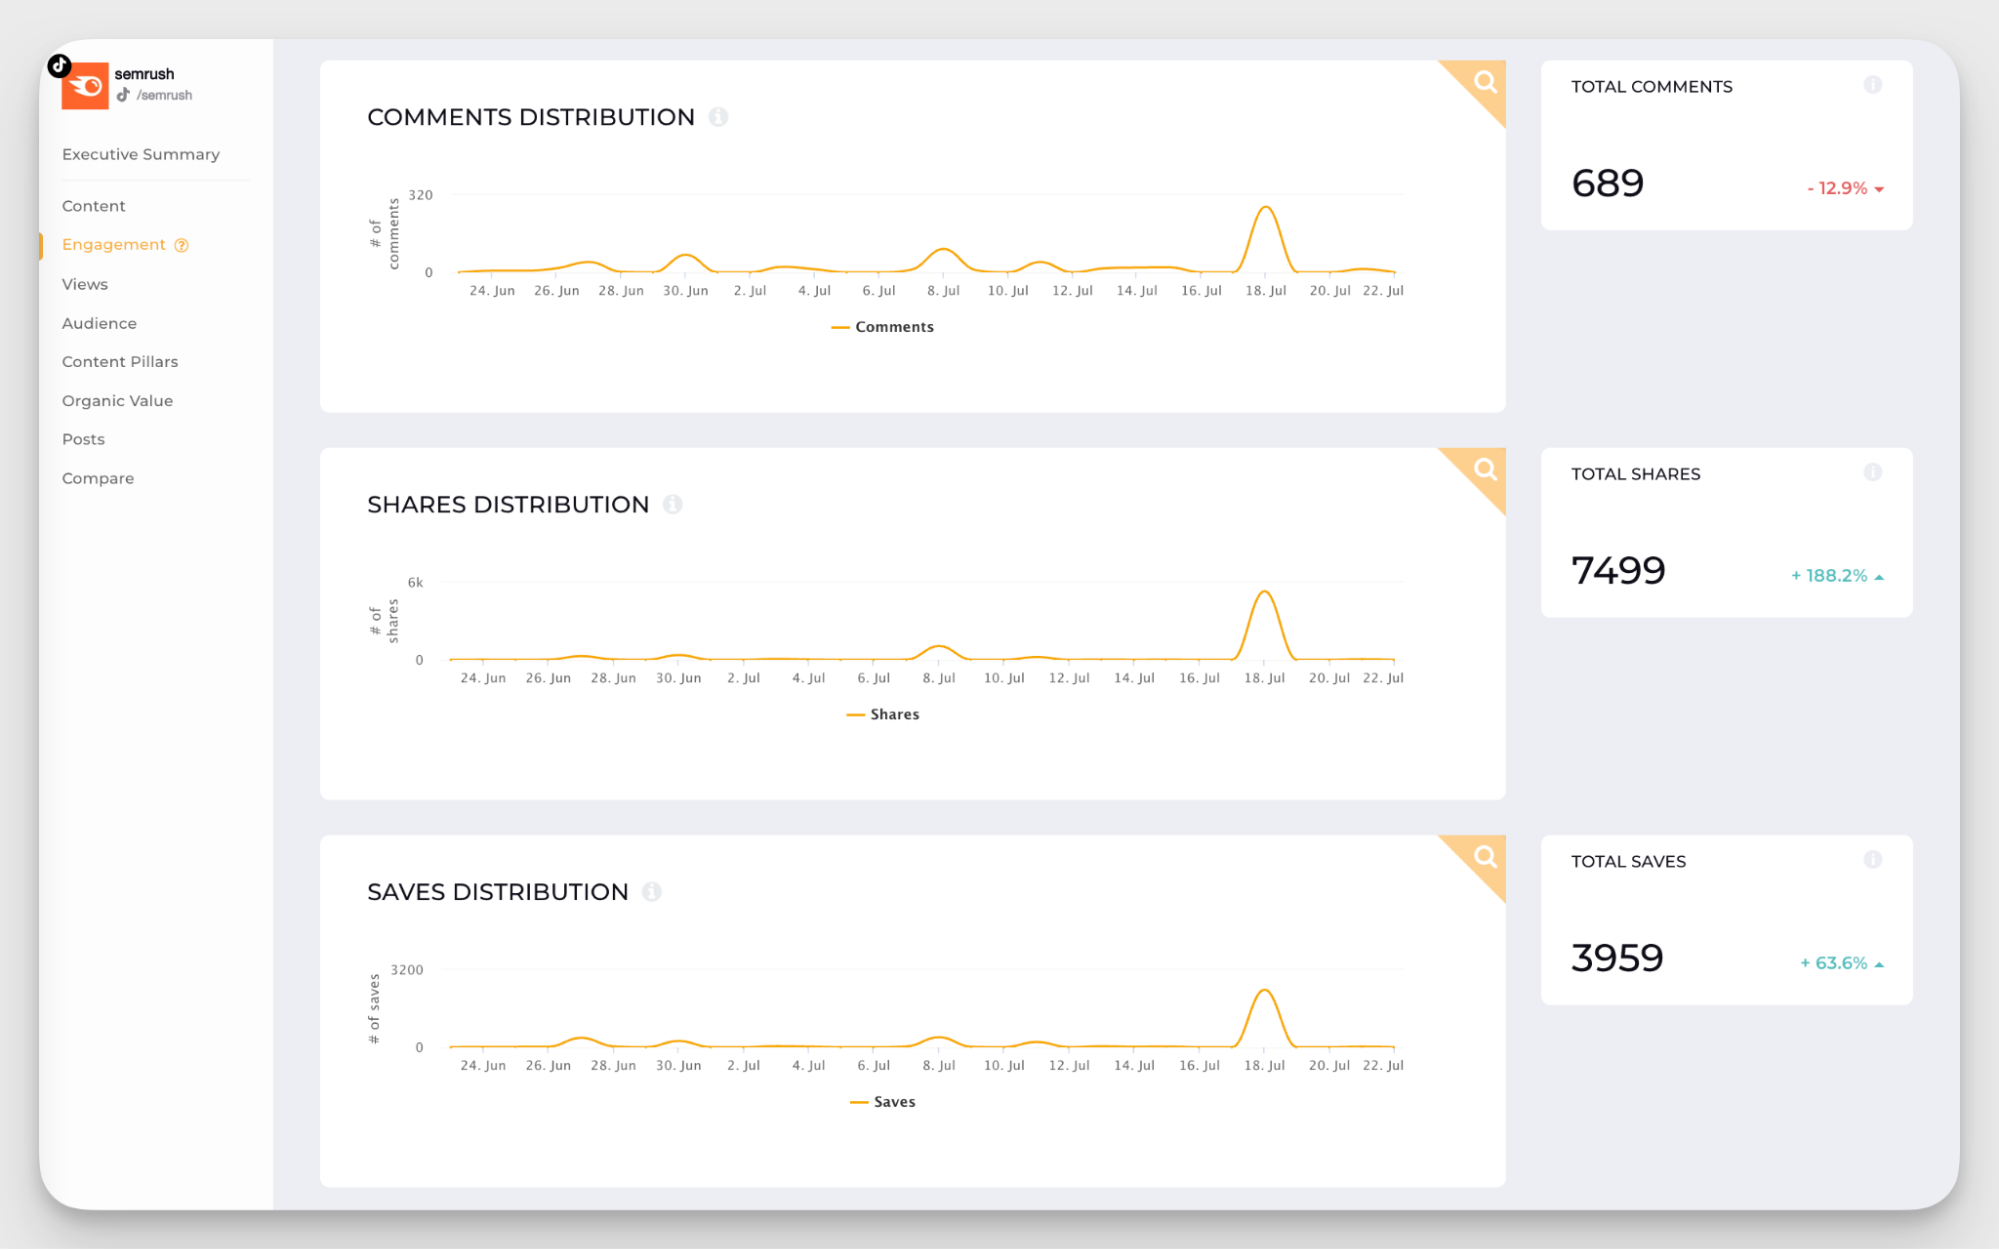
- Video performance metrics: Views show you made the scroll stop. Likes mean they enjoyed it. Comments? You sparked something. Shares are the holy grail because they wanted others to see it too. But completion rate is the quiet hero. If they watched till the end, you nailed the hook, pacing, and payoff. Bingo, that’s what you want.
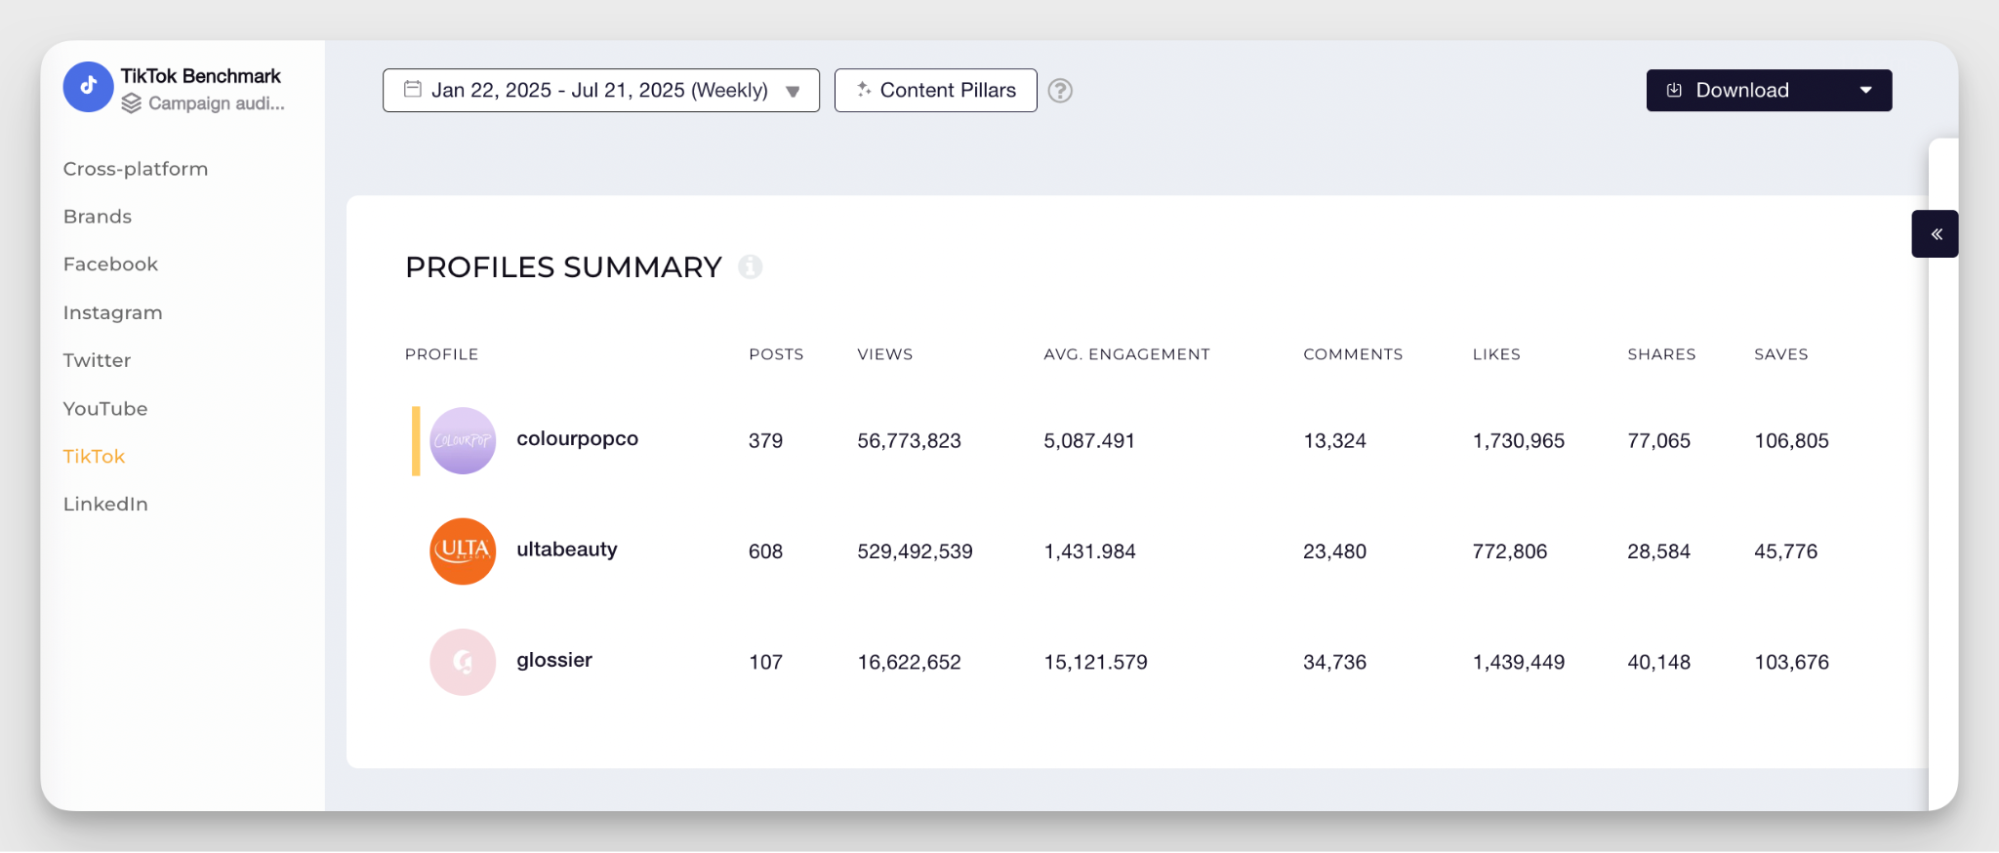
Instead of scrolling through each TikTok’s insights, I usually check all these engagement metrics in one place in Socialinsider.
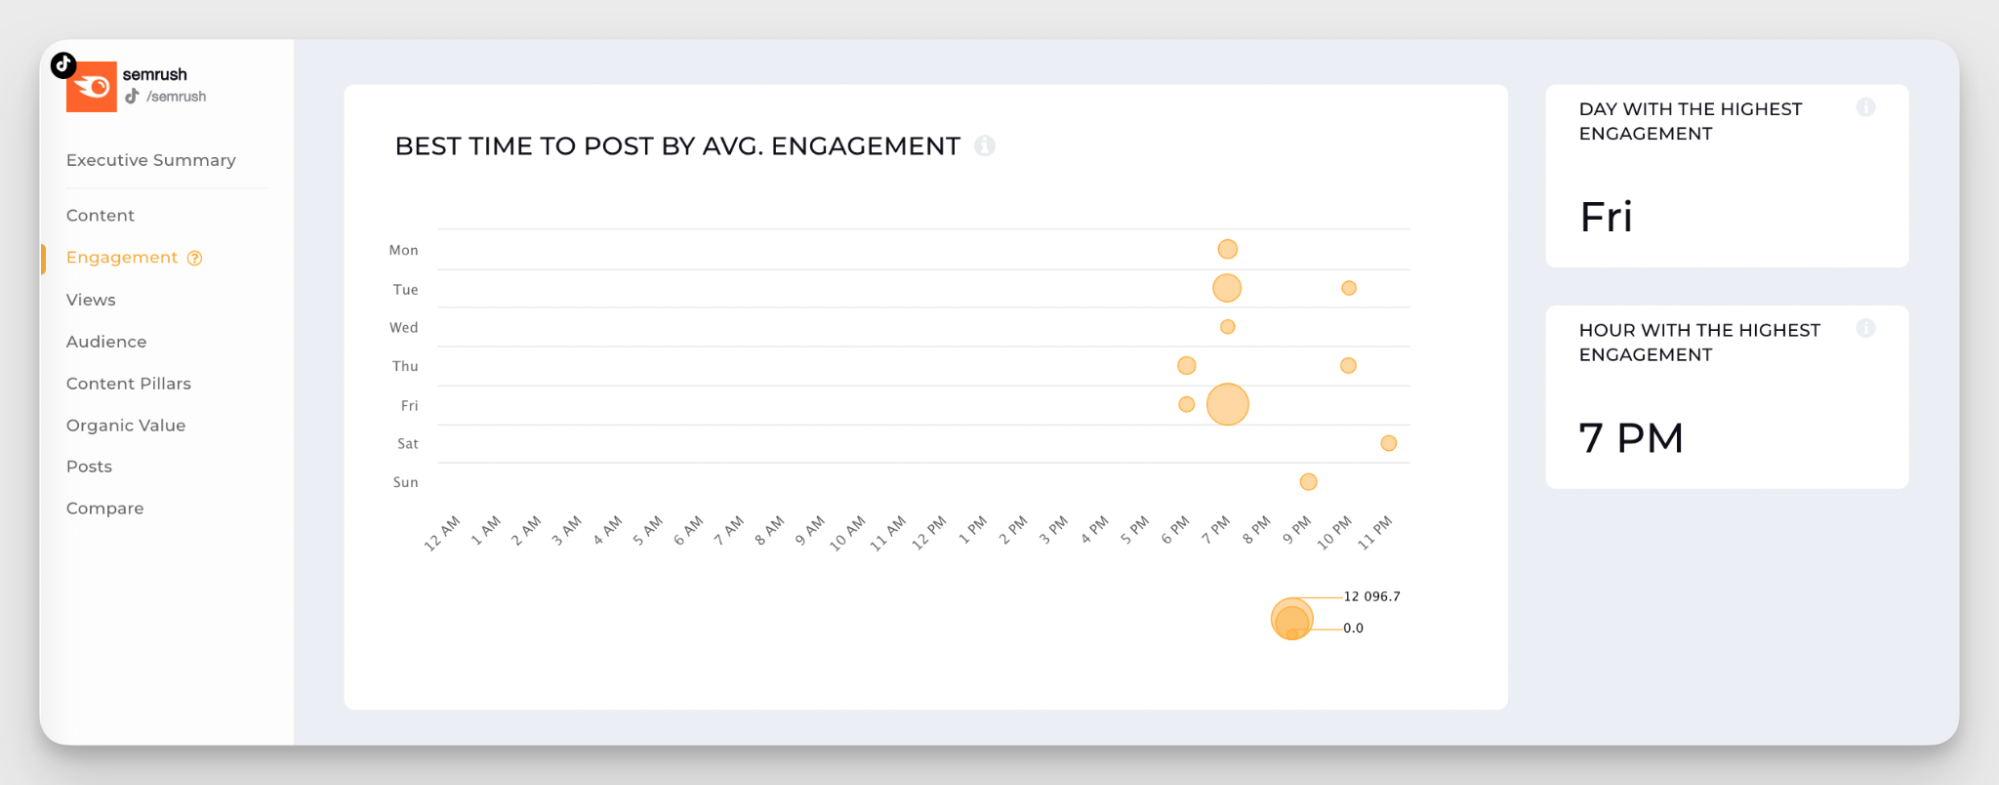
- Audience insights: Who’s actually watching your TikToks, and when? That’s where audience insights come in. Demographics reveal who’s tuning in, activity times tell you the best moment to post, and follower growth shows if your content’s turning viewers into fans.
I love how Socialinsider shows me the best times to post based on when my content has actually performed well.
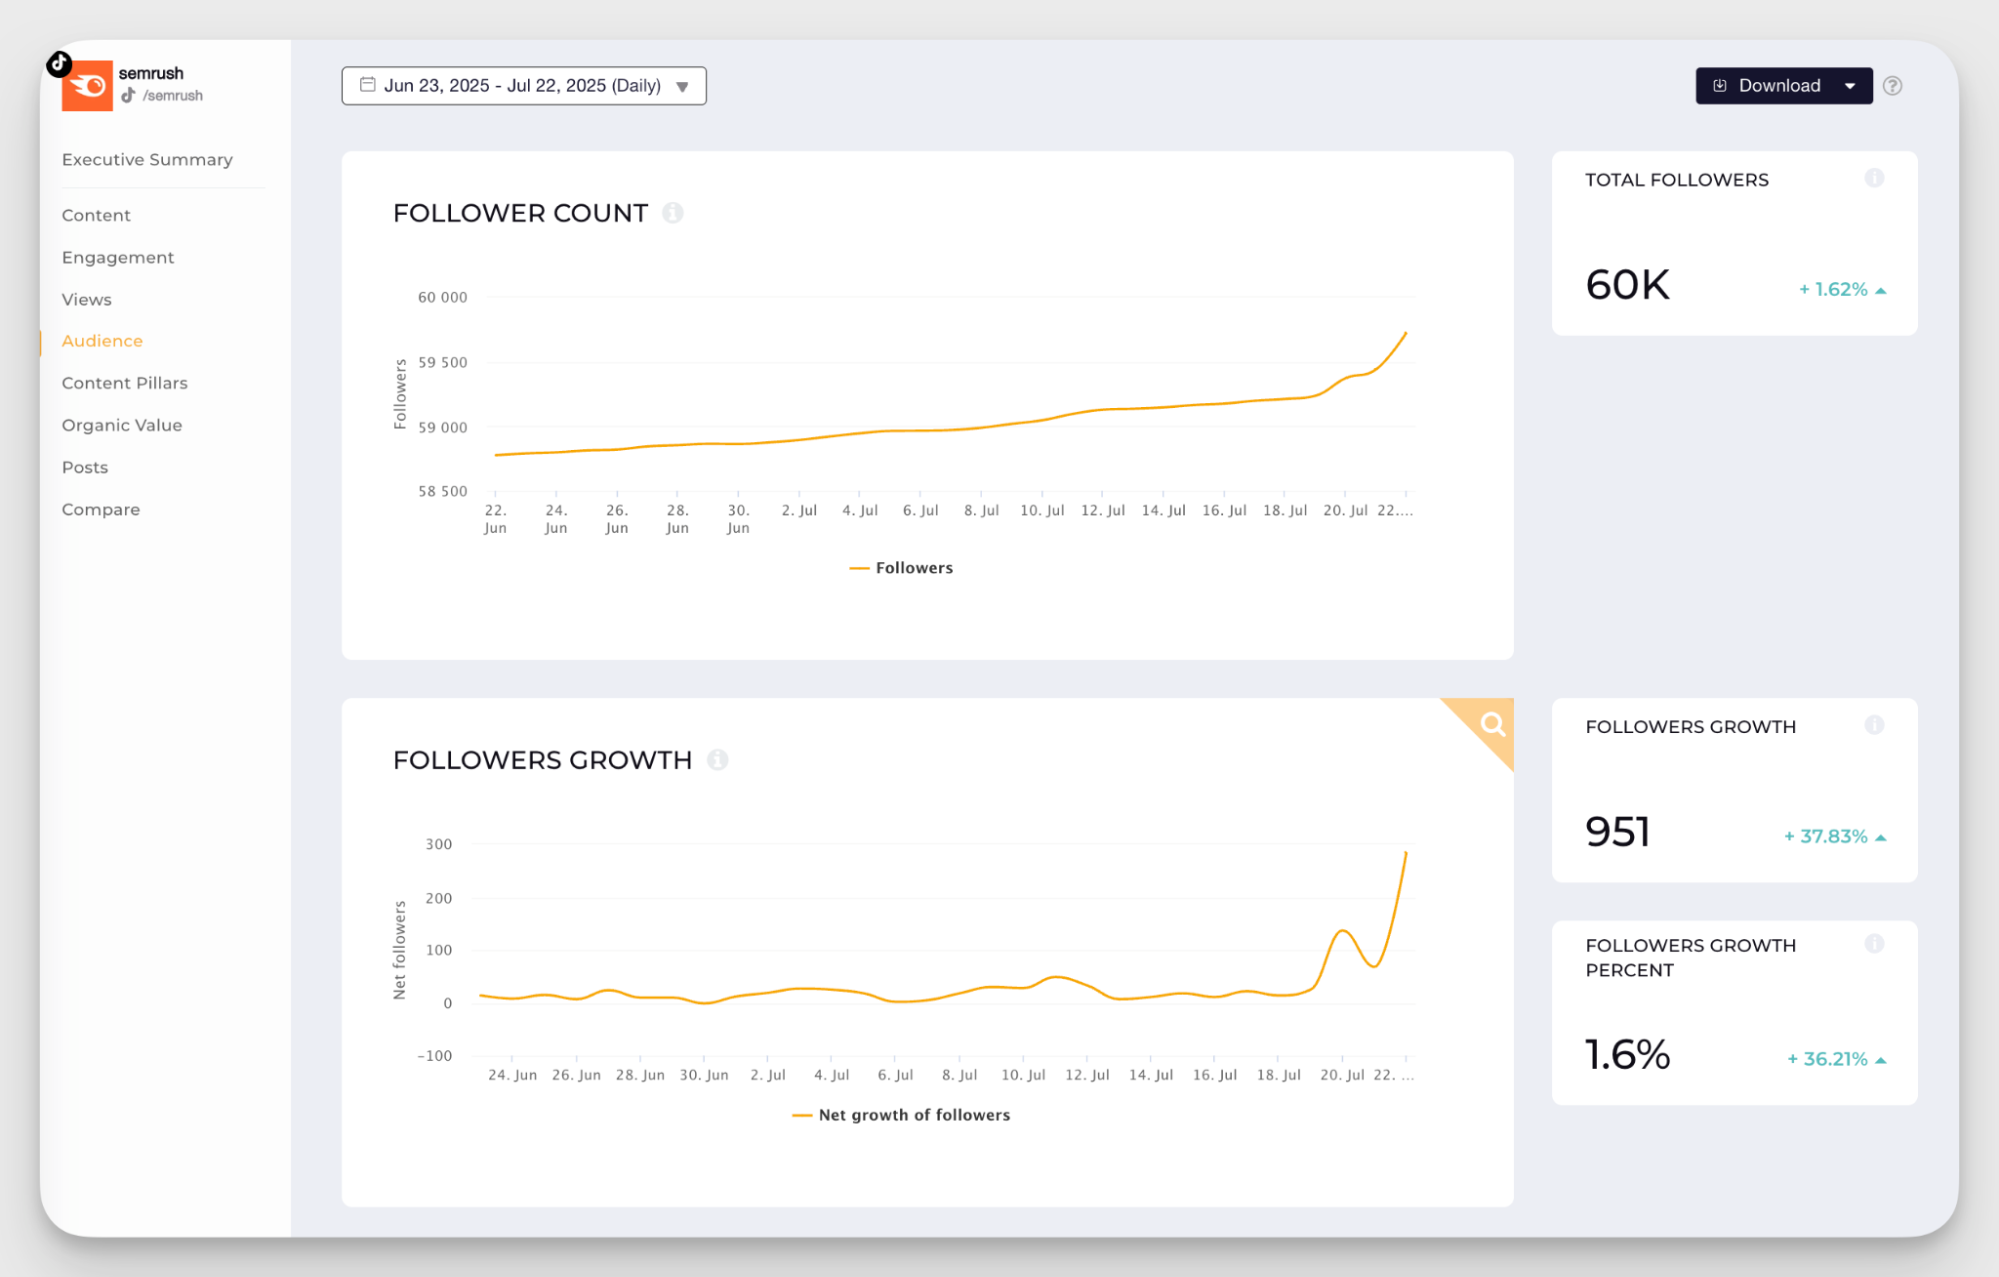
I can also track follower growth over time and spot any suspiciously long flat lines that might need a closer look.
- Sound and effect video content analysis: How loud is your content speaking? Sound and effect analytics tell you if your original audio is catching on or if hopping on a trending sound gave you that extra push.

Instagram Reels analytics
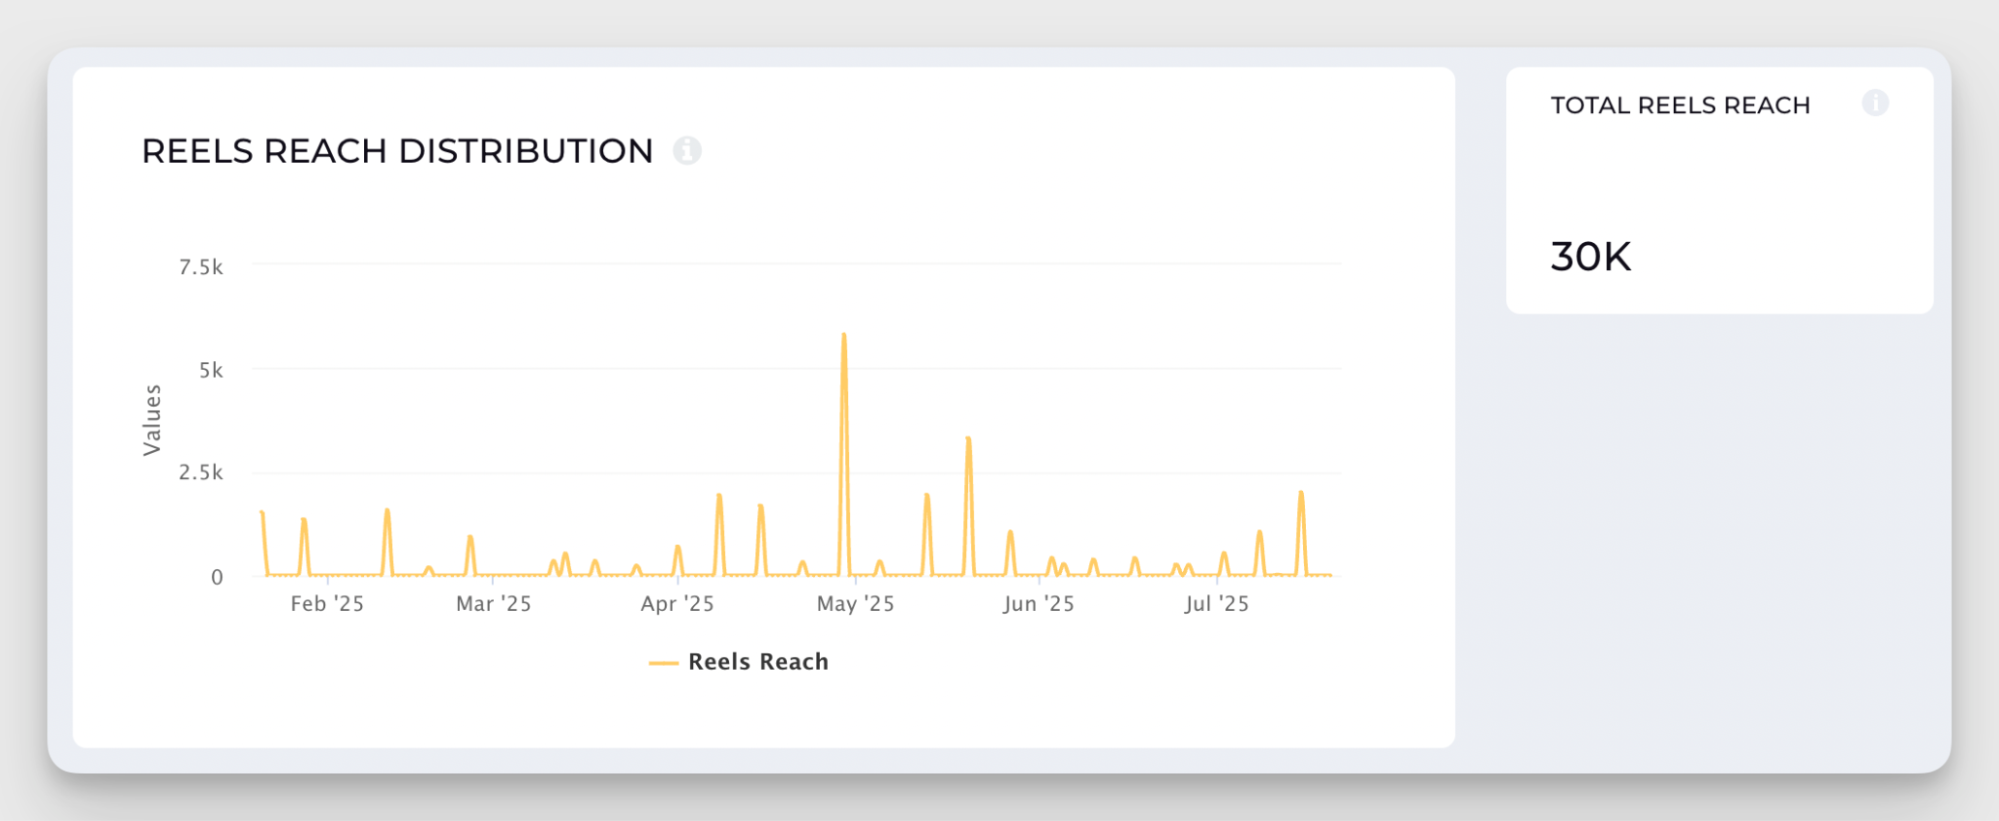
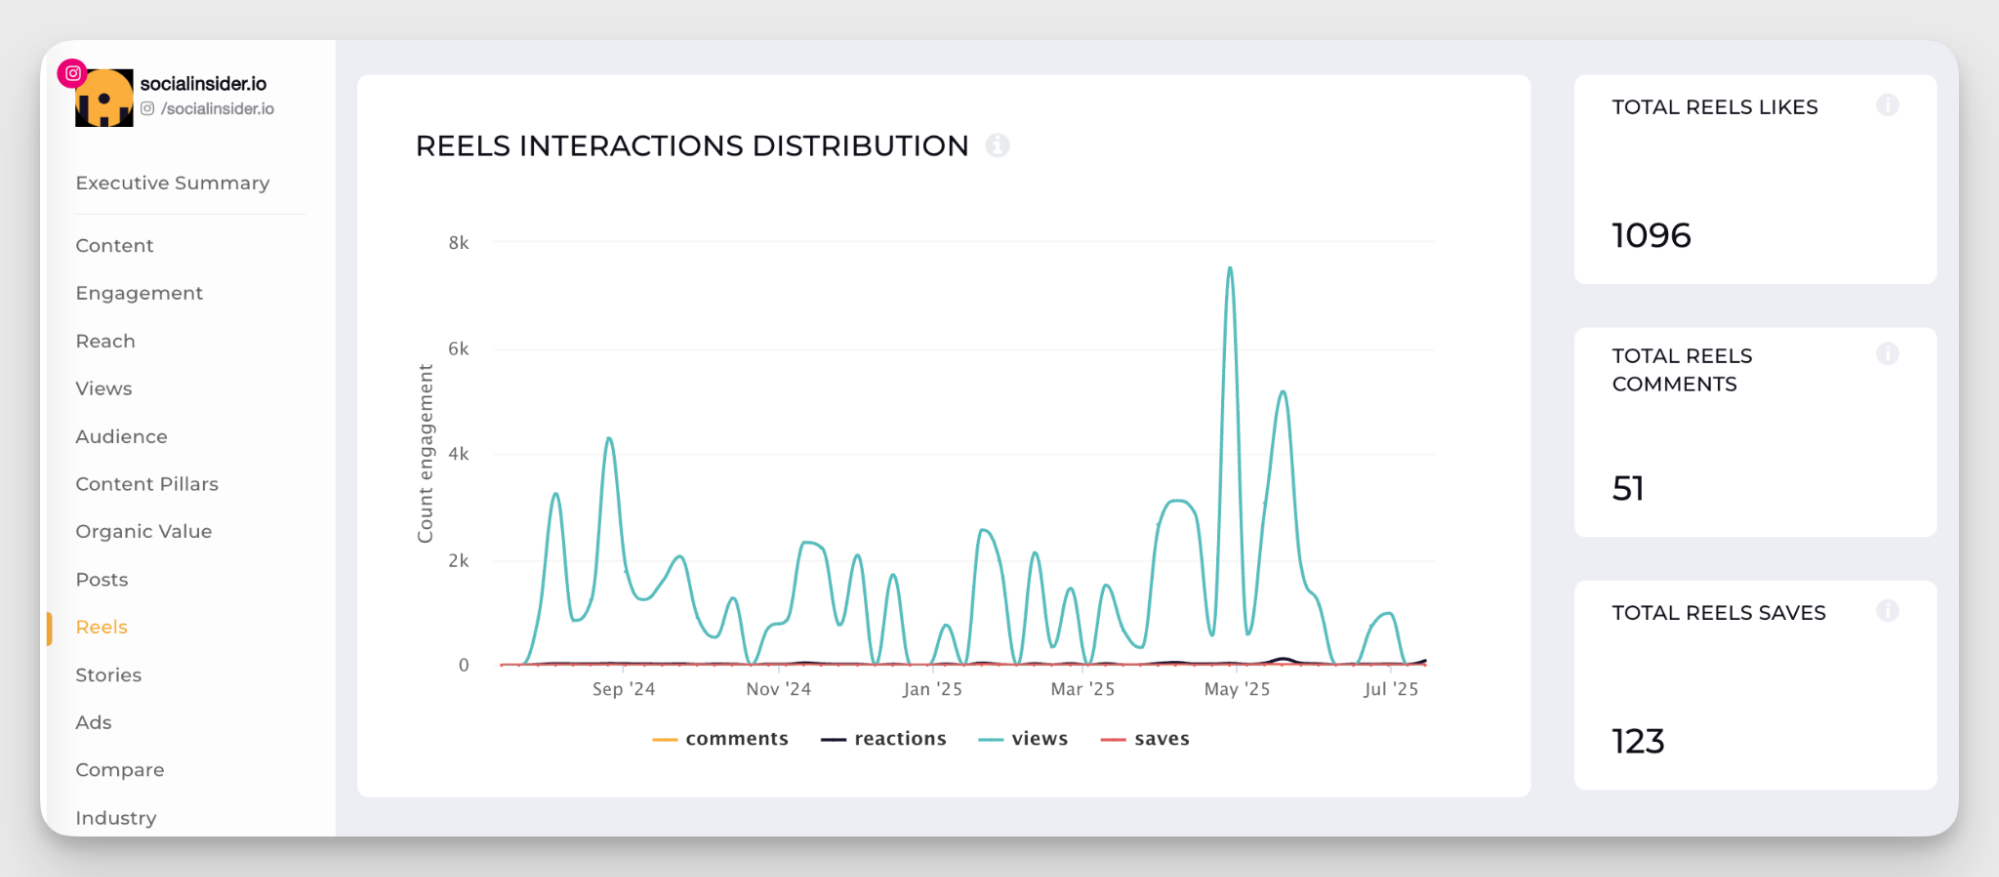
- Reels performance metrics: Reels metrics are your Instagram reality check. Plays show who hit play, reach shows who saw it, likes and comments reveal who vibed with it. Shares spread the love, but saves? That’s what I focus on. If someone saves your Reel, they didn’t just like it, they plan to come back for seconds.
Whenever we post any educational content on Socialinsider’s Instagram, we look at Saves as a priority metric.
Thom did the same at Kit.
We had created this really long Instagram content, about 20 slides, on how a food blogger was making most of her revenue from a paid newsletter, sending out weekly meal plans. It didn’t get a bunch of likes or tons of comments, but it got more saves than most of our content. Someone even reshared it saying, ‘This is the type of post you save and come back to.’ If people are saving it, that's an indicator to us that we should continue making more of it, even though maybe it didn't hit those other metrics. Like, it's still something we want to create that's valuable.
Stories video analytics: Stories move fast, but the metrics help you keep up. Completion rates show who watched till the end, exits tell you who dropped off. Forward taps mean they skipped ahead, backward taps mean they wanted a replay. Link clicks show who was interested enough to take the next step.
Facebook video analytics
- Engagement and reach differences: Reach shows how many people saw your Facebook Reel. Engagement tells you who actually cared to like, comment, or share. High reach with low engagement? Your content is visible but not valuable. High engagement with low reach? Your content’s strong, but needs a push. The sweet spot is hitting both.
You can check both these social media KPIs in Socialinsider for easy comparison.
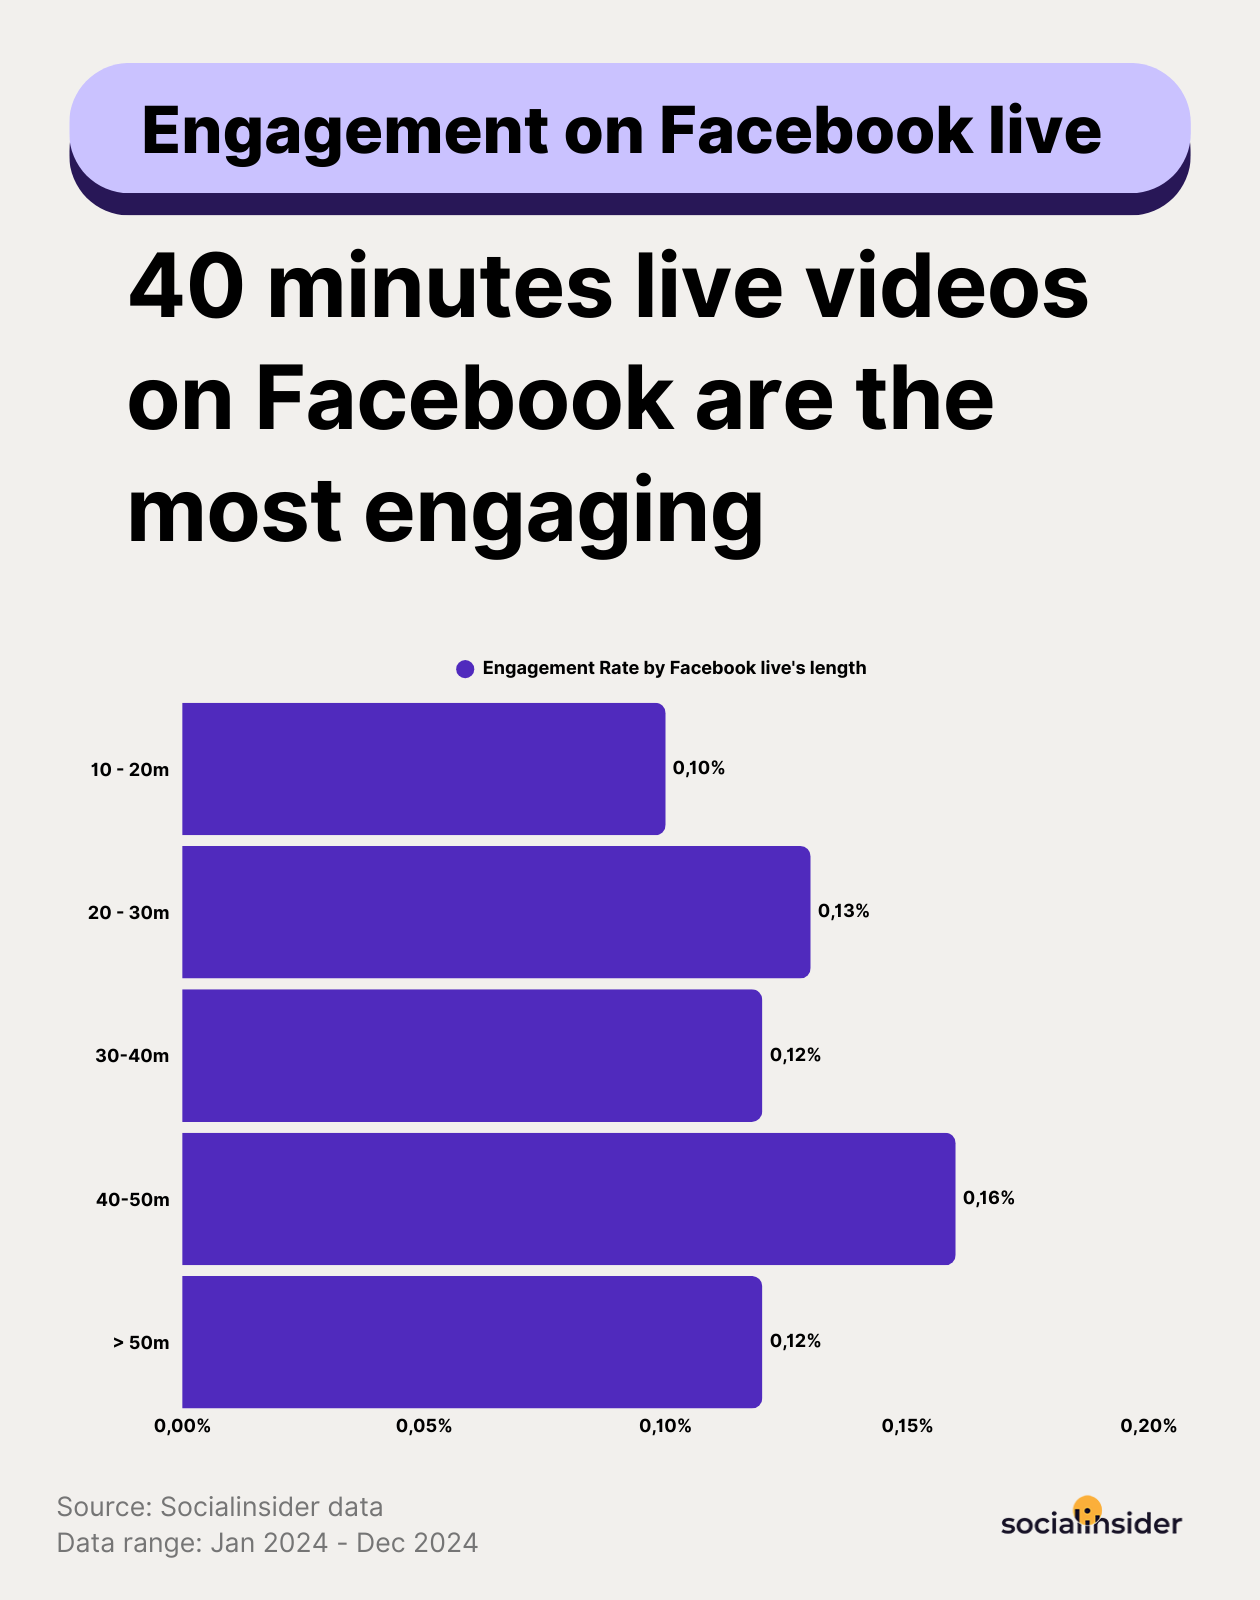
- Live video metrics: Live video metrics tell you who showed up and who stuck around. Peak live viewers show your high point, average watch time reveals how long you held attention, and replay performance tracks how well your live keeps working after the camera’s off.
X video analytics
- Video tweet metrics: Ever wonder if your video tweet actually made an impact? I look at three things: views to see how many stopped scrolling, engagements to spot how many interacted, and retweets to check if it got amplified.
I would sometimes post our shorter videos on X and LinkedIn, but I always kept viewer intent in mind. People don’t really go to X to watch videos — we’d see retention just plummet, like only 1% making it past 30 seconds. But I wouldn’t get too discouraged. I’ve seen people post something like an eight-minute Loom demo of their product that barely got views, but the few who watched it sent DMs, became leads, and actually drove results. So while the views might look low, the value can still be high.
- Threads video performance: Wondering whether to post your video as a standalone tweet or drop it into a thread? I’ve found it’s worth testing both. Threads can build context and curiosity before the video shows up, while standalone posts rely entirely on the first impression. Try both styles and see what your audience bites on.
LinkedIn video analytics
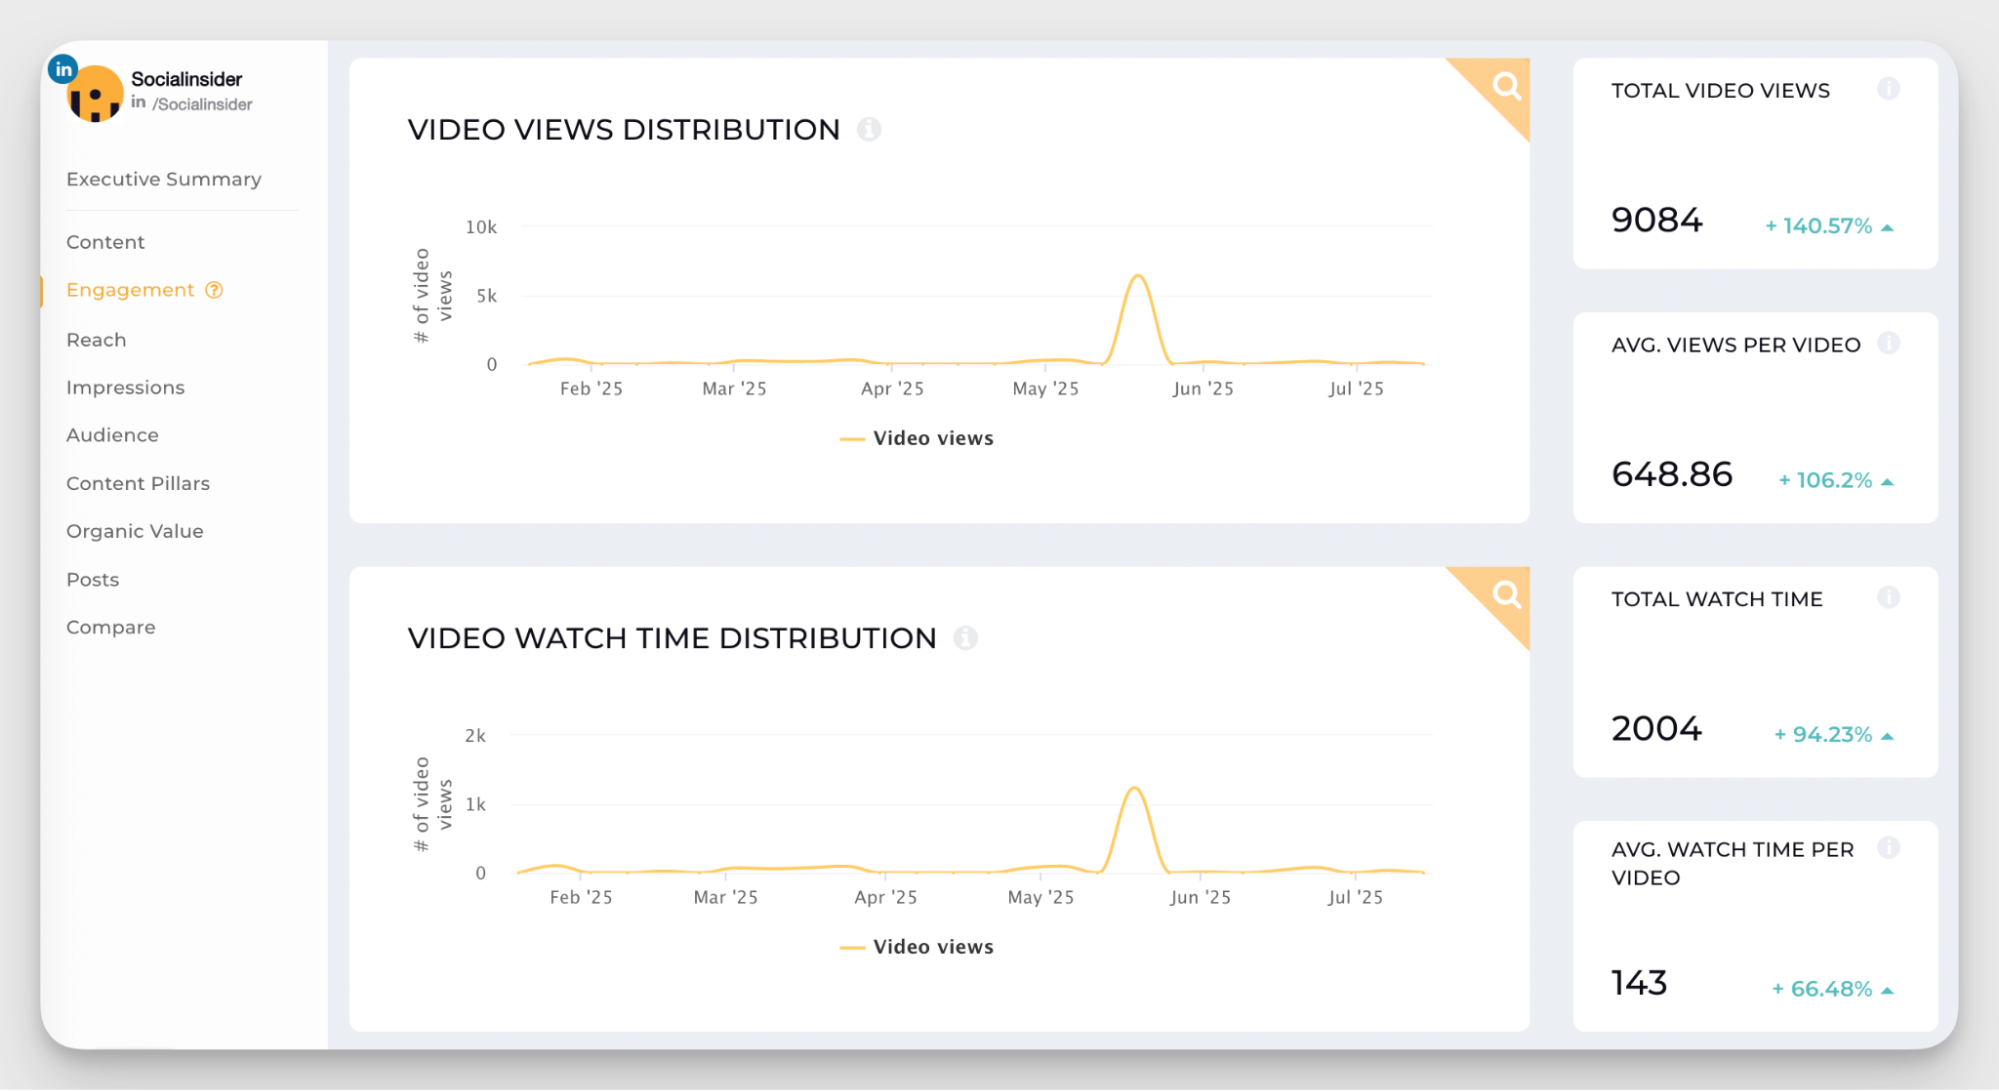
- Video performance metrics: LinkedIn video metrics tell you who stopped scrolling and who actually paid attention. Views show reach, likes and comments signal interest, shares boost your network effect, and watch time reveals if people stuck around or bounced.
In fact, LinkedIn recently started focusing on average watch time as a key performance metric for videos.
LinkedIn gives you average watch time now, which is great, but there’s no universal ‘good’ number. You just have to compare it against your own videos. Are you improving? Are people watching more? The best way to test that is by posting multiple videos of the same length, say 60 seconds, and seeing which ones hold attention better. That’s how you figure out what your audience is actually into.
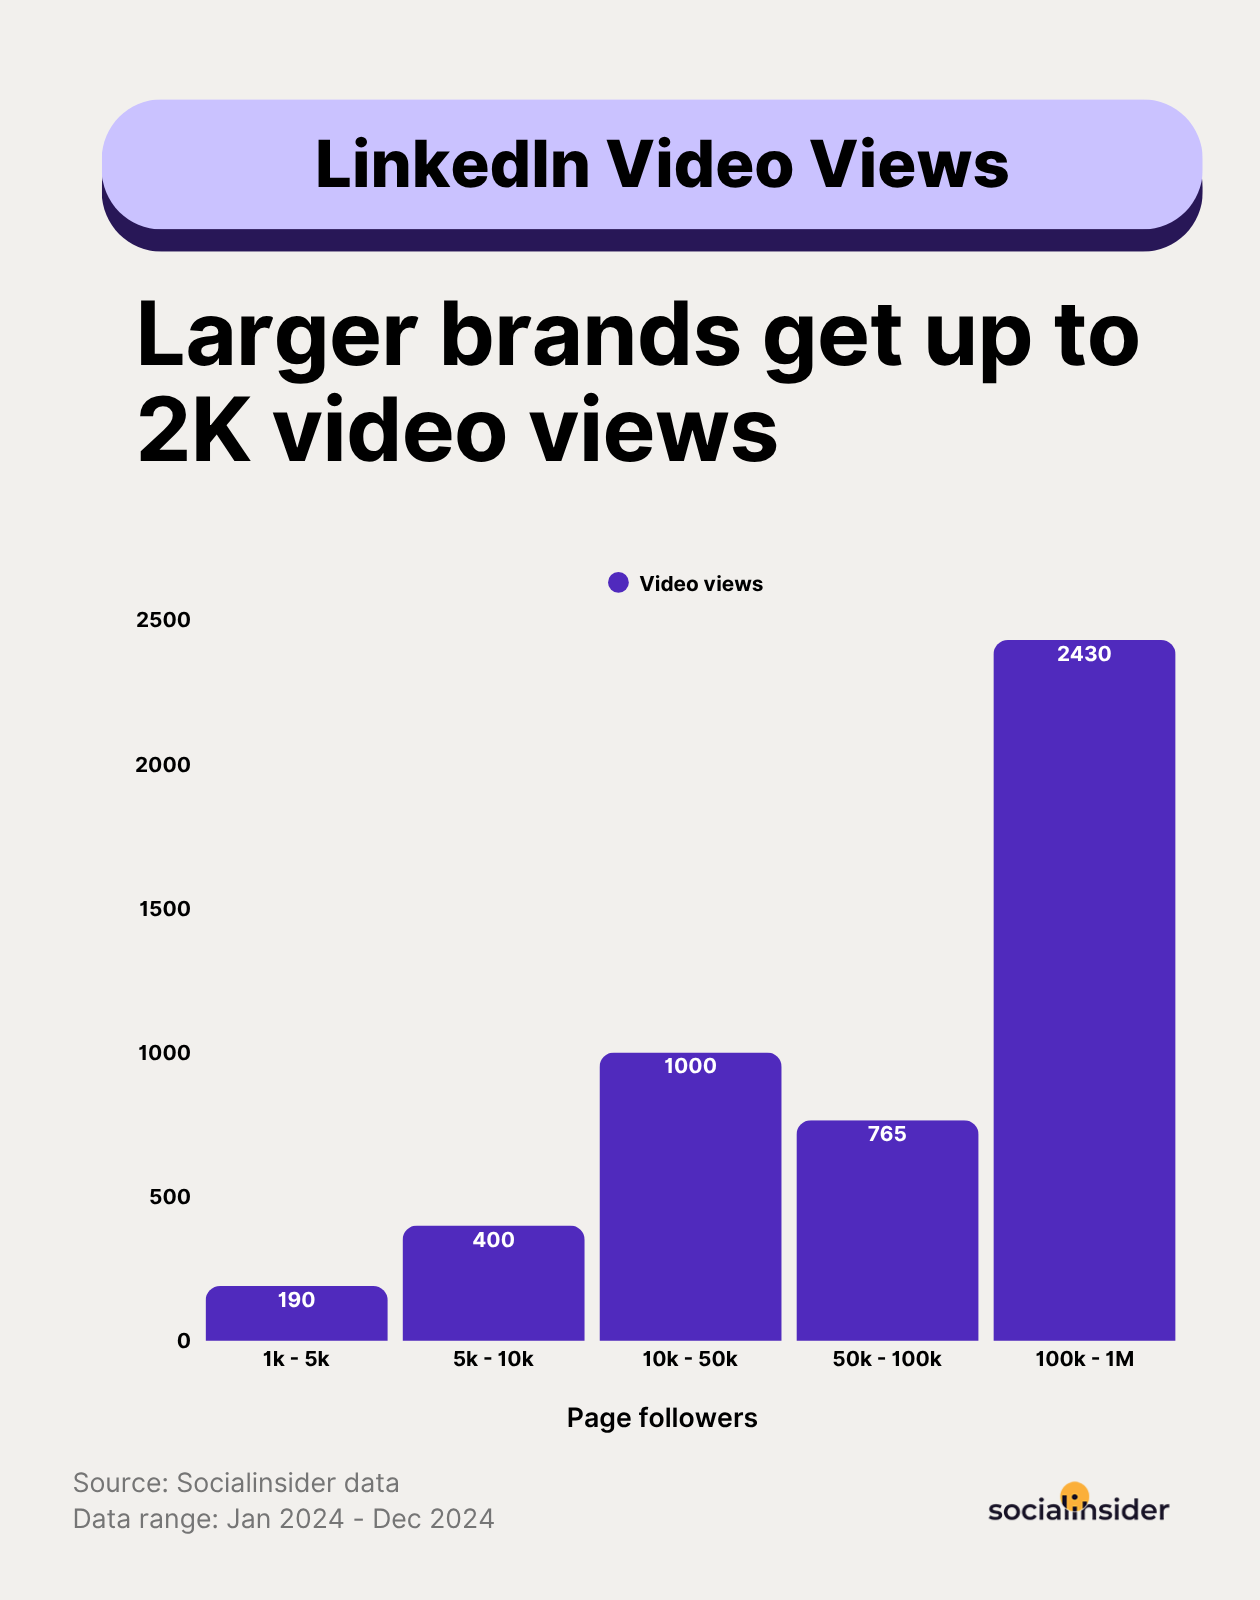
If you're looking for more benchmarks, here's a quick look at how average video views stack up across brands with different follower counts.
- Follower growth attribution: Not all videos bring in new followers, but some hit just right. Follower growth attribution shows which videos actually convinced people to stick around.
You can even experiment with letting employees post the video on their personal accounts and resharing it on your company page.
Thom did the same at Kit.
You kind of have to take into account what type of personal brands your team members are creating. If I interviewed someone at Kit, sometimes it made more sense to post it from my personal LinkedIn and then reshare it from the company page. One of our team members, Kyle, always wrote about newsletters, while someone in HR focused only on hiring. So it wouldn’t really make sense for the HR person to post content about newsletters on their personal account.
It’s about aligning the content with both their personal brand and what’s relevant for the audience. Personal posts usually got more reach, but it’s worth experimenting — try posting from both and see what performs better.
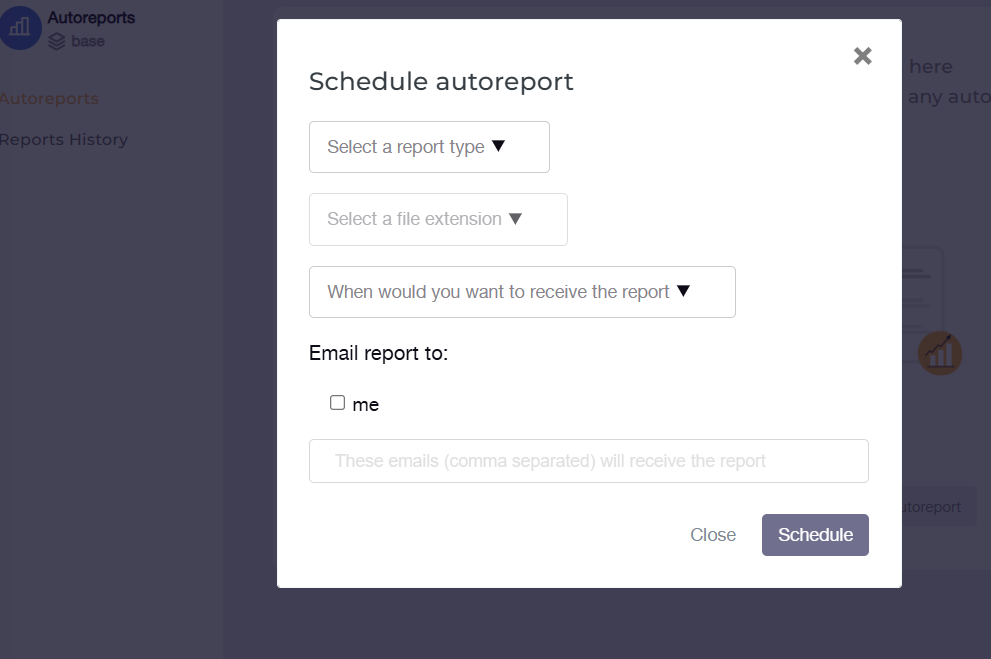
How to track your social media video marketing analytics
Tracking social media video performance requires more than checking view counts. Start by adding UTM parameters to your video links to measure traffic and conversions accurately. This will give you clarity on what content drives action and where.
I recommend starting with native platform analytics for basic data like views, reach, and watch time. But for broader windows, trend spotting, and side-by-side platform comparisons, layer in a third-party tool.
What do social media video analytics tools like Socialinsider bring to the picture? Let’s take a look.
- Get extended historical data for your videos: Native platforms often limit how far back you can go. Socialinsider gives you access to videos posted months ago and their corresponding metrics.
- Get detailed video metrics for each video: Whether you’re posting videos on TikTok or YouTube, get metrics for each video across channels. You can compare channel performance for similar videos, tag videos, and check high-performing content pillars.
- Identify content gaps with competitive analysis and benchmarking: See how your competitors are performing on each channel by seeing comparative metrics. You can even dig deep into particular competitors to spot what topics they’re winning with, how often they post, and where you could step in and grab attention.
Make reporting easier and quicker: No more jumping between platforms or building manual spreadsheets. Generate reports in minutes, customized for clients, teams, or stakeholders.
How to use social media video analytics to refine your overall video strategy
Tracking video metrics is only half the work done when it comes to running a social media video analytics project. The real win comes from using them to shape smarter content. Thom shared some great examples of how he used video analytics to fine-tune Kit’s social media strategy.
Let’s break it down.
- Experiment with CTAs and content themes: Kit’s team used analytics to check which CTAs and videos were getting more views, helping the team double down on what pulled the widest audience.
- Refine video structure based on retention graphs: By analyzing points where retention remained flat, they used data to structure intros, pacing, and segment flow to keep viewers engaged longer.
- Compare similar videos to find what works: They looked at metrics across videos with the same length or topic to understand which format or style held attention better.
- Break down long videos: Test what hooks or what parts of the video people find most engaging by breaking them down into multiple short videos and checking the engagement.
We’d break down one interview into different assets. Like a full video with multiple creators answering a question, and then a carousel that just featured one creator, like Jay Klaus. I’d look at which format got more engagement or if the creator accepted the collab. That helped me figure out what resonated more. If one version didn’t get much traction, next time I’d switch up the format or even the question itself. Over time, those patterns shaped what we created more of.
Final thoughts
Social media video analytics aren’t just a nice-to-have — they’re the difference between throwing content into the void and creating videos that consistently engage, convert, and grow your audience.
Thom’s approach at Kit proves that success comes from pairing creativity with data: testing CTAs, refining structure based on retention, and tailoring metrics to each video’s goal.
By tracking the right numbers for the right platforms, and by acting on what those numbers reveal, you can build a video strategy that evolves with your audience instead of guessing at what works. In short — make videos, measure them smartly, and let the data lead the way.
Nidhi Parikh
Nidhi Parikh is SaaS writer that believes scrolling through social media is research for work. When not working, find her binge watching the latest series or reading anything she can get her hands on.

Analyze your competitors in seconds
Track & analyze your competitors and get top social media metrics and more!
You might also like


Improve your social media strategy with Socialinsider!
Use in-depth data to measure your social accounts’ performance, analyze competitors, and gain insights to improve your strategy.