Video Metrics: The Complete Glossary for Social Video Performance
See which video metrics you should analyze to drive real ROI. Avoid vanity metrics, and track what actually converts viewers into customers.

Ask three people on a marketing team what "engagement" means for a video and you'll usually get three different answers. One means likes and comments. Another means shares. Someone else is quietly counting saves, because that's what actually matters on their platform. Nobody's wrong, exactly — they're just using the same word to mean different things, which is a bad place to start a reporting conversation.
That mismatch is the reason a glossary like this one is worth having open in a tab. Before you can track social video metrics consistently across a team (let alone across five different platforms), everyone needs to be pointing at the same definitions.
In this guide, I'll break down the relevance of the most important metrics you need to track and also offer you some insights and learning experiences from Thom Gibson, former social media strategist at Kit.
Key takeaways
- Views, watch time, completion/retention rate, reach, engagement rate, and click-through rate together show not just whether a video was seen, but whether it held attention and earned a reaction.
- There's no universal "ideal" video length — each platform rewards a different range, and applying one platform's sweet spot to another is one of the fastest ways to misread a video's performance.
- Most video metric mistakes come from comparing numbers that look the same but aren't — different view thresholds, different engagement denominators, or a single average hiding two very different retention patterns.
What are social media video metrics?
Social media video metrics are the measurements platforms generate for how a video was seen, watched, and reacted to. That covers a wide range: raw counts like views, time-based measures like watch time, and interaction-based ones like shares or comments. What ties them together is that they're all describing the same underlying thing: what happened when someone encountered your video, just from different angles.
I would say it's worth separating video metrics from video analytics here, even if the two get used interchangeably, because I think they shouldn't be. Metrics are the individual numbers themselves. Analytics is what you do with them: comparing, diagnosing, deciding what to change next. This piece is about the numbers: what each one is, and what it actually captures. If you're past that and want the framework for turning these into decisions, this guide covers that layer instead.
Why video metrics matter for social media strategy
A shared vocabulary isn't the whole reason to care about these definitions, though it's a good starting one. The bigger reason is that video marketing metrics are usually the only objective signal you have for what a piece of content actually did, as opposed to what you assumed it did while making it.
Without a clear read on video success metrics, it's easy to keep producing more of something that looks fine on the surface — decent view count, decent likes — while missing that almost nobody watched past the first five seconds, or that the people who did watch never took any further action. Metrics are what surface that gap between "looked fine" and "actually worked."
They also give a team a common basis for comparison. Two videos, same length, same platform, same week; if one clearly outperformed the other on the metrics that matter for that content's goal, that's a real signal worth investigating, not just a coincidence.
Which metric matters most also shifts depending on what the video was for in the first place. Thom Gibson, former social media strategist at Kit, described how this played out on his team:
Different goals have different kinds of metrics we look for. When we were at Kit, there were some videos that I knew would not go viral or get a high viewership, say tens of thousands of views. For example, some of our product update videos. But we knew it would be interesting and valuable for our core audience: people using the platform all the time. So I was less concerned about how much viewership it got. But the big metric I would see is whether people are commenting. Are they excited about some of these updates? Are they letting us know what else they want to see.
What are the key video metrics you need to track
These are the metrics that show up across nearly every platform, in some form. Platform-specific variations get their own section below — this is the base layer.
Views vs. impressions — what's the difference
A view counts a viewing event, usually once some minimum watch threshold has been crossed. An impression counts an appearance — your video showed up on someone's screen, whether or not they engaged with it at all. The two numbers can diverge a lot: a video can rack up impressions in a crowded feed without earning many actual views, which usually means the content stopped the scroll for fewer people than the reach numbers alone would suggest.
Watch time and average view duration
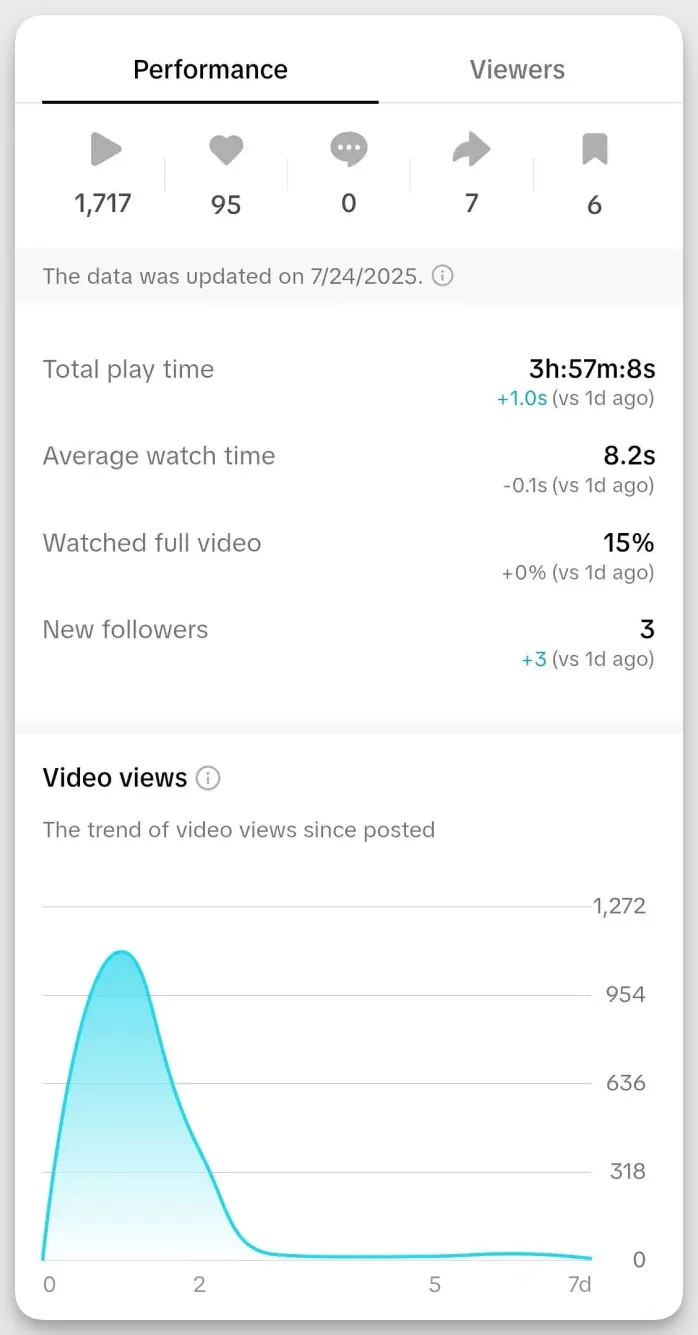
Watch time is the total accumulated time everyone spent watching your video, added together across all viewers. Average view duration divides that by the number of views, giving you a per-viewer figure. Watch time tells you about total attention earned; average view duration tells you how long a typical viewer sticks around, which is the more useful number for judging whether the video itself is holding people.
Thom Gibson pointed out why raw duration numbers can be misleading on their own, and why he leaned on percentage viewed instead:
When you look at the viewership, track the average percentage viewed. Because viewers may watch five minutes of two different videos. But one video may be seven minutes long while another may be an hour long. The percentage view gives you a bigger picture of how much people were interested in that type of video or the content of the video.
Completion rate / retention rate
Completion rate is the share of viewers who watched to the end. Retention rate is closer to a moving picture of that; the percentage of viewers still watching at each point through the video, not just at the finish line. A retention curve that falls steeply and early tells a different story than one that declines gradually throughout, even if the final completion number looks similar.
Reading a retention graph isn't always straightforward, even for someone who works with this data regularly. Here's how Thom Gibson described it:
I've struggled with really identifying drop-off points to clear things in a video. Did people drop off because they got bored? Was it because I was overexplaining things? Was what I was saying not relevant? Instead, what I did find helpful was noticing when the audience retention graph goes completely flat. I found whenever I was giving specific examples of how Kit creators were doing something and SHOWING some of the emails they were using, those sections were very flat, which means people did find those valuable.
Reach vs. views on video content
Reach counts unique people who saw your video at least once. Views can include the same person watching multiple times, so reach will always be equal to or lower than views for a given video. If views are climbing much faster than reach, that's usually a sign of repeat viewing rather than growing distribution, which isn't necessarily bad, but it's a different kind of win than expanding your audience.

When comparing reach across content formats (because I'm sure you do), it implies jumping between separate tabs for Reels, Stories, and feed posts, if you do it manually. However, with Socialinsider pulling all that data into a single view, you can more easily see how reach differs by format side by side instead of reconstructing the comparison by hand.
Engagement rate for video content (likes, comments, shares, saves)
Engagement rate rolls up the interaction-based video engagement metrics: likes, comments, shares, and saves, as a percentage of either views, reach, or followers, depending on which base you're comparing against.

Each interaction type signals something slightly different: likes are the lowest-effort signal, comments show someone cared enough to respond, shares mean they wanted their own audience to see it, and saves usually mean they intend to come back to it. Lumping them all into one blended rate is fine for a quick health check, but worth unpacking if you want to know why the rate moved.
Calculating this by hand across platforms means pulling likes, comments, shares, and saves separately for every video and doing the math yourself. Socialinsider calculates engagement rate automatically for every video, against whichever base (views, reach, or followers) makes sense for what you're trying to compare.

And one thingb that I find really valuable is that it also rolls this up at the format level (in Instagram's case) so instead of comparing engagement rate video by video, you can see the aggregated engagement rate across all your Instagram Reels as a single number and check how that format is performing overall.

Click-through rate on video posts
Click-through rate measures the share of people who saw your video's thumbnail or preview and actually clicked to watch it, or clicked through to a linked destination after watching. It's the metric most tied to how compelling your title, thumbnail, or opening frame is; a strong hook in the content itself doesn't help if nobody clicked to see it in the first place.
Thom Gibson explained how his team read CTR alongside percentage viewed rather than in isolation:
We used to compare videos that had a low click-through rate with the percentage viewed. For example, a low CTR but a higher percentage viewed means people who are clicking on the video are finding it valuable and watching a lot of the video. So maybe this is one of those videos we experiment on to get more attention. Maybe it just hasn't found as many people because we don't have a very compelling title or thumbnail.
Platform-specific video metrics and what they mean
The metrics above show up everywhere in some form, but each platform layers on its own specific measurements, and its own counting rules.
Instagram Reels: plays, replays, shares
Plays count how many times your Reel started playing, including replays, which makes it a looser number than a strict unique-view count. Replays specifically track how many times people watched the Reel again after it finished, which is one of the stronger short-form video engagement metrics available — a high replay count usually means the content had a loop-worthy hook or payoff. Shares on Reels carry extra weight because Instagram's distribution tends to favor content that's actively being passed around.
TikTok: average watch time, completion rate, traffic source breakdown
TikTok surfaces average watch time and completion rate prominently because both feed directly into how the For You algorithm decides what to keep pushing. Traffic source breakdown shows whether views came from the For You page, a follower's feed, sounds, or your own profile — which matters for figuring out whether a video's performance came from discovery or from your existing audience finding it.
YouTube: watch time, subscriber conversion, audience retention graph
YouTube's own analytics lean heavily on watch time as a ranking signal, alongside subscriber conversion — how many of the video's viewers went on to subscribe. The audience retention graph is the most detailed retention view of any platform, showing exactly where viewers dropped off or rewatched a section, second by second, rather than just a single completion percentage.
LinkedIn: video views (3-second standard), unique viewers
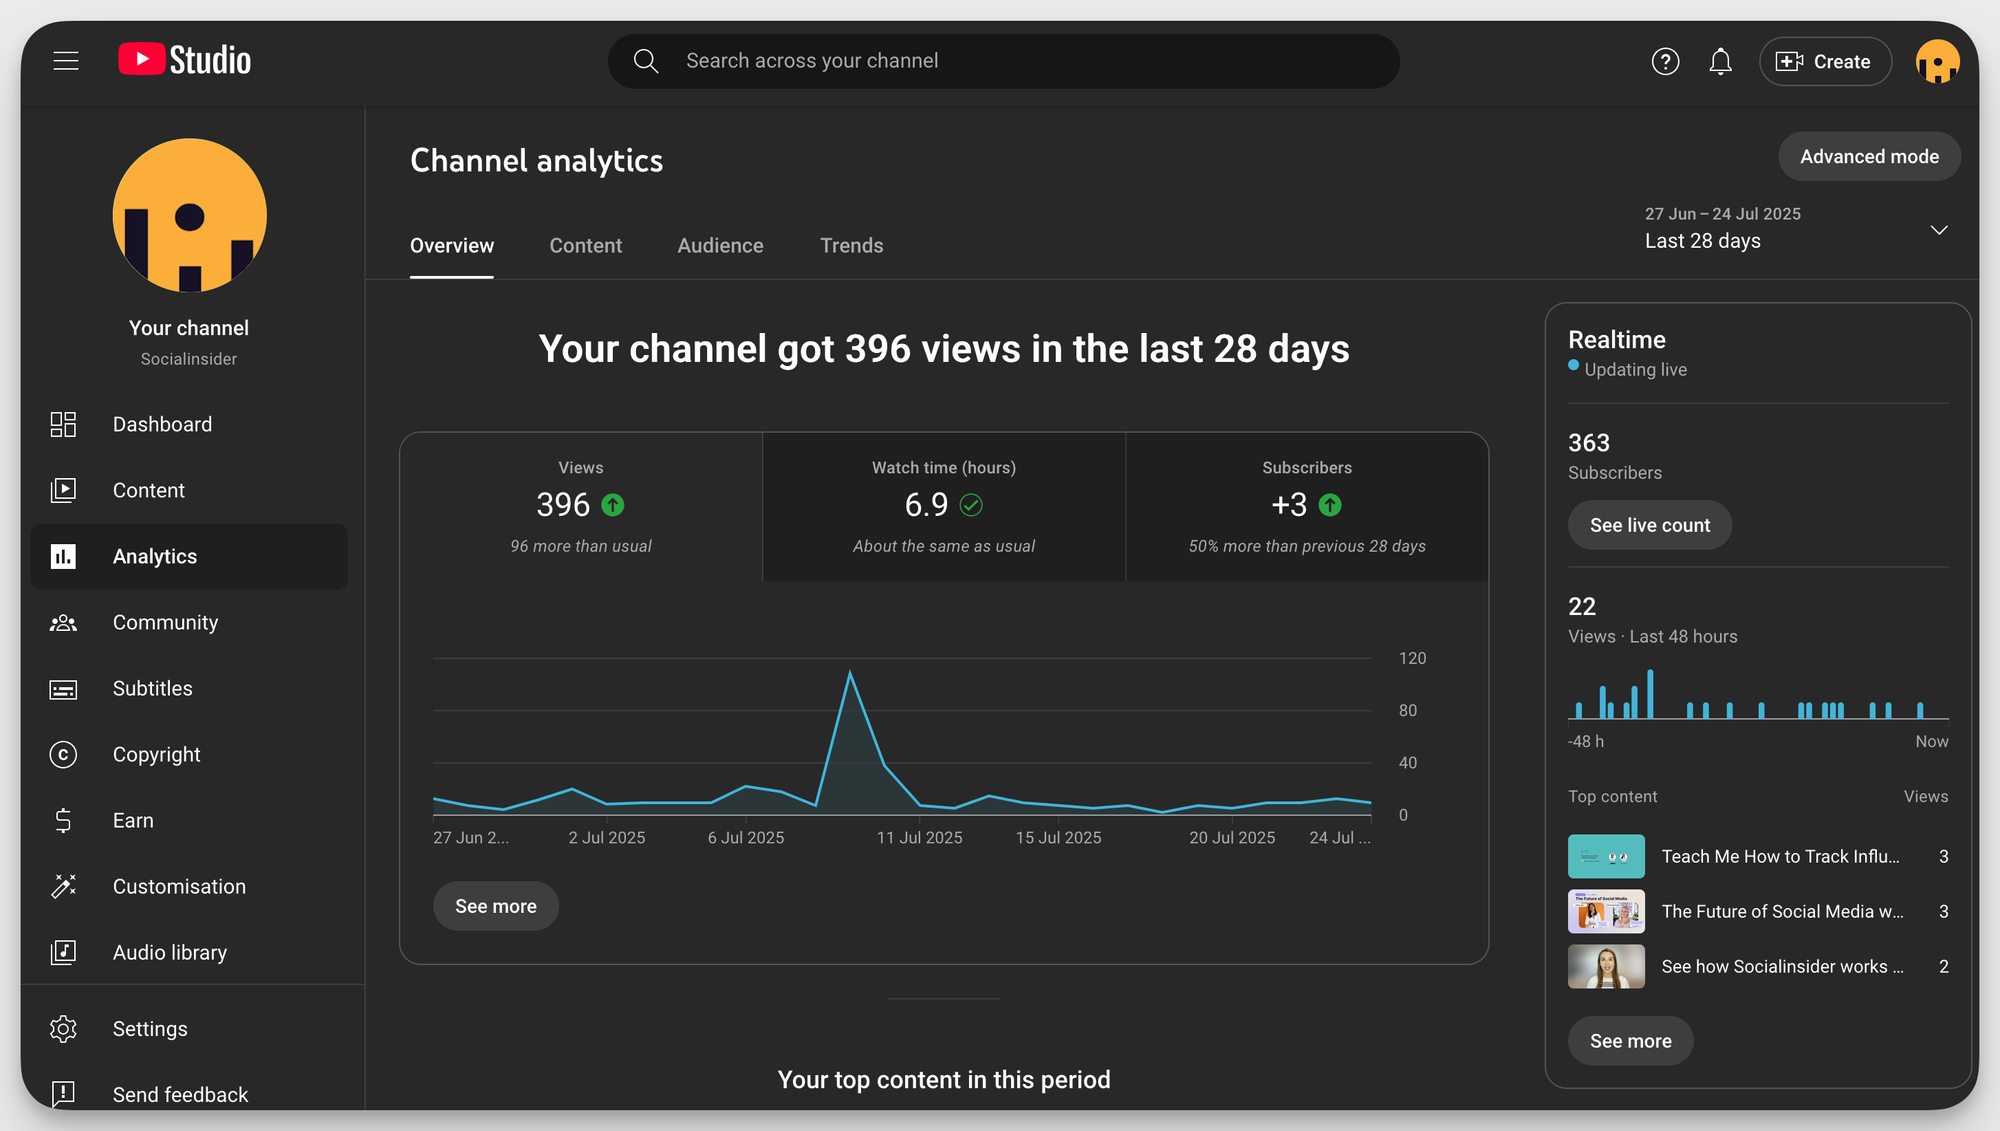
LinkedIn counts a video view starting at 3 seconds of watch time, which is a lower bar than most other platforms and worth remembering when comparing view counts across networks. Unique viewers, tracked separately, tells you how many distinct people that view count actually represents, since a single person scrolling past and back can otherwise inflate the raw number.
Facebook: 10-second views vs. ThruPlay
Facebook tracks 10-second views (anyone who watched at least 10 seconds) alongside ThruPlay, which counts either a full watch of videos under a minute or 15 seconds of watch time on longer ones. ThruPlay is generally the better signal for actual interest, since the 10-second threshold is short enough that autoplay alone can inflate it without anyone meaningfully engaging.
How video length affects performance by platform
The single biggest factor in whether a metric looks "good" or "bad" is video length, and it's easy to forget that when comparing numbers across formats. What counts as a strong engagement rate or view count shifts by platform, and, per Socialinsider's video performance statistics, the "ideal" length isn't the same everywhere either.
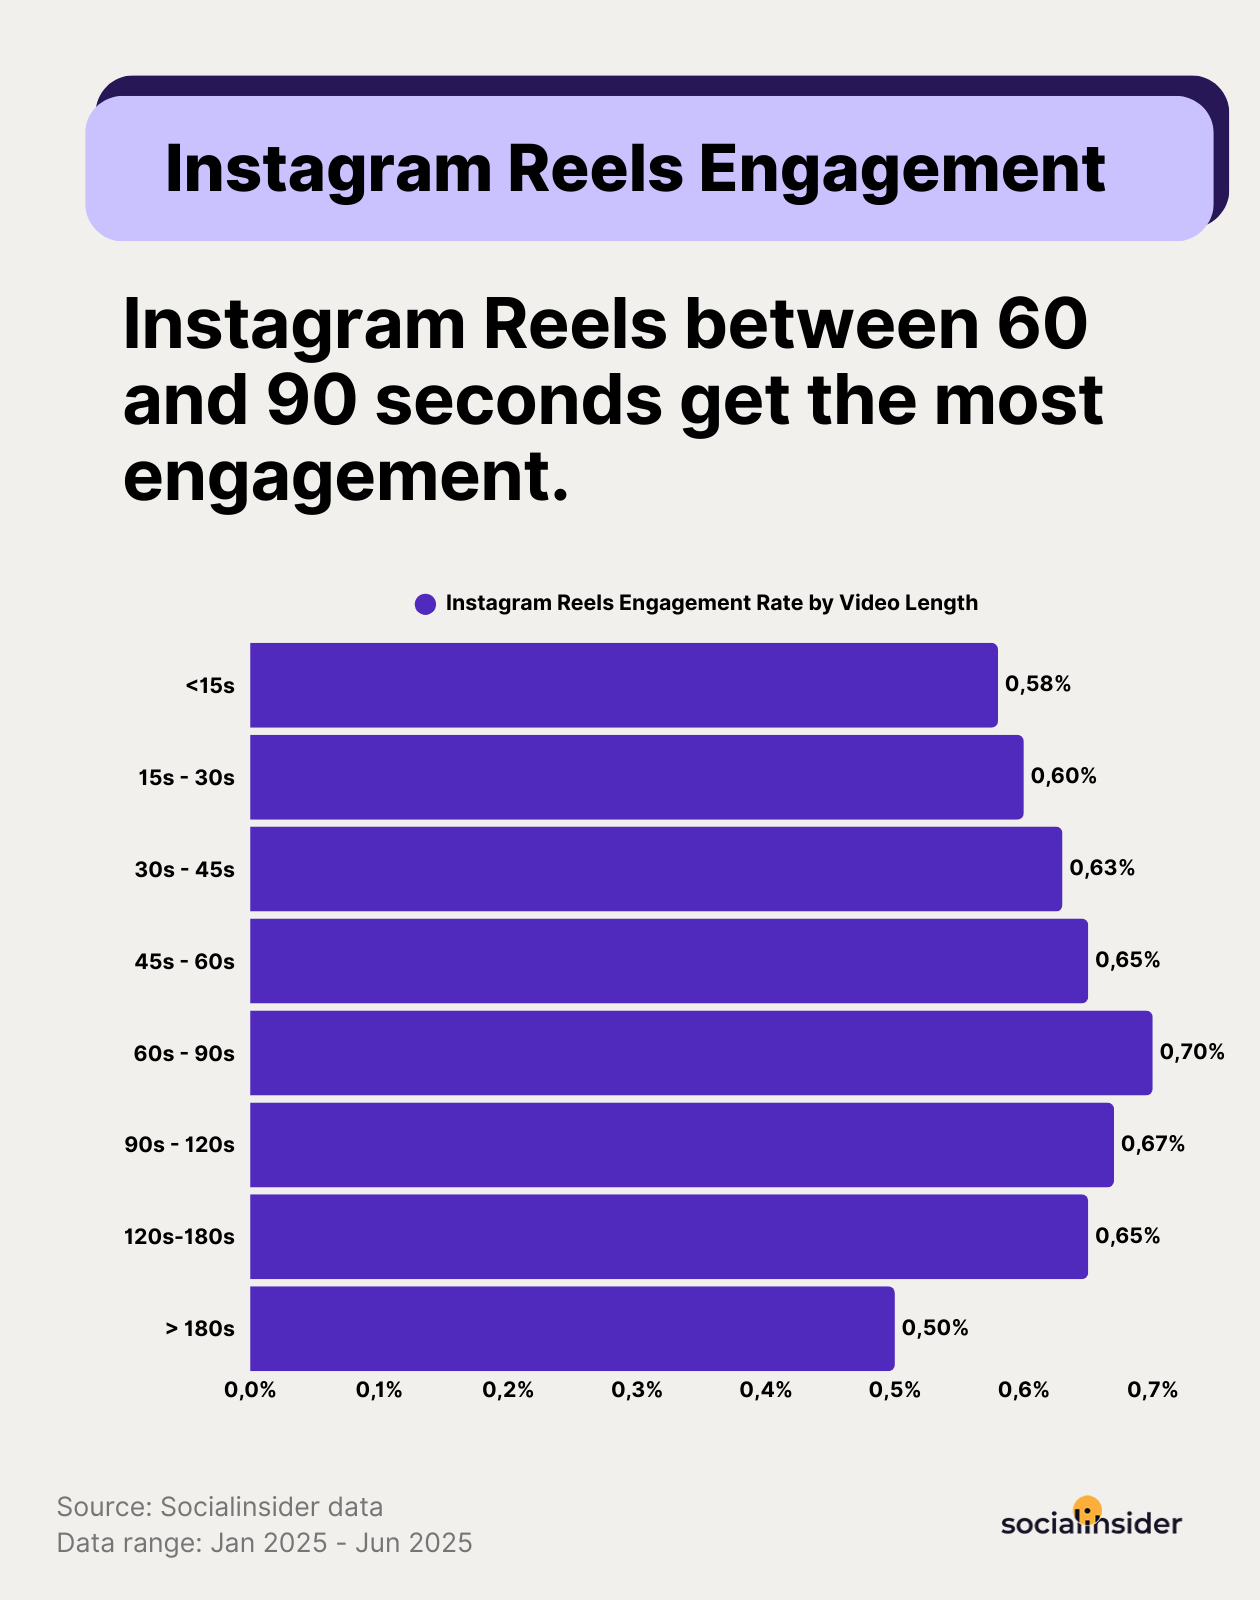
On Instagram Reels, both engagement and views peak in the 60–90 second range, then taper off. Anything under a minute still performs reasonably well, but past the 90-second mark, views decline fairly consistently; Reels don't punish length outright, but there's a ceiling.
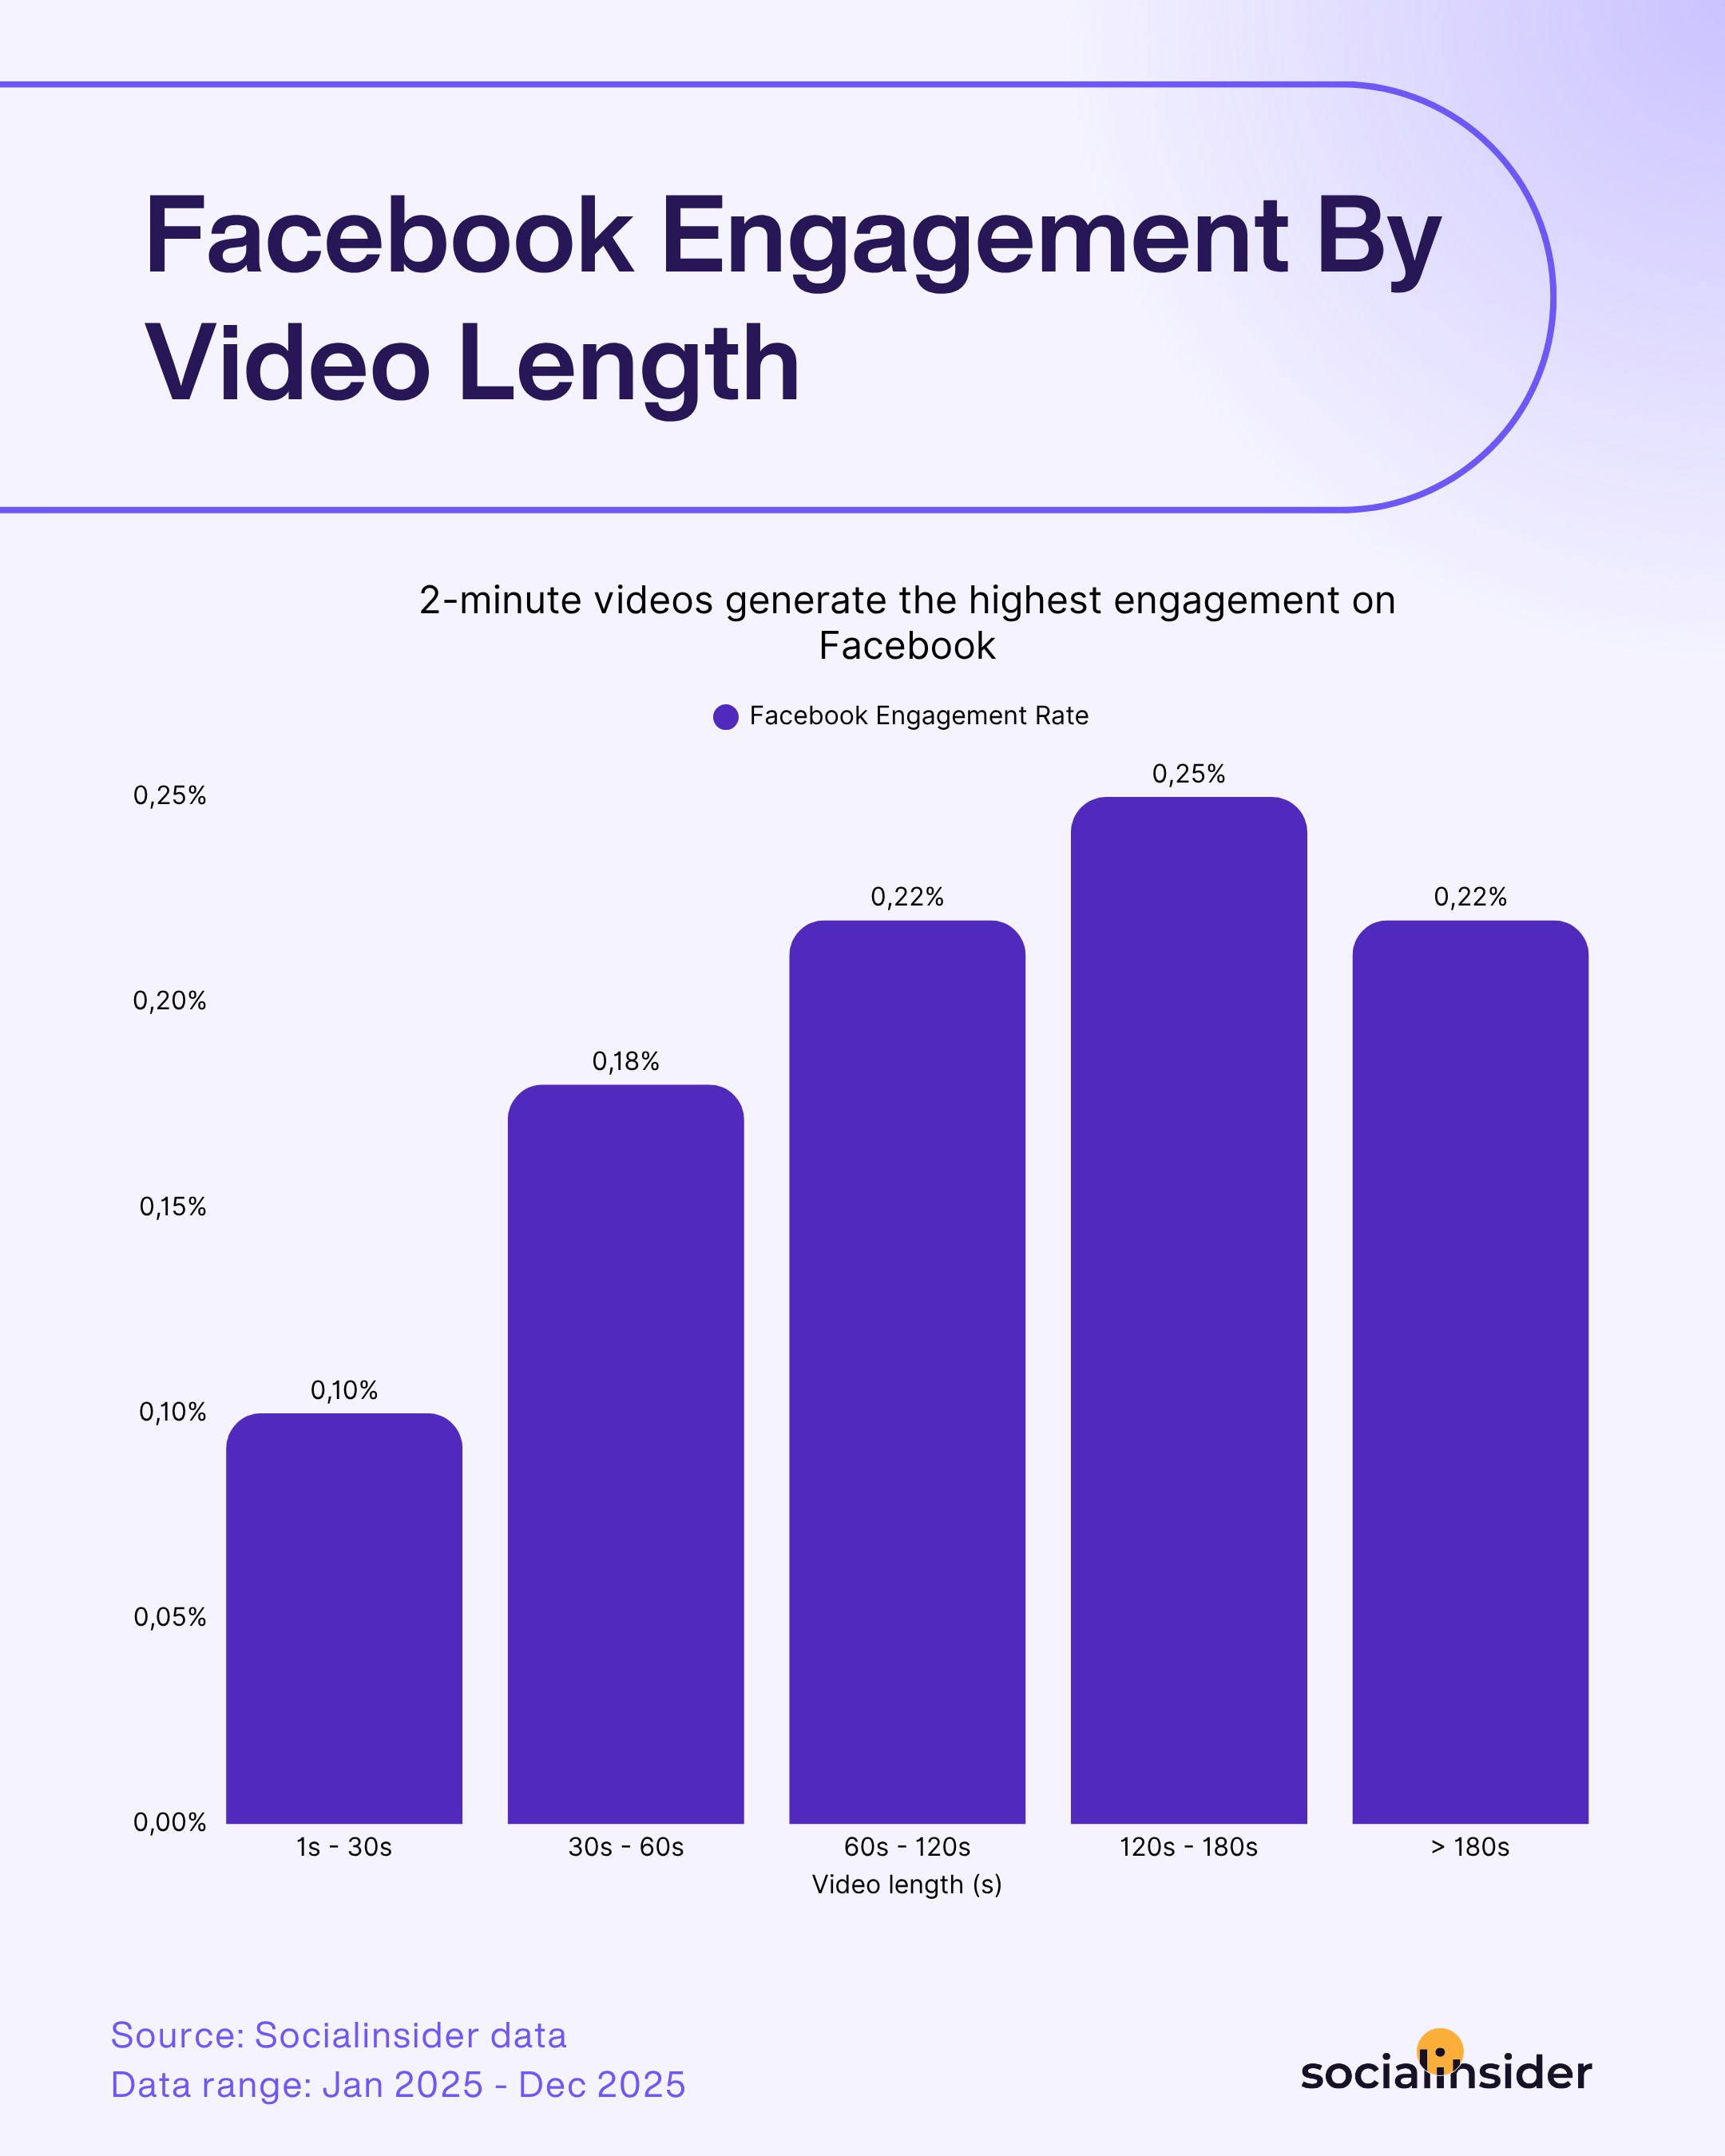
Facebook shows a similar shape with a slightly wider window: videos (which are now all treated as Reels by the platform) between 120 and 180 seconds get the strongest engagement rate, while views peak a touch later, after the 180-second mark.
Facebook Live runs on a completely different clock; engagement there peaks between 40 and 50 minutes, with both shorter and longer sessions underperforming.
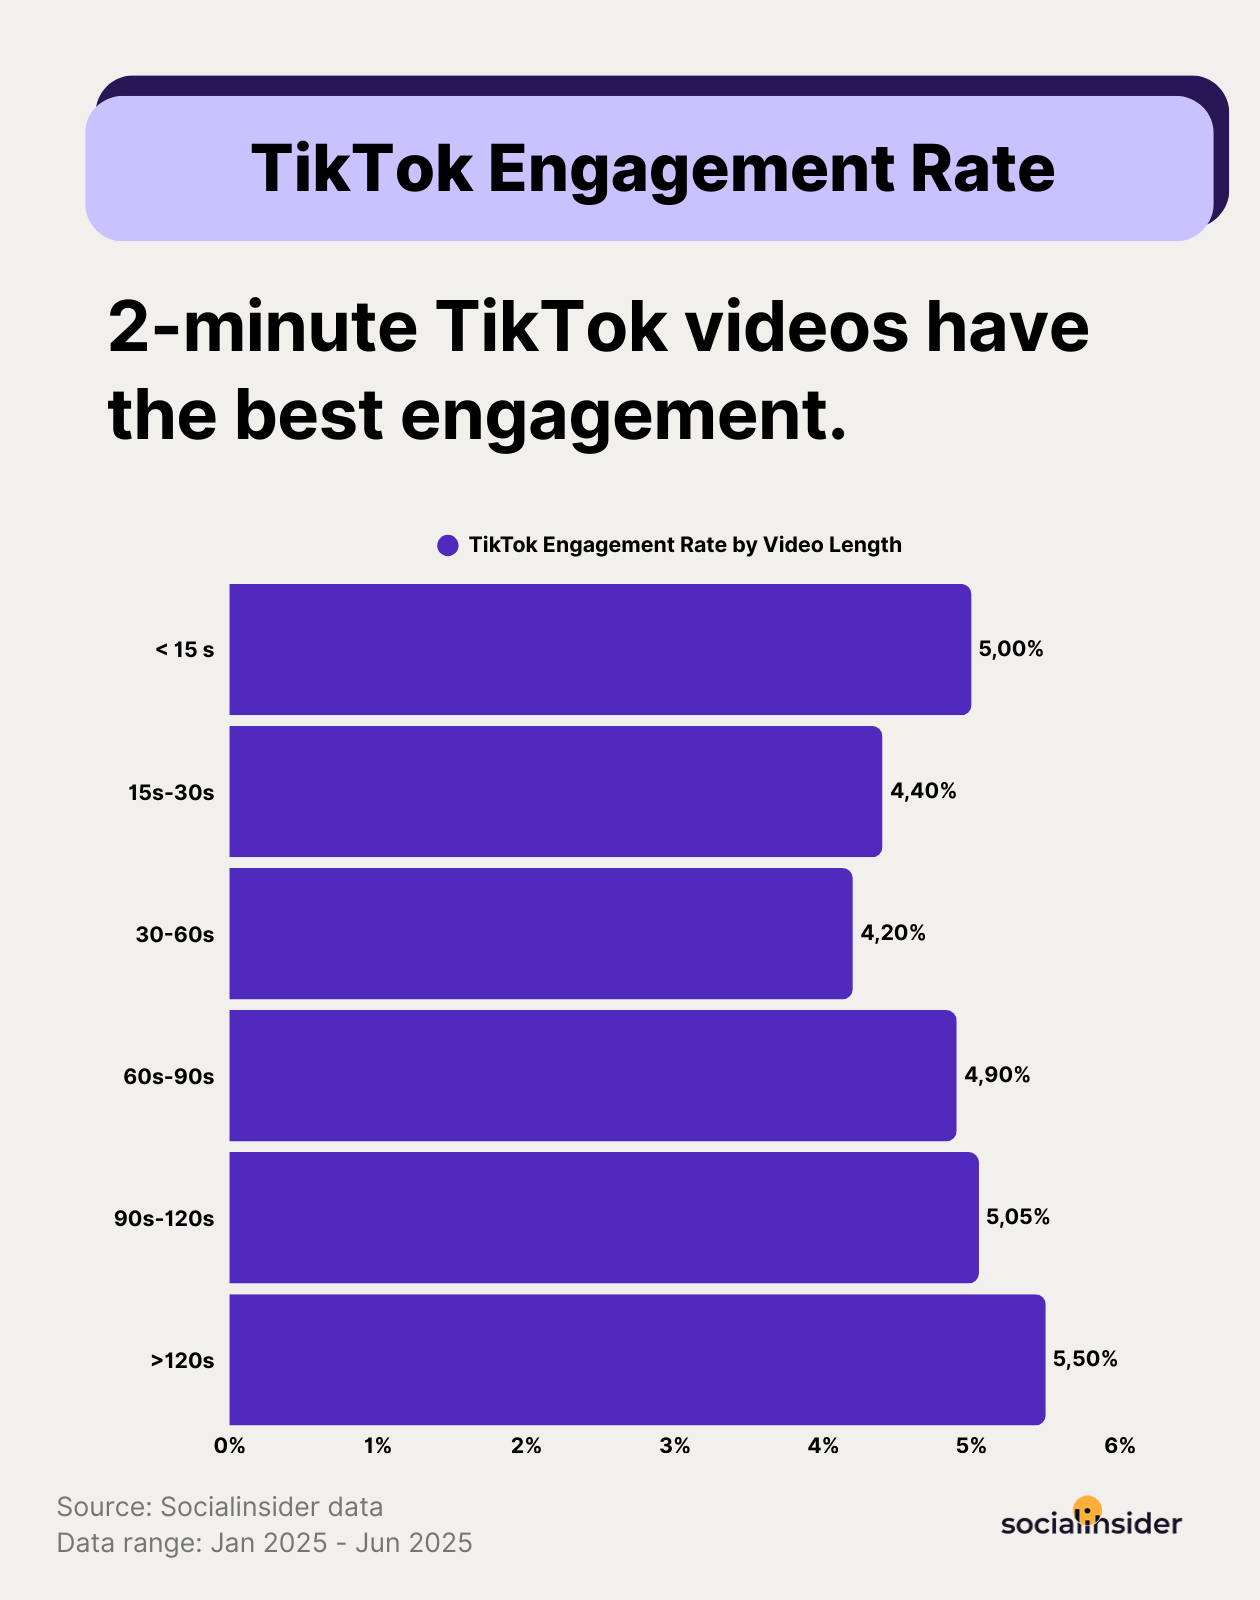
TikTok has moved furthest from the "keep it short" assumption. Both engagement and views now climb as videos get longer, with the highest numbers showing up past the two-minute mark. Based on Socialinsider's data, it would appear the platform's reputation for short-form content doesn't match what's actually winning on it anymore.
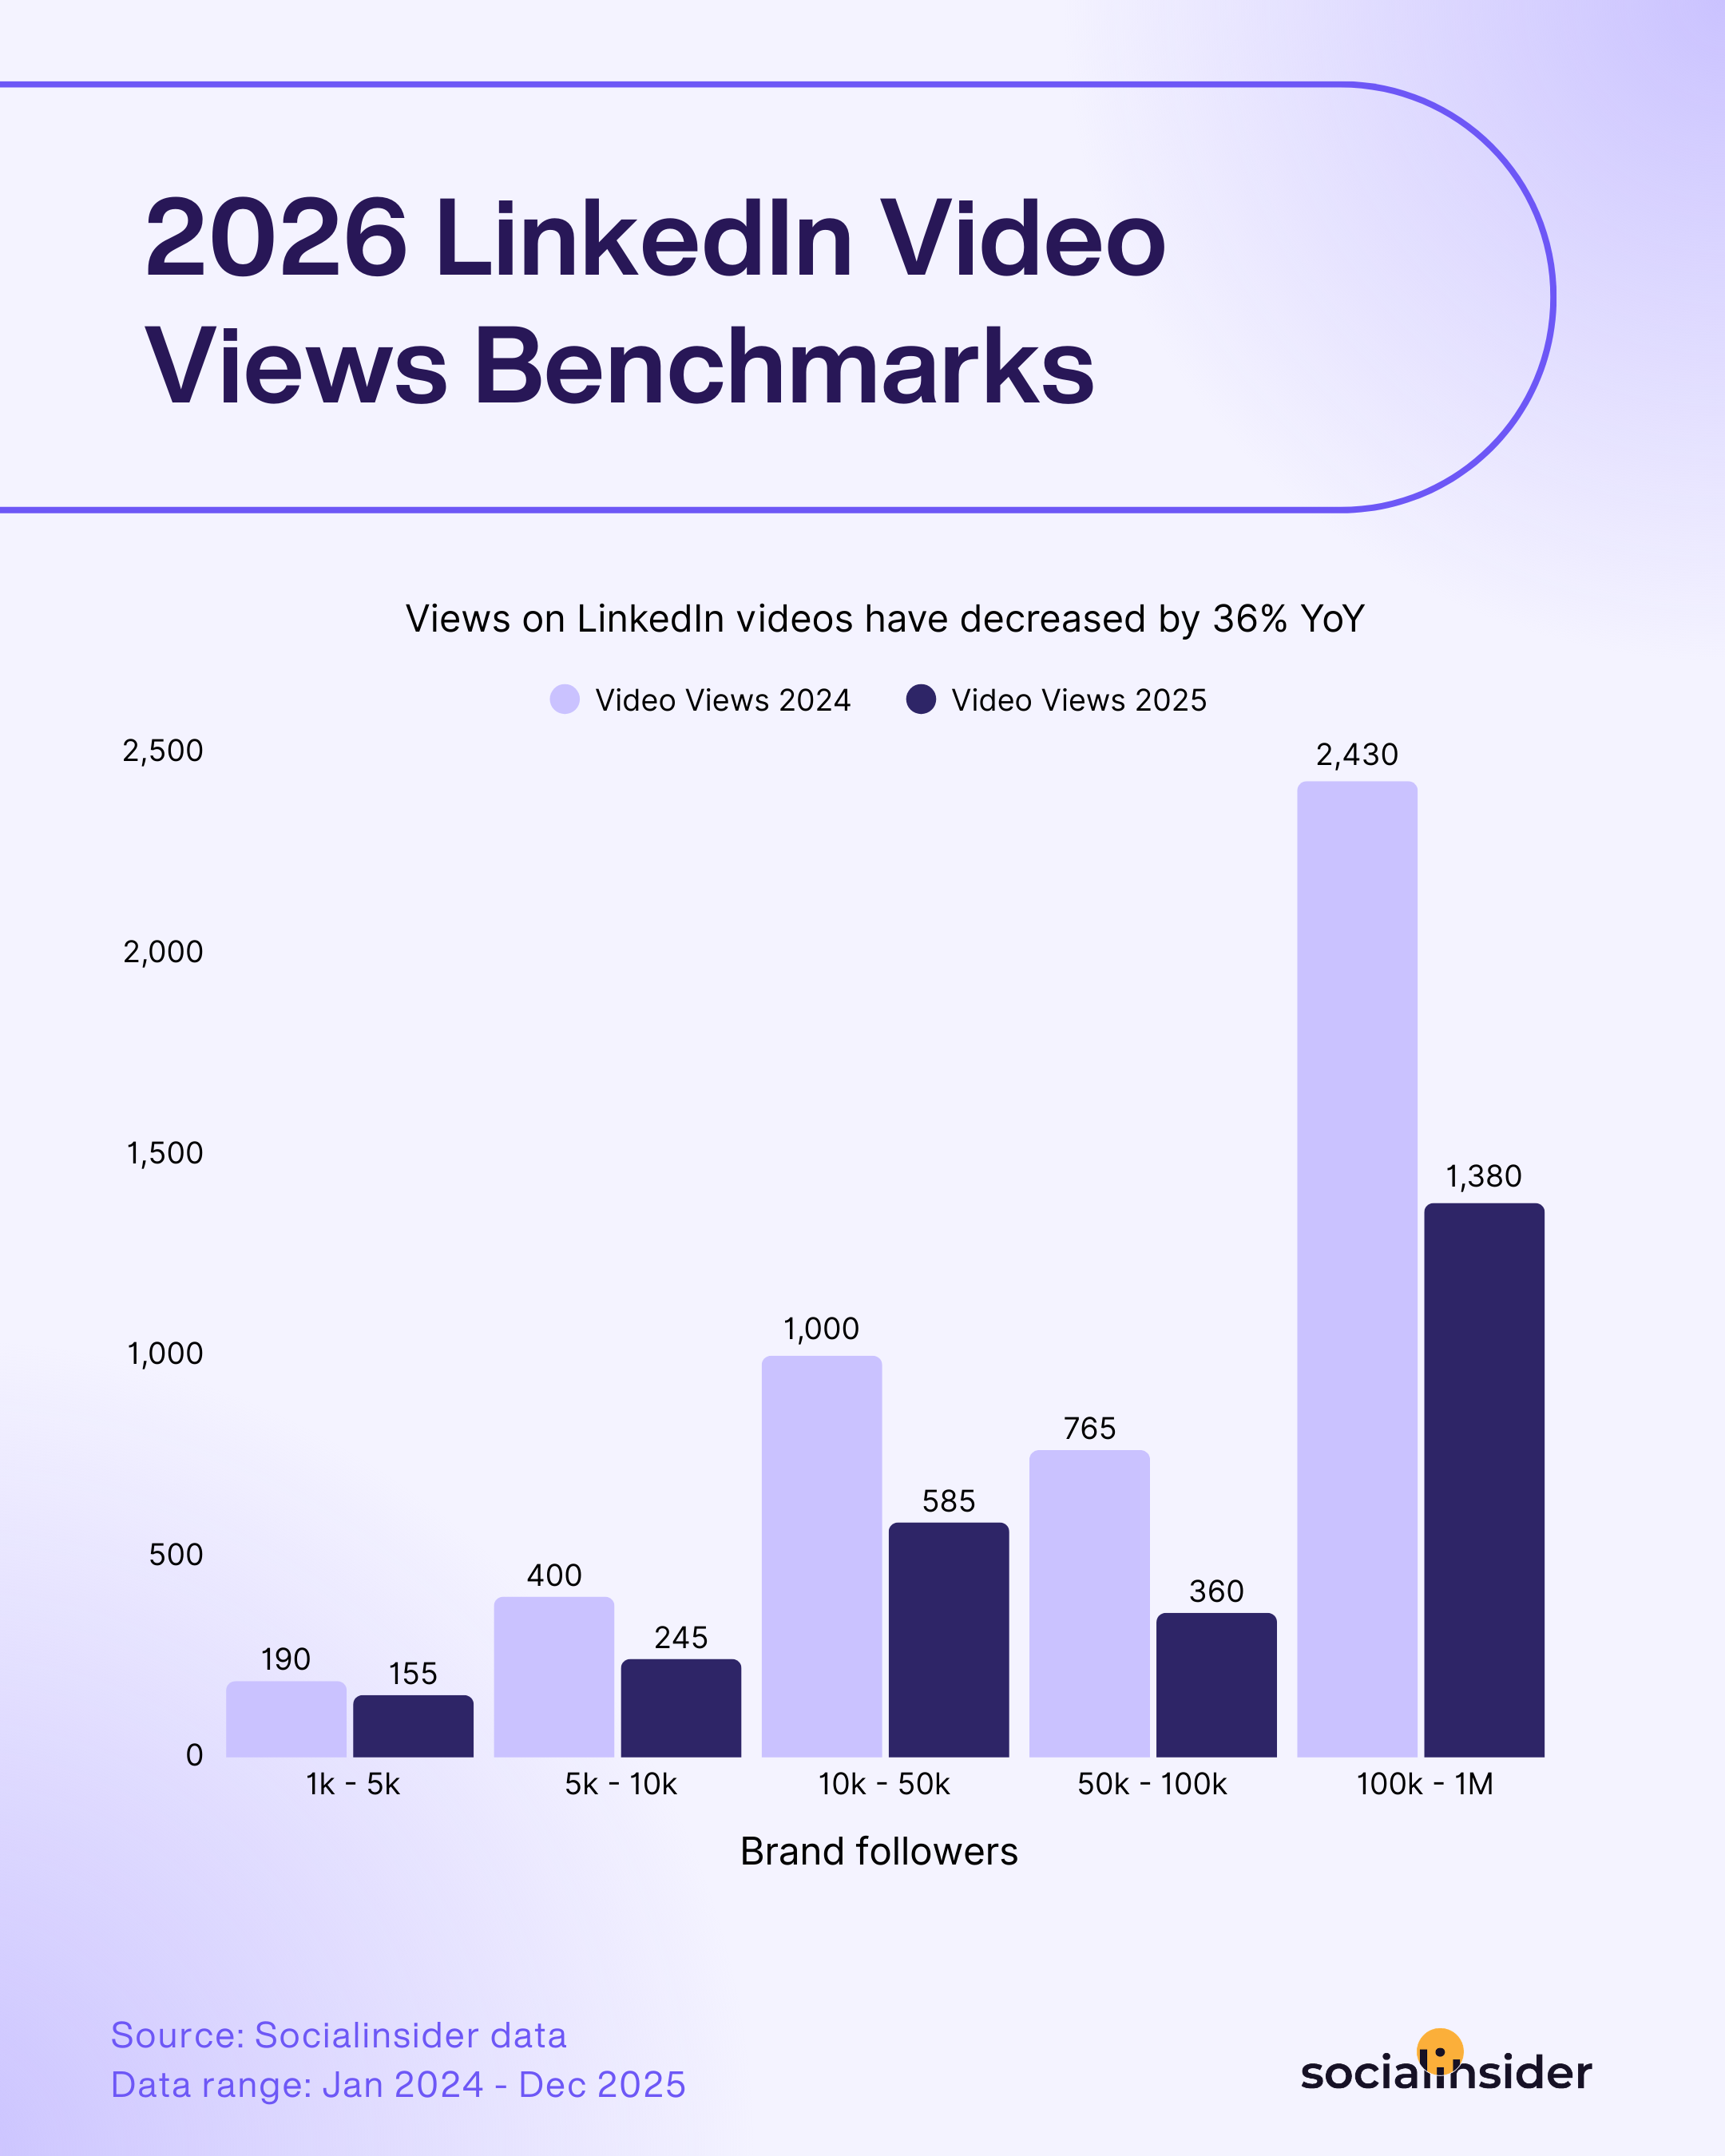
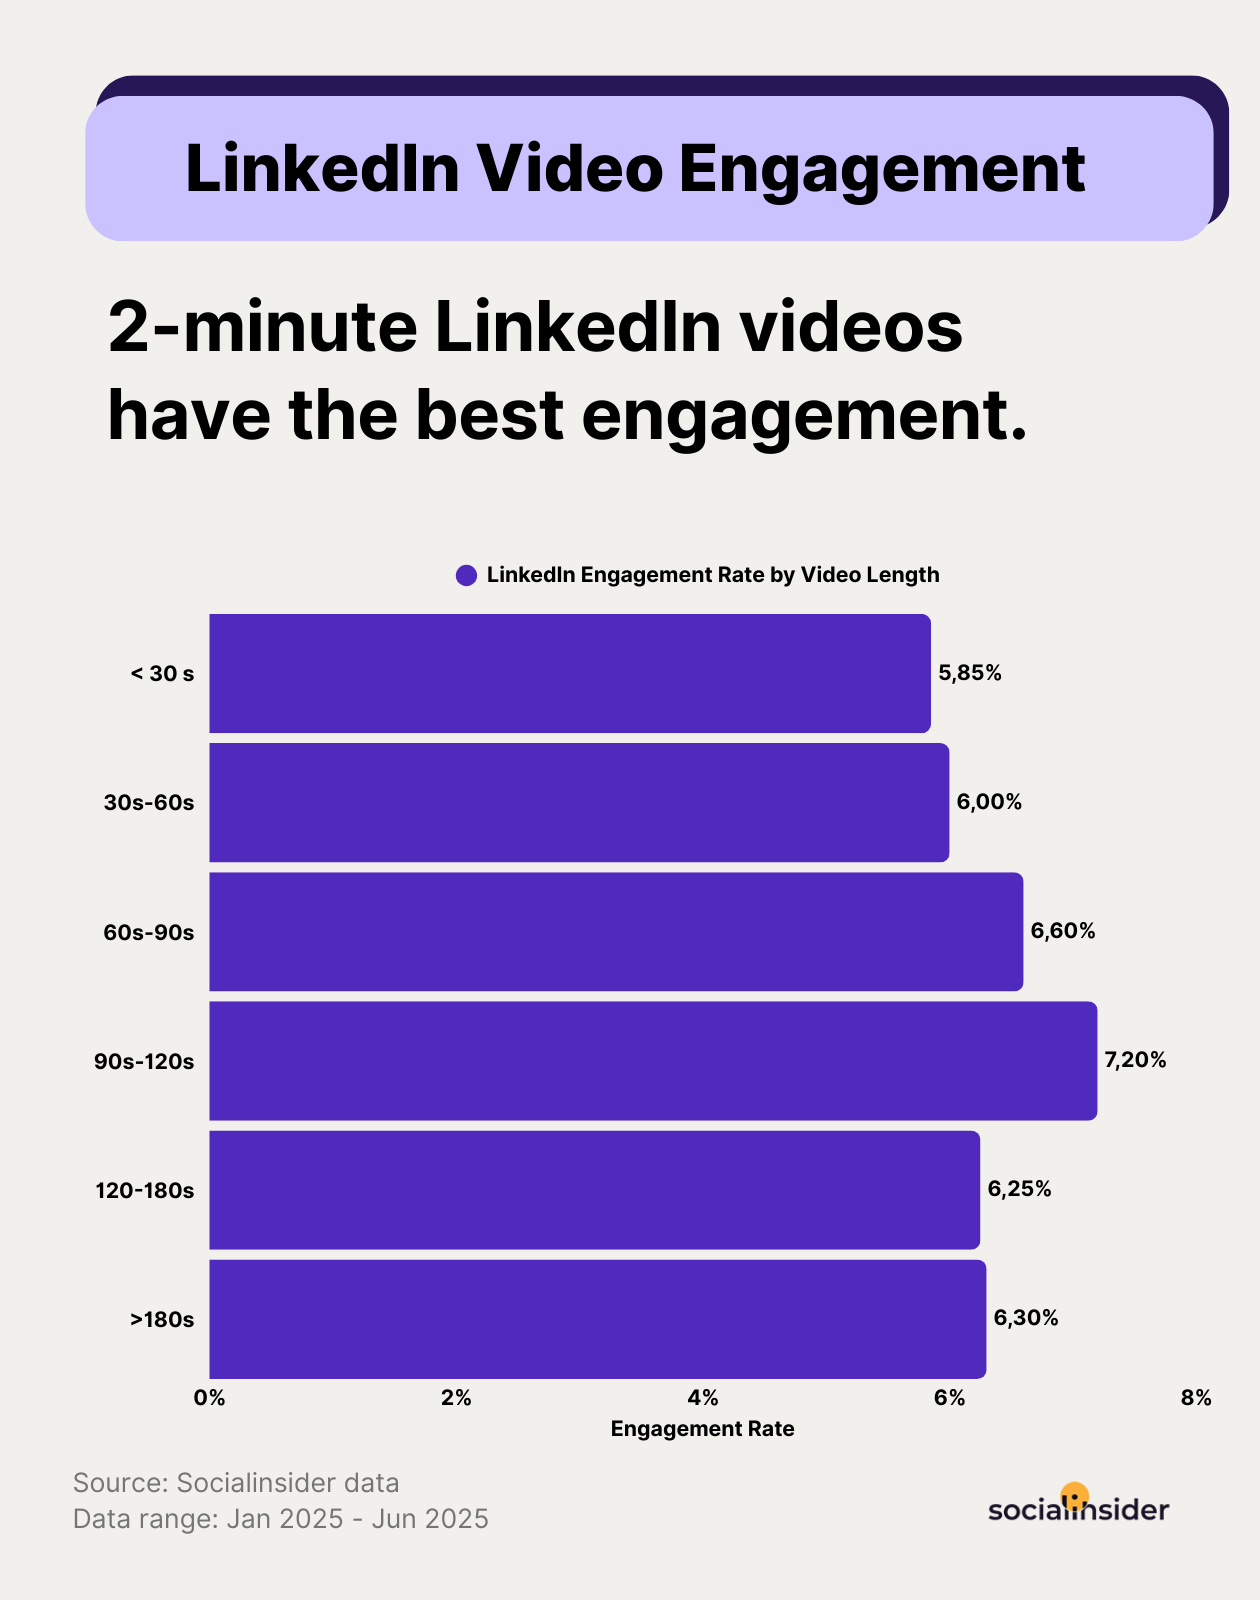
LinkedIn is the least intuitive of the four. Engagement rate peaks in the 90–120 second window. In terms of views, it's only once a video crosses the 3-minute mark that views jump well past everything else. On LinkedIn, the data points to a preference for something substantial.
The pattern across all four: don't borrow a length assumption from one platform and apply it to another. Measuring video performance metrics without checking them against the platform's own length curve is one of the fastest ways to draw the wrong conclusion from a perfectly fine video.
Common video metric mistakes and misreadings
A few misreadings show up often enough to be worth calling out directly.
- Reading engagement rate without knowing the denominator. Engagement rate calculated against followers tells a different story than the same rate calculated against reach or impressions. A video can have a high engagement rate against reach (everyone who saw it engaged) and a low one against followers (most followers never saw it); both numbers are correct, they're just answering different questions.
- Confusing reach growth with audience growth. Rising reach on a video doesn't necessarily mean your audience is growing; it can just mean one piece of content got unusually wide distribution. Follower growth and subscriber conversion are the metrics that actually reflect audience growth, not reach on a single video.
- Judging retention curves by the average alone. Two videos can have the same completion rate with completely different retention curves; one loses viewers steadily throughout, the other loses most of them in the first five seconds and holds the rest almost to the end. The average hides which situation you're actually in, and those two situations call for different fixes.
If you've got the definitions down and you're ready to actually use these video marketing metrics to track what's working and diagnose what isn't, that's exactly what our video analytics framework walks through next.
Final thoughts
None of these definitions are complicated on their own. What trips teams up is treating a metric from one platform as if it means the same thing everywhere, or reporting a number without checking what it's actually being measured against. Get the vocabulary straight first — that's what this glossary is for — and the numbers stop being a source of confusion and start being something you can actually act on.

Nidhi Parikh
Having worked with several brands in the social media space, Nidhi writes about all things social. With 13K followers on LinkedIn, she's always up for a chat about books or her next travel plan

Know what your competitors do — before your manager asks
Get instant social benchmarks & reports without manual work.