Facebook ROI: How to Actually Measure What’s Working?
Unlock the secrets of effectively measuring your Facebook ROI. Explore expert tips and tools that will help you achieve better results.


A 3.8 ROAS can mean your Facebook campaigns are working, or that your attribution setup is flattering you. Without the right measurement infrastructure, you genuinely can't tell the difference.
And this is why proving social media marketing ROI requires more than Ads Manager screenshots. It requires a tracking stack your CFO can't argue with, attribution logic that reflects how customers actually buy, and organic metrics that translate into language finance understands.
In this article, I’ll guide you through all of this, so the next time you’re talking with your manager about Facebook’s ROI, you are fully prepared with the right insights. Let’s dive in!
Key takeaways
-
Paid vs. organic Facebook ROI: Paid and organic must be measured separately because paid drives immediate, trackable returns while organic builds long-term, compounding value that isn’t captured in short attribution windows.
-
Key metrics for Facebook ROI: Focus on metrics that tie to real business outcomes—like blended CAC, LTV, CPA, and CRM-verified revenue for paid, and engagement quality, link clicks, and Organic Value for organic.
-
Setting up Facebook ROI tracking: Reliable ROI measurement requires a full tracking stack—Meta Pixel + Conversions API, consistent UTM parameters, disciplined CRM source tracking, and GA4 attribution—to connect ad activity to actual revenue.
Paid vs. organic Facebook ROI: why they need separate measurement frameworks
The mistake almost every team makes at some point: measuring paid and organic Facebook performance with the same ruler. It’s a bit like judging a 100-metre sprinter and a marathon runner by the same stopwatch. The number makes sense, but it doesn’t tell you what you actually need to know.
Paid and organic Facebook exist in fundamentally different ROI universes. Paid campaigns are transactional: you spend a defined amount and expect a measurable return within a defined window. Every dollar has a job. Organic content, on the other hand, operates on compounding logic; it builds audiences, signals, trust, and brand depth over time. The returns are real, but they gather quietly in the background.
The practical implication is simple: before you build any reporting system for Facebook, decide which layer you’re measuring and make sure stakeholders know which number they’re looking at.
Key metrics to track for measuring Facebook ROI (paid and organic)
Metrics aren’t created equal. Some are data. Some are signals. Some are noise dressed up as intelligence. The goal here is to track what actually connects to business outcomes.
Paid campaign metrics
ROAS (return on ad spend)
ROAS is the most-cited metric in paid Facebook marketing and the most dangerous when used in isolation. Platform-reported ROAS looks reliable until you compare it against what actually closed in your CRM.
One of the hardest Facebook audits came after Ads Manager reported efficient ROAS while finance saw no matching lift in cash collected. The gap came from duplicate conversions, delayed refunds, and leads credited inside Meta that later stalled in CRM. — Jason Hennessey, CEO of Hennessey Digital
The critical shift many experienced teams are making: treating ROAS as a signal, not a verdict. Tyler Denk, CEO of beehiiv, put it plainly after his team identified a pattern of platform-reported efficiency masking weak downstream value:
ROAS became less useful once we started tracking subscriber quality instead of just acquisition cost. We improved revenue per acquired user by about 33% while scaling more sustainably. — Tyler Denk, CEO of beehiiv
The replacement metrics that practitioners are gravitating toward: blended CAC (Customer Acquisition Cost), new customer count, and LTV by channel cohort; all verified against CRM and billing data, not Ads Manager alone. I've seen this shift happening across teams of all sizes because the metric doesn't change, but what you do with it does.
One sharp rule of thumb from Lexi Petersen, Founder of Cords Club:
Ads that have a unique outbound CTR of less than 3% or a cost per unique outbound click of greater than $2 are campaigns that have either reached audience fatigue or have landing page mismatches, regardless of what their ROAS numbers may indicate.
CPC, CPM, CPA, and Conversion Rate
These four metrics form the diagnostic layer of paid Facebook measurement. They don’t tell you if Facebook is working, they tell you where it’s breaking.
The trap is optimizing CPM and CPC without tracking CPA. You can build a beautifully cheap-to-run campaign that generates zero revenue. It’s happened to every experienced team at least once (including me).
Organic content metrics
Organic reach and engagement rate
Organic Facebook reach has declined significantly (average organic views dropped 17% between 2024 and 2025), but the marketers declaring it "dead" are mostly looking at absolute reach numbers rather than engagement quality. The people still engaging organically tend to be your warmest audience: existing customers, high-intent prospects, and loyal community members.
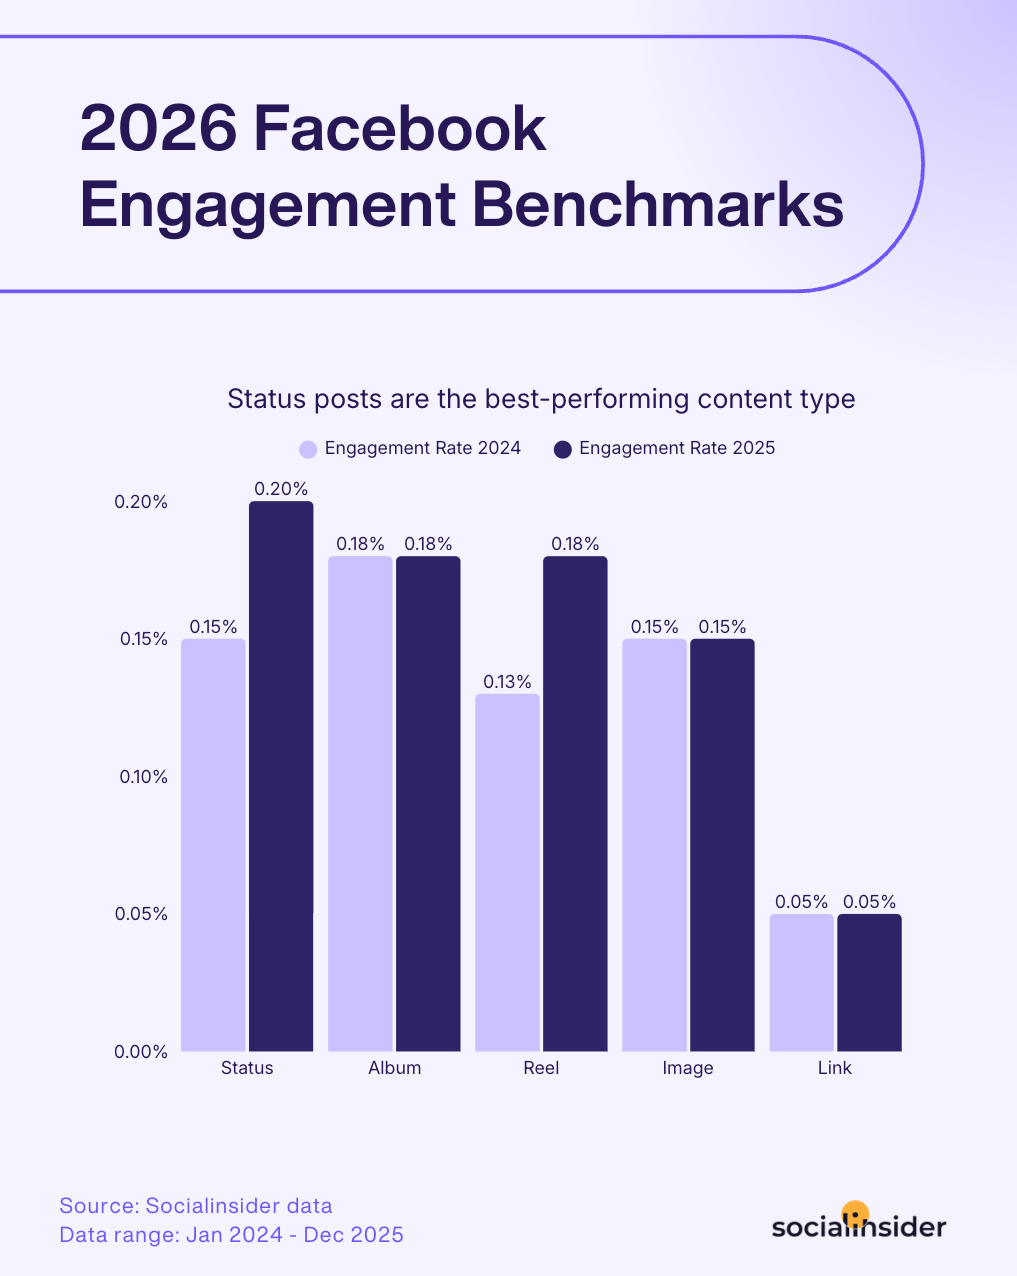
Engagement rate benchmarks vary significantly by page size, industry, and content format. While broader benchmark reports like Socialinsider’s Facebook benchmarks still offer a useful starting point, they’re best used as directional context. The real value comes from comparing your performance against relevant peers and tracking your own trends over time, rather than relying on one generalized average.
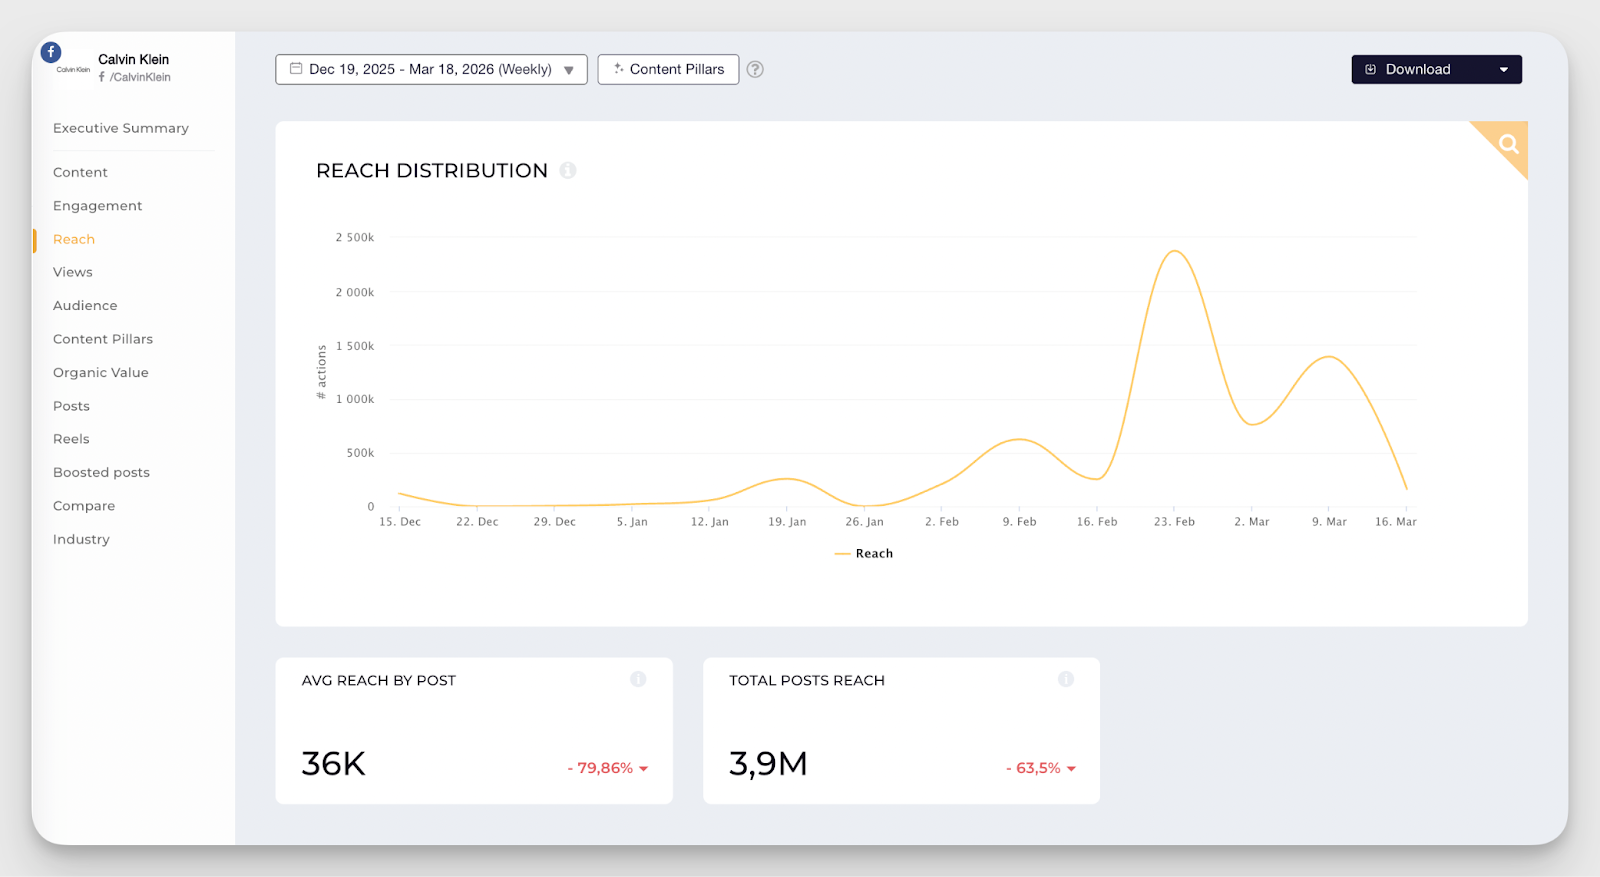
Personally, when digging into data within Socialinaider, I find its evolutive charts particularly useful because they show whether your engagement rate is improving or degrading against your category, not just what your number is today.
The snapshot below gives you a quick view of how reach is distributed for a single brand. Inside the platform, you can go further by tracking trends, comparing performance, and putting that data into real context.
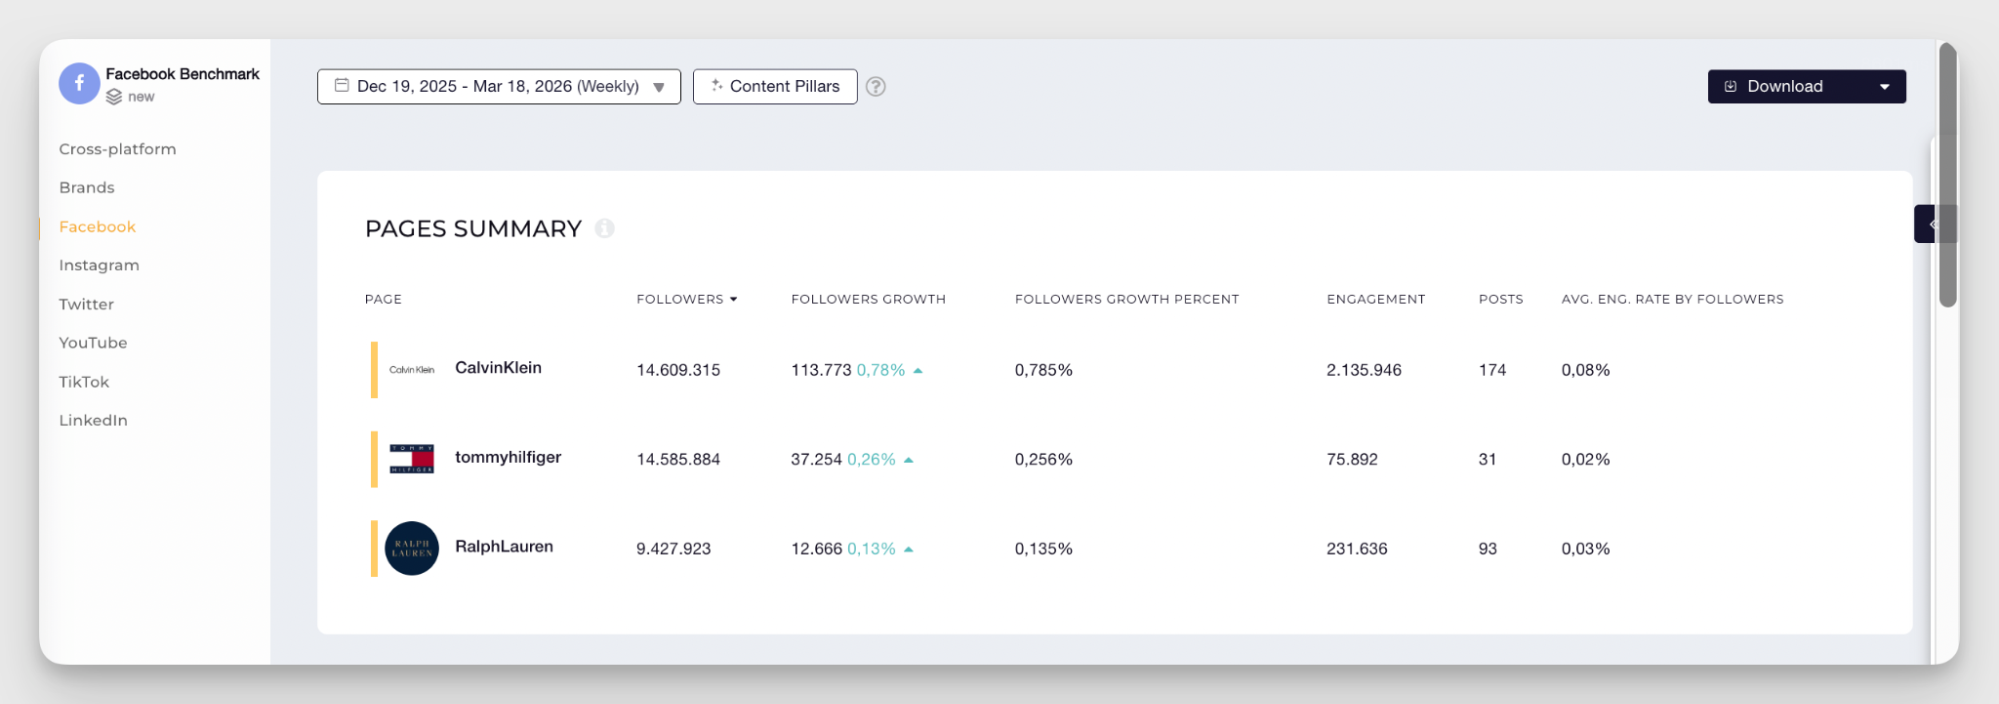
Beyond benchmarks, Socialinsider’s side-by-side competitive benchmarking enables direct comparison against specific competitors, giving organic ROI analysis the same precision that paid analysis takes for granted.
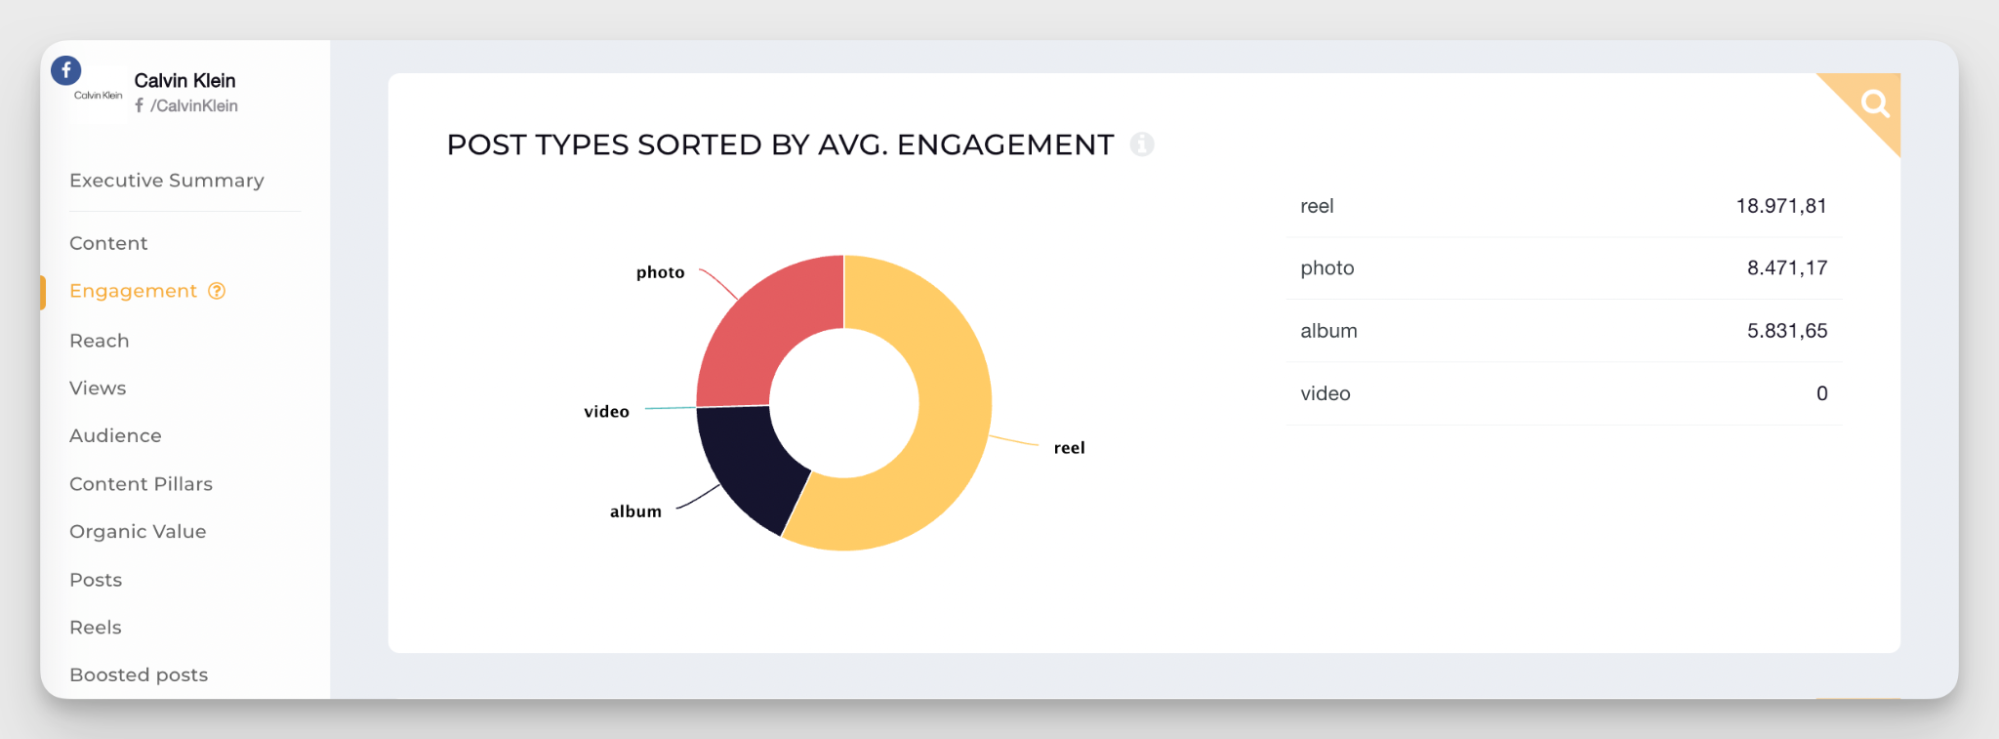
An important nuance to keep in mind is that engagement rate is just a signal, not the outcome. Looking at how different post types perform on engagement can reveal patterns, that can help you optimize your strategu and ultimately, your ROI.
Link clicks and off-platform traffic
For most businesses, Facebook’s organic value is realized outside the platform: on landing pages, in lead forms, through email signups, or via direct messages. Link clicks and the resulting sessions in GA4 are therefore among the most honest organic metrics available because they’re not measured by Meta, they’re measured by you.
The practical setup: every organic post with a link should carry clean UTM parameters (utm_source=facebook, utm_medium=social, utm_campaign=[campaign name]). This sounds basic because it is, but a surprising number of teams still have gaps here that make organic ROI impossible to trace.
Organic value
One of the most useful concepts in modern organic Facebook measurement is Organic Value: a metric developed by Socialinsider that translates organic content performance into an equivalent ad spend figure — essentially, "what would it have cost to achieve these results through paid media?"
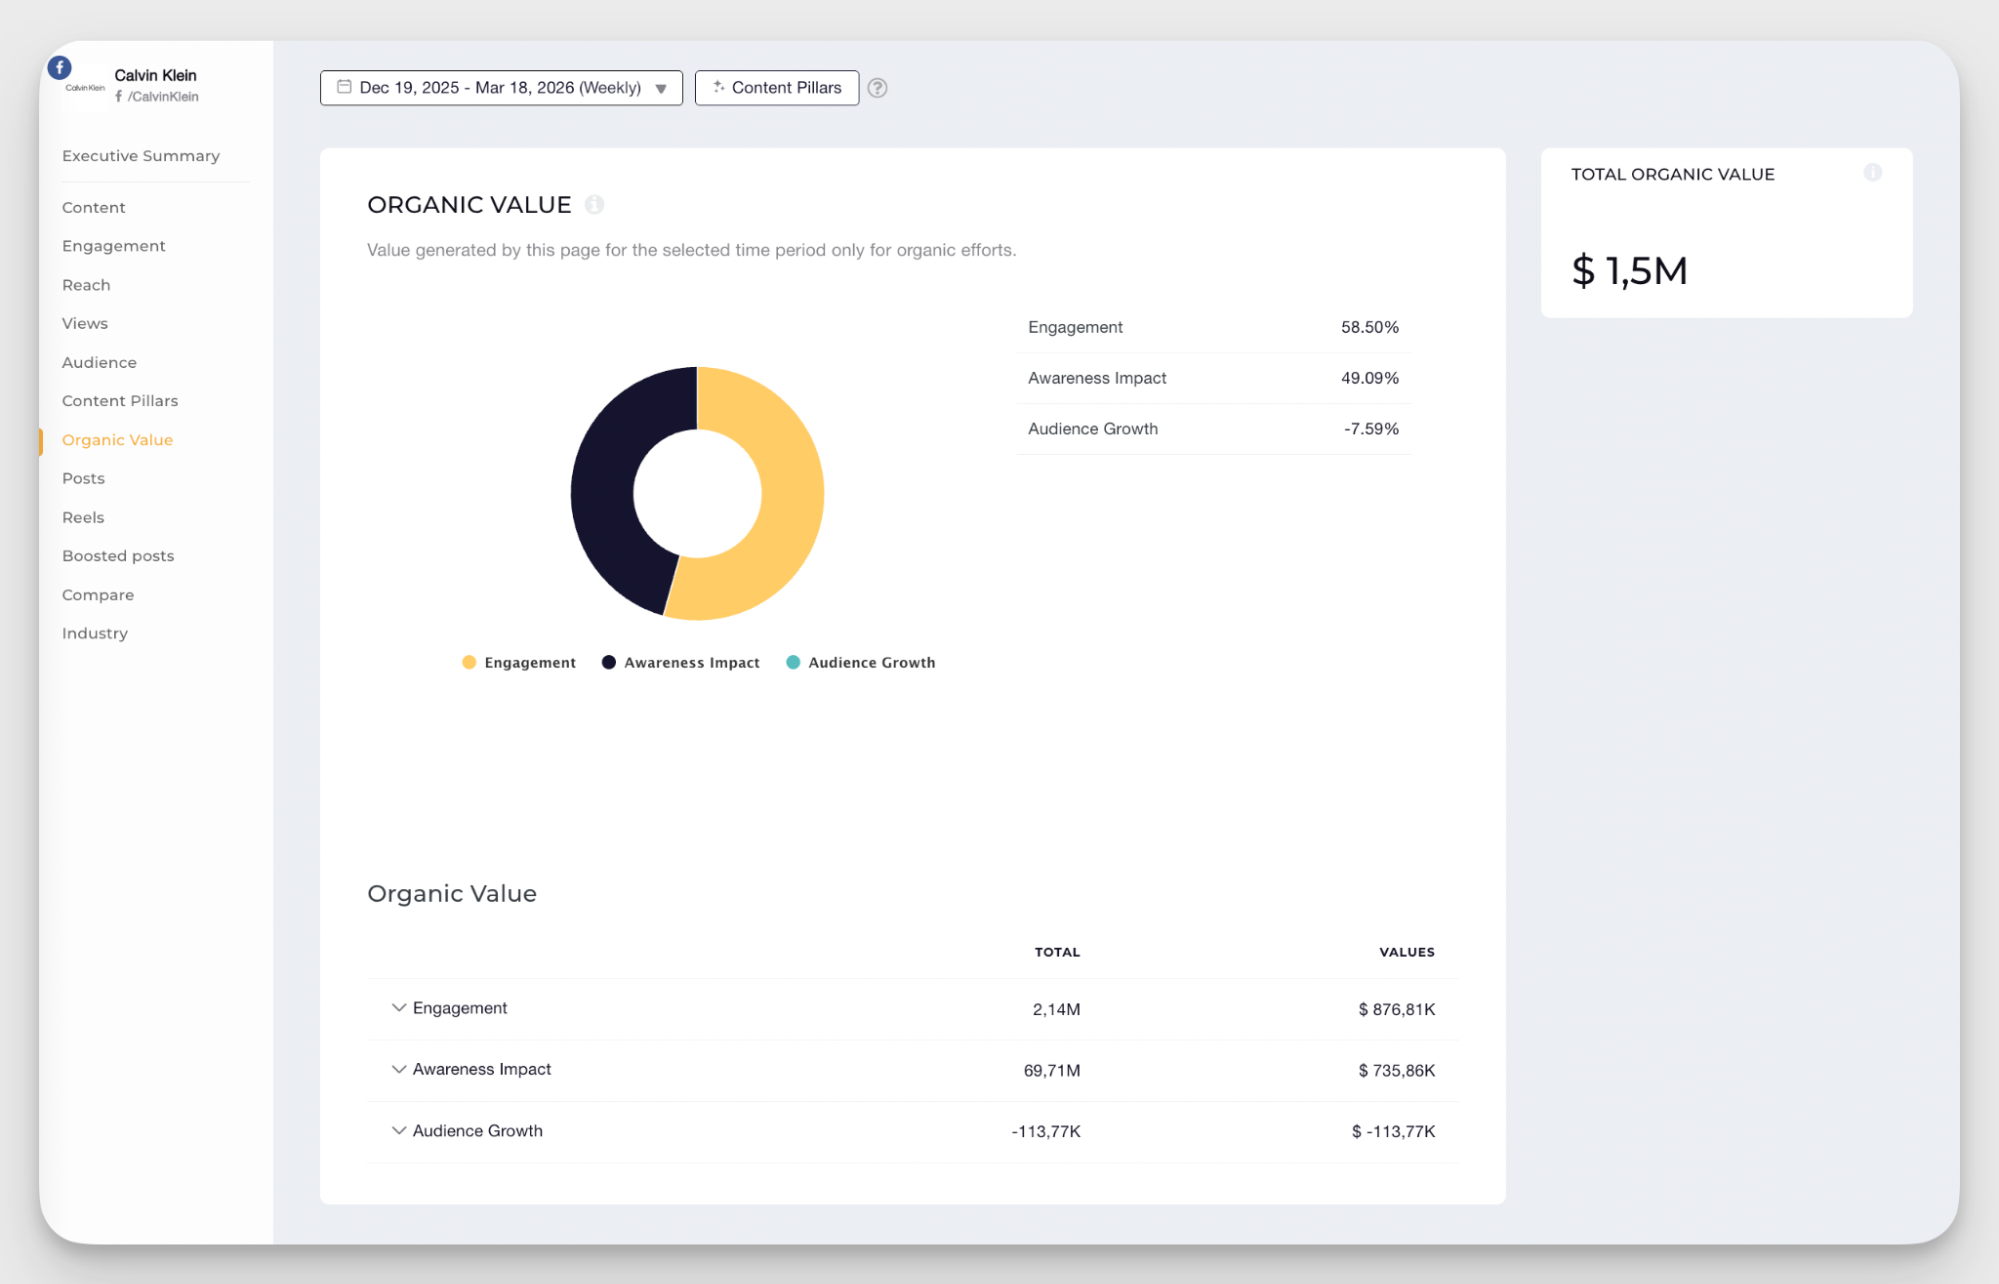
This metric solves a real executive communication problem. When a CMO or CFO asks "what is our Facebook organic content actually worth?", "3.2% engagement rate" is not an answer they can act on. "Our organic content delivered the equivalent of $42,000 in paid media value last quarter" is.
When I started using Organic Value as a reporting metric, the first thing I noticed was how it shifted the conversation with leadership. It went from “why are you posting when reach is down” to “let's talk about what this content is replacing in the ad budget.”
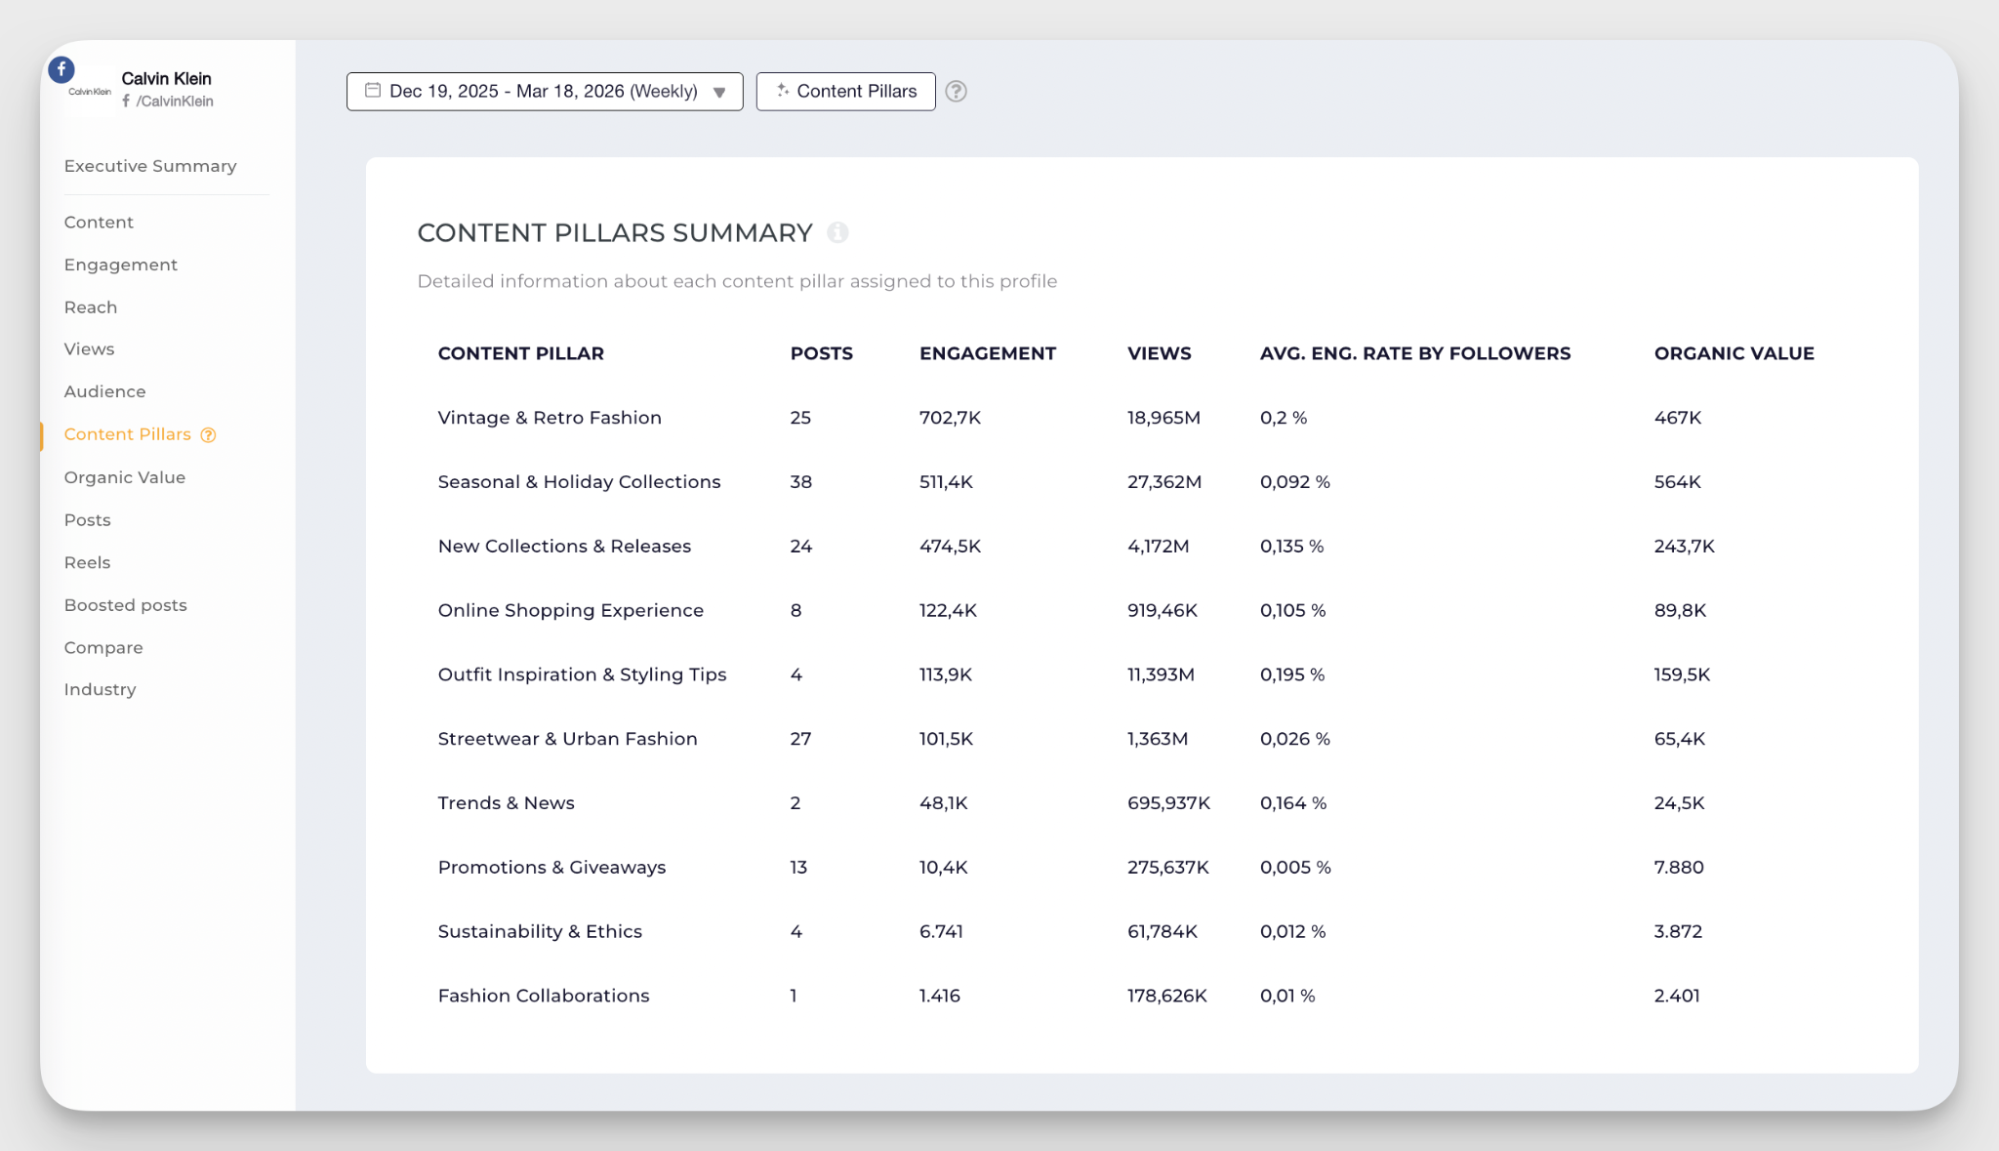
Socialinsider also surfaces AI-based content pillar analysis which shows which content pillars (educational, product-focused, community-driven, etc.) are generating the highest Organic Value. This is where organic strategy and organic ROI measurement meet: you’re not just tracking what happened, you’re learning what to do more of.
How to set up proper Facebook ROI tracking (Pixel, UTM, and CRM)
The majority of Facebook ROI problems aren’t strategy problems. They’re infrastructure problems. Teams spend weeks optimizing creative and targeting while running on an attribution setup that couldn’t pass a basic audit. Getting measurement right first is what separates confident decisions from expensive guesses.
The minimum viable tracking stack has four components working in sequence:
- Meta Pixel + Conversions API: The Pixel handles browser-side events; the CAPI handles server-side.
- Clean UTM structure: Every paid and organic post with a link should carry consistent UTM parameters. Define a naming convention and enforce it. "Facebook" and "facebook" and "FB" in the same account are three different data sources that will never reconcile in GA4.
- CRM source field discipline: Every lead that enters your CRM should carry its source campaign. Most attribution chains break here, not at the ad level, but at the handoff to sales. If reps aren’t logging sources, or if source fields aren’t mandatory, your ROI data is incomplete by design.
- GA4 assisted conversion analysis: Facebook rarely gets the last click. It often gets the first, or the third. GA4’s assisted conversion reporting shows where Facebook actually sits in real purchase journeys, which is usually more valuable than what last-click attribution assigns it. In GA4, I recommend navigating to Advertising > Attribution > Conversion paths to see Facebook's position in real purchase sequences.
Aaron Whittaker, VP of Demand Generation at Thrive Internet Marketing Agency, describes what a proper attribution rebuild looks like and why sequence matters:
Stop trusting any historical performance. If the account has no UTMs and no CRM linkage, you do not actually know what drove revenue versus what just looked good in-platform. Rebuild tracking from the ground up — UTM structure, campaign naming, CRM connection. Only then should you make decisions on budget, creative, or targeting." — Aaron Whittaker, VP of Demand Generation & Marketing, Thrive Internet Marketing Agency
One metric that quietly erodes trust in the process: Facebook’s "CTR (All)". Ashot Nanayan, Digital Marketing Expert and Founder at Digital World Institute, explains why he’s stopped relying on it:
It can inflate from low-intent clicks such as expanding images, or even accidental mobile clicks, without showing any true purchase intent. I’ve worked with campaigns that had 3–4% CTRs which generated bounce rates greater than 80% with nearly no conversions in Google Analytics. Instead, I tie landing page sessions back to CRM results — cost per qualified lead and pipeline per 1,000 sessions. That way I optimize for clicks that generate actual pipeline activity, not just curiosity."— Ashot Nanayan, Digital Marketing Expert & Founder, Digital World Institute
To this, Eric Turney, Sales/Marketing Director, The Monterey Company added:
If Meta disappeared tomorrow, I would show our CFO UTM-based lead volume, landing page conversion rates, lead-to-opportunity rate, closed revenue by source, and how Facebook traffic compares to other channels. What would be missing is the fuzzy middle — assisted conversions, delayed return visits, and people who closed through a path that no longer tied cleanly back to Facebook.
That "fuzzy middle" is worth quantifying even approximately. Rafael Sarim Oezdemir, Head of Growth at EZContacts, found that Facebook appears in 45–60% of conversion pathways in GA4 in a position other than last-click, making it far more influential than last-click attribution ever credited it. Ashot Nanayan’s own B2B funnel data tells a similar story: "Facebook only gets credit for approximately 10–15 percent of conversions, but it appears in 40–60 percent of the assisted conversion paths." That gap between credited and actual influence is exactly the problem most Facebook ROI reports leave on the table.
Facebook attribution considerations
Attribution in Facebook is not a setting you configure once. It’s an ongoing decision about what you’re willing to claim is "true."
Before presenting any Facebook ROI number to leadership, I now mentally assign it a confidence level. A Level 4–5 number gets presented with clear caveats. A Level 1–2 number I'll defend.
And the attribution window decision matters more than most teams realize. Connor Gillivan, SEO and Growth Expert at Trio SEO, describes what happened when his team stopped letting Meta default the setting:
There is a direct correlation between how you set attribution and how confident your team will be when making budgetary decisions. As long as the attribution setting does not accurately represent how customers purchase, your reports will diverge from reality. — Connor Gillivan, SEO and Growth Expert, Trio SEO
David Hunt, COO at Versys Media, went further by rebuilding attribution logic entirely outside Meta’s native options for a B2B client with a longer sales cycle:
We rebuilt our own attribution logic using UTMs, offline events, and CRM timestamps. What we learned was that Facebook was heavily undervalued on first-touch and mid-funnel influence. Leads that "closed via direct" often had a Facebook click 10 to 20 days earlier that never showed in-platform.
The non-linear buyer journey complicates attribution further. A real purchase path might look like: Facebook video ad → organic post retarget → Google branded search → direct checkout. Last-click attribution gives Google all the credit. Reality is more distributed, and Facebook’s role is understated as a result.
Executive reporting translation: how to present Facebook ROI to a CMO or CFO
The metrics that matter to a performance marketer are not the metrics that move a CFO. When you bring ROAS and CPM into a budget conversation with finance, you’re speaking a language they’ve learned to be skeptical of.
For CMOs, translate to pipeline language: How much qualified pipeline did Facebook generate this quarter? What was our cost per marketing-qualified lead (MQL) from Facebook vs. other channels? What is the estimated Organic Value of our Facebook content? CMOs think in channels and brand positioning, so show Facebook’s role in the overall acquisition mix.
For CFOs, translate to revenue language: What is the total closed revenue where Facebook was a recorded first touch? What is the LTV of customers acquired via Facebook compared to other channels? What would it cost to replace this audience reach through paid alternatives? CFOs think in dollars and defensibility, give them numbers they can verify independently of Meta.
The most persuasive Facebook ROI presentation a CFO ever sees is a simple one: a cohort of customers acquired via Facebook (verified through UTM + CRM), their total revenue over 12 months, divided by what you spent on Facebook during their acquisition period. That's a number no one can argue with because it came from your own systems, not Meta's dashboard. For CMOs, the number I lead with is channel contribution to pipeline which is Facebook's share of MQLs, compared to spend share. That ratio tells a story about efficiency that resonates with CMOs thinking about channel mix.
Tools to help with Facebook ROI measurement
The right tool stack depends on your budget, sales cycle, and how sophisticated your attribution needs to be. Here is a good starting point:
Helpful Facebook ROI benchmarks
Benchmarks have a bad reputation in marketing, sometimes deservedly so when presented as universal truths. A “good” Facebook ROAS for a DTC apparel brand is meaningless for a B2B SaaS company generating enterprise demo requests. The industry-level data below is drawn from Triple Whale, Trendtrack, and AgencyAnalytics 2025–2026 benchmark reports. Use it as a calibration tool, not a scorecard.
One framing check before diving in: ROAS without margin context is trivia. A luxury brand at 2.5x ROAS with 80% margins is profitable. A dropshipper at 2.5x ROAS with 15% margins is slowly losing money. Always crosscheck benchmark ROAS against your own unit economics.
Paid benchmarks by industry
Global ROAS averages are almost useless without industry context, and here's what I mean. The cross-industry median sits around 1.19x, but a Finance brand running at 1.5x is underperforming, while a Retail brand at the same number may be doing fine. The data below shows why.
If you're presenting Facebook ROI to leadership for the first time, the Finance/Insurance row is the one to bookmark because it demonstrates that high CPCs can still be justified when LTV is high. If you're in B2B, I advise highlighting the note about CRM attribution understating pipeline value.
Barbara Robinson, Marketing Manager at WeatherSolve Structures, tracked a benchmark comparison that reframed her entire Facebook ROI conversation:
Facebook leads closed at roughly 18.4% compared to 34.7% from organic search which makes the ROAS comparison become a completely different conversation. — Barbara Robinson, Marketing Manager, WeatherSolve Structures
That point cuts to the heart of why cross-industry ROAS benchmarks can mislead. A campaign with 3x ROAS on leads closing at 18% is less valuable than a channel with lower volume and 35% close rates, especially at higher ticket sizes. The benchmark table tells you what the platform delivers. Your CRM tells you what it is worth.
Organic benchmarks
For organic Facebook ROI, industry-segmented data is essential as opposed to global averages. Socialinsider’s Facebook benchmark tool lets you compare engagement rate, reach per post, and content format performance against your specific industry category.
For a deeper look at metrics CMOs actually care about: top 5 metrics every CMO actually cares about in social reporting.
Benchmarking against competitors
One of the most underused ROI practices is using competitor signals to calibrate your own performance. Not to copy strategy, but to understand whether your inputs are keeping up with the outputs of those in your category.
I check conversion velocity, ad frequency trends, and comment sentiment depth. My data tells me if my funnel converts, but it doesn't show how fast the market expects decisions to happen, or how often messaging needs to refresh. — Matt Bowman, CEO/Founder, Thrive Local
Aimen Hallou, CTO at Floxy, focuses on incremental lift testing, branded search changes, and CRM-revenue-by-cohorts to distinguish demand generation from demand capture:
Many times, brands realize that between 20 and 35 percent of performance is just demand capture rather than demand generation. Facebook marketing performance in 2026 cannot be measured in platform reports anymore.
Final thoughts
Facebook ROI measurement is hard because the platform has a vested interest in making its own results look good, because attribution is genuinely complicated in a multi-touch world, and because most teams inherited a measurement setup that was never built to answer the questions leadership is now asking.
None of that is your fault. But it is your problem to solve.
The path forward is better infrastructure, sharper questions, and the discipline to treat your CRM and GA4 as sources of truth, with Ads Manager as a useful but not final input. Layer in Socialinsider’s organic benchmarking and Organic Value data to give your organic efforts the same quantitative rigour your paid campaigns receive.
Next time someone asks if Facebook is actually working, you'll have an answer that didn't come from Ads Manager alone. You'll have UTM-verified leads in your CRM, assisted-conversion paths in GA4, and Organic Value data that translates what organic content actually costs in paid-media terms. That's a conversation worth having.
Nsikak Tim
B2B content marketer with 9 years in marketing and 6 years in content writing. I focus on sharp, insight-driven content that doesn’t sound like it was approved by five stakeholders and a legal team.
Know what your competitors do — before your manager asks
Get instant social benchmarks & reports without manual work.