How to Interpret Social Media Analytics: A Guide Filled with Experts’ Tips
Learn how to interpret social media analytics to boost your marketing efforts and achieve your goals. Explore this guide for actionable insights.

Do you ever open your social media analytics and think, “Okay… but what does all this actually mean?”
Every metric, be it engagement rate, impressions, or follower count, tells part of a story. But the real insights come when you connect those numbers and see the bigger picture.
To unpack how to do that and improve your social media marketing strategy, I reached out to Haley Rivet, social media operations and analytics manager at Slack.
Let’s break down her insights in this social media analytics guide.
Key takeaways
- Monitor essential analytics like growth trends, engagement rate, audience insights, content performance, and conversions to understand and improve your social strategy.
- Avoid common mistakes such as chasing vanity metrics, overlooking qualitative feedback, and ignoring platform-specific differences in how metrics are defined and interpreted.
- As expert insights emphasize, always interpret metrics in context—connect reach and impressions with engagement rates, and combine numbers with qualitative analysis for a full picture.
What is social media analytics?
Social media analytics is the process of gathering, measuring, and analyzing your social media data and metrics to understand your social media performance.
It helps answer questions like:
- Who’s engaging with your content?
- When are your followers most active?
- Which posts drive real results: clicks, sign-ups, or sales?
- How do your social efforts tie back to business goals?
Why is it essential to track and monitor social media analytics
Whether you want to increase followers or engagement, you cannot do so without understanding your analytics.
Here are five reasons why analyzing social media is a must.
- Prove ROI and build credibility with top management: Management wants to know how social media impacts bottom-line goals. This could be increasing sales or brand awareness. Monitoring social media helps prove ROI by linking performance metrics to business goals, showing how engagement, reach, and conversions drive real outcomes.
- Understand audience shift: Are customers moving to video? Are they engaging more with posts that ask questions? By analyzing metrics, you can understand audience preferences.
Haley touched on this during our conversation, explaining how by digging into analytics, her team uncovered a trend they might have completely missed otherwise.
As we know, social media algorithms are constantly changing and pushing different features and asset types. For the longest time, I feel like everyone was telling social media managers that video is king and that all channels were always optimizing for video. But recently, I’ve noticed that hasn’t always been the case
For example, over the summer on LinkedIn, carousels were a top-performing asset type in terms of engagement, and polls were performing best in terms of impressions. That really made me pause and rethink what stories we tell through video and what we could instead show through a carousel or ask through a poll. Are there opportunities for posts that use single graphics, like event invites, that we could turn into carousels? Those are the kinds of questions I’m asking myself as I keep optimizing with data and adapting to how audience preferences shift.
- Improve content strategy: By understanding audience preferences and the types of content styles and themes that work, you can allocate your resources to the right type of content.
- Make better use of your paid budget: Which kind of ads bring more conversions? What’s your cost per click? Looking at these metrics, you can build ads that will bring the best results.
- Know where you stand amongst the competition: What is your engagement rate as compared to competitors? What kind of content pillars are they using? Understanding how others in your industry perform helps you spot gaps, identify opportunities, and refine your own strategy to stand out in the feed.
Types of social media analytics you need to monitor
The social media analytics you track should always align with your goals. Ask yourself, “What are we actually trying to achieve on social?”
At Socialinsider, we group these metrics into a few key categories that help us measure performance more strategically.
Growth analytics
Growth analytics on social media show how your reach is expanding over time, revealing the effectiveness of your content and brand visibility efforts.
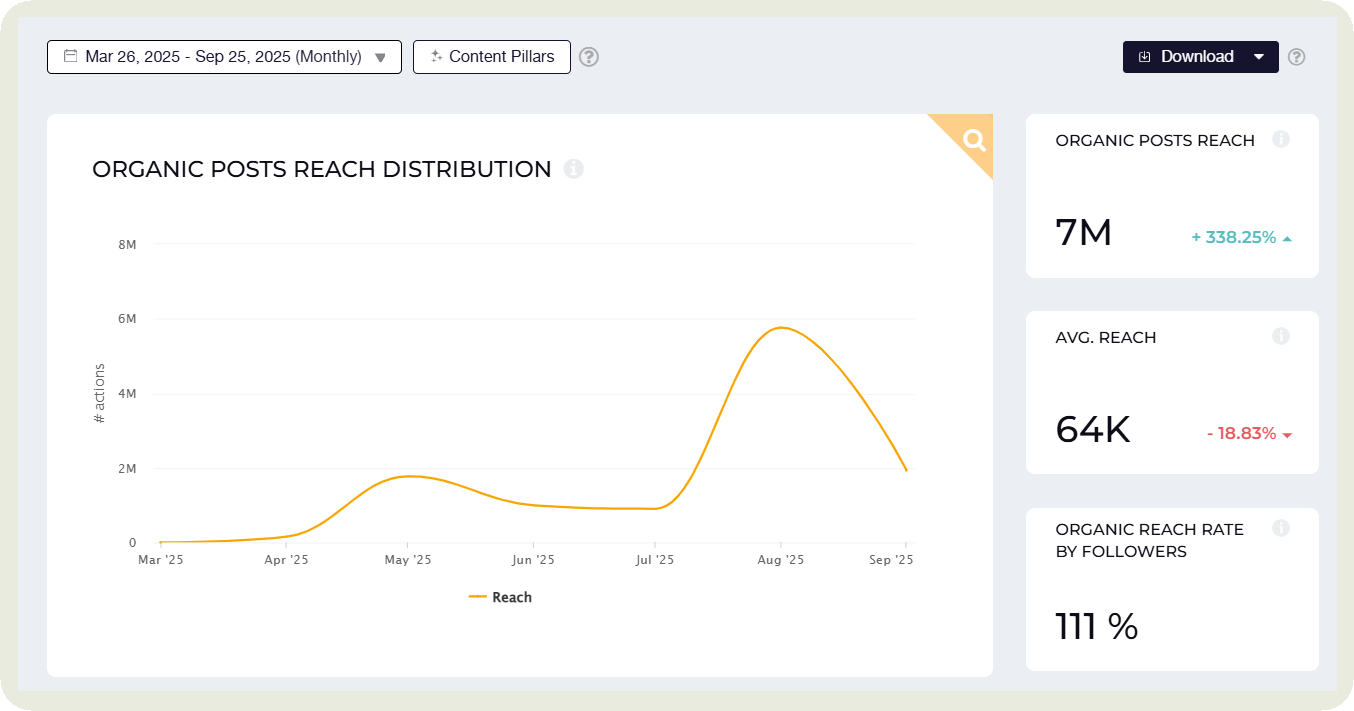
- Reach trend: This shows how many unique users are actually seeing your content over time, revealing whether your visibility is growing or fading.
To analyze it, I look for consistent upward movement, sudden drops after algorithm changes, or spikes tied to specific campaigns or content types.
I head to Socialinsider and click on the sudden drops or spikes to see which posts caused it.
Haley mentions not taking metrics like reach and impressions at face value. She recommends connecting it to metrics like engagement rate.
She said:
I feel reach and metrics like impressions are great. They show that a lot of people are seeing your content. But we always want to make sure our content is reaching the right people, the ones who are actually interested in learning more and engaging with it.
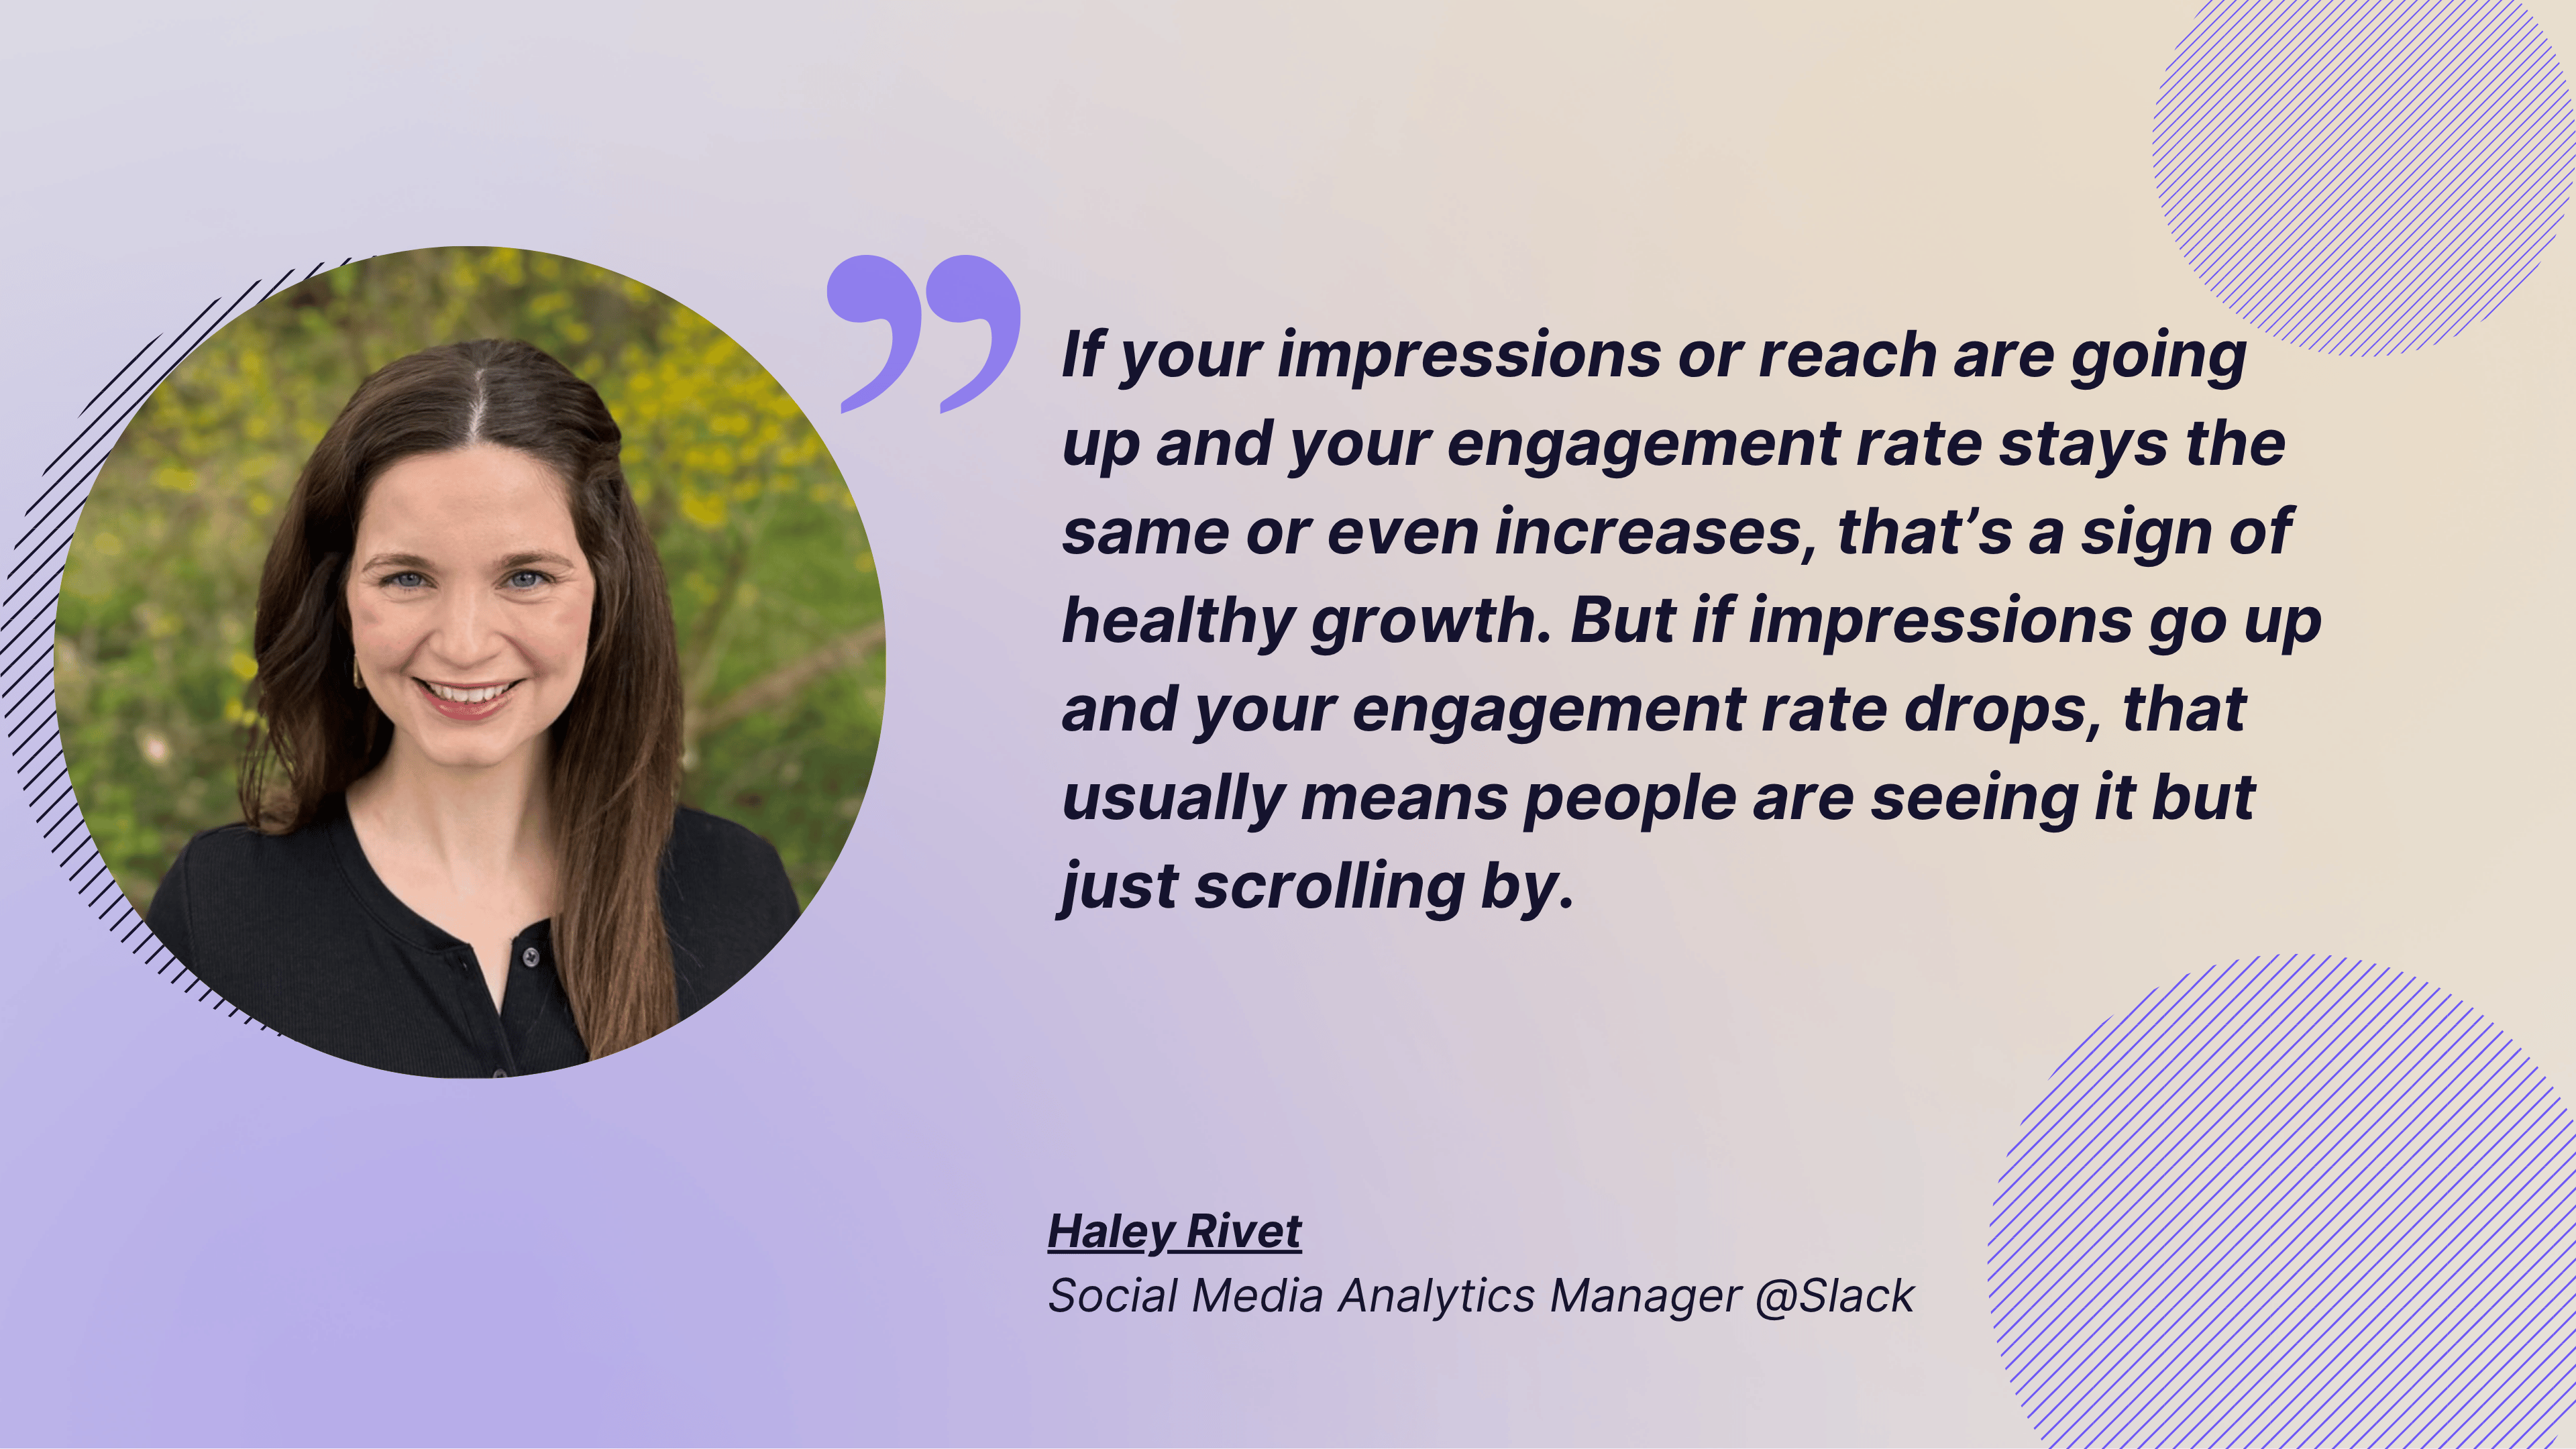
If your impressions or reach are going up and your engagement rate stays the same or even increases, that’s a sign of healthy growth. It means that while more people are seeing your content, the percentage who are interacting with it is steady or improving, so you’re reaching the right audience. But if impressions go up and your engagement rate drops, that usually means people are seeing it but just scrolling by.
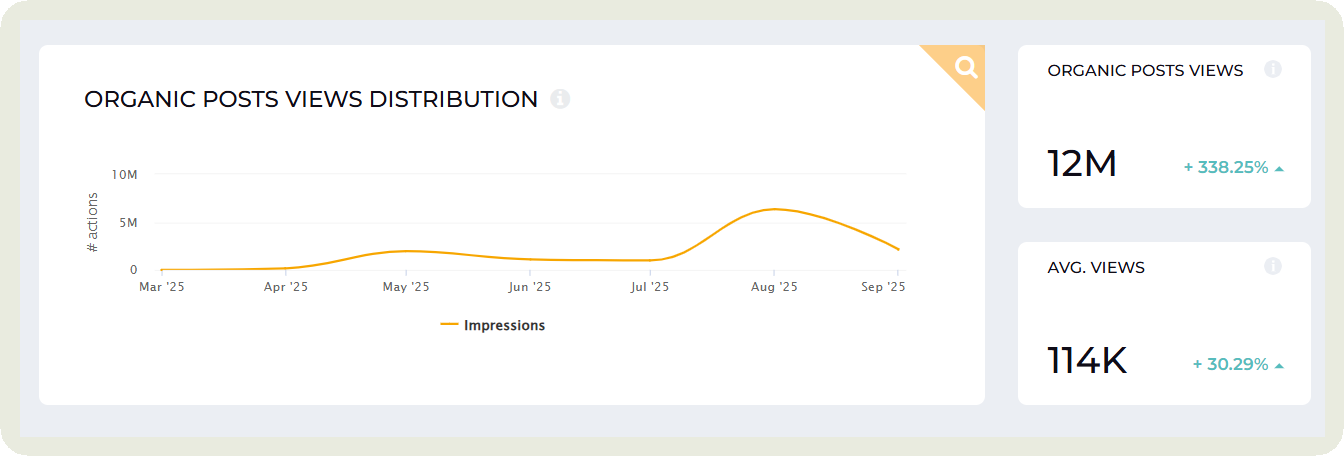
- Views trend: This shows how often people are watching your videos. It’s a clear indicator of how engaging your content really is.
To analyze it, track whether views are rising with new formats, dipping after content changes, or peaking around certain topics or posting times.
Engagement analytics
Want to see what your audience finds meaningful enough to like, comment, share, save, and click? Engagement analytics help get this data.
- Total engagement: Total engagement shows the overall number of interactions (likes, comments, shares, and clicks) your content receives.
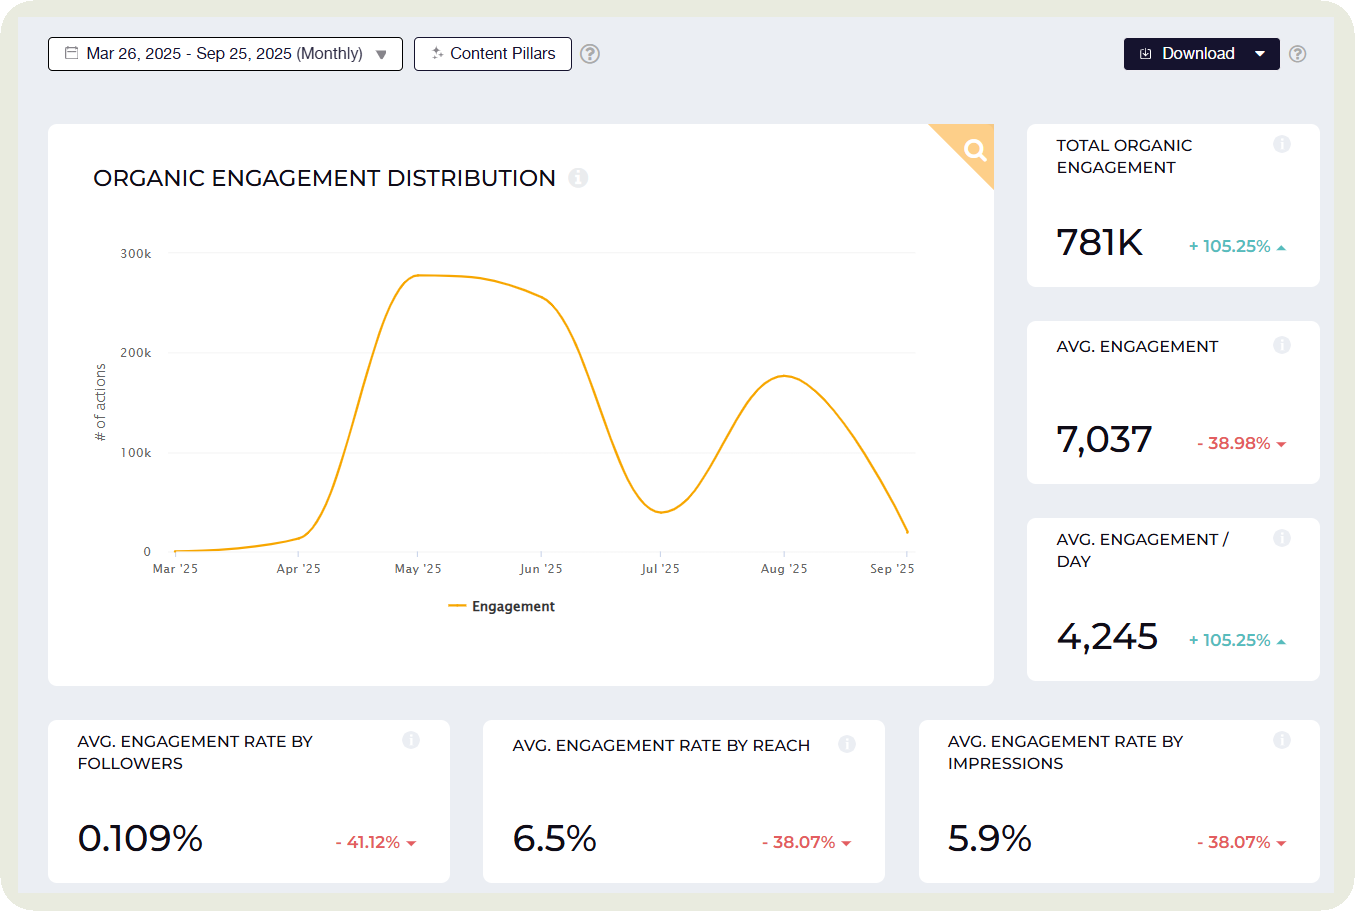
I always look for steady growth in total engagement. It signals wider interest in my content and profile.
- Engagement rate by followers and reach: Engagement rate by reach shows how engaging your content is to the people who actually saw it, while engagement rate by followers measures how your overall audience interacts with your posts.
When comparing performance to competitors, it’s best to use engagement rate by followers so you’re comparing apples to apples.
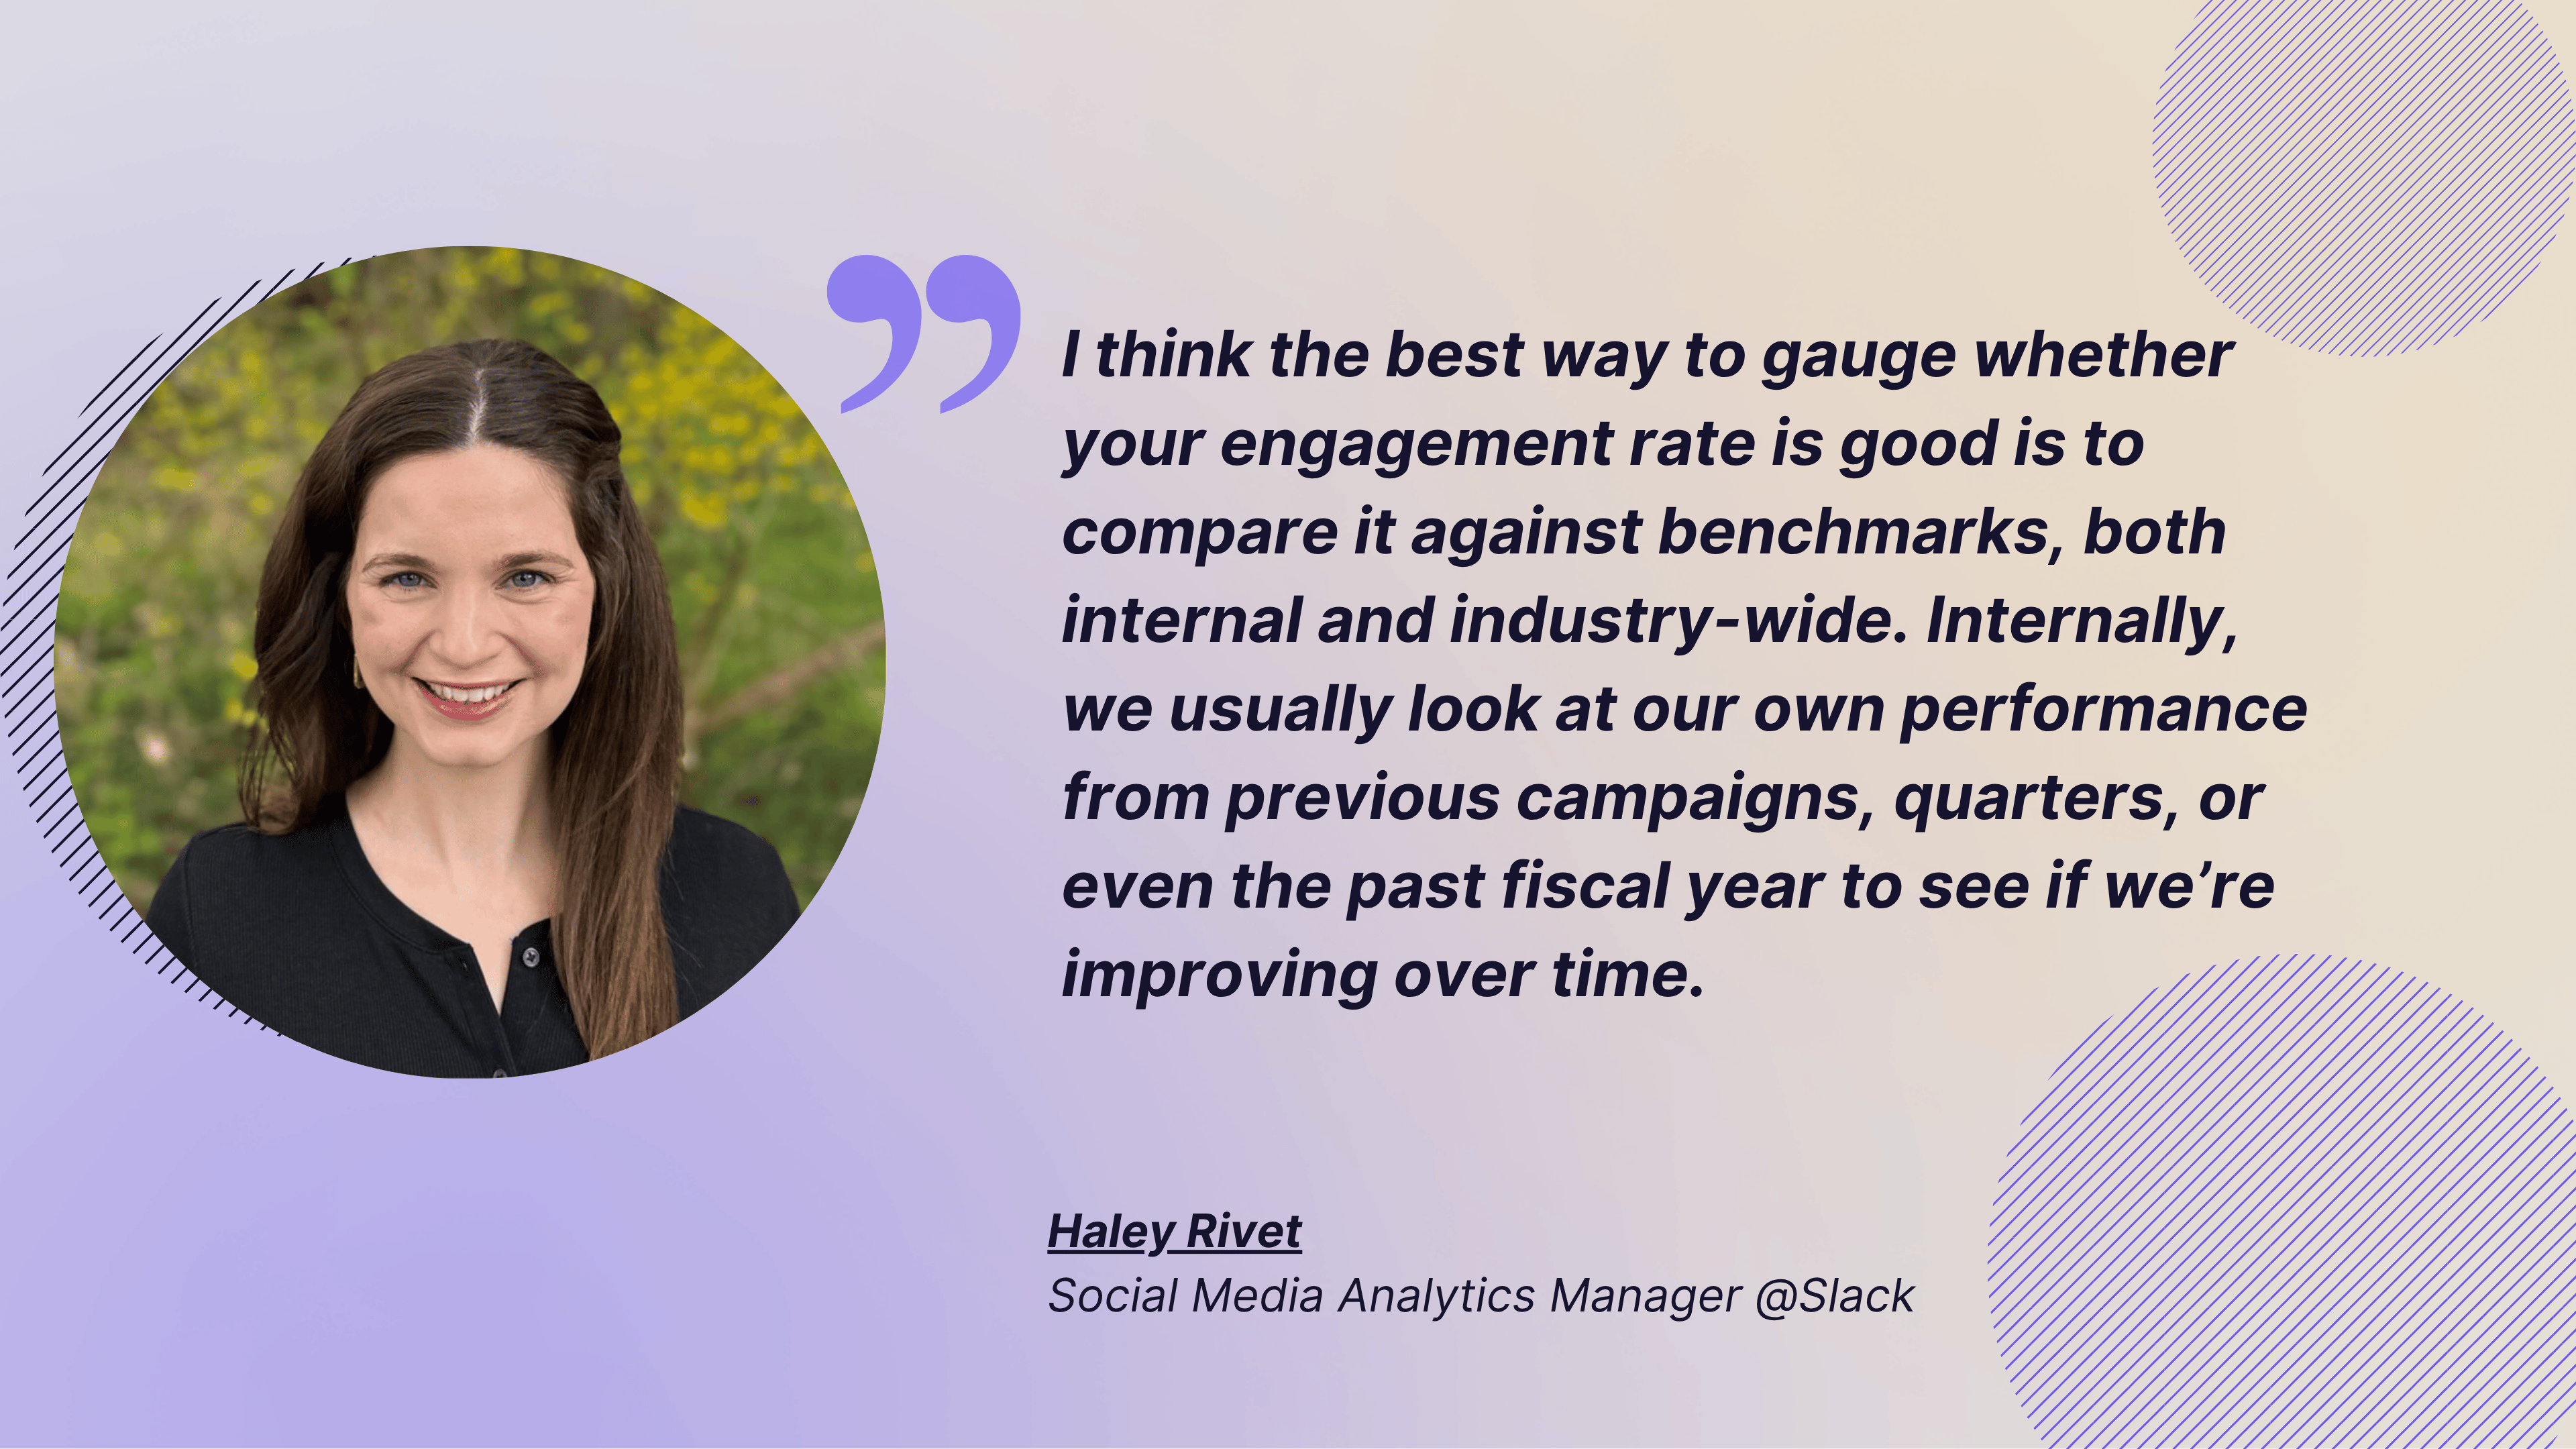
Haley talked about how she qualifies Slack’s engagement rate —
I think the best way to gauge whether your engagement rate is good is to compare it against benchmarks, both internal and industry-wide. Internally, we usually look at our own performance from previous campaigns, quarters, or even the past fiscal year to see if we’re improving over time.
Externally, we’ll look at industry benchmarks to understand what others are seeing, especially since there have been some pretty big shifts in the LinkedIn algorithm over the last nine months. For specific campaigns or events, we’ll also compare their performance to the previous year’s results to see what’s changed and where we’ve grown.
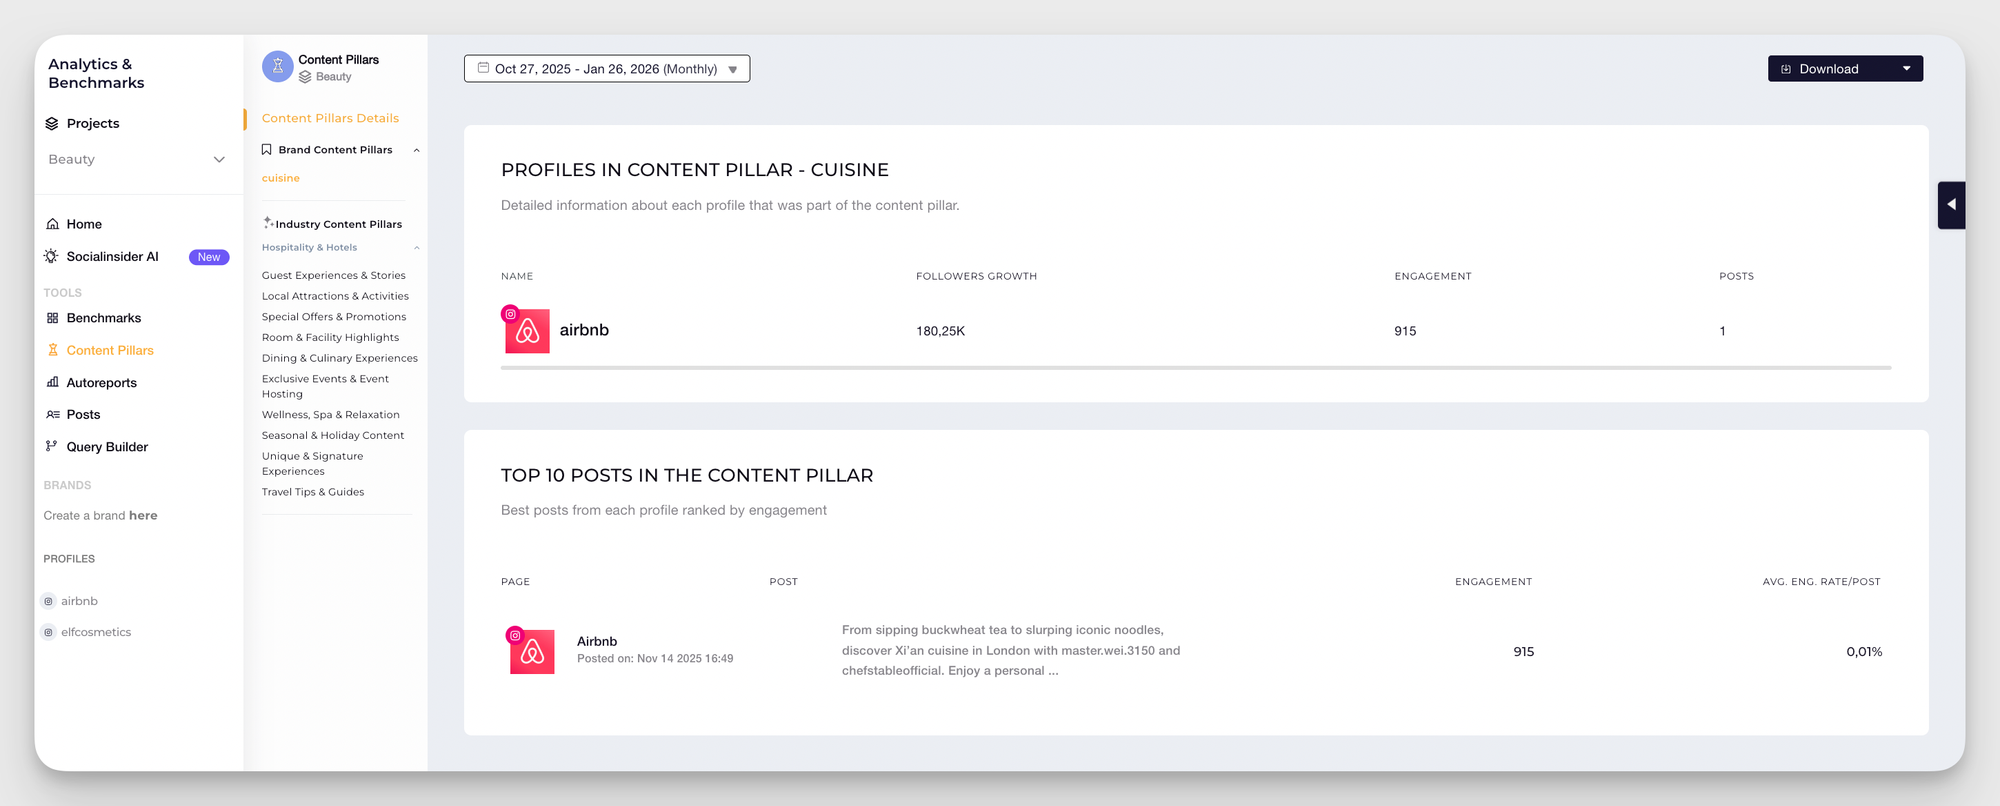
- Best-performing content pillars: They show which topics, themes, or content types resonate most with your audience and drive the strongest engagement.
I use Socialinsider to avoid manual categorization and get AI-generated content pillar analysis showing engagement rates for each pillar.
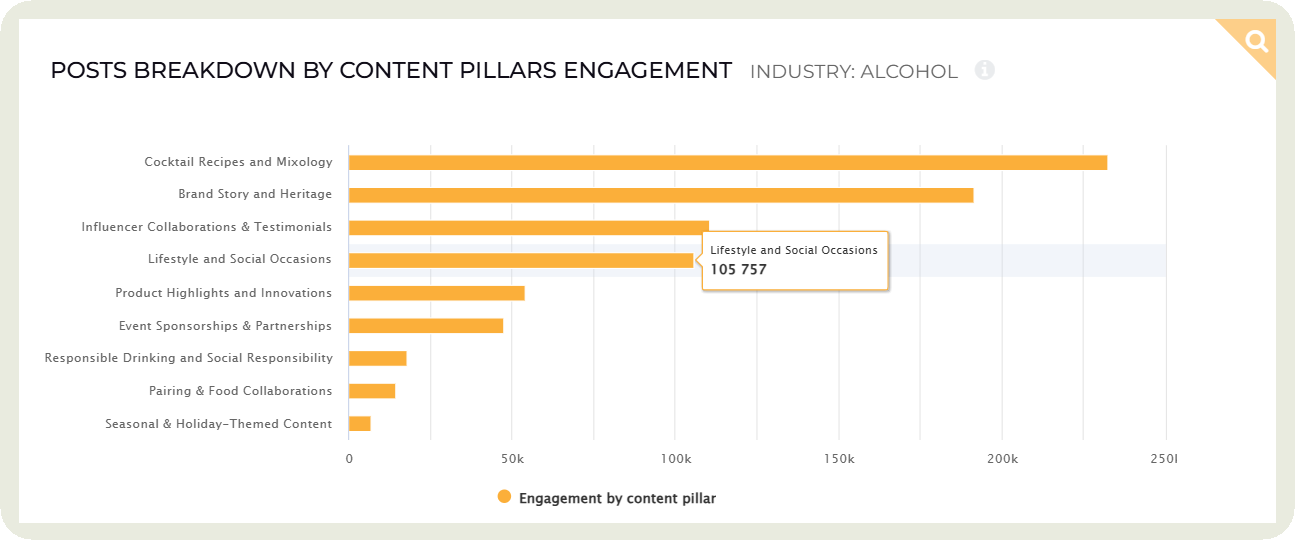
To interpret this analytics, I look at which content pillars consistently outperform others. These represent the themes your audience connects with most. If a pillar shows strong engagement and steady growth, it’s worth doubling down on similar content.
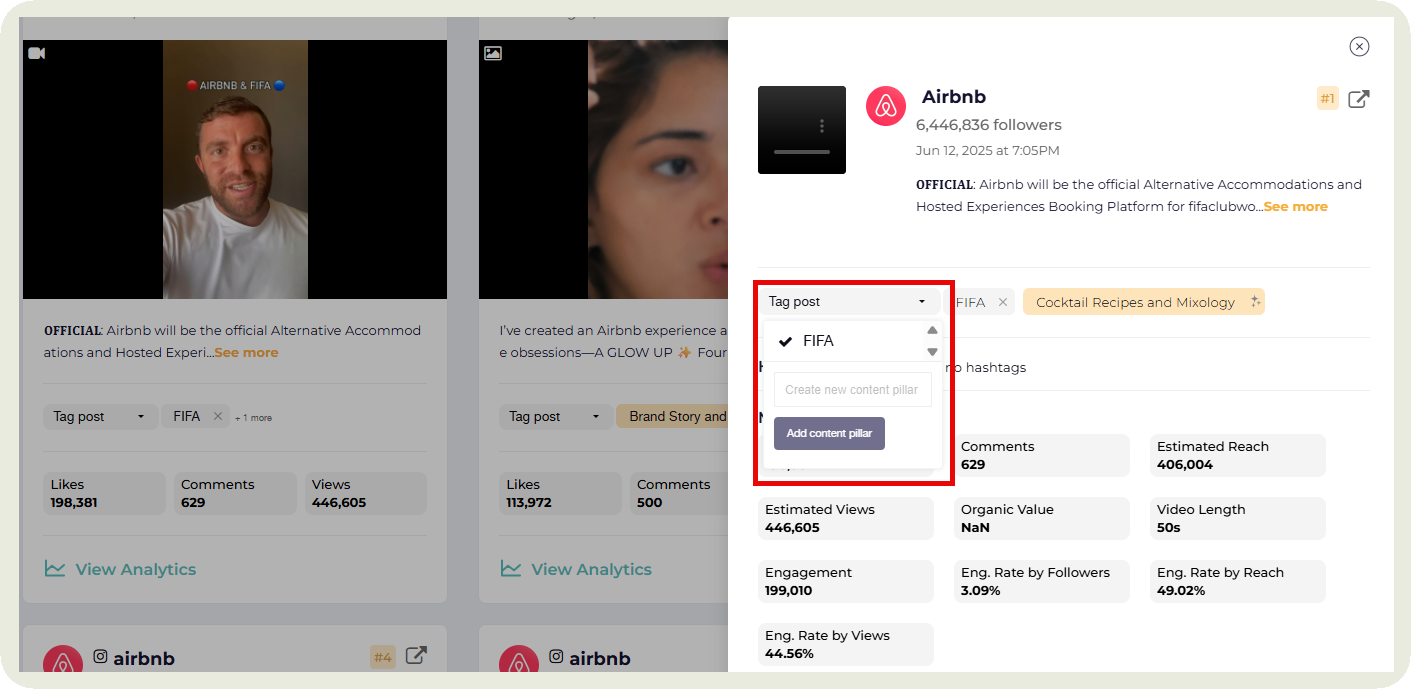
Additionally, Socialinsider’s Query Builder enhances this process by allowing me to create and segment branded content pillars with just a few clicks.
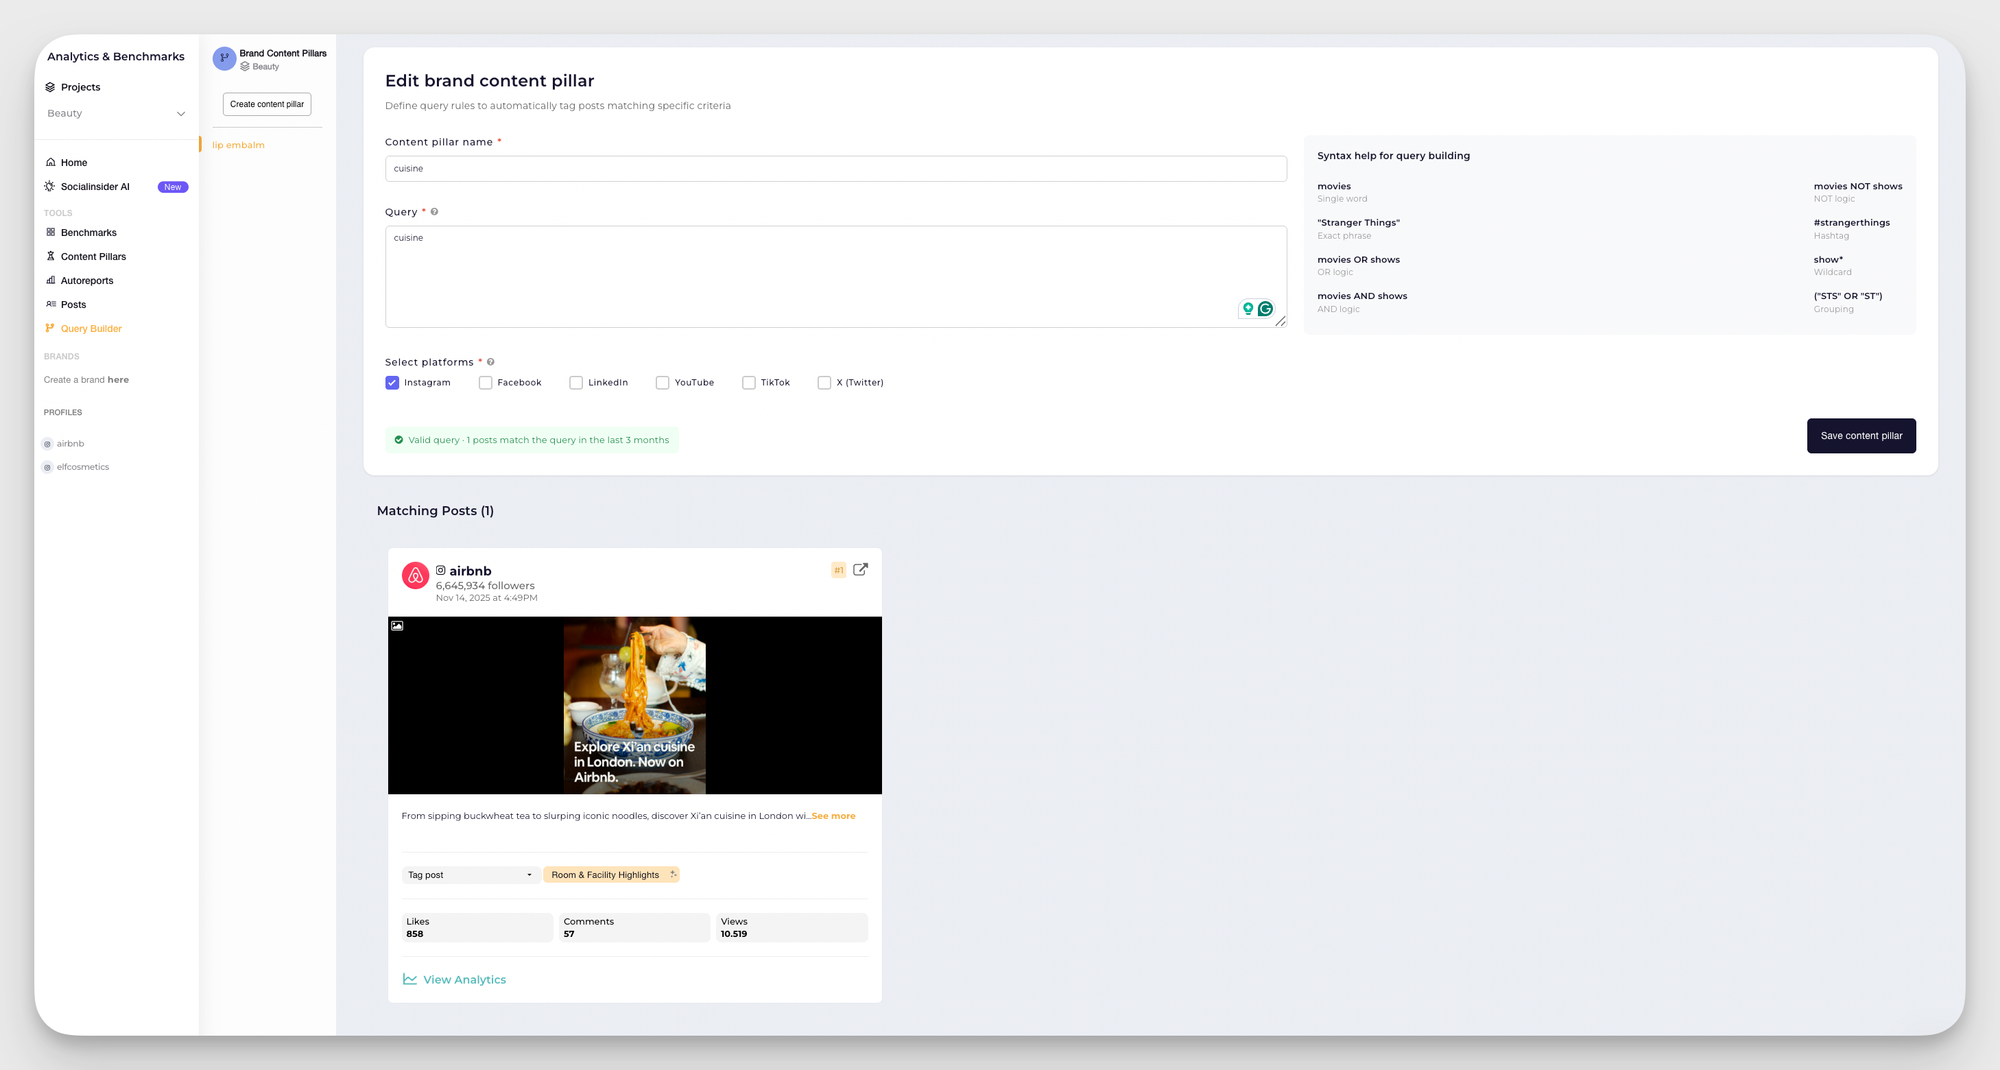
By filtering, grouping, and tracking performance data by custom themes across any platform, I can build a tailored pillar strategy that maximizes engagement and aligns with my brand’s goals.
Here’s how Haley came across an interesting insight when she ran content pillar analysis:
Our audience is interested in our news and updates, especially people who actively use Slack. So we make sure to follow that closely and share timely information.
It’s also really important to look back at past posts and identify trends. For example, we noticed that posts related to job search information and open roles performed really well. The job-seeking audience on LinkedIn is super active, so that insight helped us realize that ‘career and recruiting’ could be a strong content pillar for us.
Moving forward, we’re planning to create more posts around that theme, like advice from Slack recruiters and career-related insights, because we know that’s the kind of content our audience finds valuable.
- Likes and comments: Likes reflect instant appreciation. They show that your content caught attention, while comments reveal deeper engagement and spark conversations.
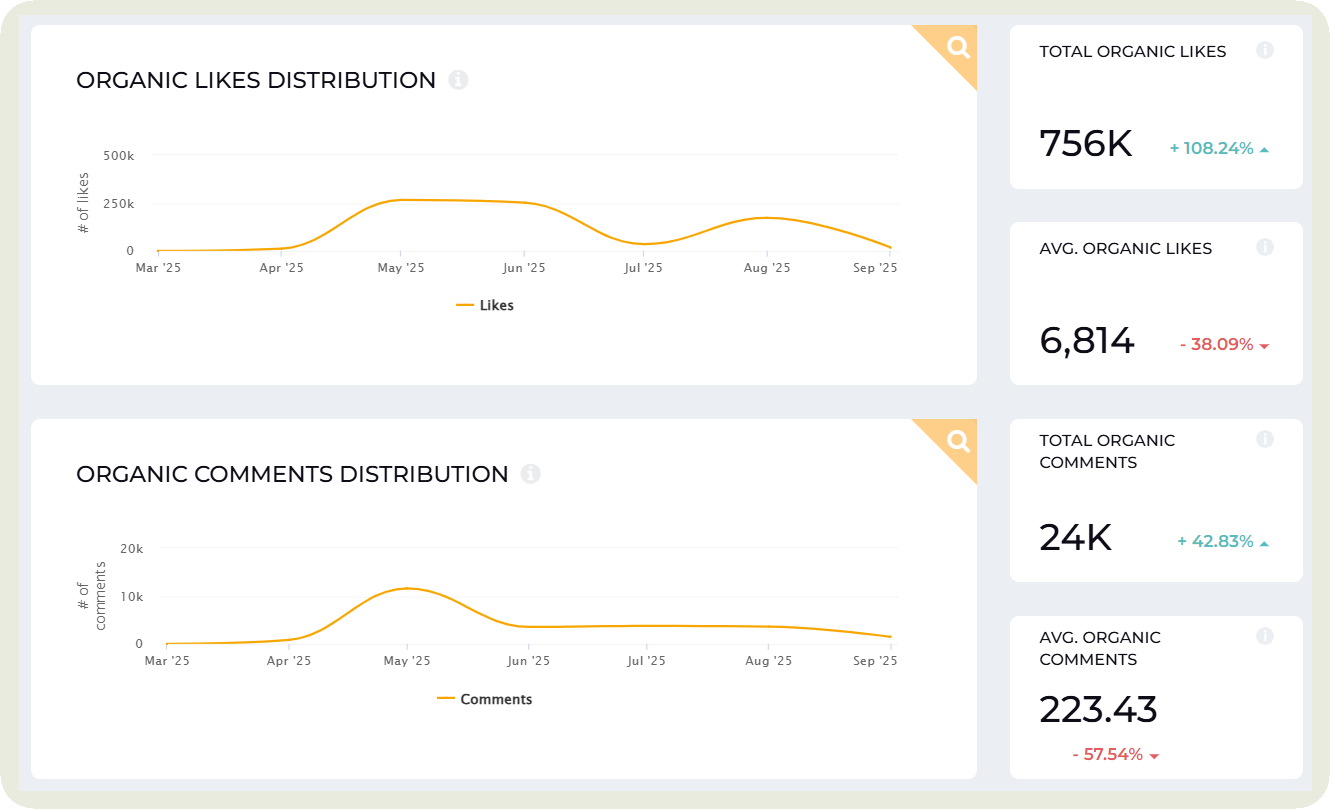
Instead of just looking at these counts, I go deep and track which topics, tones, or formats drive the most meaningful interactions. Maybe carousels bring the highest likes or questions in captions drive the highest comments.
I also recommend combining this metric with follower growth rate to see whether your engagement is coming from your existing audience or attracting new people. If both rise together, it’s a strong signal that your content is resonating and expanding your community.
- Best time to post by engagement: It shows when your audience is most active and likely to interact with your content, helping you time your posts for maximum visibility and response.
Socialinsider takes your previous content and timings into consideration to give you data on when you should ideally post.
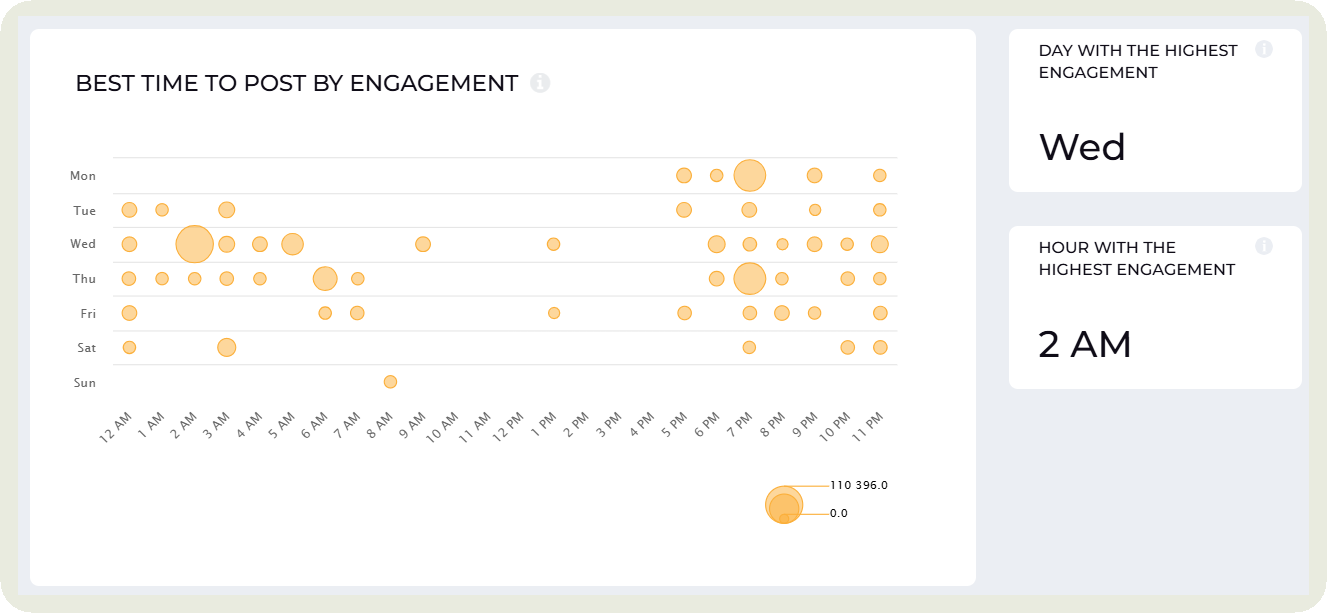
You can use these patterns to plan your posting schedule for higher reach and interaction.
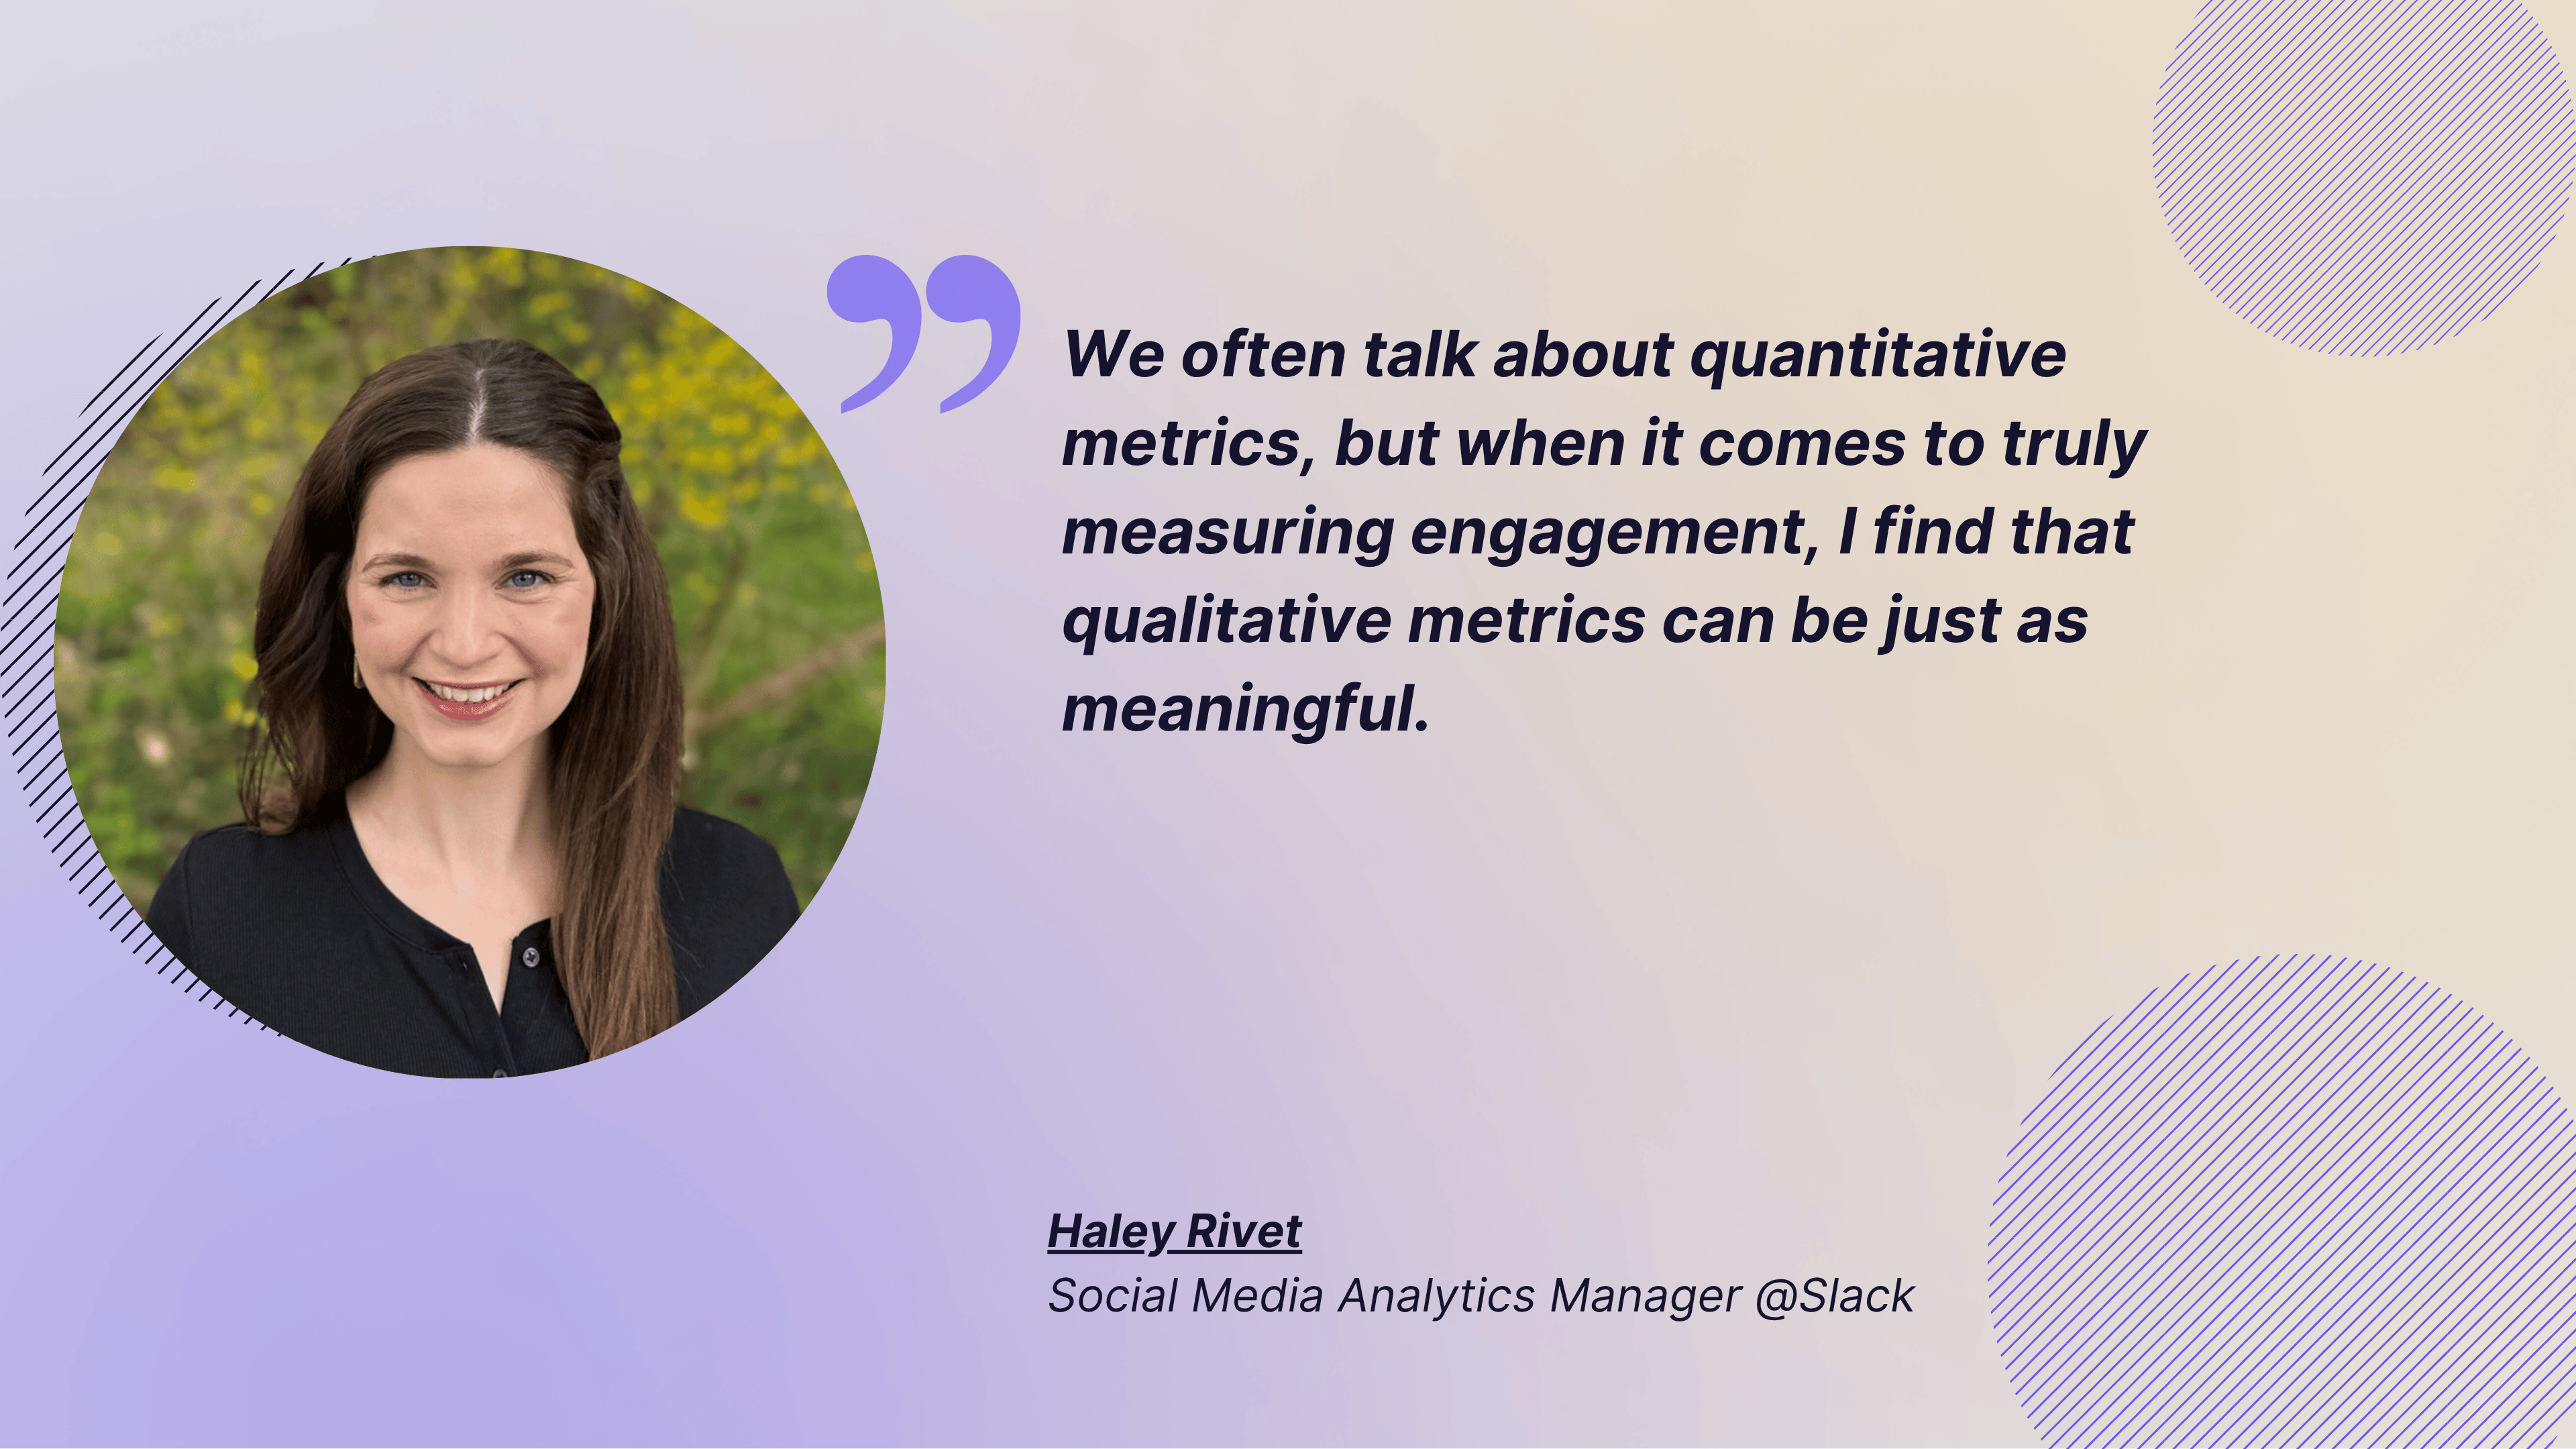
- Qualitative engagement: What kind of comments are people leaving on your posts? Are they mentioning your brand often?
Haley prioritizes measuring qualitative engagement as much as looking for a good engagement rate. She says —
I think having a high level of engagement is always great, and of course, maintaining a healthy engagement rate is super important. We often talk about quantitative metrics, but when it comes to truly measuring engagement, I find that qualitative metrics can be just as meaningful. Things like: what are people saying about your brand in the comments? Are you fostering a community where people actually want to interact in the replies and keep coming back?
One insight I’ve found over time is that posts asking followers a simple, low-effort question, something they don’t have to think too hard about, tend to perform really well. That’s one reason why polls are such a powerful tool. And beyond that, we always want to make sure we’re providing our followers with value. They tell us what’s valuable to them through their engagement, whether that’s sharing industry news, offering education and tips, or creating a sense of community.
Audience analytics
Ever wonder why your content sometimes falls flat? The issue might not be your posts. It might be that you don’t truly know your audience.
Audience analytics help you fix that. They reveal who your followers are, their interests, habits, and behaviors, so you can stop guessing and start creating content that actually connects.
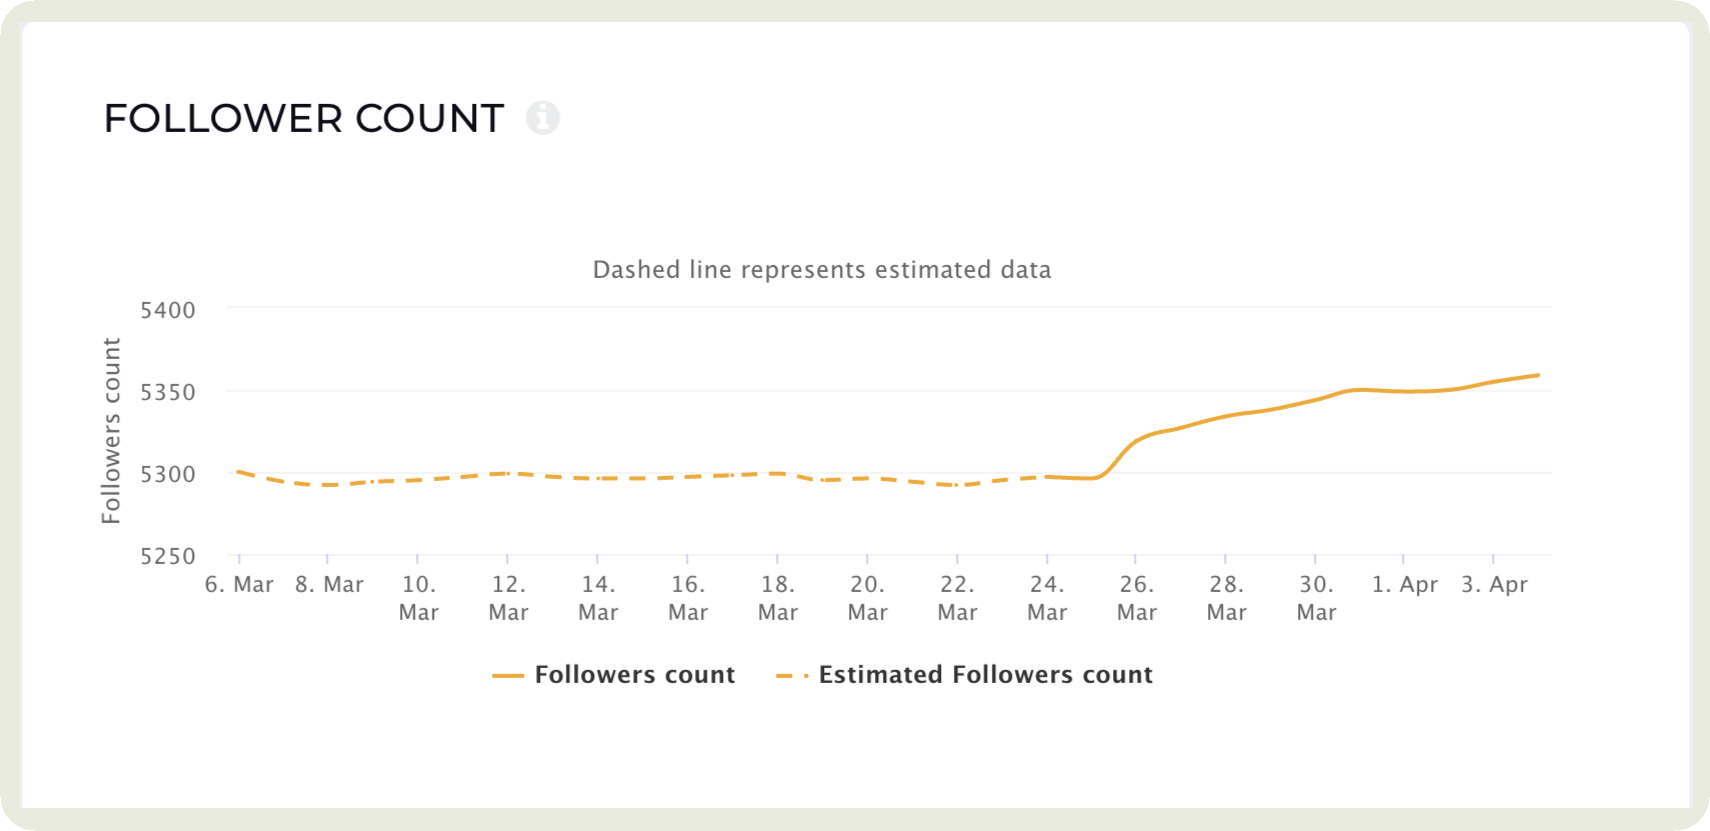
- Follower growth:This metric shows how your audience is expanding (or shrinking) over time. It’s a clear indicator of how well your content and brand are attracting new people.
To analyze it, watch for steady upward trends and sudden spikes tied to campaigns or posts. Dig deep into what you can replicate or avoid moving forward.
With Socialinsider, you can even track historical follower growth data to see how your audience evolved even before you started using the tool.
- Demographics: Check your demographics data in native analytics or social media analytics tools like Socialinsider. Two things you need to analyze: (i) Does it match our target audience? and (ii) Are new audience segments emerging that you didn’t intentionally target but are engaging with your content?
If you notice an entirely new audience segment forming, but your business isn’t built to serve them, it’s a clear sign your content strategy needs a complete revamp.
- Audience sentiment: It reveals how people feel about your brand. It shows whether their reactions and mentions are positive, negative, or neutral.
To analyze it, I track sentiment trends over time, look for emotional shifts after campaigns or announcements, and dig into comments to understand context.
For example, if sentiment turns negative after a new product launch, check the comments to find common complaints and address them in your next update.
In our conversation, Haley mentioned that tracking audience sentiment is a key focus for Slack. Here’s how they do it —
At a high level, we look at audience sentiment through our social share of voice, which we pull from overall mentions across channels, as well as forums, online news, and blogs, using social listening software. From there, we analyze the breakdown of positive, negative, and neutral mentions to get a sense of how people are feeling about the brand.
We also monitor sentiment more directly through our social inbox. Whenever someone tags Slack in a post, we try to reply, though of course, given the volume, we can’t always get to everything.
And for posts where Slack is mentioned but not tagged, we use internal workflows to collect those mentions and craft responses. It helps us stay connected to what people are saying about us and how they feel about the brand.
Content performance analysis
How well is your content strategy performing? Do you need to tweak your content themes? Or change storytelling techniques?
We’ll get these answers by analyzing the data below.
- Top and bottom-performing content: They highlight what’s working and what’s not in your content strategy by showing which posts drive the most (and least) engagement, reach, or conversions.
For example, when I get the top posts in Socialinsider, I look for common patterns. Are they from the same pillar? Have we used the same tone? Or is it because of an engaging storytelling format?
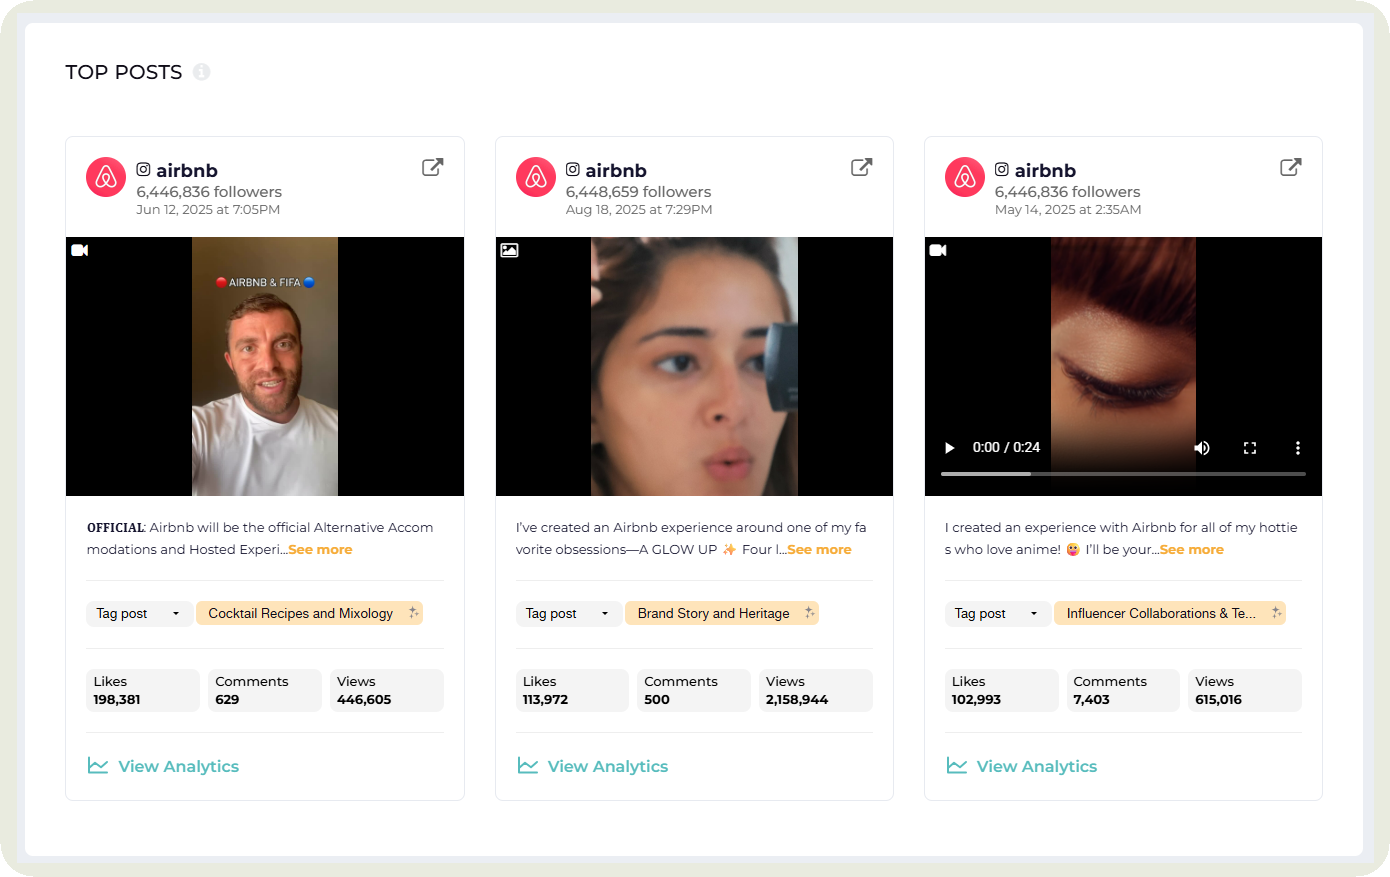
I analyze the same for the bottom-performing content. But I specifically look for what I can improve next for these posts instead of completely removing them from the content mix.
- Campaign-specific content analysis: Campaigns take up a lot of resource investment, be it money or time. In order to evaluate how they perform, I tag these posts in Socialinsider.
Haley talked about how she then evaluates the campaign with similar ones, either those focused on the same topic or the same event from previous years.
She says these comparable benchmarks are key for giving stakeholders clear, concrete context on how a campaign performed.
But what if you can’t compare them to previous campaigns? She has a workaround for that as well:
When there are major algorithm changes, comparing to a campaign from a year ago isn’t always useful, so in those cases, we look at overall averages or similar posts from more recent months. We also track the user journey from social media to our website, which helps us see how each campaign contributes to driving deeper engagement and conversions.
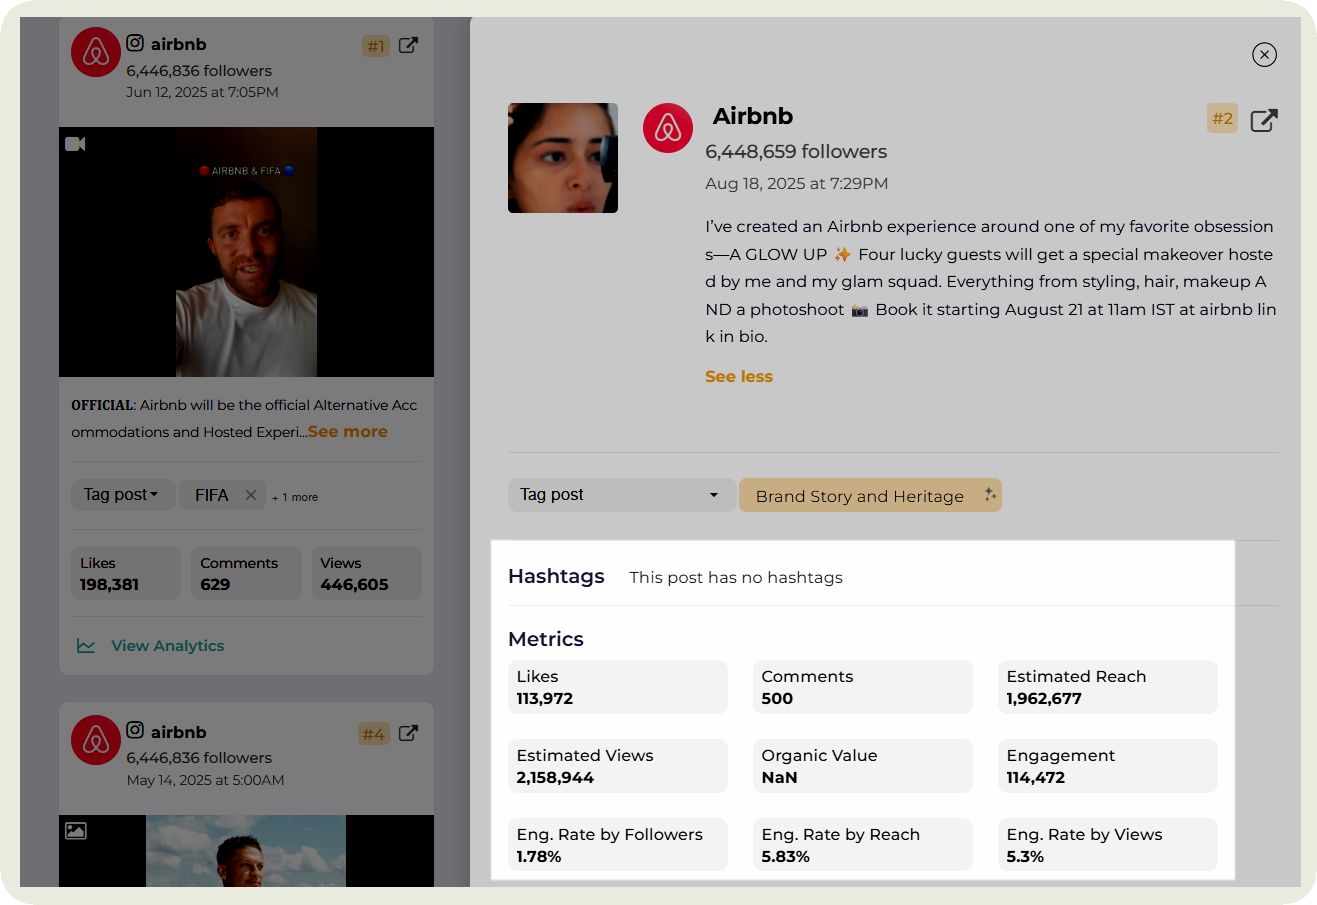
- Organic value: This shows the estimated monetary value generated by your organic social media efforts during a particular period.
In Socialinsider, I can get this value by defining what monetary worth each action — like clicks, comments, or shares — should have across platforms.
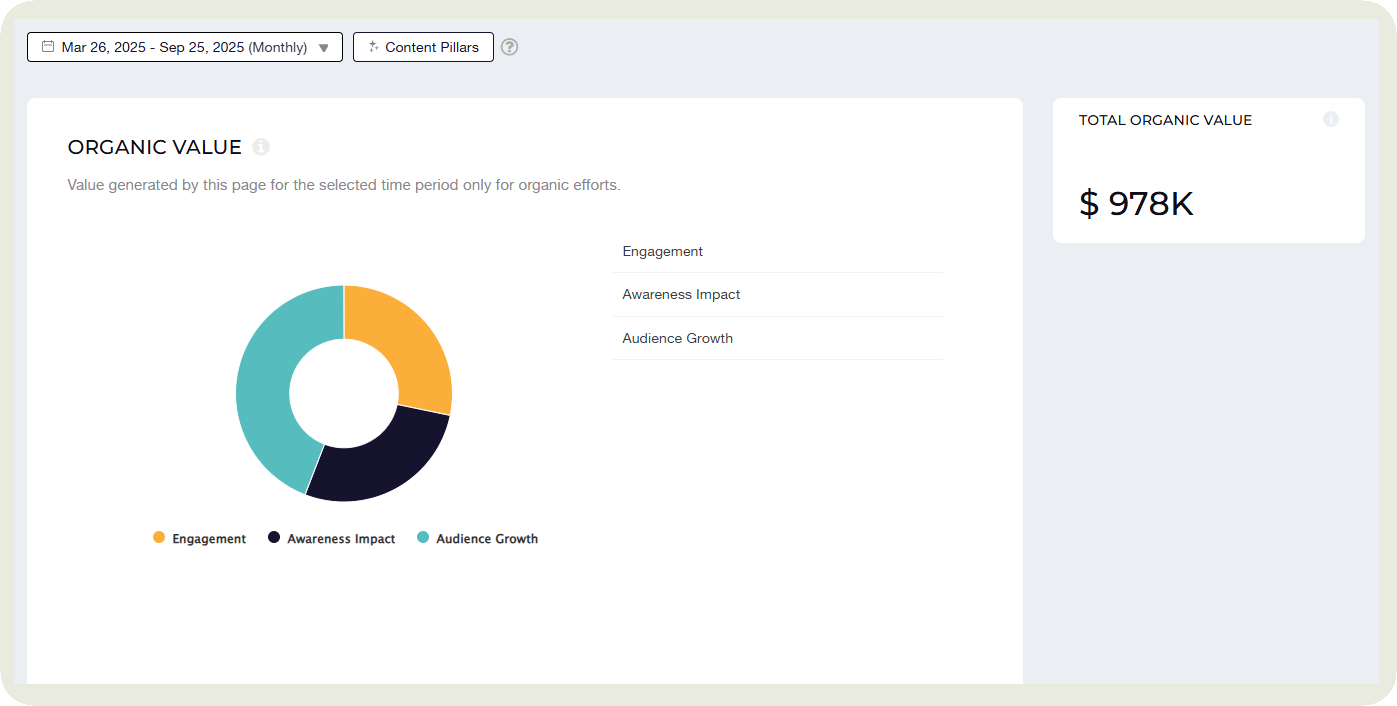
I usually end up comparing it with paid media spend or campaign ROI to understand how much value organic content is driving on its own
- Individual content analysis: See what results different posts got in a specific time period. Check which formats, captions, or visuals drove the highest engagement, reach, or views.
Video-specific metrics
- Average view duration: It shows how long viewers actually stick around to watch your video. This is a clear indicator of how engaging and attention-grabbing your content is.
To analyze it, I look for drop-off points to see where interest fades and compare it with metrics like total views and completion rate.
For example, if views are high but average watch time is short, my hook might need work. If both are strong, I’ve nailed the content and pacing.
- Total/average watch time: It reveals how much time people spend watching your videos overall and on average.
Make sure you track whether people are watching longer as you test new formats or hooks.
- Completion rate: It measures the percentage of viewers who watched your video all the way to the end.
Look at which themes and formats drive the highest completion rates. For example, you may notice that Reels with a little suspense factor keep viewers hooked till the end. You can experiment with these findings and get more people to complete your videos.
- Retention graph: It visualizes how viewers watch your video over time, highlighting exactly where they stay engaged and where they drop off.
To analyze it, look for sharp dips to identify weak points or slow intros, and steady lines to spot strong storytelling.
I also like to compare it with metrics like completion rate and average watch time. For example, if your retention graph stays flat while completion rate rises, your content is successfully keeping viewers hooked from start to finish.
Conversion analytics
How are your social media efforts impacting bottom-line metrics like sales and revenue?
Conversion analytics for social media are a way of seeing if your campaigns and content are getting people to visit your website and making purchases.
- Click-through rate: It measures how many people saw your post and were interested enough to click on it. These actions could include reading more, visiting your site, or signing up for something.
One way to analyze this is by looking at which posts or CTAs drive the highest CTR and test different formats, captions, or link placements.
To get a full picture, compare it with impressions and conversions. For example, a post with high reach but low CTR means people saw it but didn’t feel compelled to act. It’s a signal you may need a stronger hook or clearer value proposition.
- Sessions from social: This metric reveals how many visits to your website originate from social media. The best part about this metric is it shows how well your posts drive traffic beyond the platform.
I generally use Google Analytics to get this data.
Compare it with other Google Analytics metrics like average session duration, bounce rate, and pages per session.
For example, if social sessions are high but bounce rate is too, your content may attract clicks but fail to hold interest, signaling a need for better landing page alignment.
- Sales attributed to social: How many purchases result from social media? This metric proves the real business impact of your content, especially if you’re running campaigns to drive sales.
Competitive analysis
Competitive analytics on social media show how your brand’s performance stacks up against competitors, revealing gaps, opportunities, and trends you can capitalize on.
- Competitor profile metrics: What is their follower growth rate? What engagement are they getting? Are they using the same content pillars as yours? If so, is the engagement similar?
I deep-dive into all these questions with Socialinsider. It gives me all the competitor metrics I need to see my brand’s performance compared to others in my industry.
I recommend finalizing competitor analysis goals before you get started. This will help you narrow down the metrics that will give you relevant insights.
- Competitive benchmarking: Once you have done an individual competitor analysis, you can compare your performance against all the competitors on your list.
In Socialinsider, it’s as simple as adding all these profiles to your project and heading over to the Benchmarks tab.
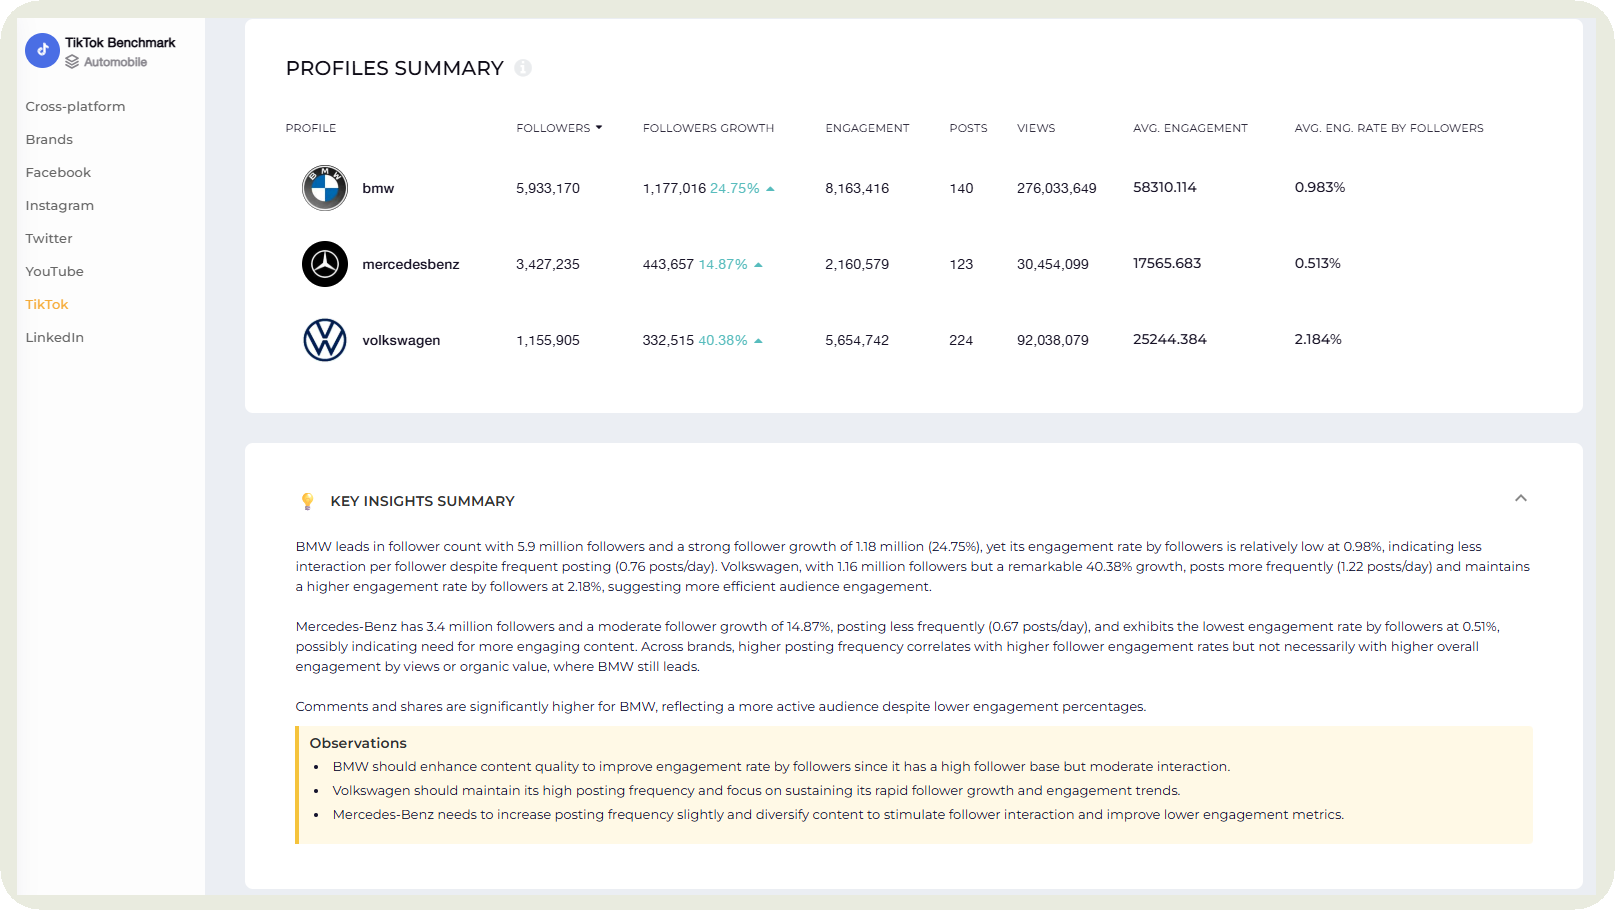
You can see a side-by-side comparison of various metrics and an overall social media analysis of what you can improve through the ‘Key Insights Summary’.
- Qualitative comparison: How is their brand sentiment? What kind of words does the audience often associate with the brand? What kind of comments do they get? How do they respond to comments?
Haley focuses on qualitative comparison as she says it gives her unique social media insights.
We look at social share of voice pulled from overall mentions of Slack and its competitors across social channels, forums, online news, and blogs. We also analyze the positive, negative, and neutral breakdown of each brand’s share of voice to understand overall sentiment.
While that data is definitely valuable, we tend to focus more on what our own audience is telling us, through their comments, feedback, and the posts where they tag us, rather than getting too caught up in what our competitors are doing.
Paid social analytics
Do you run a lot of ad campaigns on social? Here are the metrics you can track to see whether it’s giving you the desired ROI.
- Number of clicks: It reveals how many people were intrigued enough by your ads to take action and click.
When you analyze, look at which campaigns, creatives, or audiences drive the most clicks and the lowest cost per click.
- Click-through rate (CTR): This metric reveals the percentage of people who clicked the ad compared to the number of people who saw it (impressions).
The higher the CTR, the more your ad is resonating. It means your message is relevant, your creative is compelling, and your audience is genuinely interested in what you’re offering.
- Cost per click (CPC): CPC tells you how much you’re paying each time someone clicks on your ad.
If your CPC is too high, you may want to figure out what’s driving up the cost. Maybe your targeting is too broad, your ad relevance score is low, or your creative isn’t resonating.
Test new audiences, refresh your visuals or copy, and refine your bidding strategy to reduce costs while maintaining quality traffic.
- Cost per engagement: This metric reveals how much you’re paying for each interaction, like a click, comment, or share, giving insight into how efficiently your ads spark social media engagement.
You can compare it with CPC, CTR, and engagement rate. For example, if CPE is high but CTR is low, your ad may need stronger visuals or messaging to prompt action.
- Conversion rate: It measures the percentage of people who took a desired action, like signing up, purchasing, or downloading, after clicking your ad
To analyze it, compare conversion rates across platforms, audiences, and creatives to see what drives the most valuable actions.
- Total ad spend: It represents the total amount you’ve invested in paid campaigns over a given period.
To analyze it, track how spend aligns with performance outcomes like clicks, conversions, or revenue to gauge efficiency.
How to create a social media analytics report
Want to present your findings to the upper management or your clients? Here’s a step-by-step process on how to build a social media report.
- Define a goal: What’s the purpose of this social media analytics report? Is it to show ROI to leadership? Or to show content performance and suggest changes to ongoing strategy?
The goal will pave the path for metrics selection and overall reporting.
- Choose the right reporting period: Depending on your goal, determine how often to conduct social media strategy analysis and report the data to your clients and management.
- Select the metrics that matter: You may be tempted to include all the metrics on which you have data, but stakeholders generally want a quick overview of performance.
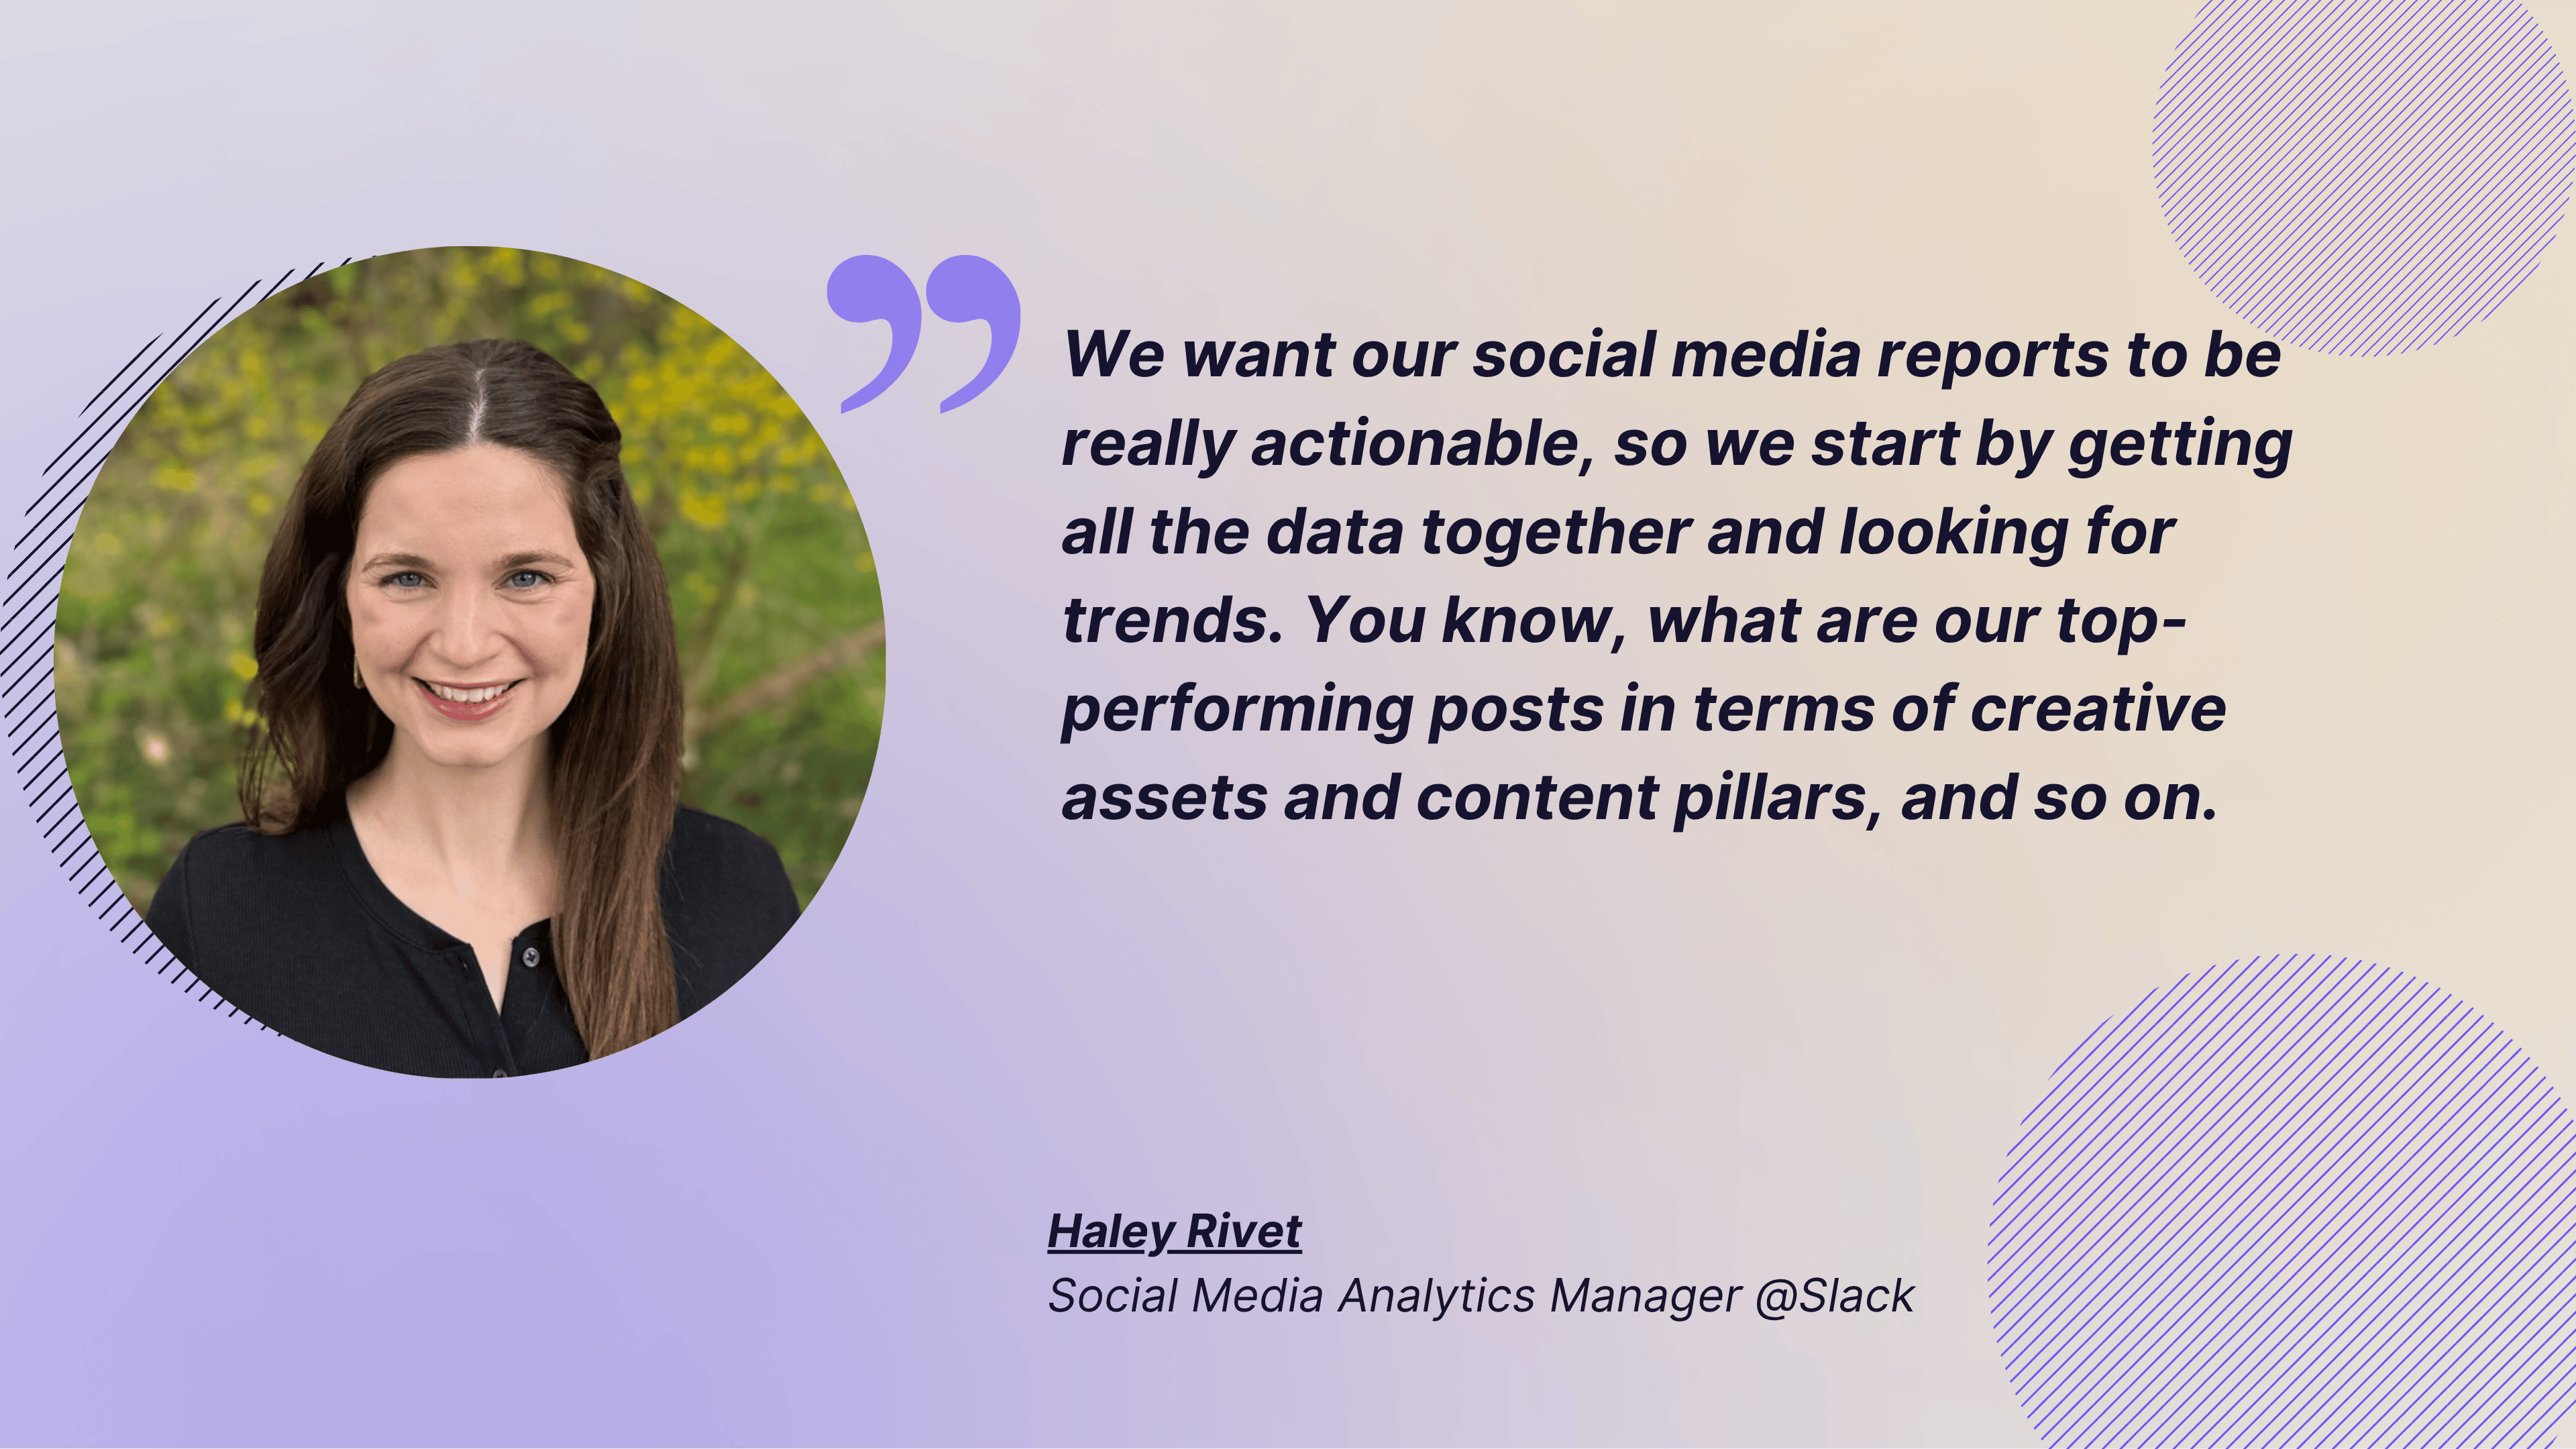
Haley recommends focusing only on metrics tied to your objectives. She said:
We want our social media reports to be really actionable, so we start by getting all the data together and looking for trends. You know, what are our top-performing posts in terms of creative assets and content pillars, and so on?
- Organize data by platform: Create sections for each platform. If Instagram is your focus, start with that. You can even show cross-channel performance to indicate which platforms should be prioritized moving forward.
- Tie insights to numbers: Numbers alone don’t mean much. Weave a story around them. For example, “Video retention dropped after 10s. This might mean our intros may be too slow.”
Haley does the same at Slack —
Our reports are shared widely across Slack channels, not just within the social team, but also with people who aren’t as deep in the day-to-day changes of social media algorithms. Because of that, we always make sure to include plenty of context around why performance might look different from week to week or quarter to quarter. Were there major platform updates? Did an unexpected global event overlap with a launch? Those kinds of factors can have a big impact on results. That’s why it’s so important to weave a clear narrative into every report, so the data makes sense within its broader context.
- End with action items: This section will answer the question, ‘how to use social media analytics’. Finally, talk about what strategies you are going to be implementing based on the social media marketing analytics you tracked.
We always make sure to include in the reports, here’s what we’re seeing, here’s the story around it, and here are our next steps. For example, the data shows us a really active community on LinkedIn is the job search audience. So how can we make content that serves them, whether it’s posting open roles or sharing tips and tricks?
Common social media analytics mistakes to avoid
While analyzing your data, you may make certain mistakes that can lead to misleading insights. Here are four of them to look out for.
- Getting carried away by vanity metrics: Vanity metrics without a connection to deeper metrics don’t reveal quality insights. For example, a viral post might rack up thousands of views, but if no one remembers your brand or takes the next step, it’s just empty reach. Instead, connect it to metrics like shares, saves, and conversions.
- Ignoring qualitative analytics: Numbers tell you what happened, but comments and conversations tell you why. For example, a spike in mentions might look great until you realize they’re complaints.
- Ignoring platform-specific nuances: What works on LinkedIn won’t necessarily fly on TikTok. A ‘view’ on YouTube means 30 seconds, but on Facebook it’s just 3. Engagement rate benchmarks, reach, and impressions vary wildly across platforms, so always analyze metrics in their native context before drawing conclusions.
- Not experimenting: Focusing on data-backed strategies is great. But sometimes you may look at a trend and wonder, “What if this works well for my brand?” By running such experiments, you can keep evolving with changing algorithms and audience preferences.
Haley talked about the same:
We should never be afraid to experiment and see what works. Social media isn’t an exact science and it’s constantly changing. If we don’t adapt and test new approaches along the way, we risk missing out on what really connects with our audience. So staying flexible and open to change is key.
Final thoughts
Running your social media without data is like driving with your eyes closed. You might still move forward, but you’ll have no idea where you’re going (or what you’re about to crash into).
Instead, use third-party tools like Socialinsider to collect this data and use it to guide your strategies. Based on the data, you can adjust your content mix, timing, or audience strategy.
Make sure you also weave in space for experimentation and then use data to see if it worked. If you’re looking for a tool to make this process easier, try out Socialinsider for free for 14 days.
Nidhi Parikh
Nidhi Parikh is SaaS writer that believes scrolling through social media is research for work. When not working, find her binge watching the latest series or reading anything she can get her hands on.

Know what your competitors do — before your manager asks
Get instant social benchmarks & reports without manual work.
You might also like


Improve your social media strategy with Socialinsider!
Use in-depth data to measure your social accounts’ performance, analyze competitors, and gain insights to improve your strategy.