LinkedIn ROI: How to Set a Measurement Process, Important Data Points, and Challenges
Discover in this guide how to set a measurement process for LinkedIn ROI calculation, important data points, and solutions to potential challenges.

LinkedIn ROI is often underestimated because most attribution models were built for direct-response channels, not long-term trust-building platforms.
As Andrii Shum, SEO expert leading SEO initiatives at Seoprofy, explains: “LinkedIn often works as a trust amplifier, not as a direct conversion channel. Its influence is manifested later, when the user is already looking for a brand on Google, returns directly or converts through another channel.”
This article explains what actually drives LinkedIn ROI and how to measure both immediate pipeline impact and long-term brand influence using frameworks grounded in real buyer behavior, not just attribution dashboards.
Key takeaways
-
What data do you need to calculate your LinkedIn ROI?
LinkedIn ROI requires tracking the right mix of awareness, engagement, conversion, and revenue metrics based on your specific business objective -
How to set up a LinkedIn ROI measurement process?
An effective LinkedIn ROI process starts with business-driven goals, aligns KPIs to funnel stages, and connects LinkedIn activity to conversions through proper tracking and attribution. -
Practical measurement frameworks that work in the real world:
The most effective LinkedIn measurement frameworks combine organic and paid signals, track full-funnel performance, and focus on compounding influence rather than isolated campaign metrics.
Why is proving LinkedIn marketing ROI a challenge for marketers?
The closer you get to revenue, the less LinkedIn gets credit.
Vukasin Vukosavljevic, the CMO who drives revenue for HeyReach through LinkedIn, puts it bluntly:
Most LinkedIn revenue is invisible. Someone sees a post, signs up three weeks later, no attribution. What we can track: inbound DMs and warm leads generated for sales. What we cannot track: everything else. But we know it is driving revenue because the pattern is undeniable: more presence equals more pipeline.
The editorial operations layer at many B2B companies treats LinkedIn content as search inventory, not social media. Every piece needs to work in isolation when someone finds it through profile browsing months later. Most teams optimize for engagement on publish day, but the real ROI comes from content that stays useful when prospects do homework on your company. That is revenue attribution that lives entirely outside the tracking pixel world.
Baris Zeren, CEO of Bookyourdata, explains how this plays out:
People in our team writing thought leadership content definitely generates revenue as prospects cite the posts in meetings. It is almost impossible to demonstrate in dashboards. A prospect reads about email deliverability, remembers who wrote the post and contacts us weeks later through a different channel. The post influenced the prospect decision, but we do not get credit for it because the prospect found us on Google after reading the post.
First-touch attribution says "LinkedIn started it." Last-touch says "Google closed it." Multi-touch tries to split credit. All three miss the fundamental truth: LinkedIn built the trust that made the Google search happen in the first place.
Understanding social media attribution requires accepting that some influence will always remain invisible, and that is okay if you build measurement systems that account for it.
What data do you need to calculate your LinkedIn ROI?
Effective LinkedIn ROI measurement requires matching metrics to actual business objectives. What I usually do is build a measurement stack that answers specific strategic questions.
Before diving into social media metrics, clarify what you are actually trying to achieve. The data you need changes dramatically based on whether you are building awareness, generating pipeline, or proving ROI to executives.
How is ROI defined for different business objectives?
ROI is not one metric, it is a framework that adapts to what you are solving for. A seed-stage startup building awareness measures ROI differently than a growth-stage company converting enterprise deals.
Awareness metrics: reach, impressions, follower growth, share of voice
Awareness metrics answer: "Are we visible to the right people?" These matter most when launching new products, entering new markets, or competing against category leaders.
Key metrics:
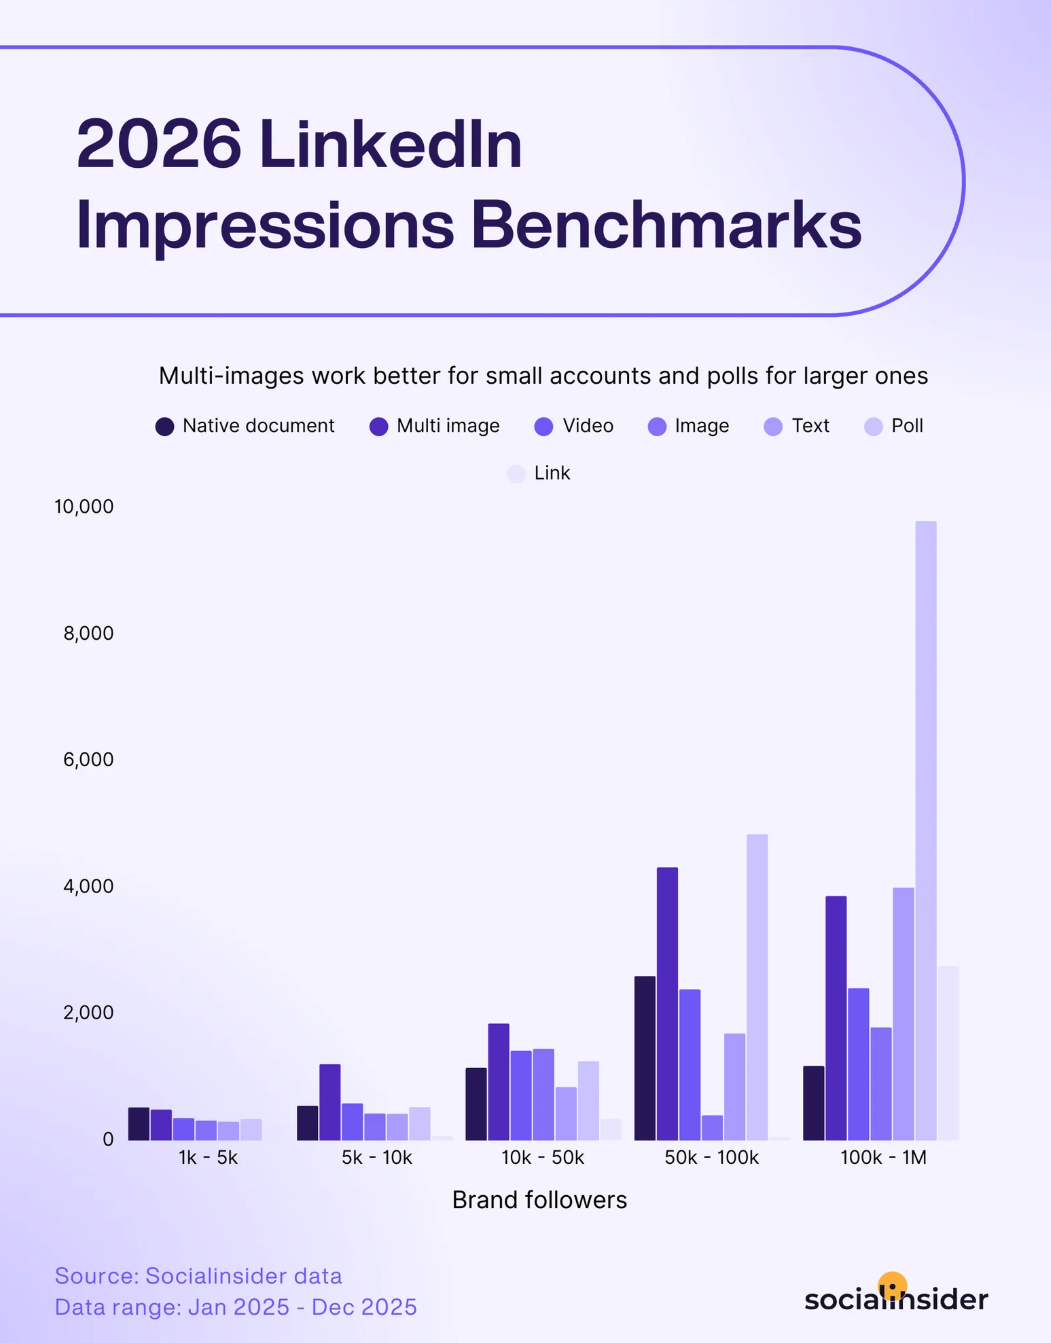
- Reach and impressions: Total unique viewers vs. total views. Raw numbers mean nothing without context; 1.5K impressions might be exceptional for a 5K-follower account or underperforming for a 50K one. What’s important to keep in mind here, is that there are two lenses you can approach data comparison, against your industry average and accounts in your follower tier. For this Socialinsider’s LinkedIn benchmarks comes to the rescue,providing a baseline for different account sizes
- Follower growth velocity: Not total followers, but month-over-month growth rate and-critically-follower quality. I recommend tracking what percentage of new followers match your ICP.
- Share of voice: Your mentions and visibility compared to competitors in your category.
For deeper insights into measuring brand impact, explore how to track brand performance and brand metrics that actually correlate with business outcomes.
Engagement metrics: engagement rate, reactions, comments, shares, saves
Engagement metrics answer: "Are people interacting with our content in meaningful ways?" The difference between vanity engagement and strategic engagement defines whether these metrics drive ROI.
Key metrics:
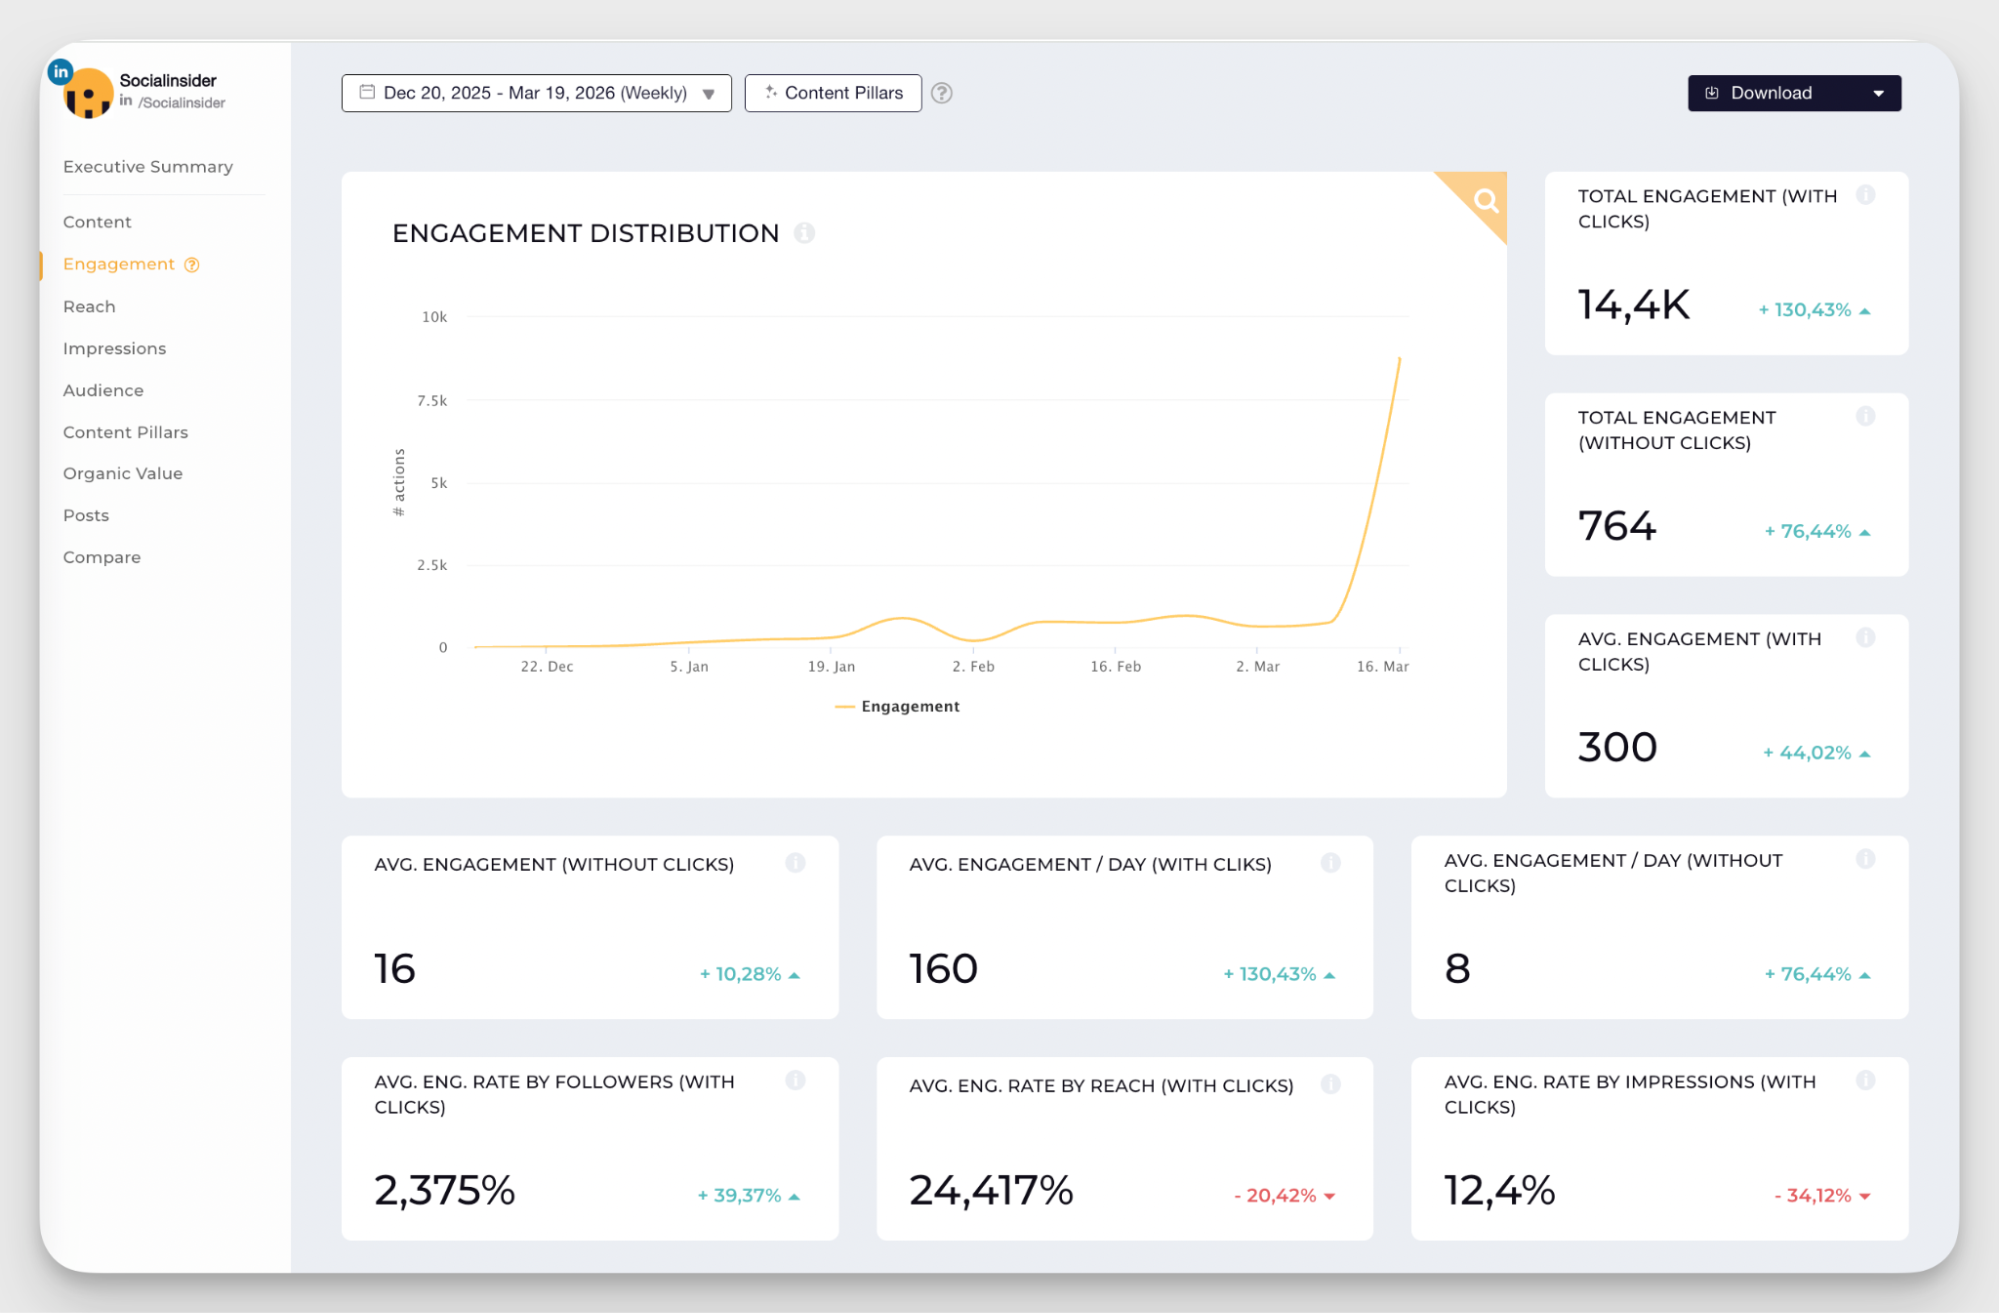
- Engagement rate: Total engagements divided by reach or impressions. Socialinsider offers multiple ways to calculate engagement for more personalized possibilities; by reach, by impressions, or by followers, each revealing different insights about content performance.
- Reaction depth: Likes are weak signals. Comments require thought. Shares expose the content to new networks. Saves indicate reference value. Weigh these differently based on intent.
Understanding social media engagement requires moving beyond surface-level metrics to identify which interactions actually predict revenue.
Traffic & conversion metrics: CTR, link clicks, website visits, lead gen form completions
Traffic and conversion metrics answer: "Are we moving people from awareness to intent?" This is where LinkedIn's role in the funnel becomes measurable.
Key metrics:
- Click-through rate (CTR): Percentage of people who see your content and click through. According to MarketingLTB, average CTR for Sponsored Content sits around 0.45%-0.55%, while Message Ads can reach 2-4%for well-targeted campaigns.
- Website visits from LinkedIn: Track via UTM parameters and LinkedIn Insight Tag. Don’t just count visits, track what they do next. Time on site, pages per session, and scroll depth show engagement quality.
- Lead gen form completions: LinkedIn native forms reduce friction (auto-fill from profile data) but can attract lower-quality leads. Track form completion rate and lead-to-opportunity conversion separately.
Revenue metrics: pipeline influence, cost per lead, cost per opportunity
Revenue metrics answer: "Is LinkedIn contributing to closed business?" This requires connecting social activity to CRM data.
Key metrics:
- Pipeline influence: Total dollar value of opportunities where LinkedIn appeared anywhere in the buyer journey. Not last-touch attribution, full journey visibility.
- Cost per lead (CPL): According to Tamarind, average CPL ranges from 100 to 125 dollars for software and IT companies. Context also matters because if your average deal size is 50K dollars, a 200 dollar CPL is excellent.
- Cost per opportunity: Leads do not equal pipeline. Track what percentage of LinkedIn-sourced leads become sales-qualified opportunities. If you are generating leads at 80 dollar CPL but only 5 percent qualify, your real cost per opportunity is 1,600 dollars.
- Deal velocity: Do LinkedIn-influenced deals close faster? CFOs care about sales cycle length. If LinkedIn-touched opportunities close 15-20% faster, that is measurable economic value even if attribution is murky.
Pavankumar Kamat, the Cofounder of PantoAI advises:
Treat every post like a micro-investment-tiny principal, compound interest over time. We routinely find buyers citing months of passive exposure as the tipping point; no dashboard proved causality, only win interviews did." They run post-close buyer surveys asking "What influenced your decision?" and consistently find LinkedIn mentioned despite zero CRM attribution.
For a comprehensive view of performance tracking, learn how to measure social media success beyond platform analytics.
Organic performance vs. paid campaign ROI: what metrics to track for each?
Organic and paid LinkedIn require different measurement lenses. Organic builds compounding value while paid delivers faster, more measurable results. Measuring them identically creates false comparisons.
Organic ROI metrics:
- Content longevity: How long does content continue driving engagement and profile visits? Posts that perform for weeks compound value.
- Profile visit conversion: Track what percentage of profile visitors take next actions like following, visiting your website, and sending connection requests.
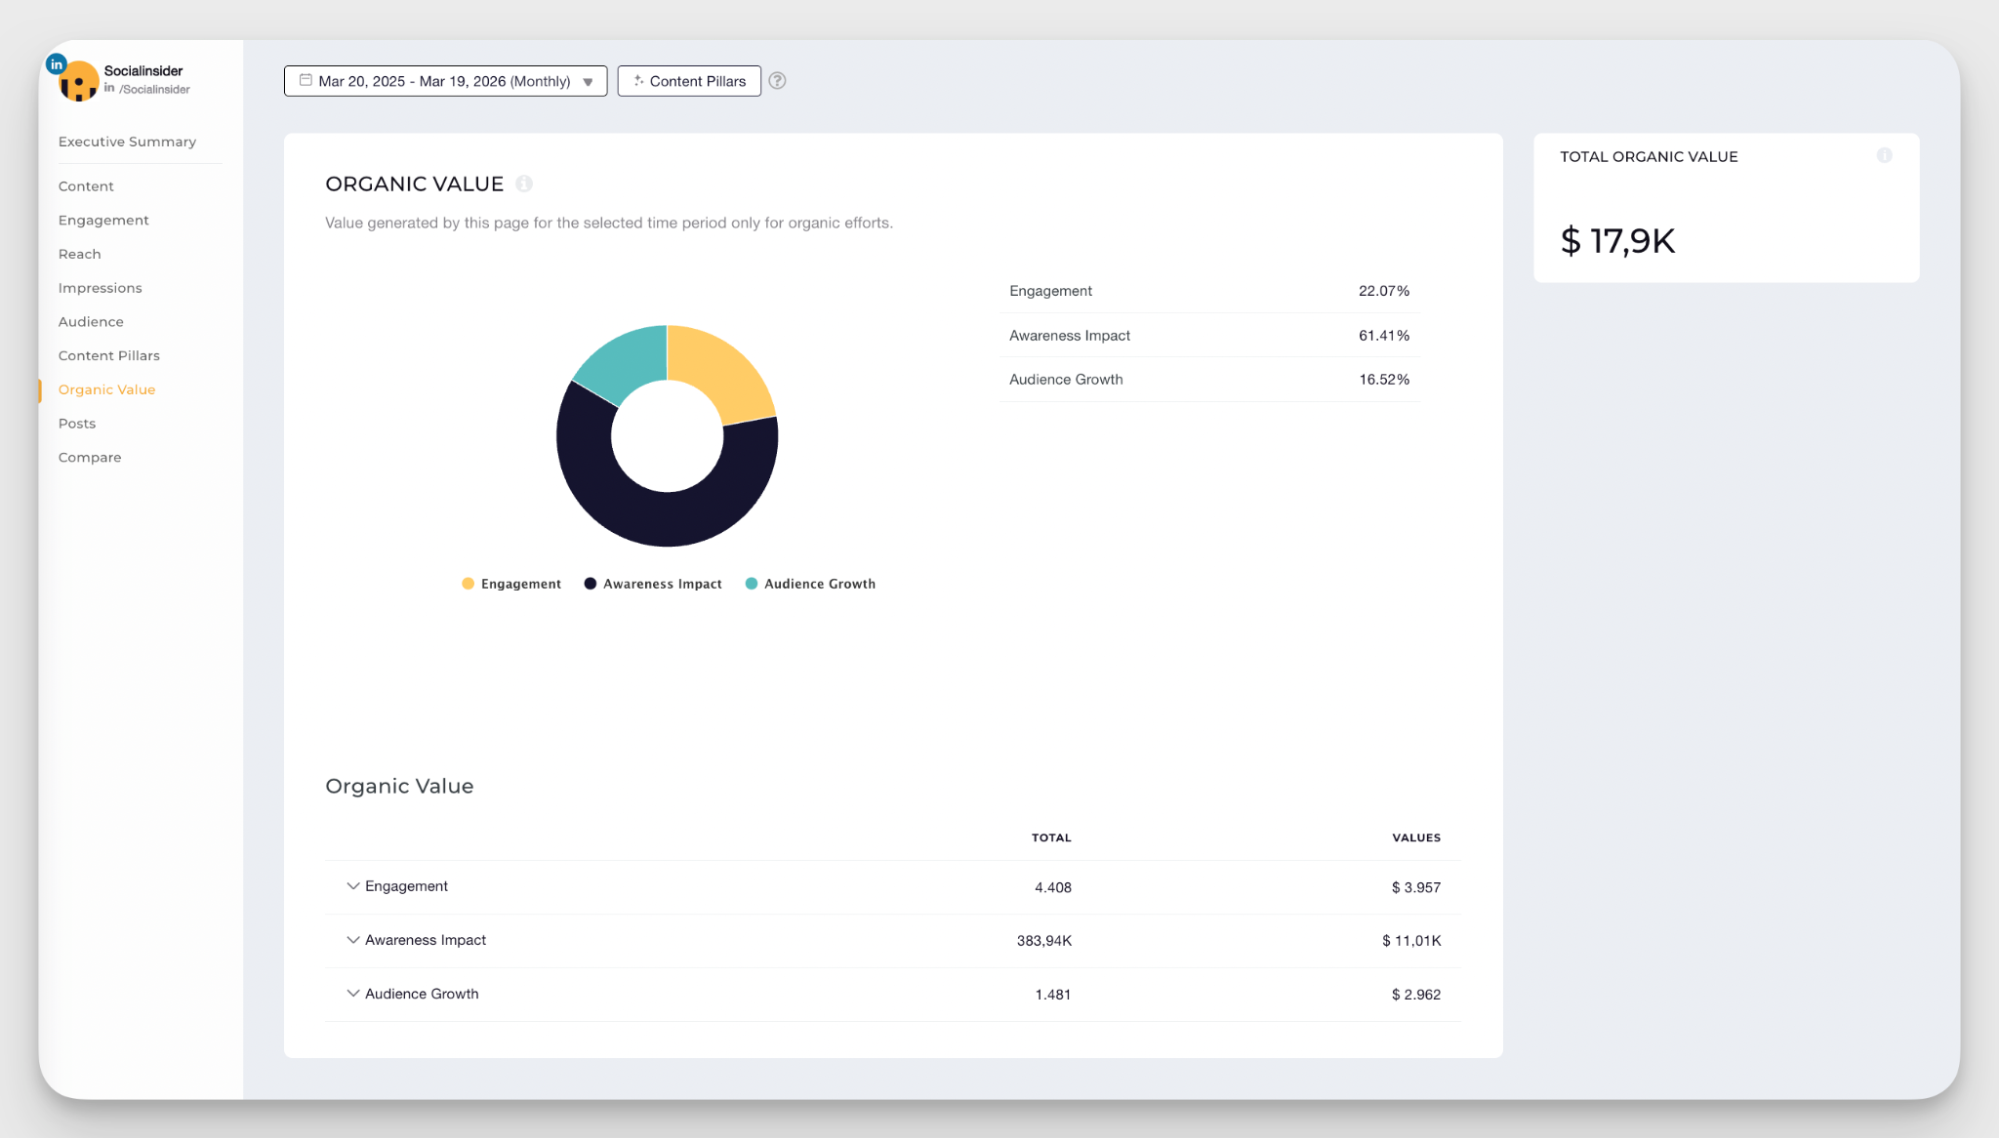
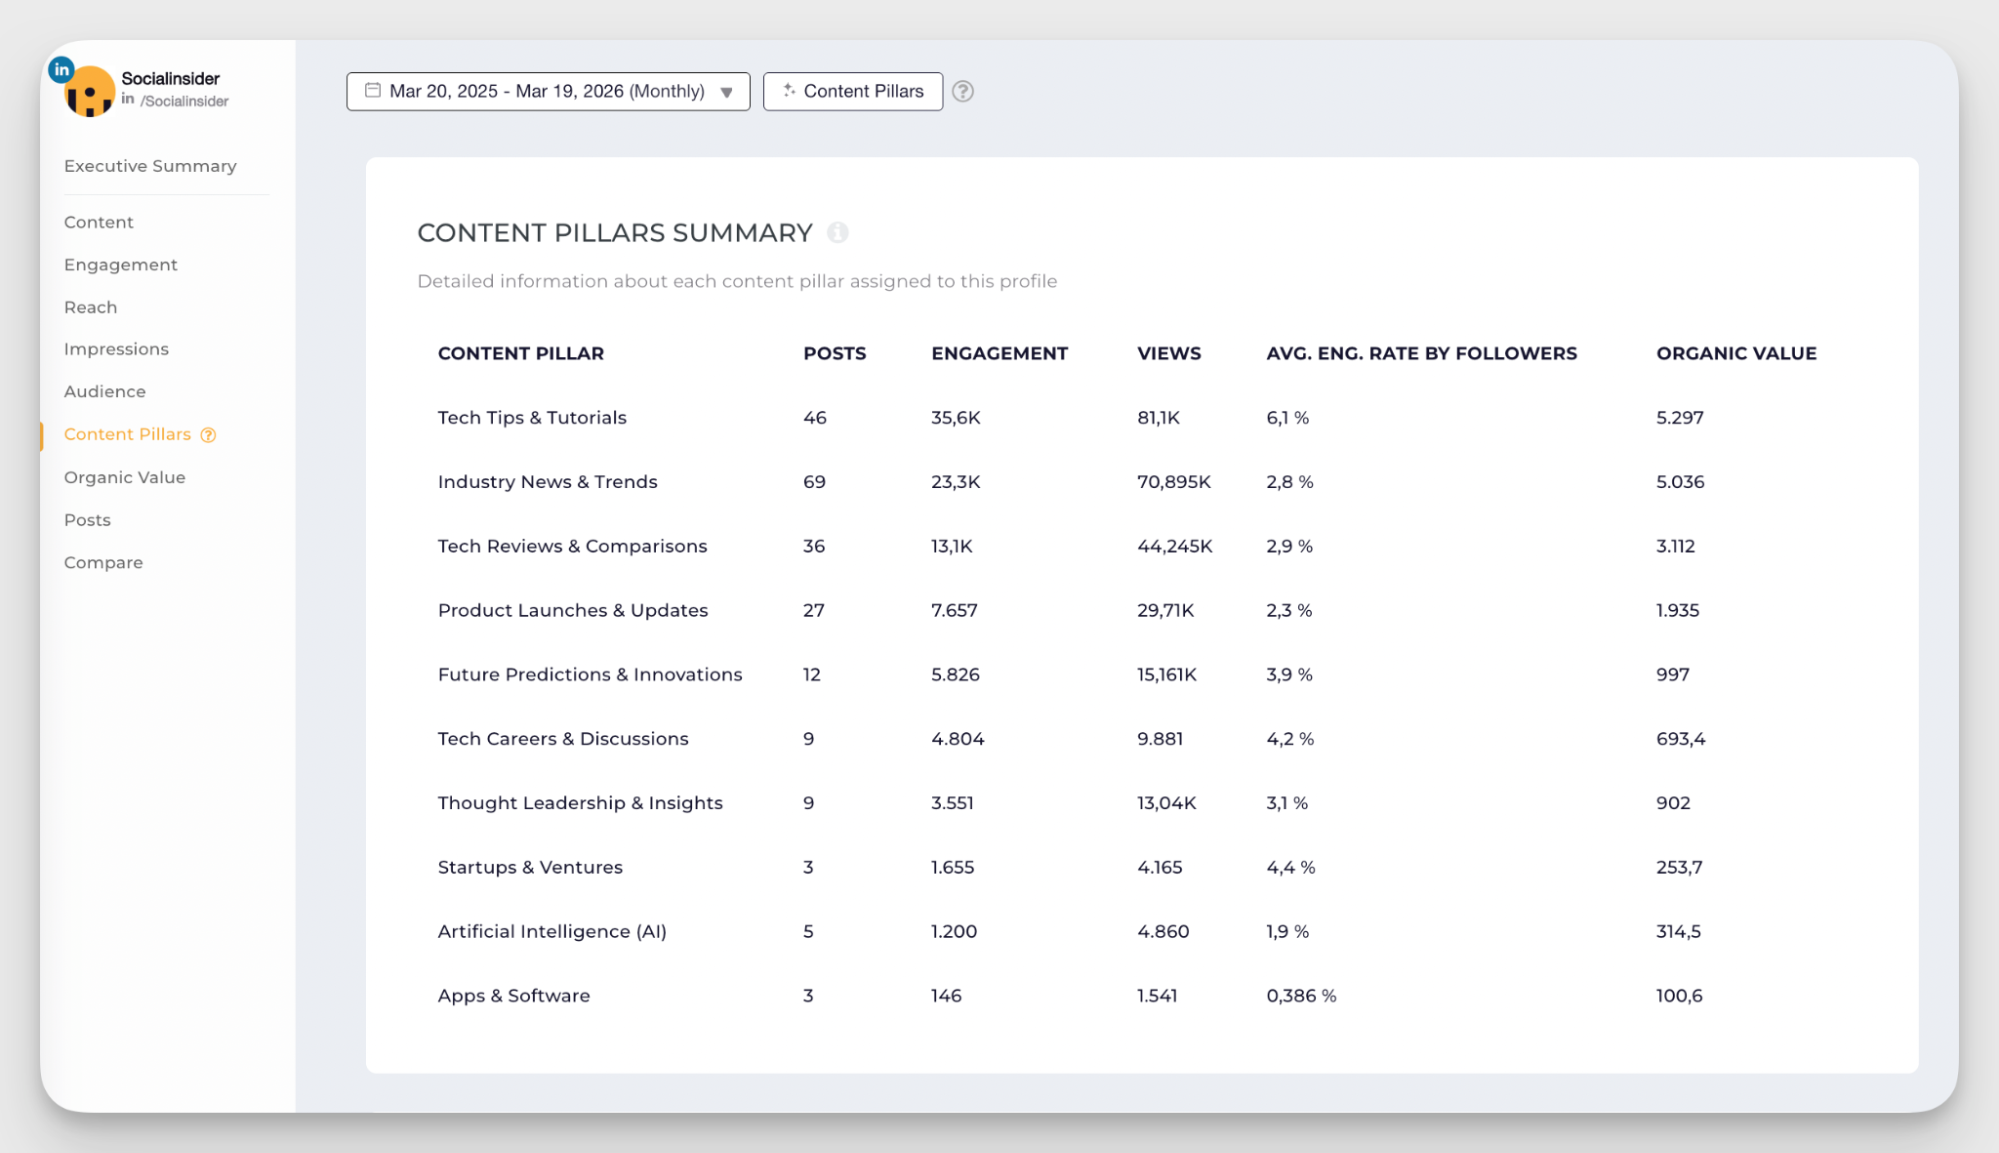
- Organic value calculation: Socialinsider created the Organic Value feature to quantify organic content monetary equivalent. It calculates what you would have paid for the same reach and engagement through ads, giving executives a dollar figure for organic performance.
- Content pillar performance: By using Socialinsider AI-based industry content pillars, you can identify which themes generate higher organic value for further optimization.
Paid ROI metrics:
- Cost per click (CPC): According to Tamarind, average CPC ranges from 5.58 to 7.00 dollars depending on targeting precision and competition.
- Cost per lead and cost per opportunity: Track the full funnel, not just leads. As mentioned, typical CPL sits at 100 to 150 dollars, but opportunity conversion rates vary wildly.
- Return on ad spend (ROAS): Revenue generated divided by ad spend. For B2B with long sales cycles, track influenced revenue, not just last-click revenue.
- Frequency and ad fatigue: LinkedIn audiences are smaller than Facebook. Monitor frequency (how many times the same person sees your ad). Once frequency exceeds 3-4, performance typically degrades.
Now in my experience, there is a certain organic-paid multiplier effect.
Baris Zeren explains:
Organic establishes authority that helps the conversion of paid because prospects who are exposed to both are more likely to recognize us. If the prospect has seen our organic post on data quality and then sees our paid campaigns, they recall. They are remembering the brand on the ad and attributing conversion to the paid campaign, but the brand awareness was created by the content.
Jennifer Bagley, CEO of CI Web Group, ran the numbers:
SEO returned nearly 20x ROAS while paid ads returned around 4.4x across comparable spend. That is not an argument against paid, it is an argument for sequencing them correctly.
Organic builds the foundation so paid is not doing all the heavy lifting at a premium cost-per-click."
Tom Basgil, founder of Sticky Tactics, puts it simply:
LinkedIn is pay-to-play. Focusing only on organic content hamstrings a company reach. The best brands experiment with organic content, boost their most successful posts for early and mid-funnel prospects, and leverage conversion-focused ads for those later in the funnel.
To optimize both channels effectively, explore strategies for social media optimization and data-driven marketing.
How to set up a LinkedIn ROI measurement process?
Theory is worthless without implementation. Here is how to build a LinkedIn ROI measurement system that actually works.
Step 1: Set a LinkedIn objective tied to a business goal
"Increase LinkedIn engagement" is not an objective, it is a vanity target. Business goals sound like: "Generate 50 qualified enterprise opportunities per quarter" or "Reduce customer acquisition cost by 20 percent by building organic awareness."
Vukasin from HeyReach rebuilt their LinkedIn strategy with ROI as the only goal. His first step: "Hyper-targeted connections. Connect aggressively with the right people. Not broad. Specific. Build a qualified audience fast." No engagement for engagement sake, just revenue-focused execution.
Set effective social media goals that connect to business outcomes rather than platform metrics.
Step 2: Choose the right KPIs for that objective
Vukasin’s rule: "Only track metrics that generate action points." For example: "You gained 50 followers from target accounts, here are the 3 posts that drove them.” Do more of that.
KPI selection rules:
- Awareness objective: Track reach among target accounts, share of voice, branded search lift
- Consideration objective: Track engagement quality, content saves, profile visits from target accounts
- Conversion objective: Track form completions, demo requests, CRM opportunity creation
- Advocacy objective: Track customer content sharing, employee activation, user-generated content volume
For comprehensive KPI guidance, explore social media KPIs that actually drive business results.
Step 3: Set up conversion tracking (LinkedIn Insight Tag, UTMs)
Without tracking infrastructure, attribution is impossible. Install these immediately:
LinkedIn Insight Tag:
- JavaScript pixel that tracks conversions and enables website retargeting
- Shows which LinkedIn campaigns drive website actions
- Builds retargeting audiences based on page visits
UTM parameters (critical for organic tracking):
- Source: utm_source=linkedin
- Medium: utm_medium=organic_social or utm_medium=paid_social
- Campaign: utm_campaign=product_launch_q1 (specific to your initiative)
- Content: utm_content=founder_post_jan15 (identifies individual posts)
Use a consistent UTM naming convention across your team because inconsistent tagging ruins attribution. Tools like Google Campaign URL Builder standardize this.
I advise asking "How did you hear about us?" in every form. Michael Maximoff, the Cofounder of Belkins does this religiously: "The buying journey is messy, and LinkedIn is just one part of the overall effort, but asking directly helps us understand patterns attribution tools miss."
Understanding social media data collection methods ensures you are capturing the right signals for analysis.
Step 4: Choose your attribution model intentionally
Attribution models are strategic choices that determine which channels get credit and therefore which get budget.
Common models:
- Last-touch: Gives 100 percent credit to the final interaction before conversion. Undervalues LinkedIn because prospects often convert through search or direct after LinkedIn builds awareness.
- First-touch: Gives 100 percent credit to the first interaction. Overvalues top-of-funnel channels like LinkedIn but ignores everything that happened after initial awareness.
- Linear: Distributes credit equally across all touchpoints. Fair but does not account for varying impact of different interactions.
- Time-decay: Gives more credit to recent interactions. Better for B2B but still misses long-term brand building.
- U-shaped (position-based): Gives 40% credit to first touch, 40% to last touch, 20% distributed among middle touches. Often most realistic for B2B.
The hybrid approach Vukasin recommends:
LinkedIn delivers revenue on two timelines. Here is the split: Short-term revenue (trackable) campaigns that drive immediate pipeline, LinkedIn Ads with direct attribution, inbound DMs converted to customers. Long-term revenue (harder to track) brand awareness that compounds over time, thought leadership that positions us as category leaders, network effects that drive word-of-mouth. The balance: do not tank long-term initiatives with short-term KPIs. Measure them separately.
For a deeper dive into attribution strategies, read the full guide on social media attribution.
Step 5: Build a reporting cadence and format for your team
Who you are reporting to determines what you show and how you frame it.
Reporting to CMOs:
- Lead with strategic narrative: How LinkedIn supports broader marketing objectives
- Show competitive positioning: Share of voice vs. competitors, thought leadership momentum
- Balance short and long-term metrics: Mix immediate pipeline with brand health indicators
Reporting to CFOs:
- Lead with dollars: Pipeline influenced, cost per opportunity, ROAS on paid campaigns
- Show efficiency: CAC reduction, deal velocity improvement, cost comparison vs. other channels
- Acknowledge limitations upfront: "LinkedIn will not show up cleanly in attribution models. Some influence will be invisible. We track both direct attribution and influence markers."
Pavankumar Kamat approach to CFOs:
Anchor your case in measurable economic impact, not vanity metrics. Show direct, attributable business outcomes: pipeline sourced and influenced in USD, marketing-sourced SQLs, conversion rates to opportunity and closed-won, average deal size for LinkedIn-sourced deals, and CAC by channel. Present these alongside a control period or cohort so the CFO sees delta, not absolute numbers. Include deal velocity-shorter sales cycles are real cost savings.
Use tools like Socialinsider for automated LinkedIn analytics reporting that saves hours of manual data collection, and learn more about LinkedIn analytics tools that streamline this process.
LinkedIn ROI benchmarks
Benchmarks without context mislead. The numbers below provide directional guidance, but your industry, deal size, sales cycle, and target audience dramatically shift what "good" looks like.
LinkedIn Ads benchmarks (2026):
Tamarin’d LinkedIn Ads Benchmarks 2026 also highlight the following:
- Cost per click (CPC): 5.58 to 8.00 dollars (varies by industry and targeting precision)
- Cost per lead (CPL): 15 to 350 dollars, going up to 125 dollars for software & IT.
- Click-through rate (CTR): 0.44- 0.65% for Sponsored Content, 2 to 4 percent for Message Ads with strong targeting
- Conversion rate: 5-15% from click to form completion (highly dependent on offer quality and landing page)
Organic content benchmarks from Socialinsider’s LinkedIn research
- Median video views: While the biggest LinkedIn pages generate the most video views, across all LinkedIn pages, there’s a 36% YoY decline in views.
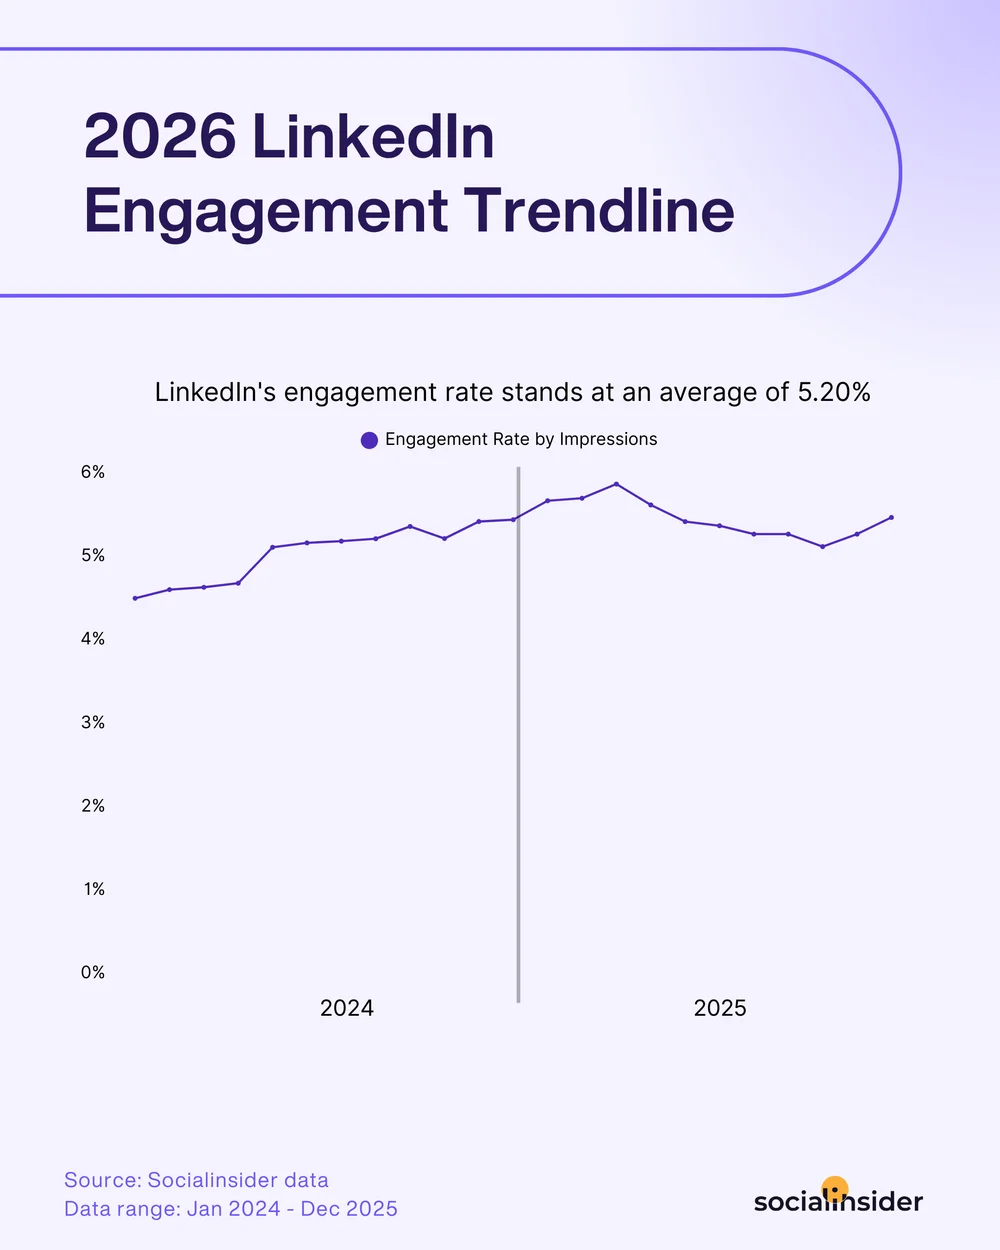
- Median engagement rate: 5.20% across industries (varies significantly by content type and audience size)
This is what benchmarks don’t tell you: A 200 dollar CPL is terrible if your average deal size is 5K dollars. It is exceptional if your average deal size is 100K dollars.
Use benchmarks as directional guides, not success definitions. The only benchmark that truly matters: Are you improving month-over-month on metrics that correlate with revenue?
For comprehensive performance tracking across platforms, explore Socialinsider social media analytics and LinkedIn analytics tools.
Practical measurement frameworks that work in the real world
Theory does not close deals. Consider these three frameworks that successful marketers actually use to drive LinkedIn ROI.
Framework 1: The LinkedIn ROI Stack
Most marketers measure LinkedIn in silos. The ROI Stack shows how metrics connect. Each layer feeds the next. Strong attention without engagement means content does not resonate. Strong engagement without intent signals means you are entertaining the wrong audience. The stack shows where your funnel breaks.
Framework 2: The Snowball Mechanism
Vukasin from HeyReach explains their approach:
Multiple personal brands create a snowball effect. Revenue on LinkedIn comes from the combined presence of multiple HeyReach employees posting consistently. Each profile targets a different ICP segment within our buyer universe.
The 30% Rule: “Every employee dedicates at least 30 percent of their content to HeyReach. Not every post. Not branded spam. Strategic placement that fits their career trajectory, their audience, and ICP positioning.”
The Snowball Mechanism: “Discipline compounds. One person posting builds awareness. Five people posting creates omnipresence. Ten people posting makes HeyReach unavoidable in your feed. That is the snowball, it gains mass and momentum as it rolls.”
Framework 3: Organic + Paid Multiplication
Vukasin approach combines both:
Organic ambassadors and experts post about HeyReach. If content gets organic traction like high engagement, shares, comments, we amplify it with Thought Leader Ads. Organic proof equals paid performance. This delivered insane ROI. LinkedIn Ads became highly profitable using this method.
The second layer: engagement-based targeting. A CMO from a target company engages with your organic content. That engagement becomes targeting intelligence for ads. You start targeting that company's decision-makers with paid campaigns.
Pavankumar Kamat explains the operational interplay:
Treat organic engagement as a signal for paid amplification and retargeting. When a prospect likes, comments, or views long-form content, they move into a higher-propensity cohort. Run short-tail paid sequences-ads to gated demo or content to SDR outreach-against that cohort. Measure lift by comparing CPL and SQL conversion rates for audiences that engaged organically vs. cold audiences.
Remember, organic and paid do not compete. They stack.
For additional guidance on tracking effectiveness across channels, explore resources on effective social media marketing and the impact of social media on business.
And for ongoing optimization, regularly review LinkedIn metrics, conduct social media analysis, and follow social media analytics best practices to refine your approach continuously.
Final thoughts
The marketers who win on LinkedIn do not have better attribution tools. They have better frameworks for thinking about influence, clearer communication with stakeholders about what is measurable vs. what is valuable, and the discipline to optimize metrics that actually correlate with revenue.
As Pavankumar Kamat summarizes:
The biggest revenue signal from LinkedIn is not measurable last-click attribution but cumulative trust; small, consistent interactions that shorten sales cycles and unlock warm introductions months later. Treat LinkedIn as a trust-deposit mechanism. Regular, useful posts and thoughtful engagement make you a predictable, low-risk option when a buyer starts sourcing solutions.
Start with one framework from this article. Implement it this week. Measure what changes. Then iterate.
For comprehensive analytics and measurement support, explore Socialinsider platform and start tracking LinkedIn performance with social media content analysis tools that turn data into actionable insights.
Nsikak Tim
B2B content marketer with 9 years in marketing and 6 years in content writing. I focus on sharp, insight-driven content that doesn’t sound like it was approved by five stakeholders and a legal team.
Know what your competitors do — before your manager asks
Get instant social benchmarks & reports without manual work.


