How to Compare Social Media Performance of Brands in 5 Steps
Learn how to compare social media performance with a clear framework—track key metrics, benchmark competitors, and turn insights into action.


You’re reviewing your brand alongside three competitors after a campaign. One has double your followers, another posts five times more, and a third gets fewer likes but far more comments and shares. The numbers look impressive, but the comparison feels unclear.
This guide walks you through how to compare social media performance of brands using a practical, step-by-step framework, along with insights shared by Denisa Vlăduță, senior social media manager.
You’ll learn how to choose the right competitors, select meaningful metrics, normalize data, and analyze social media marketing performance across platforms. Let’s get started.
Key takeaways
- How to compare social media performance of brands with a 5-step framework: A reliable comparison comes from aligning objectives, selecting relevant competitors, focusing on meaningful metrics, normalizing data, and turning insights into actionable strategy.
- How to compare cross-platform performance of brands? Evaluate performance within each platform first, then compare strengths, content adaptation, and growth patterns across channels to identify strategic opportunities.
- Which are the top tools to compare social media performance of brands? Use a mix of native analytics for accuracy, Socialinsider for benchmarking, and Mention for visibility and sentiment to get a complete performance picture.
- How to use AI to compare social media performance of brands? AI enhances comparison by automating data collection, normalizing metrics, identifying content patterns, and predicting trends while still requiring human context and judgment.
Why comparing social media performance is harder than it looks?
At first glance, comparing brands on social media feels simple. Look at followers, likes, and growth, then decide who’s doing better. In reality, those numbers rarely tell a complete or fair story. Most comparisons break down because the data isn’t being viewed in the right context.
Here are four reasons why social media comparison often fails.
Focusing on vanity metrics vs meaningful comparisons
Metrics like likes, views, and follower counts are easy to track, which is why they’re often used in comparisons. But I feel they show just surface-level performance and not impact.
A post with thousands of likes might look successful, but it may not drive meaningful engagement like comments, shares, or saves. Strong comparisons focus on engagement quality and efficiency instead of just volume.
Denisa mentioned the same —
There are many nuances to consider when comparing social media performance, and without a clear framework, it can quickly feel overwhelming. One common mistake is focusing only on numbers instead of balancing quantitative and qualitative insights.
The key is to define a consistent set of metrics based on your goals and compare them like-for-like: same formats, similar post types, and comparable distribution. At the same time, you need to factor in sentiment and context.
A post might generate high engagement, but if most of the comments are negative, the numbers alone don’t tell the full story. Understanding audience sentiment and the broader context behind performance is what turns data into meaningful insight.
Different goals make comparisons unreliable
Not every brand is optimizing for the same outcome. One brand may be focused on reach and awareness, while another prioritizes conversions or community building.
When goals differ, performance metrics reflect different strategies. Comparing them directly can lead to misleading conclusions because success is being measured in different ways.
Follower count distorts reality
A larger audience does not automatically mean better performance. Brands with high follower counts often see lower engagement rates, while smaller or niche brands may have highly active communities.
Looking at absolute numbers favors scale over effectiveness. This is why relative metrics like engagement rate provide a more accurate comparison.
Posting frequency warps comparisons
Brands that publish more content tend to generate more total engagement simply due to volume. On the other hand, brands that post less frequently may show stronger performance per post. Without accounting for posting frequency, comparisons become skewed, making it difficult to distinguish between content quality and content quantity.
When not to compare brands?
I’ve found that comparison only works when the context is aligned. Without that, even the most detailed analysis can lead to the wrong conclusions.
Here are situations where comparing brands is more likely to mislead than inform.
- When the audience type doesn’t match: A brand targeting enterprise decision-makers will see very different engagement behavior compared to one targeting a broad consumer audience. Comparing these two directly ignores how audience behavior shapes performance.
- When posting frequency is significantly different: A brand publishing multiple times a day will naturally accumulate more total engagement than one posting a few times a week. Without adjusting for frequency, comparisons favor quantity over efficiency.
- When one brand relies heavily on paid distribution: Paid promotion can significantly boost reach, impressions, and engagement. If one brand is investing heavily in ads while another relies on organic content, their performance isn’t directly comparable. In this case, you’re evaluating media spend rather than content effectiveness.
- When brand positioning is fundamentally different. Brands with different positioning: premium vs budget, educational vs entertainment-led, community-first vs product-driven approach content with different objectives. Their metrics reflect those strategies. Comparing them without context overlooks why the content exists in the first place.
Denisa talked about the same in our conversation. She gave an example to help understand this better —
A competitor might lean heavily into comedic memes because that format tends to perform well on social media. But that doesn’t mean it’s the right approach for every brand. If your brand has a more curated, dreamy, or minimal aesthetic, jumping into meme-led content can feel off-brand and dilute your identity
Performance should always be evaluated in the context of brand positioning: what works for one brand may not translate to another if it doesn’t align with its voice and audience expectations.
How to compare social media performance of brands with a 5-step framework?
Here’s a step-by-step guide on comparing the performance of brands on social media.
Step 1: Define your comparison objective
I always start by being clear about what exactly I’m trying to compare. Without that, you might spend a lot of time gathering and analyzing data that does not matter.
Here are objective examples you can work on.
Campaign vs long-term performance
If I’m analyzing a campaign, I focus on a specific time frame. Say, a product launch or a festive campaign. For example, I might compare how three brands performed during Christmas week based on engagement per post or campaign-specific reach.
For long-term performance, I look at trends over months: consistent growth, average engagement, and content stability. This helps me understand which brand is building sustained momentum rather than short-term spikes.
Socialinsider is great for looking at long term trends for different metrics.
Growth vs efficiency vs engagement
I also define the lens of comparison early on:
- Growth: If I’m tracking follower growth, I compare how quickly brands are expanding their audience over time.
- Efficiency: I look at metrics like engagement per post to understand how much return each piece of content generates.
- Engagement: I focus on how audiences interact: comments, shares, and saves, not just likes.
For instance, one brand may grow faster, while another gets higher engagement per post. Defining the objective helps me decide which of these actually matters for the comparison.
Step 2: Identify your competitors
The goal of this step is to build a relevant comparison set that reflects both your market and your audience’s behavior.
Here’s how Denisa suggested going about it:
- Same-category competitors: She begins with brands in the exact same space. For example, if you’re analyzing a candle brand, you look at other candle makers targeting a similar audience. This gives the most direct comparison.
- Wider category competitors: Next, she expands to brands selling similar products in a broader category. Candles are also sold by home décor stores, lifestyle brands, or gifting platforms. These brands compete for the same customer attention, even if candles aren’t their core product.
- Audience-aligned brands Finally, she looks at brands that share the same audience values. Someone interested in candles might also follow interior design pages, wellness brands, or yoga creators. Exploring this layer helps you understand content expectations and engagement patterns beyond my category.
Step 3: Gather data on specific metrics based on your objective
Once I’m clear on the objective and competitors, I focus on collecting only the metrics that actually support that goal. This keeps the analysis structured and avoids getting distracted by irrelevant data.
Engagement
- Engagement rate: This is my go-to metric because it normalizes performance against audience size. For example, a brand with 10K followers and a 6% engagement rate is often outperforming a brand with 100K followers and a 2% rate.
- Saves, shares, comments vs likes: I look beyond likes. Saves and shares signal deeper value, while comments show active interest. If two brands have similar likes but one gets significantly more shares, that content is likely more impactful.
Growth
- Follower growth rate: Instead of absolute follower increase, I track percentage growth. For instance, growing from 10K to 12K is more meaningful than 100K to 102K.
- Audience quality vs quantity: I also look at how engaged the audience is. A smaller but active audience often indicates stronger content-market fit than a large but passive one.
Content
- Content pillar engagement: Group posts into themes (educational, entertaining, promotional) and compare how each performs. This shows what topics resonate most.
- Content format distribution: I analyze how much of each format a brand uses (videos, carousels, static posts) and how those formats perform.
- Average engagement per post: This helps me evaluate consistency. A brand with stable engagement across posts often has a stronger strategy than one relying on occasional spikes.
- Virality rate: I look at how often content significantly outperforms the average. This helps identify breakout content patterns.
Share of voice and visibility
- Brand mentions: I track how often a brand is being talked about across platforms. This reflects visibility beyond owned content.
- Relative visibility in the industry: Compare how prominently each brand shows up in conversations or content within the same space. This helps identify who is leading attention in the category.
Step 4: Normalize the data
Once I have the metrics, I don’t compare them in raw form. I normalize everything so the comparison reflects performance rather than scale or volume.
Here’s how you can normalize data for different metrics.
Engagement normalization
- Engagement rate: I calculate engagement relative to audience size (total engagement ÷ followers × 100). This helps me compare brands of different sizes on equal footing.
- Interaction mix (saves, shares, comments): I look at the percentage split of interactions instead of totals. For example, if 40% of engagement comes from shares, that signals strong content value regardless of audience size.
Growth normalization
- Follower growth rate: I convert growth into percentage terms over a defined period. This avoids overvaluing large accounts that grow in absolute numbers but slowly in relative terms.
- Audience quality: I relate engagement rate to follower size. A smaller account with high engagement often indicates a more active and relevant audience than a larger, less engaged one.
Denisa talked about the same giving an example —
You can look at a competitor’s post and see 20K likes, which at first glance seems impressive. But when you compare it to their follower size, say, 2M followers, that 20K suddenly carries less weight when you realize it’s just around 1%.
This becomes more effective when you align the analysis to the same time period, account for posting frequency, group content by type, and consider platform-specific benchmarks.
That’s how you get a more realistic view of performance, putting both larger and smaller brands on the same level for fair comparison.
Content normalization
- Content pillar performance: I compare average engagement per post within each content category. This shows which themes perform best without being skewed by how often they’re posted.
- Content format performance: I evaluate engagement per format (for example, average engagement on videos vs carousels), not total engagement. This highlights which formats are actually effective.
- Average engagement per post: I divide total engagement by number of posts. This removes the bias created by posting frequency.
- Virality rate: I identify posts that perform significantly above the average (for example, 2x or 3x). Then I look at the proportion of such posts instead of isolated spikes.
Share of voice and visibility normalization
- Brand mentions: I compare mentions as a percentage of total mentions within the competitor set.
- Relative visibility: I evaluate how often a brand appears compared to others in the same dataset, giving me a clearer picture of its position in the conversation.
Step 5: Turn insights into strategy
Now that you have the data, you need to turn it into action items for your team. Here’s how to do that.
- Identify content gaps. I look at where competitors are performing well and map that against my own content. For example, if multiple competitors are getting strong engagement on educational carousels and I rarely use that format, that’s a clear gap. I also check content pillars that are consistently working for others but missing from my strategy.
- Spot replicable patterns. I focus on patterns that show up consistently, not one-off wins. This could be the tone of the posts, the storytelling technique, or a posting behavior like timing.
- Avoid blind copying. I don’t copy content directly. Instead, I adapt the underlying idea to fit my brand. Denisa explained this perfectly when she said,
Comedy might perform well on social media, but that doesn’t automatically make it the right fit for your brand or audience. The focus should always be on what makes your brand unique and how you can stand out. It’s important to understand why a competitor’s post performed well, whether it tapped into a trend or resonated with a specific audience, before applying those insights. In simple terms: observe what others are doing, take notes, and adapt what works in a way that fits your brand.
How to compare social media performance of brands using Socialinsider
Now that the framework is clear, I like to apply it using a social media competitor analysis tool like Socialinsider so the process becomes faster and more structured. For this example, let’s take Adobe as our primary brand.
- Set my objective in Socialinsider. I start by deciding what I want to analyze. For example, I want to analyze content performance for Adobe’s competitors in order to gain inspiration on what to optimize or avoid.
- Add competitors. I created a comparison set, taking Canva and Pixlr as two brands I want to compare Adobe’s content against. I simply added these profiles in Socialinsider and used the Benchmarks section to get a side-by-side performance comparison.
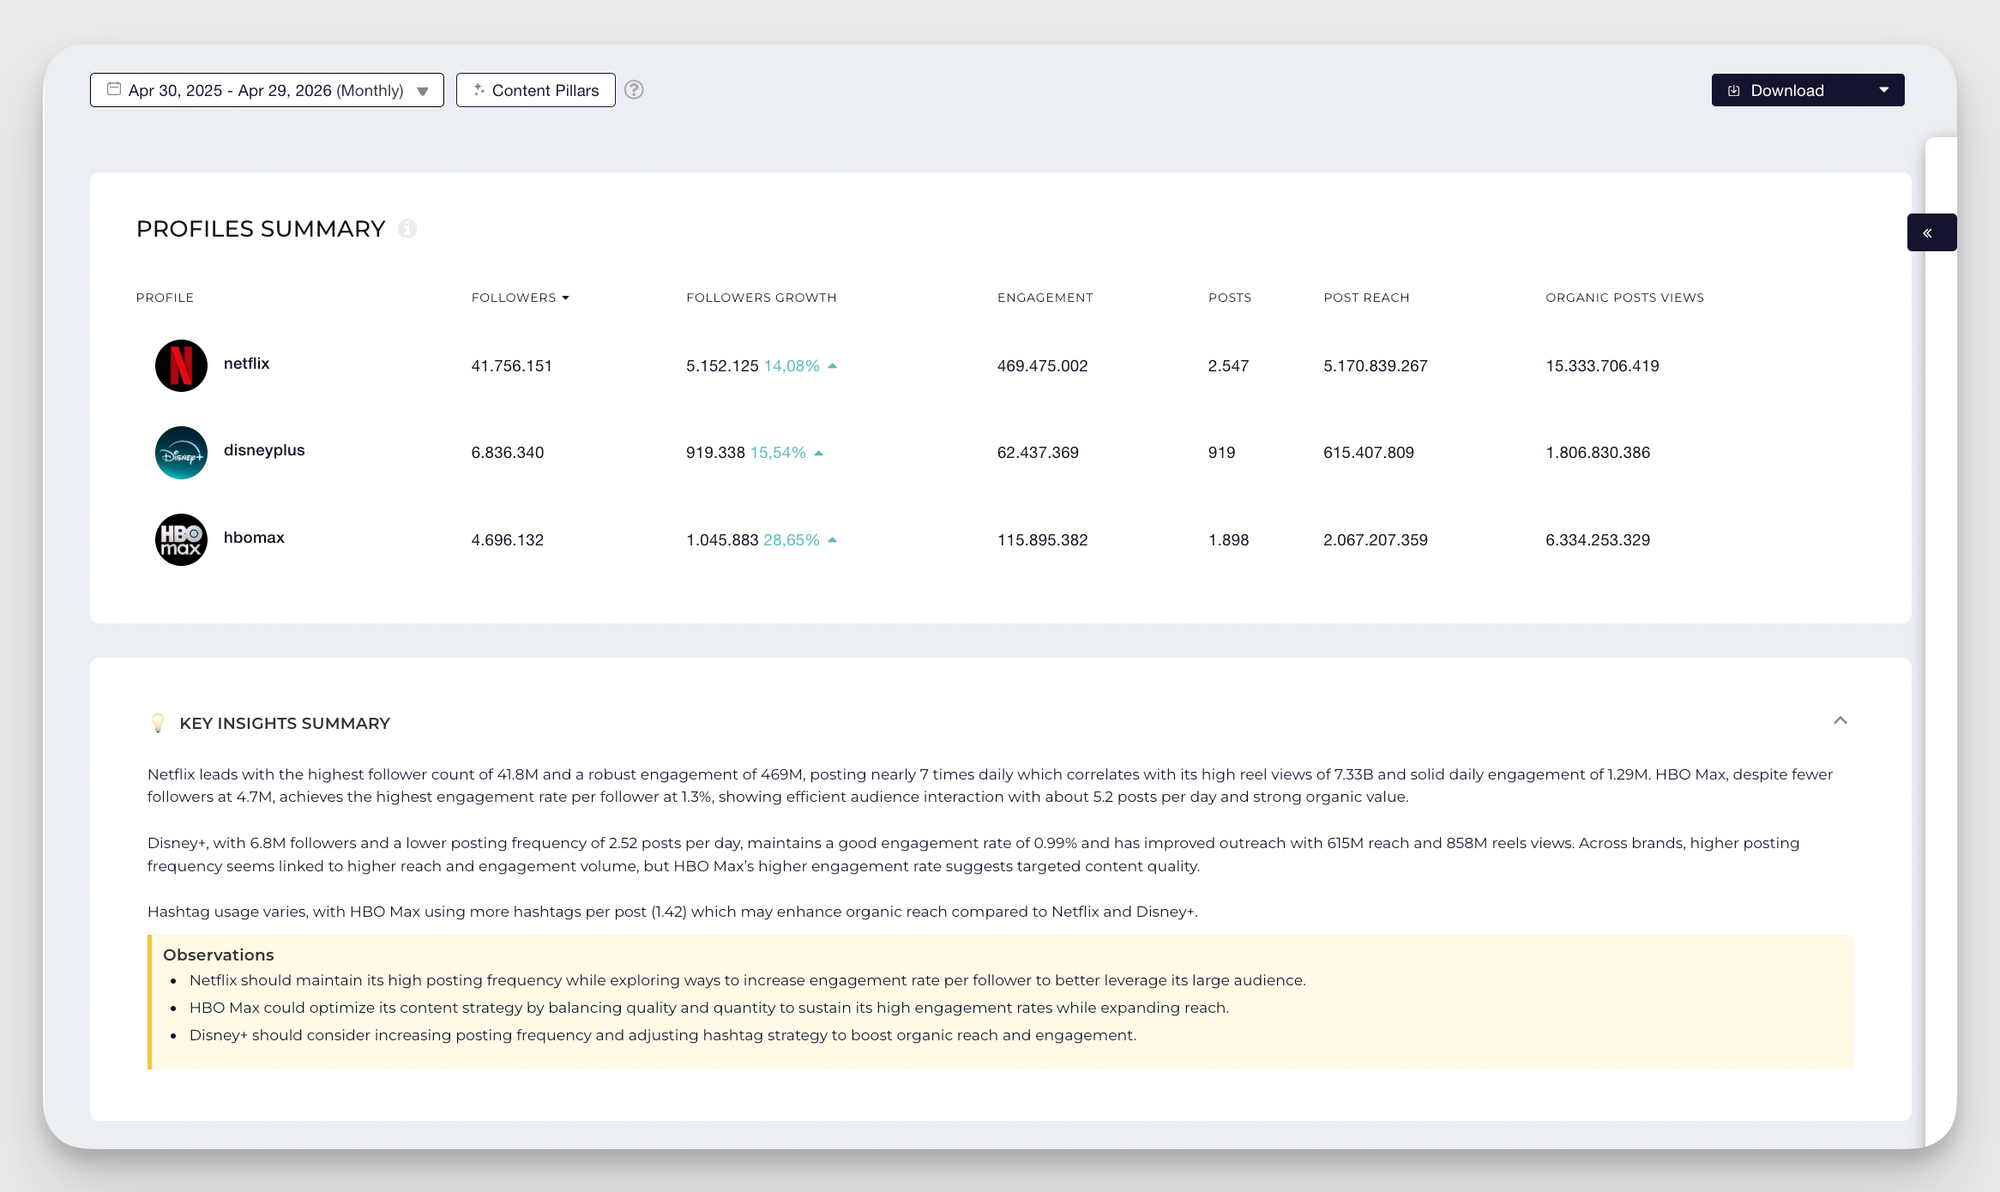
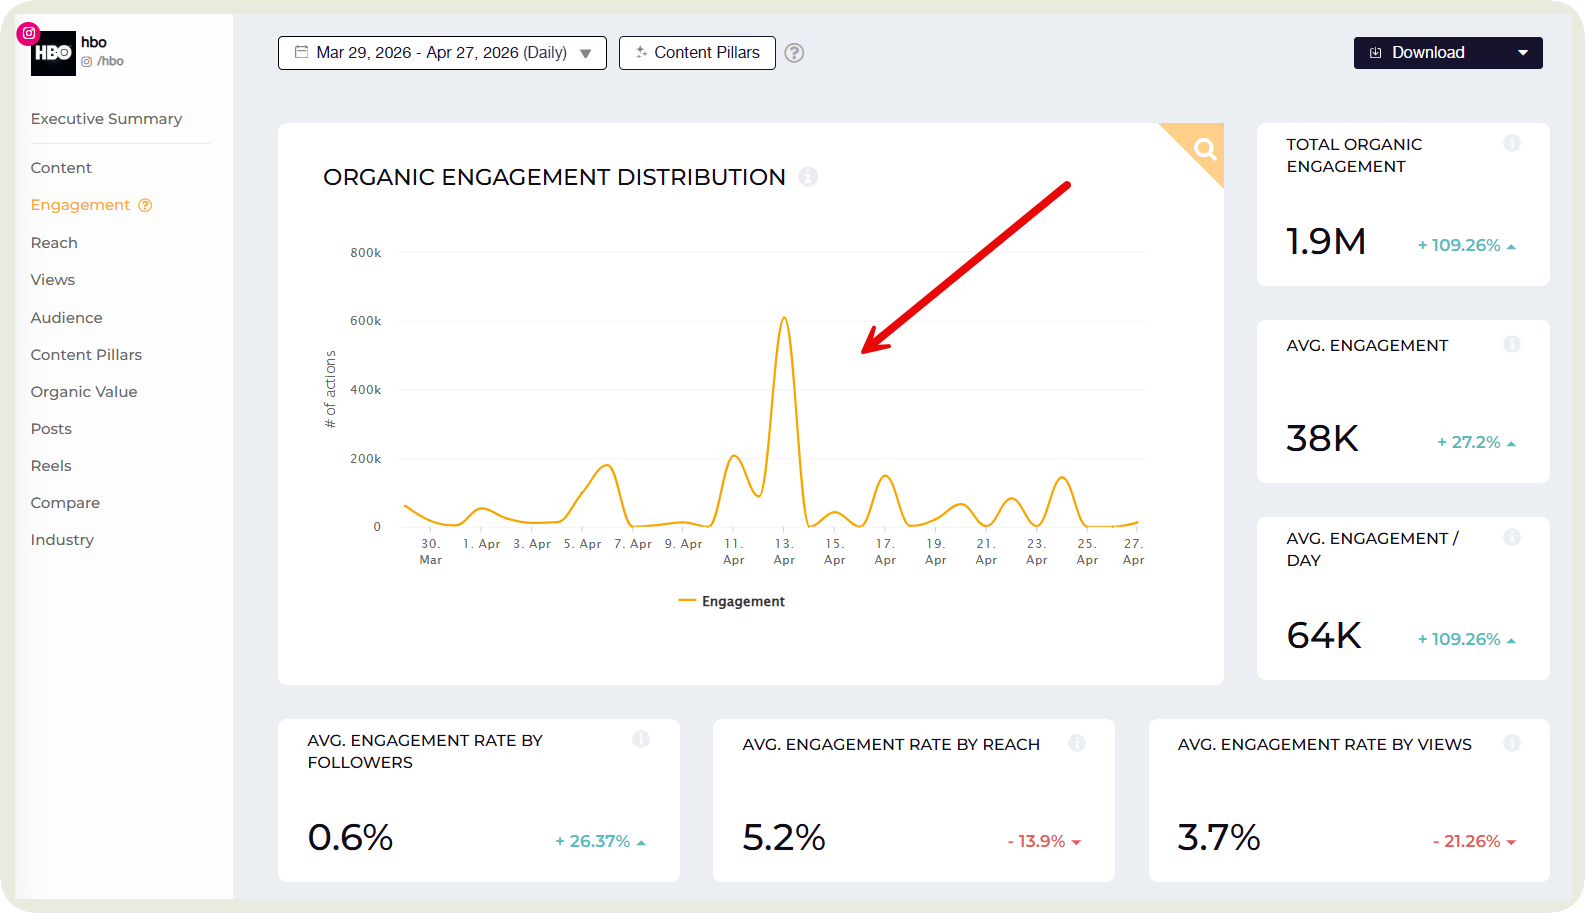
- Analyze key metrics. Once the profiles are added, Socialinsider gives me structured data across all the metrics. For example, here’s how I can see a side-by-side comparison chart for followers growth and engagement.
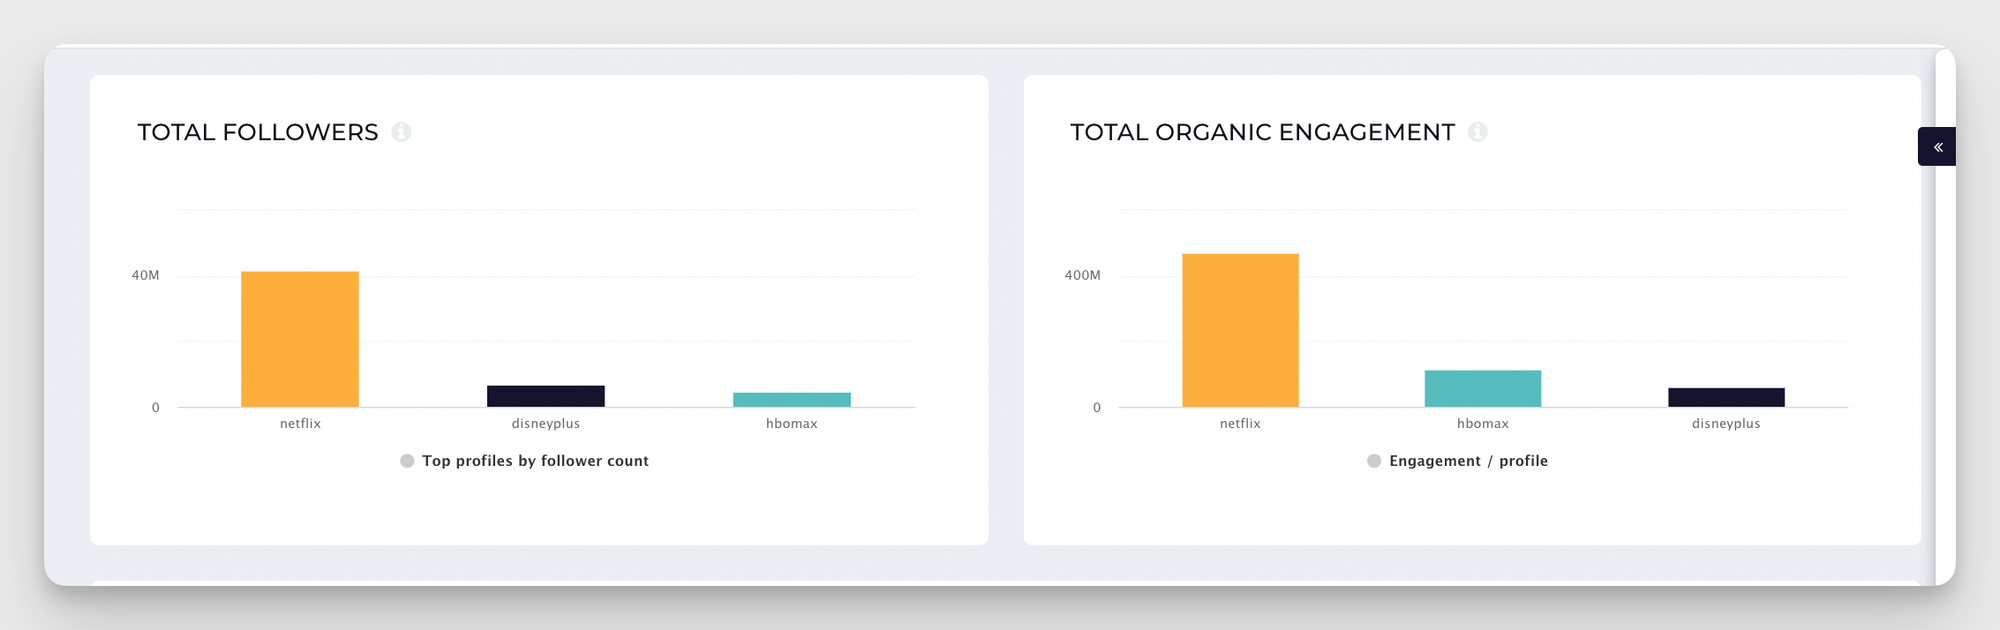
As I am focused on content performance, I can check content pillar engagement, content format engagement, top performing content, all in one tool.
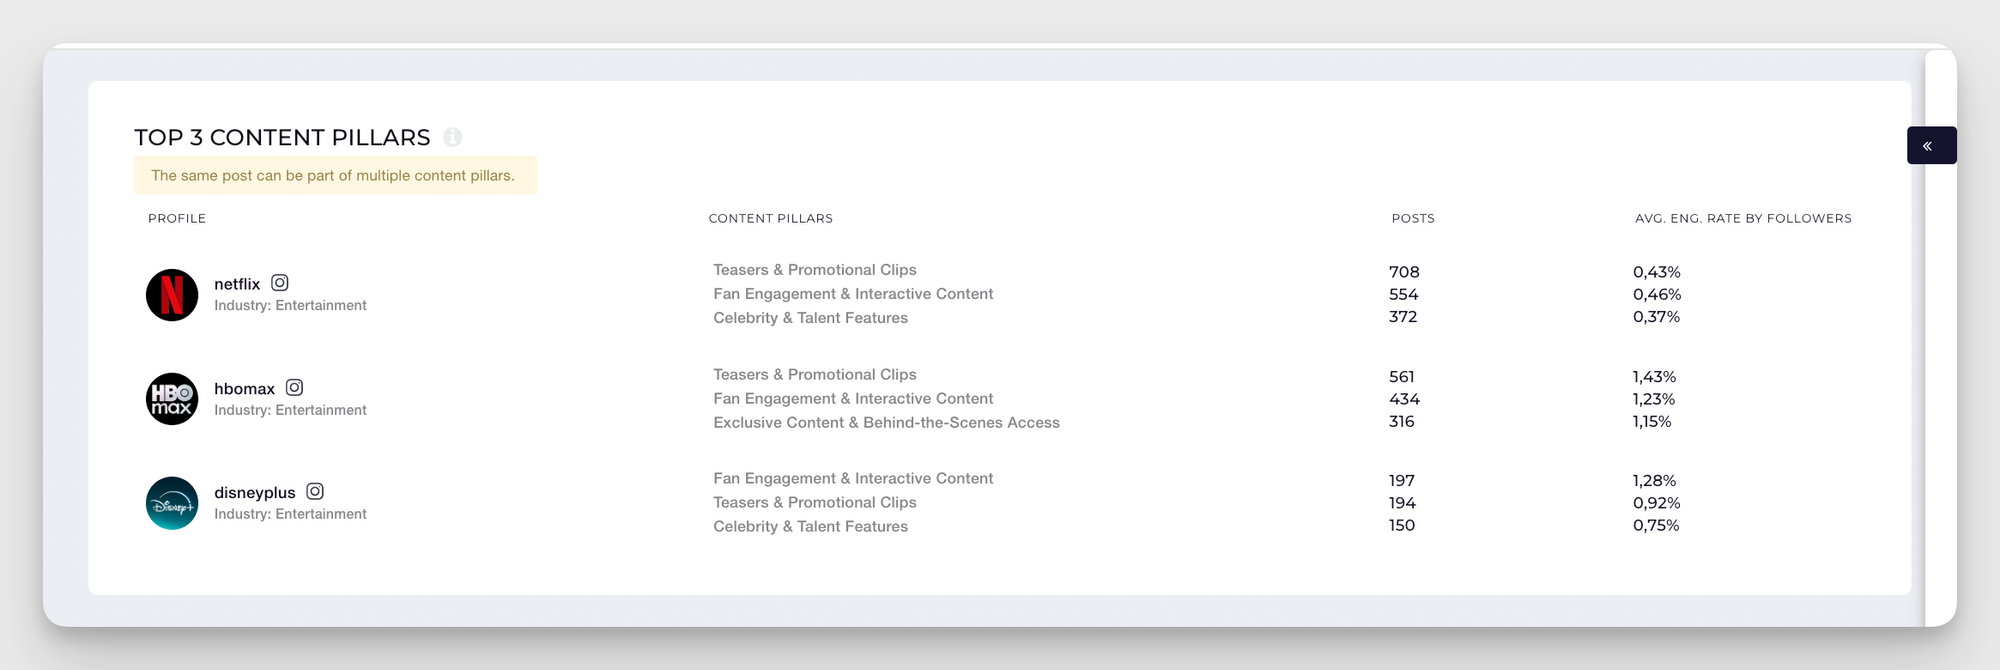
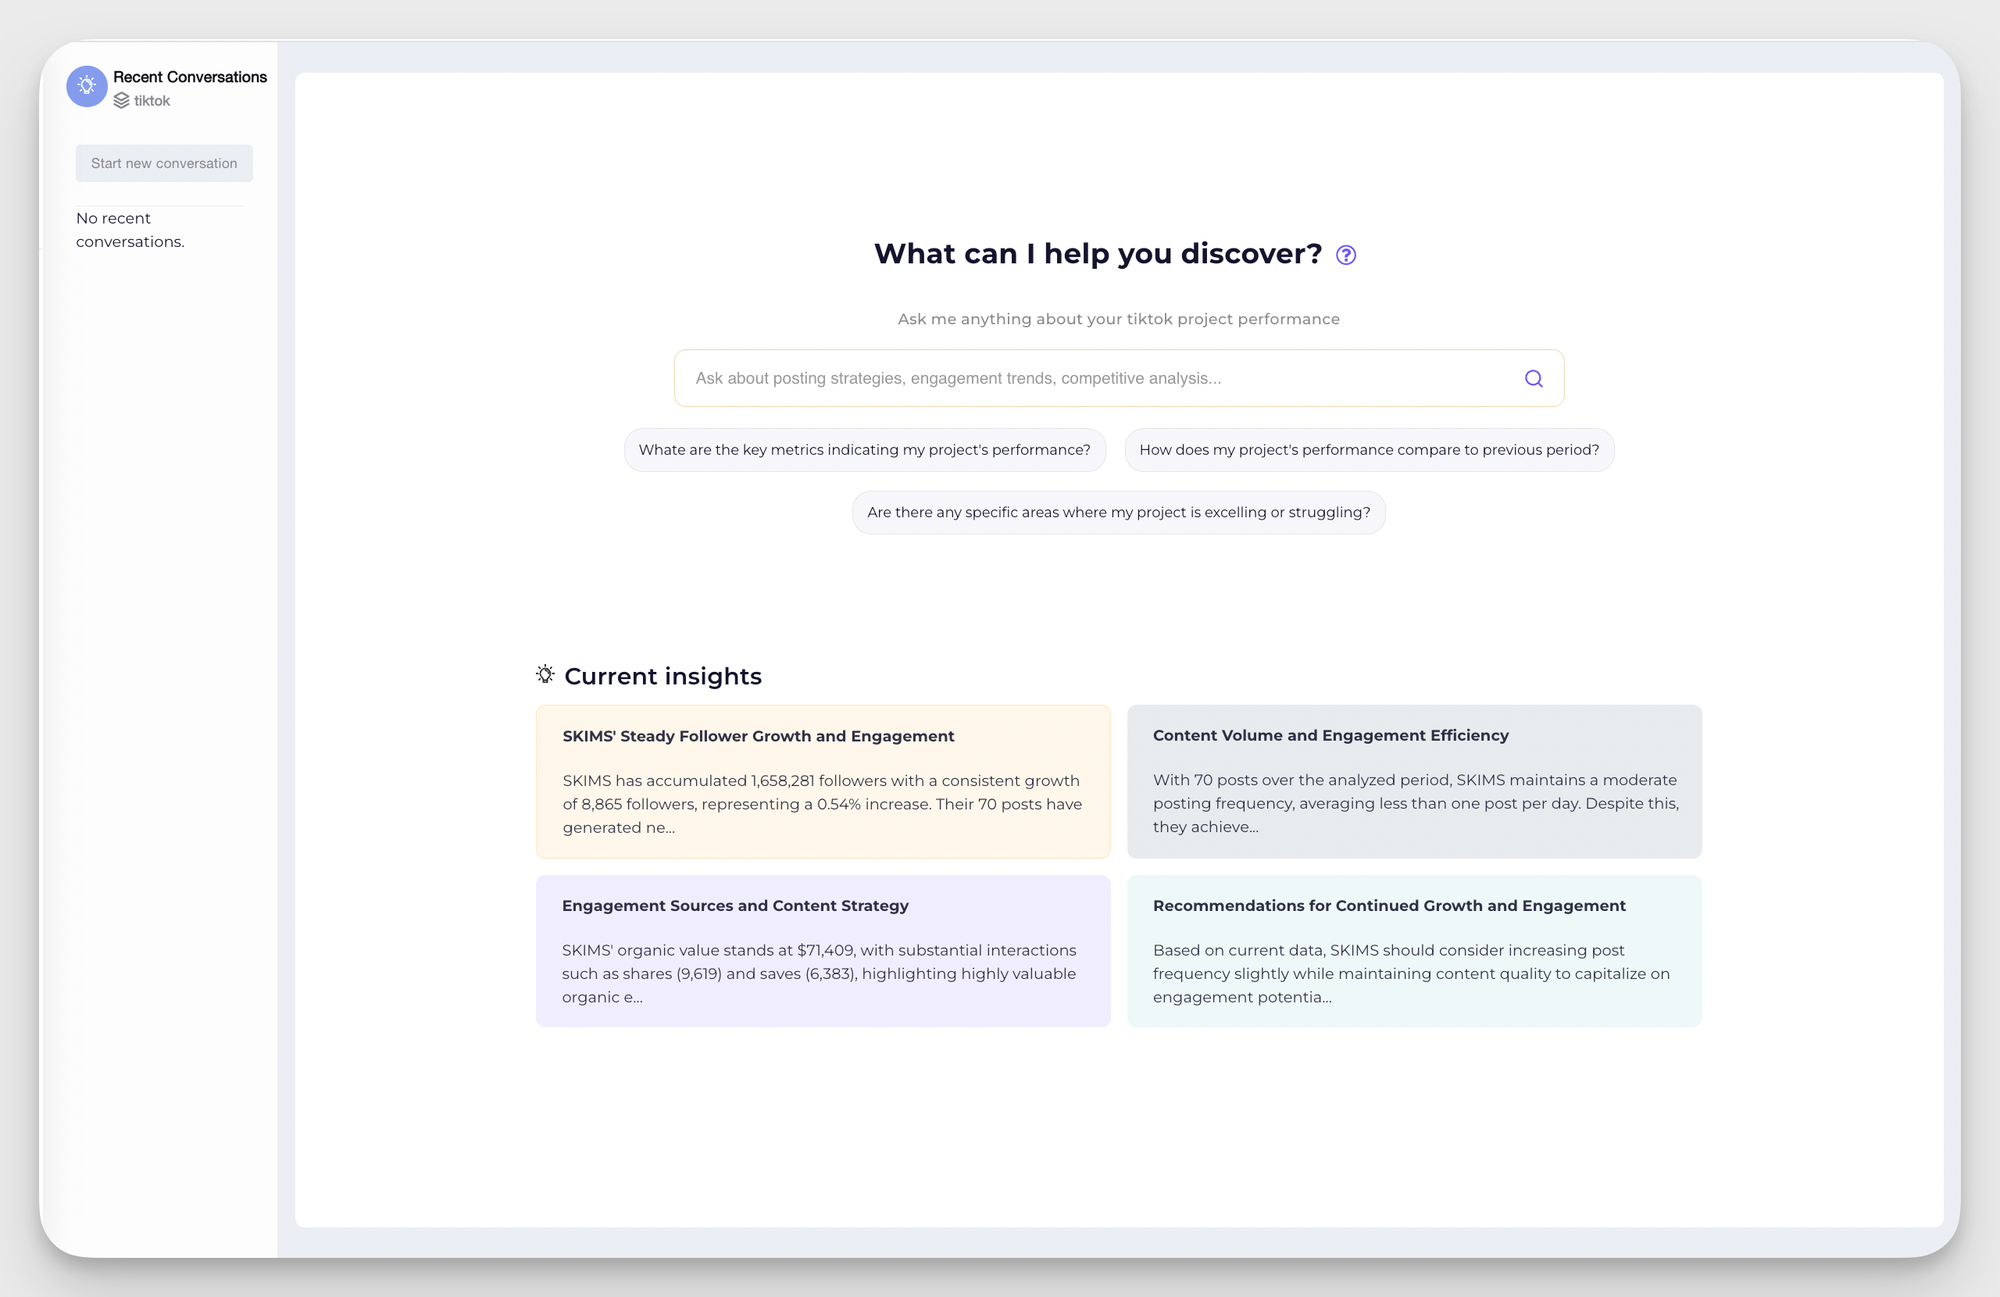
- Turn insights into actions. I take this data and instead of manually analyzing, I first ask Socialinsider AI assistant to suggest what steps to take next. Then I also look at different metrics or comparisons to find out unique points that the assistant might have missed.
How to compare cross-platform performance of brands?
I approach cross-platform social media comparison by first looking at how a brand performs within each platform, and then connecting those insights. The goal is to understand where a brand is strong and how it adapts its strategy.
For example, Socialinsider lets me see brand performance across channels.
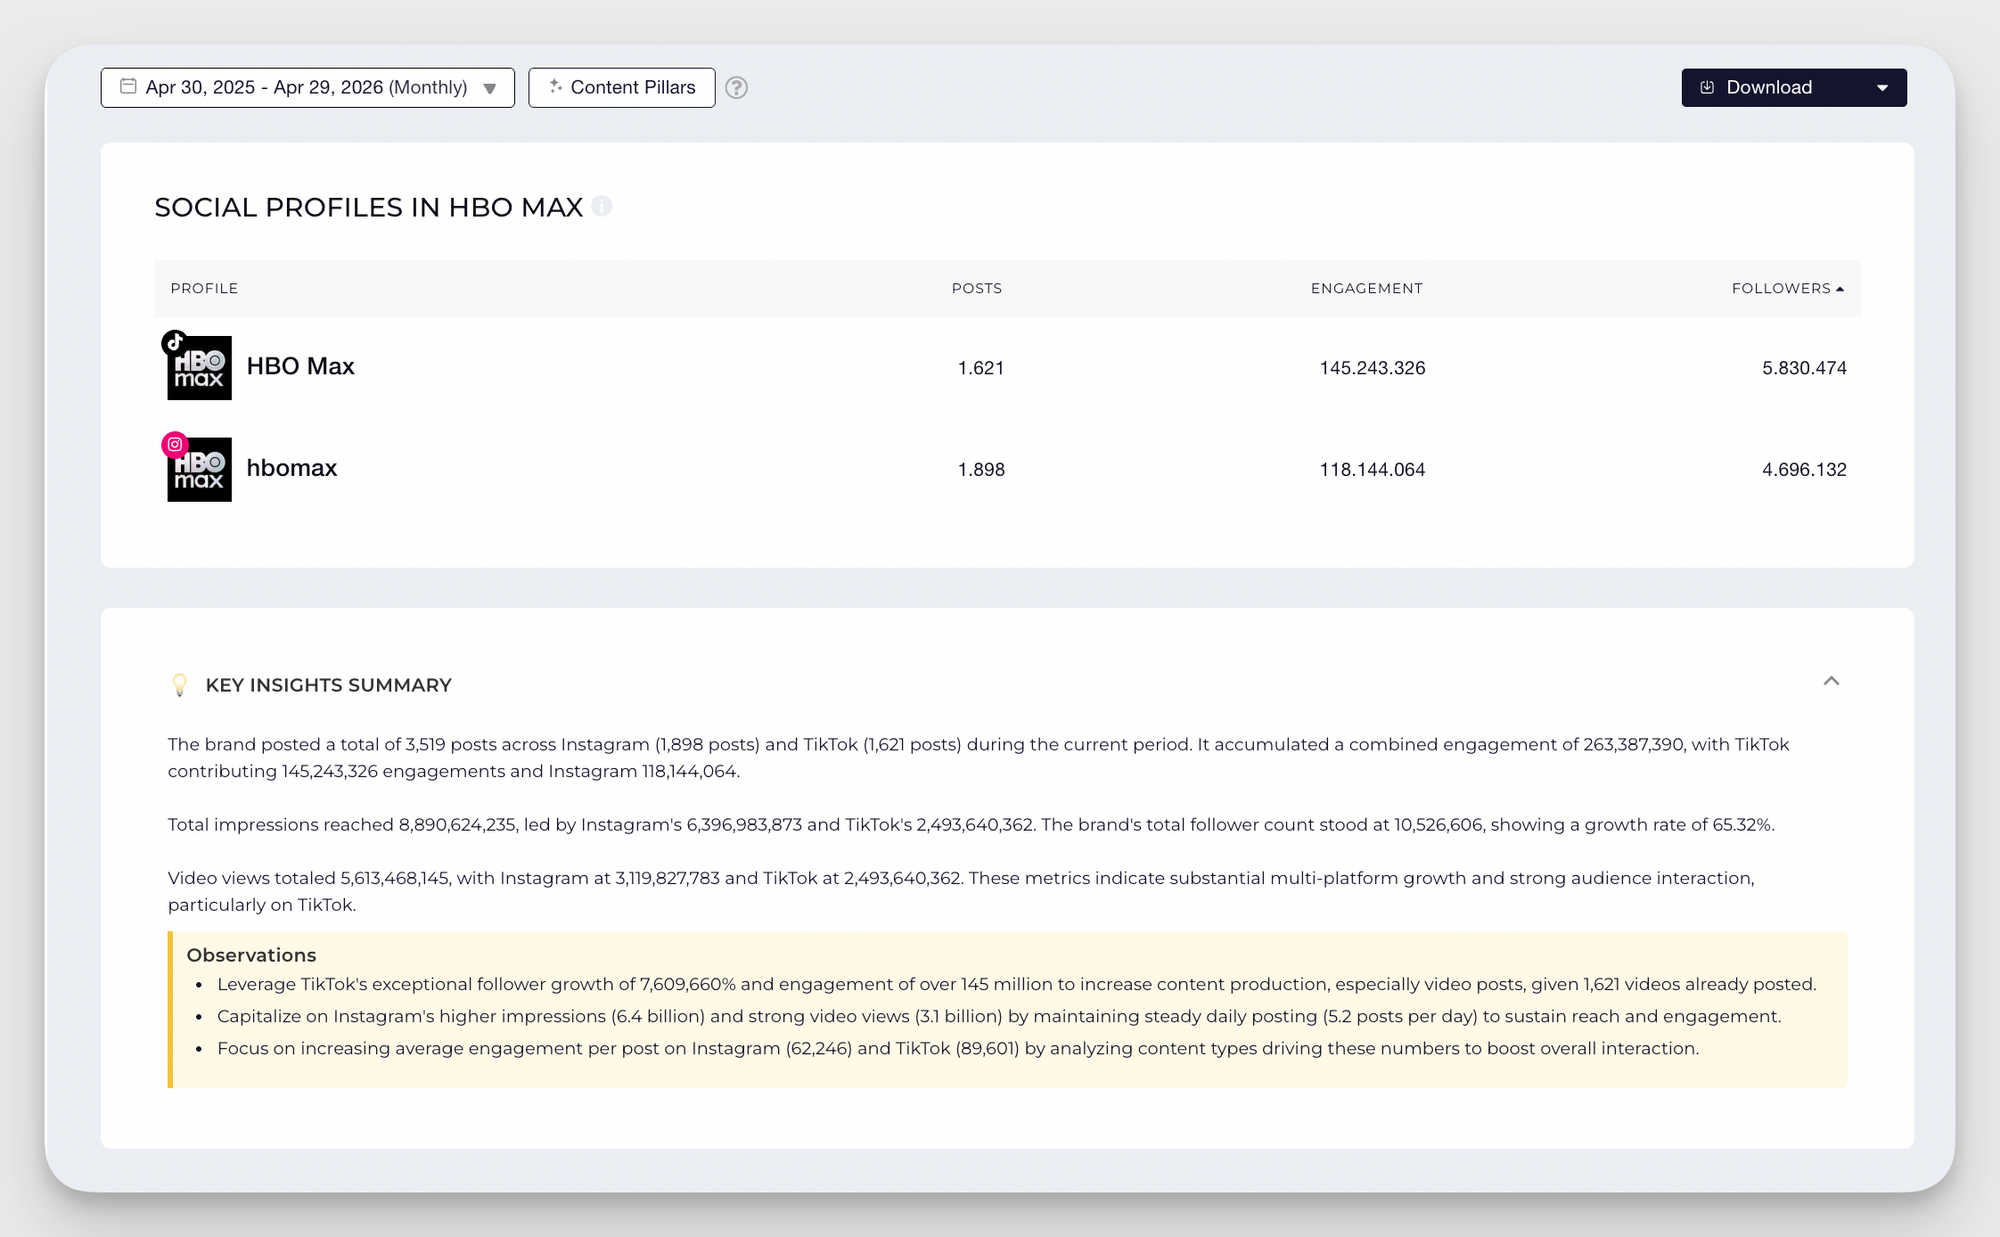
I start by evaluating performance platform by platform: engagement rate, growth, content formats, and posting frequency. For example, a brand might perform strongly on Instagram but see lower traction on LinkedIn. This helps identify platform-specific strengths.
Next, I compare their performance with my own. Are they outperforming me on a particular platform? Are they growing faster or getting higher engagement with similar audience size? This highlights clear gaps and opportunities.
I also analyze how they adapt content. Are they repurposing content differently across platforms? Are they using platform-native formats like reels, carousels, or document posts? This shows whether their strategy is tailored or generic.
Finally, I identify their strongest platform and compare it with mine. If they’re winning somewhere I’m not, that’s an opportunity. If I’m stronger, that’s where I double down.
Which are the top tools to compare social media performance of brands?
Instead of spending days comparing performance, here are three tools that can help.
Native analytics
I turn to native analytics when I want the most accurate, platform-level data. These tools give me access to reach, impressions, saves, shares, and audience insights directly from the source.
Native analytics are great to use when you want to understand how your content performs in detail, especially for metrics like profile visits, clicks, and follower activity. Native dashboards also help you analyze content performance by format and posting time effectiveness. This gives you a strong baseline before I layer in competitor insights from other tools.
Socialinsider
Socialinsider is a social media analytics platform used to compare social media performance across multiple brand accounts simultaneously.
Social media leaders use Socialinsider to benchmark follower growth, engagement rate, reach, views, posting frequency, and content pillar performance across direct competitor accounts and industry averages — all in a single dashboard, without switching between native platform analytics.
Mention
I use Mention when I want to understand visibility beyond owned content. It tracks brand mentions across social media, blogs, forums, and news, which helps me compare how often different brands are being talked about.
I rely on its share of voice analysis to see where a brand stands in the overall conversation. The real-time monitoring and alerts keep me updated on spikes in mentions, while sentiment analysis adds context to the numbers. This helps me compare perception and presence in the market.
How to use AI to compare social media performance of brands
When asked, Denisa had a great perspective on how social media managers should use AI.
AI can be valuable to fast-track data collection, analysis and interpretation in the qualitative phase of your social media reporting. Still, you should be mindful and avoid relying solely on AI. The best way to use it is to guide it with the help of additional questions, societal context, target audience insights and platform particularities
My advice is always remembering AI doesn’t have the knowledge, experience and is unaware of the nuances you as a professional working for the brand has. Even if trained, at the end of the day, it will always execute what you ask. Reason why addressing specific questions to it rather than generic ones will be your game changer. Use it for learning & assisting, don’t let it have the final word. That’s the value you bring to the table.
Here are four ways our team uses AI to compare social media performance of brands.
- Normalize metrics automatically. We use AI to standardize metrics like engagement rate, growth percentage, and engagement per post across brands. It adjusts for audience size and posting frequency, so we can run social media performance comparison performance on equal footing.
- Identify top-performing content patterns. AI helps us quickly analyze large volumes of content to spot what works. We use Socialinsider AI assistant to identify patterns in formats, themes, and engagement drivers across brands without manually reviewing every post.
- Predict future performance trends. We rely on AI to analyze historical data and highlight trends in engagement and content performance. This helps make more informed decisions on what to test and prioritize next.
- Automate data collection across platforms. AI pulls data from multiple platforms into one place, which saves time and keeps the dataset consistent. We use it to streamline
Final thoughts
Comparing social media performance is a way to uncover what’s working, where the gaps are, and how strategies differ in practice. With a clear framework, the data starts to make sense and patterns become easier to spot. You begin to notice which ideas are worth testing, which formats consistently deliver, and where your brand can push further.
To make this comparison easier, you can use tools like Socialinsider that make gathering data and acting on it quicker. Want to take it for a spin? Try Socialinsider’s free 14-day trial.
Nidhi Parikh
Nidhi Parikh is SaaS writer that believes scrolling through social media is research for work. When not working, find her binge watching the latest series or reading anything she can get her hands on.

Know what your competitors do — before your manager asks
Get instant social benchmarks & reports without manual work.