The In’s and Out’s of a Competitive Intelligence Report: What to Include and How to Build One?
Learn how to create an insightful competitive intelligence report with our comprehensive guide. Discover what data is essential for effective reports.


The first time my team lead asked me to create a competitive intelligence report, I didn’t know where to start. Full disclosure, I had very little context at the time, took an unstructured approach, and spent more time than necessary gathering data that didn’t ultimately translate into clear, actionable insights.
You don’t have to make that same mistake—especially since you’re already here.
That experience made one thing very clear to me: a competitive intelligence report is not optional if you want your social media insights to actually influence decisions.
That’s why in this guide, I’ll walk you through what a competitive intelligence report is, what it should include, and how to build one that goes beyond vanity metrics to deliver insights your stakeholders can act on.
Key takeaways
- What is a competitive intelligence report? A competitive intelligence report is a structured document that captures and analyzes your competitors' social media performance, providing stakeholders with the benchmarks they need to make faster, more confident decisions.
- What should a competitive intelligence report include? A strong report includes an executive summary, audience and engagement analysis, content strategy analysis, share-of-voice comparison, SWOT analysis, and recommended actions.
- How do you build a competitive intelligence report? The process runs across seven steps, from defining objectives and selecting competitors to benchmarking performance, calculating organic value, and automating delivery so your team receives consistent insights every quarter.
What is competitive intelligence?
Competitive intelligence is the systematic process of researching and analyzing your competitors to understand how they operate, where they are winning, and where they are falling short.
The word "systematic" is what sets it apart from the usual informal competitor monitoring that most social media teams already do, and having worked with brands across different industries, I can tell you this for free: the biggest mistake brands make is thinking that checking a competitor's profile once in a while counts as competitive intelligence. It does not. What you get from that is raw data, a list of their top posts, but nothing that tells you why they are winning or what you should do differently.
Real competitive intelligence means defining what you want to know, knowing where to find that information, and analyzing it consistently enough to spot patterns over time.
On social media, that translates into understanding not just what competitors are posting but also why certain content is working for them, which audiences they are winning over, and which parts of their strategy are leaving opportunities on the table for you to take advantage of.
Why create a competitive intelligence report for stakeholders?
I want you to imagine your biggest competitor just launched a campaign that is outperforming everything your brand has published this quarter. Engagement is climbing, their follower growth has spiked, and your CMO wants answers in 48 hours.
Without a competitive intelligence report, your team is scrambling through screenshots, exporting raw data from multiple platforms, and trying to stitch together a story that may or may not be accurate. With one already in place, you open a single document that shows exactly what changed, when it changed, and what your brand should do about it.
In a nutshell, competitive intelligence is a great ally for:
- Helping justify budget requests and strategic pivots with concrete benchmarks—not just opinions: When your social media strategy is backed by competitive benchmarks, your recommendations stop sounding like assumptions and start reading like informed decisions. Instead of walking into a planning meeting saying, “We think we should invest more in TikTok,” you’re able to show exactly what competitors are achieving, where the gaps are, and what your brand stands to gain by acting faster. This makes budget requests easier to justify and strategic pivots far more defensible in front of senior stakeholders.
- Making competitive threats visible before they become expensive problems to fix: A structured competitive intelligence report surfaces shifts in competitor behavior early—before they escalate. “Expensive” doesn’t just mean financial cost; it can mean losing market share to a competitor who identified an opportunity first, or being forced into reactive budget reallocations to counter a threat that could have been addressed months earlier. With consistent tracking in place, these risks are flagged while they are still manageable, not when they’ve already impacted performance.
- Turning social media data—often seen as “soft”—into a boardroom-ready strategic asset: Social media metrics are frequently dismissed by finance and leadership teams because they lack context. When those same metrics are presented within a competitive intelligence framework, they become part of a larger strategic narrative. Performance is no longer viewed in isolation, but in relation to competitors and market dynamics—giving your data the same credibility and weight as other forms of business intelligence used across the organization.
- Keeping leadership updated on market shifts without requiring them to dig through raw analytics: Instead of expecting executives to interpret dashboards or sift through platform-specific data exports, a competitive intelligence report consolidates and translates key developments into clear insights. Leadership gets a structured, high-level view of what’s changing in the market, what competitors are doing differently, and what it means for the brand—without needing to engage with the underlying data themselves.
- Building a historical record of competitive positioning that improves planning speed and accuracy: Over time, a well-maintained report becomes a reliable archive of how the competitive landscape has evolved. This eliminates the need to reconstruct past performance from scattered data sources every quarter. Teams can quickly reference what the landscape looked like months ago, identify patterns, and make more accurate projections—making both quarterly and annual planning significantly faster and more grounded in reality.
How does a social media competitive intelligence report help make better business decisions?
Did you know that a competitor can have a well-curated Instagram feed, a consistent posting schedule, and the biggest influencer budget, but still have an audience that is completely disengaged? Now you know, so the next time you see a competitor with a beautifully curated feed and thousands of followers, don’t assume they are winning.
The engagement rate never lies.
When you track brand performance consistently across your competitive set, you can see in real time whether a competitor's content is genuinely connecting with their audience or simply generating hollow impressions. Their engagement rate, their follower growth, their posting cadence — all of it is visible to anyone tracking social media metrics consistently across a competitive set.
What should you include in a social media competitive intelligence report?
Take this from someone who has actually created a competitive intelligence report: it is only as useful as what goes into it. Include too little, and stakeholders walk away with questions. Include too much, and the insights get buried under data. The sections below cover everything a well-structured report needs to give decision-makers a complete and actionable picture of where your brand stands relative to the competition.
- Executive summary: This is one of the sections I paid close attention to when creating mine because I know it is the first thing stakeholders will read and often the only section some of them will read in full. Every word in it has to earn its place, and my advice to you is to approach it with that same mindset, because it is the section that will either draw decision-makers into the rest of the report or give them an excuse to stop reading.
Think of it as the front door to your entire competitive intelligence framework. If it does not immediately communicate why the findings matter and what the business should do about them, the rest of the report risks being skimmed rather than acted on.
For market and competitive intelligence reporting to actually influence strategy, this is where that influence begins, and I can’t stress this enough. A strong executive summary captures the most important competitive shifts from the reporting period, highlights the most important metrics, and closes with a clear set of recommendations that tell decision-makers exactly what needs to happen next.
- Audience and engagement analysis: This section looks at how competitors' audiences are growing and how actively they engage with content across platforms. I will be honest with you: when I am building my competitive intelligence report, this is the section that surprises me the most because of the numbers. You might think a competitor is dominating based on their follower count, but their engagement rate is exposing just how little their audience actually cares.
And a piece of advice: it is also worth looking beyond the overall engagement number and examining what type of engagement a competitor is generating. A comment requires far more effort from a user than a like, and a share signals that the content resonated strongly enough for someone to put their own name behind it, and both of those signals matter far more than a follower count.
- Content strategy analysis: Beyond what competitors are posting, this section examines how they are posting, covering content pillars, formats, and posting cadence across channels. It is also the section where most competitive intelligence reports move from merely descriptive to genuinely useful.
A content competitor analysis at this level means looking at content distribution patterns, specifically whether a competitor relies more heavily on short-form video, carousels, or static posts, alongside audience behavior signals like which posts are generating saves and shares rather than just passive likes. Since I realized this, I have stopped looking at what competitors are posting and started asking why certain content consistently outperforms others, and that has changed how I approach analysis.
In my opinion, this is one of the most valuable parts of any competitive intelligence report because it stops being about what your competitors are doing and starts being about what is actually working in your industry. This is the kind of social media content insight that has helped me move beyond surface-level observations to identifying the patterns that make a competitor's performance repeatable.
- Share of voice comparison: Share of voice shows how much of the total conversation in your market your brand owns compared to competitors. It is one of the most honest measures of brand visibility available in social media market research because it not only shows how you are performing in isolation; it also shows how you are performing relative to everyone else competing for the same audience's attention.
To understand why this matters, consider a scenario where your brand's engagement has grown 15% quarter over quarter. Without share-of-voice data, that looks like a strong result. But if a competitor in the same period grew their share of the total market conversation by 40%, your 15% growth is not a win; it is a signal that you are losing ground even though your own numbers are improving. This changes how stakeholders interpret performance data and how urgently they respond to it.
As part of your competitive intelligence and analysis, share of voice should be tracked consistently over time rather than measured as a one-off snapshot. A single data point tells you where you stand today. A trend line tells you whether you are gaining or losing ground in your market, and that information can drive strategic decisions.
- SWOT analysis: A social media SWOT analysis applied to your competitive set gives stakeholders a structured view of where each competitor is strong, where they are vulnerable, where opportunities exist for your brand to move into, and which competitive threats need to be addressed before they become more problems to solve.
Remember when I mentioned that I was tasked with creating a competitive intelligence report? When I did mine, the SWOT analysis was the section that directly changed our content strategy. I noticed that our competitor's highest-performing content was memes and relatable community posts, but they had no real community infrastructure or content depth to back them up. Meanwhile, we had both, but we were producing so much educational content that our audience was not responding to it the way we had hoped. Our memes and community posts were gaining traction, and we had not paid enough attention to that signal.
That is exactly what a SWOT analysis is supposed to do. It forces you to move from observation to interpretation and gives you a clear, evidence-based reason to make a strategic decision you might have otherwise second-guessed.
A competitor's strengths might include a loyal, vocal community that consistently engages with their content or a distinct content voice that is genuinely difficult to replicate. Their weaknesses might show up as an over-reliance on paid reach with very little organic staying power or a posting frequency that drops significantly on platforms where their audience is most active.
Used consistently as part of your competitive intelligence techniques, a SWOT analysis ensures that every competitive intelligence report your team produces closes with a strategic picture that stakeholders can use to make decisions.
And by the way, all of these components can be built directly inside Socialinsider's AI assistant, without any manual data pulling or spreadsheet work.
- Key takeaways and recommended actions: This is where the report earns its place in a strategy meeting. Rather than summarizing what the data showed, this section should tell stakeholders exactly what to do about it. If a competitor's TikTok engagement rate jumped 49% while yours stayed flat, the recommended action is not "consider investing in TikTok." It is to audit which content formats drove that growth, identify the specific content pillars they are using, and test those formats against your own audience within the next 30 days. Every insight in the report should map to a specific next step with a clear owner and a timeline; otherwise, the report ends as a document people read once and never return to.
How to build an insightful social media competitive intelligence report?
If your team needs a competitive intelligence report, but you’re not sure where to start. The steps below walk you through the entire process, from setting your objectives to automating delivery, so your report becomes a reliable part of how your team tracks and responds to the market every single quarter.
Step 1 – Define your objectives and select competitors
The biggest mistake you can make before building a competitive intelligence report is jumping straight into the data.
Most social media managers I know, myself included, have made this mistake at least once. You open a competitor's profile, start pulling numbers, and before you know it, you have a spreadsheet full of data that does not answer a single question anyone in the room actually cares about.
Before anything else, define what you want your competitive intelligence report to achieve. Your objective could be any of the following:
- Understanding why a competitor is outperforming you on a specific platform
- Identifying content gaps, your brand can move into before competitors do
- Benchmarking your social media performance against industry standards to justify a budget request
- Tracking how a competitor's audience is growing to anticipate their next strategic move
The clearer your objective, the more focused your report will be. Once that is clear, choosing the right competitors becomes straightforward. I strongly advise that you do not track more than three to five direct competitors at a time. A focused set of brands that are directly competing for the same audience attention you are will always produce sharper insights than a broad list of ten brands that only loosely sit in your category. Use your social media goals as your filter and keep the list tight.
Step 2 – Choose the right platforms to analyze
Not every platform deserves equal attention in your competitive intelligence report, and trying to cover all of them at once is one of the fastest ways to end up with a report that is wide but shallow. The right approach is to prioritize the platforms that are most relevant to your business objectives and where your competitors are pulling ahead.
That second part is very important. If a competitor is significantly outperforming you on TikTok, that platform deserves a closer look, regardless of whether it is currently a priority for your brand. It might be the most valuable signal in your entire report, revealing an untapped opportunity your team has not yet fully committed to.
A useful way to approach platform selection is to split it into two categories. The first is the platforms you are already active on, where the goal is benchmarking your performance directly against competitors. The second is the platforms where competitors appear to be gaining traction that your brand has not yet fully committed to, because those are often where the most valuable competitive intelligence data lives.
Step 3 – Gather your social media competitive data
This is where your competitive intelligence gathering process becomes concrete. This is the step I underestimated the most when I built my first report. I pulled every metric I could find, thinking more data meant a better report.
Knowing what data to collect is just as important as knowing how to collect it. These are the core metrics your competitive intelligence report should track and what each of them actually mean:
- Followers and follower growth show whether a competitor is building momentum or plateauing.
- Engagement rate shows whether their audience is connecting with their content or just passively scrolling past it.
- Reach and video views reveal how far a competitor's content is traveling beyond their existing audience.
- Posting frequency gives you a baseline for how many resources a competitor is putting into a platform and whether they are pulling back or doubling down.
Step 4 – Analyze competitor content strategy
Knowing that a competitor is posting frequently and generating strong engagement is useful, but I will tell you from experience that it is not enough. If you stop here, you will make a costly mistake.
This is where analyzing competitors' content strategy goes beyond counting posts and begins to examine the themes, formats, and topics that are genuinely connecting with their audience. At a brand level, you want to understand which content pillars a competitor is investing in across all their channels and which ones are delivering the strongest returns.
At a channel level, you want to see how that content strategy changes from platform to platform, because a brand that leads with product education on Instagram might be leading with influencer collaborations on TikTok, and that tells you how they are thinking about each audience.
At a brand level, including multiple channels
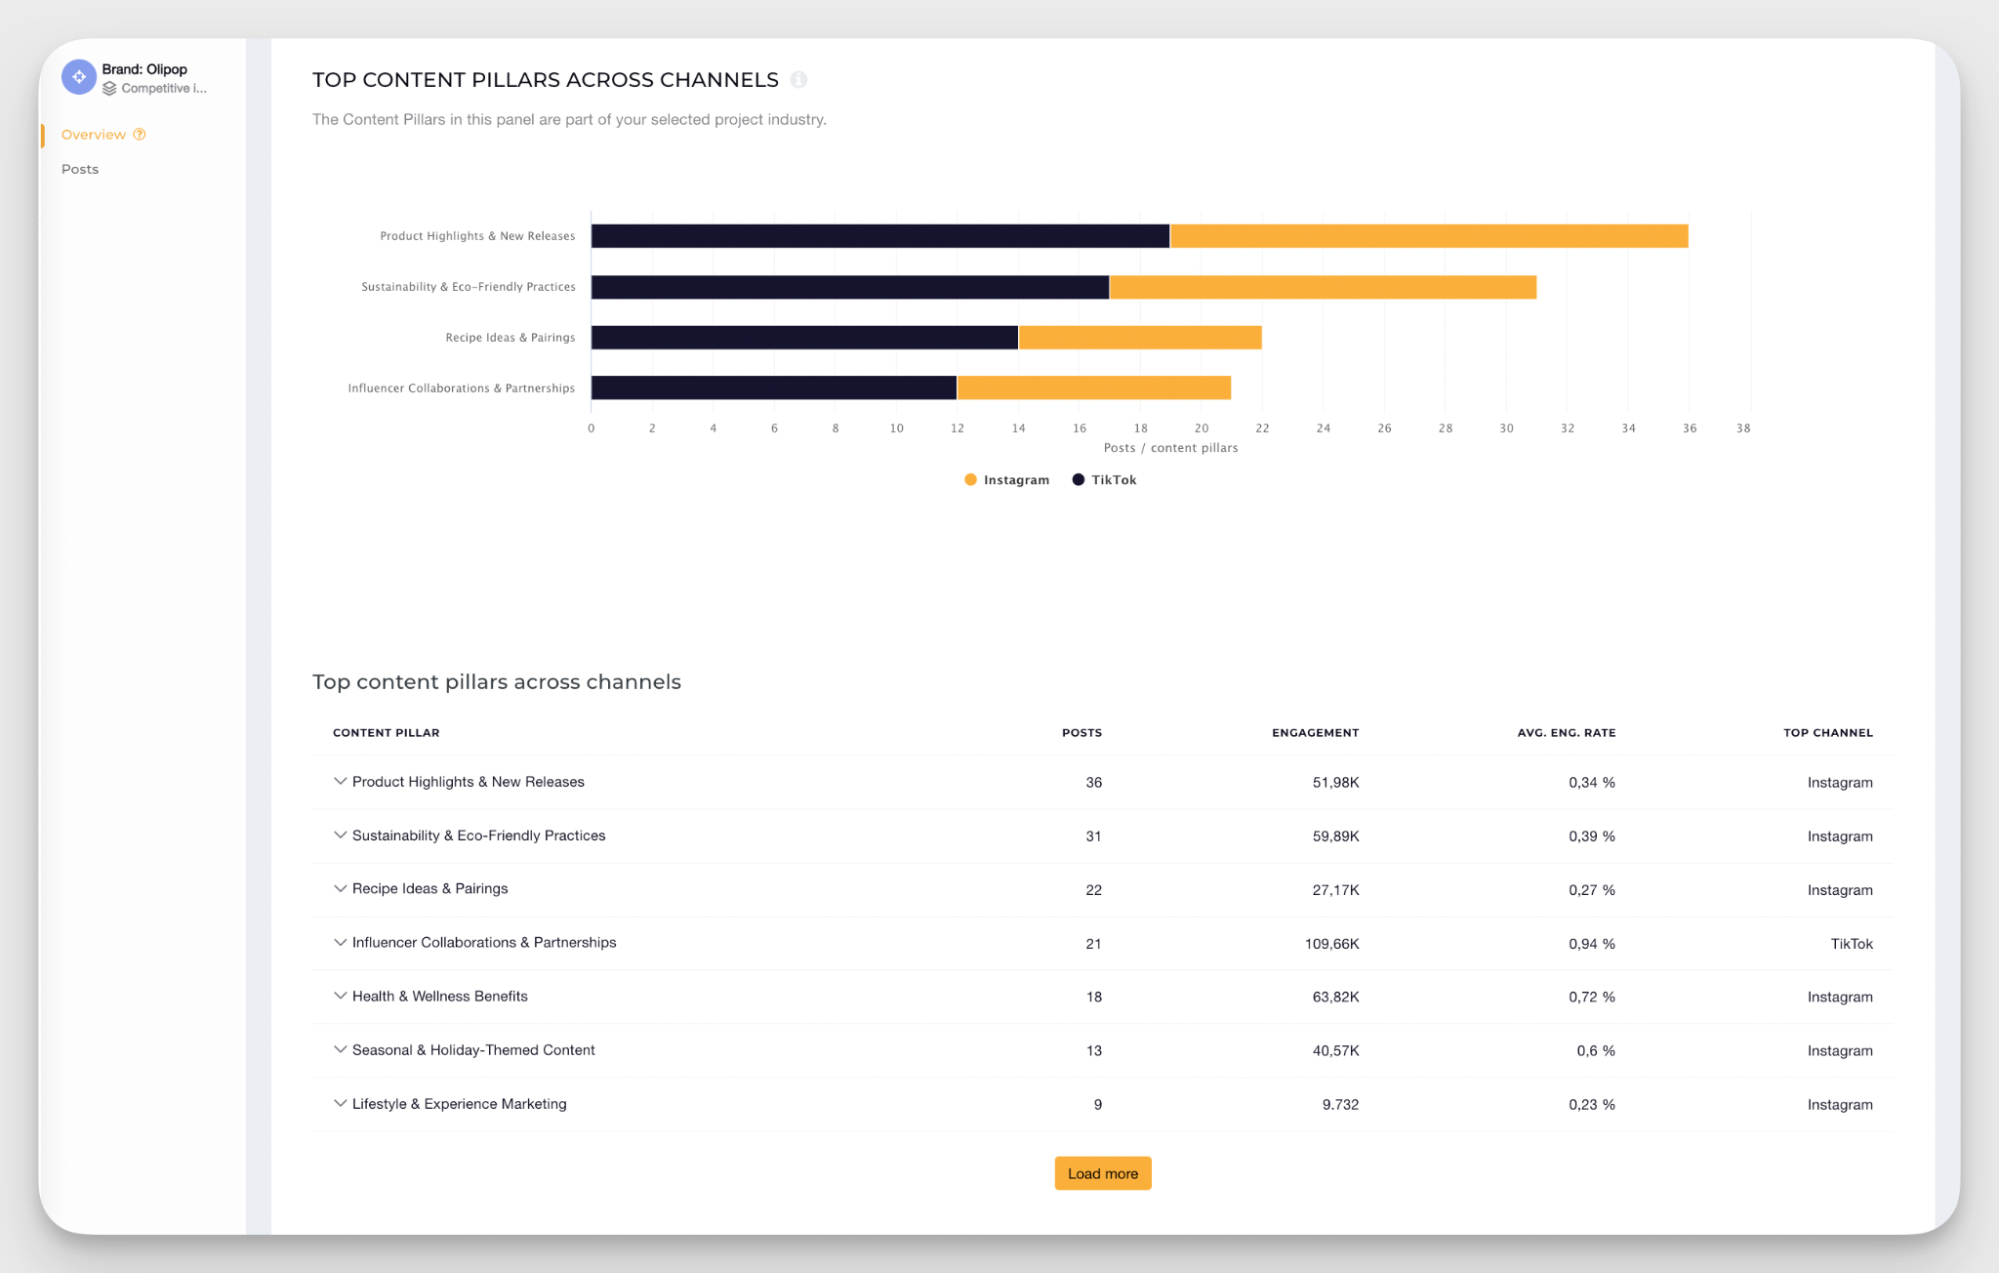
Socialinsider's AI-based content pillars feature automatically groups your competitor's content into industry-specific themes, showing you exactly how many posts they have published per pillar, what engagement each pillar is generating, and which channel is driving the strongest results for each content category.
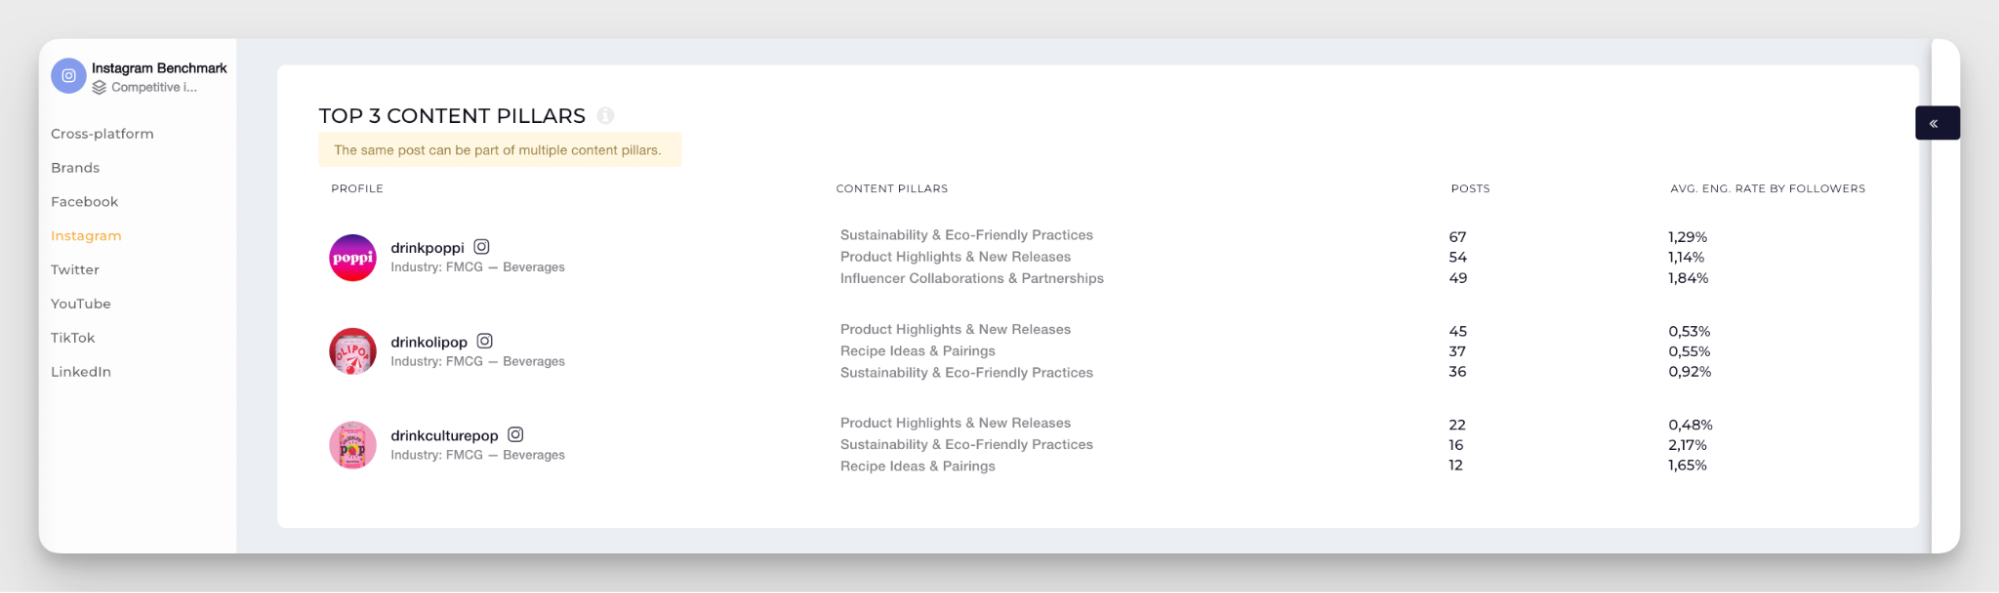
At a channel level, including multiple brands
- Head to the Benchmarks section inside Socialinsider and select the platform you want to analyze
- Select the brands in your competitive set
- Socialinsider will automatically surface the top three content pillars for each brand on that platform, showing you the number of posts per pillar alongside the average engagement rate by followers for each one
This is particularly powerful for identifying content gaps, the topics and formats your competitors are either ignoring or underinvesting in, that your brand could move into.
Step 5 – Benchmark performance with industry context
Comparing your brand directly against competitors gives you a useful picture, but it only tells half the story. Without industry context, you can’t tell if a drop in your engagement rate is a you problem or something the entire market is experiencing. That is where competitive benchmarking becomes essential to your competitive intelligence framework.
Industry benchmarks add a third layer of context to your competitive intelligence report. Instead of just asking, "How are we performing against Competitor A?" you are asking, "How is our entire competitive set performing against what is normal for this industry on this platform?"
To better understand this, the Socialinsider 2026 social media benchmark report puts this into sharp perspective. TikTok registered a 49% increase in average engagement rate between 2024 and 2025, climbing from 2.50% to 3.70%, while Instagram's engagement rate remained at 0.48% and Facebook remained flat at 0.15%.
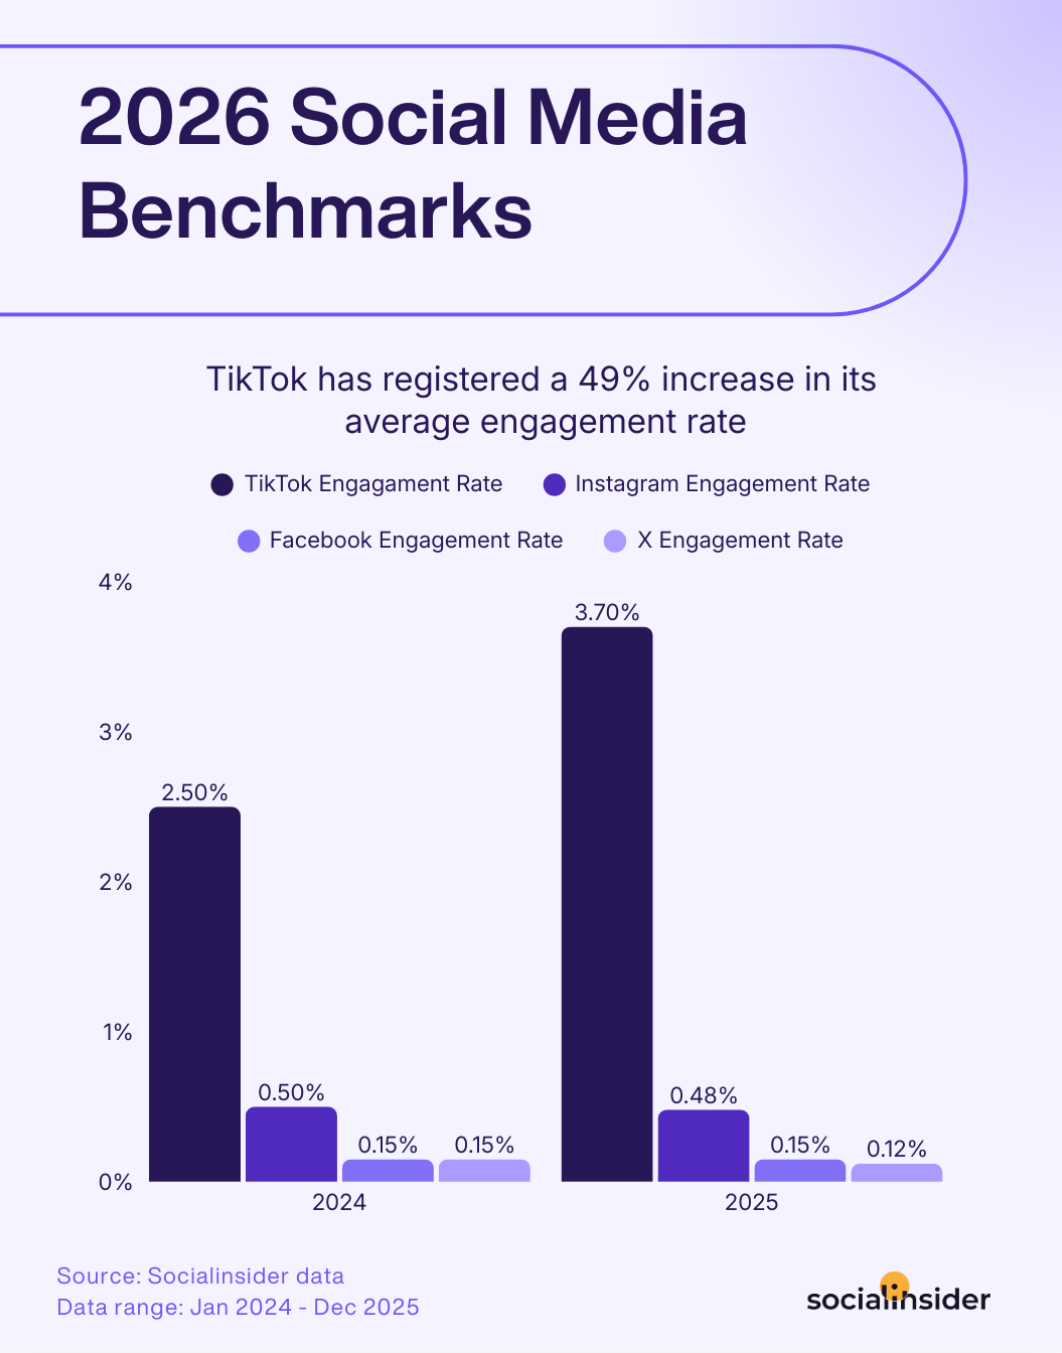
If your competitive intelligence report shows that a competitor's TikTok engagement dropped during the same period, that context indicates they are underperforming on a platform that is growing strongly across the board, which is a much more significant signal than a drop in isolation would suggest.
The same logic applies to posting frequency. Brands are now posting an average of 5 posts per week on both Instagram and TikTok, with X seeing the most dramatic increase, rising from 50 posts per month in 2024 to 70 in 2025.
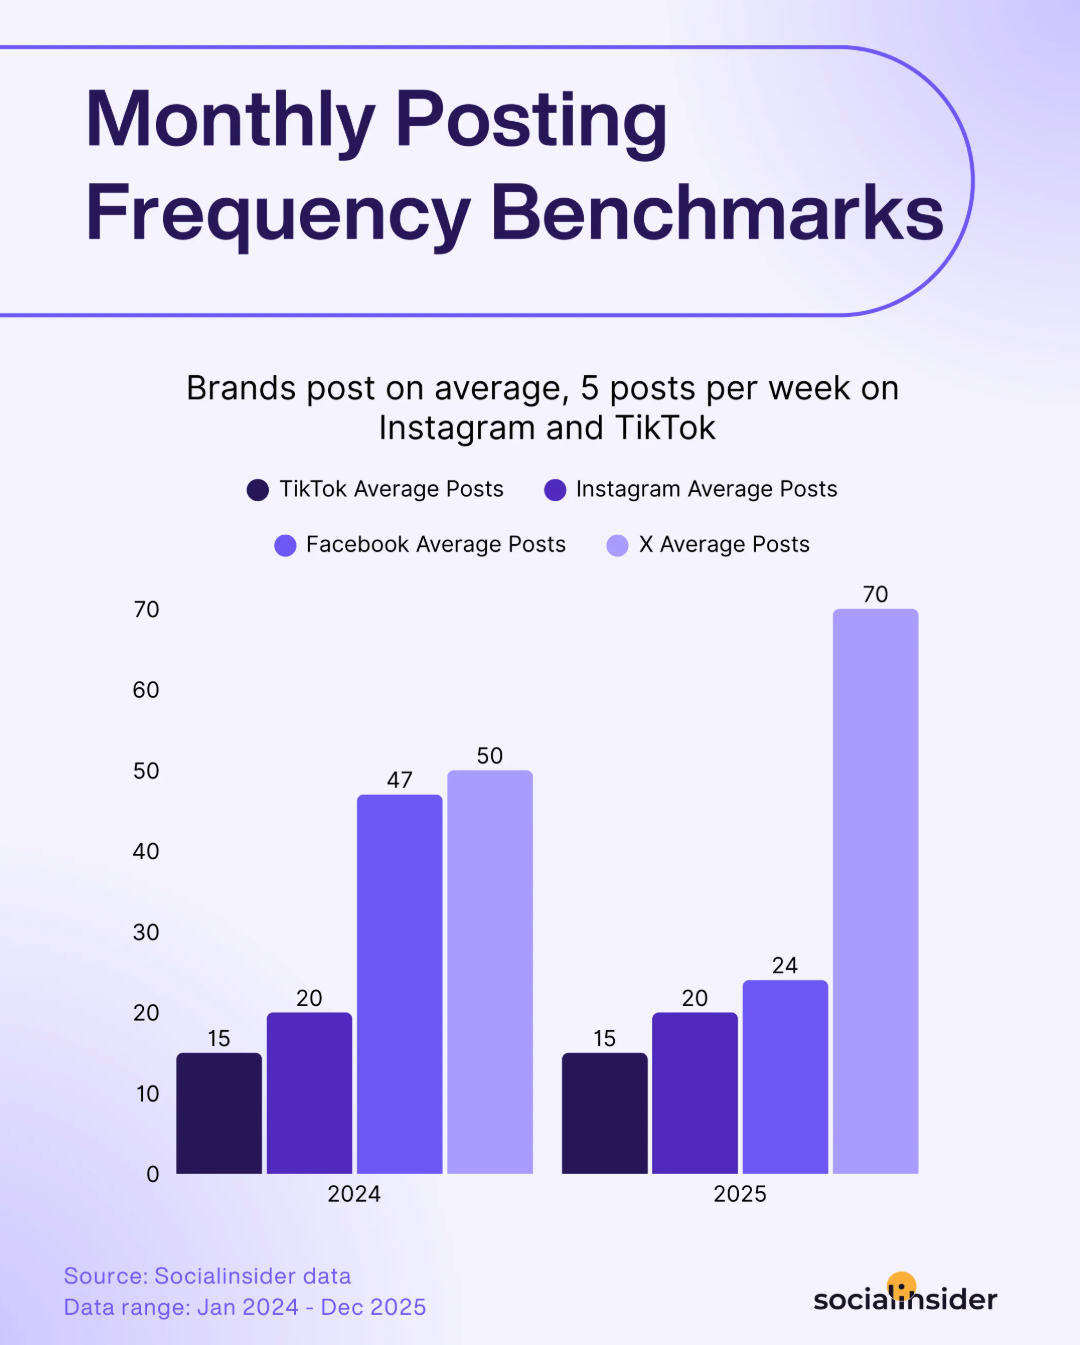
If a competitor in your set is posting significantly below that average, they are either pulling back their investment or struggling with content production, and either one is an opportunity your brand can move into.
For a more complete performance picture, Socialinsider's social media benchmarks reports give you access to industry-wide data across platforms so you can contextualize every metric in your competitive intelligence report against what is actually normal for your category, not just what your closest competitors happen to be doing.
Step 6 – Calculate and compare organic value
One of the most persistent challenges social media teams face when presenting a competitive intelligence report to stakeholders is determining what organic social media is actually worth in business terms, and this challenge is one I can relate to. You already know how hard it is to walk into a room full of decision-makers who think in terms of revenue and cost and try to convince them that engagement rate matters. Engagement rates and follower growth make perfect sense to us, but to a CFO or a CMO focused on the bottom line, those numbers can feel abstract and hard to act on.
Organic value solves that problem by translating your social media performance and your competitors' into a monetary equivalent, specifically what it would have cost to generate the same level of reach and engagement through paid media. When you can show a stakeholder that a competitor generated the equivalent of $11 million in organic value across Instagram and TikTok in a single period, that number is more important to a CFO than an engagement rate.
Taking Olipop as an example, their Instagram generated 7M in organic value, while TikTok contributed 3M, bringing their total organic value across both platforms to 11M for the period analyzed.
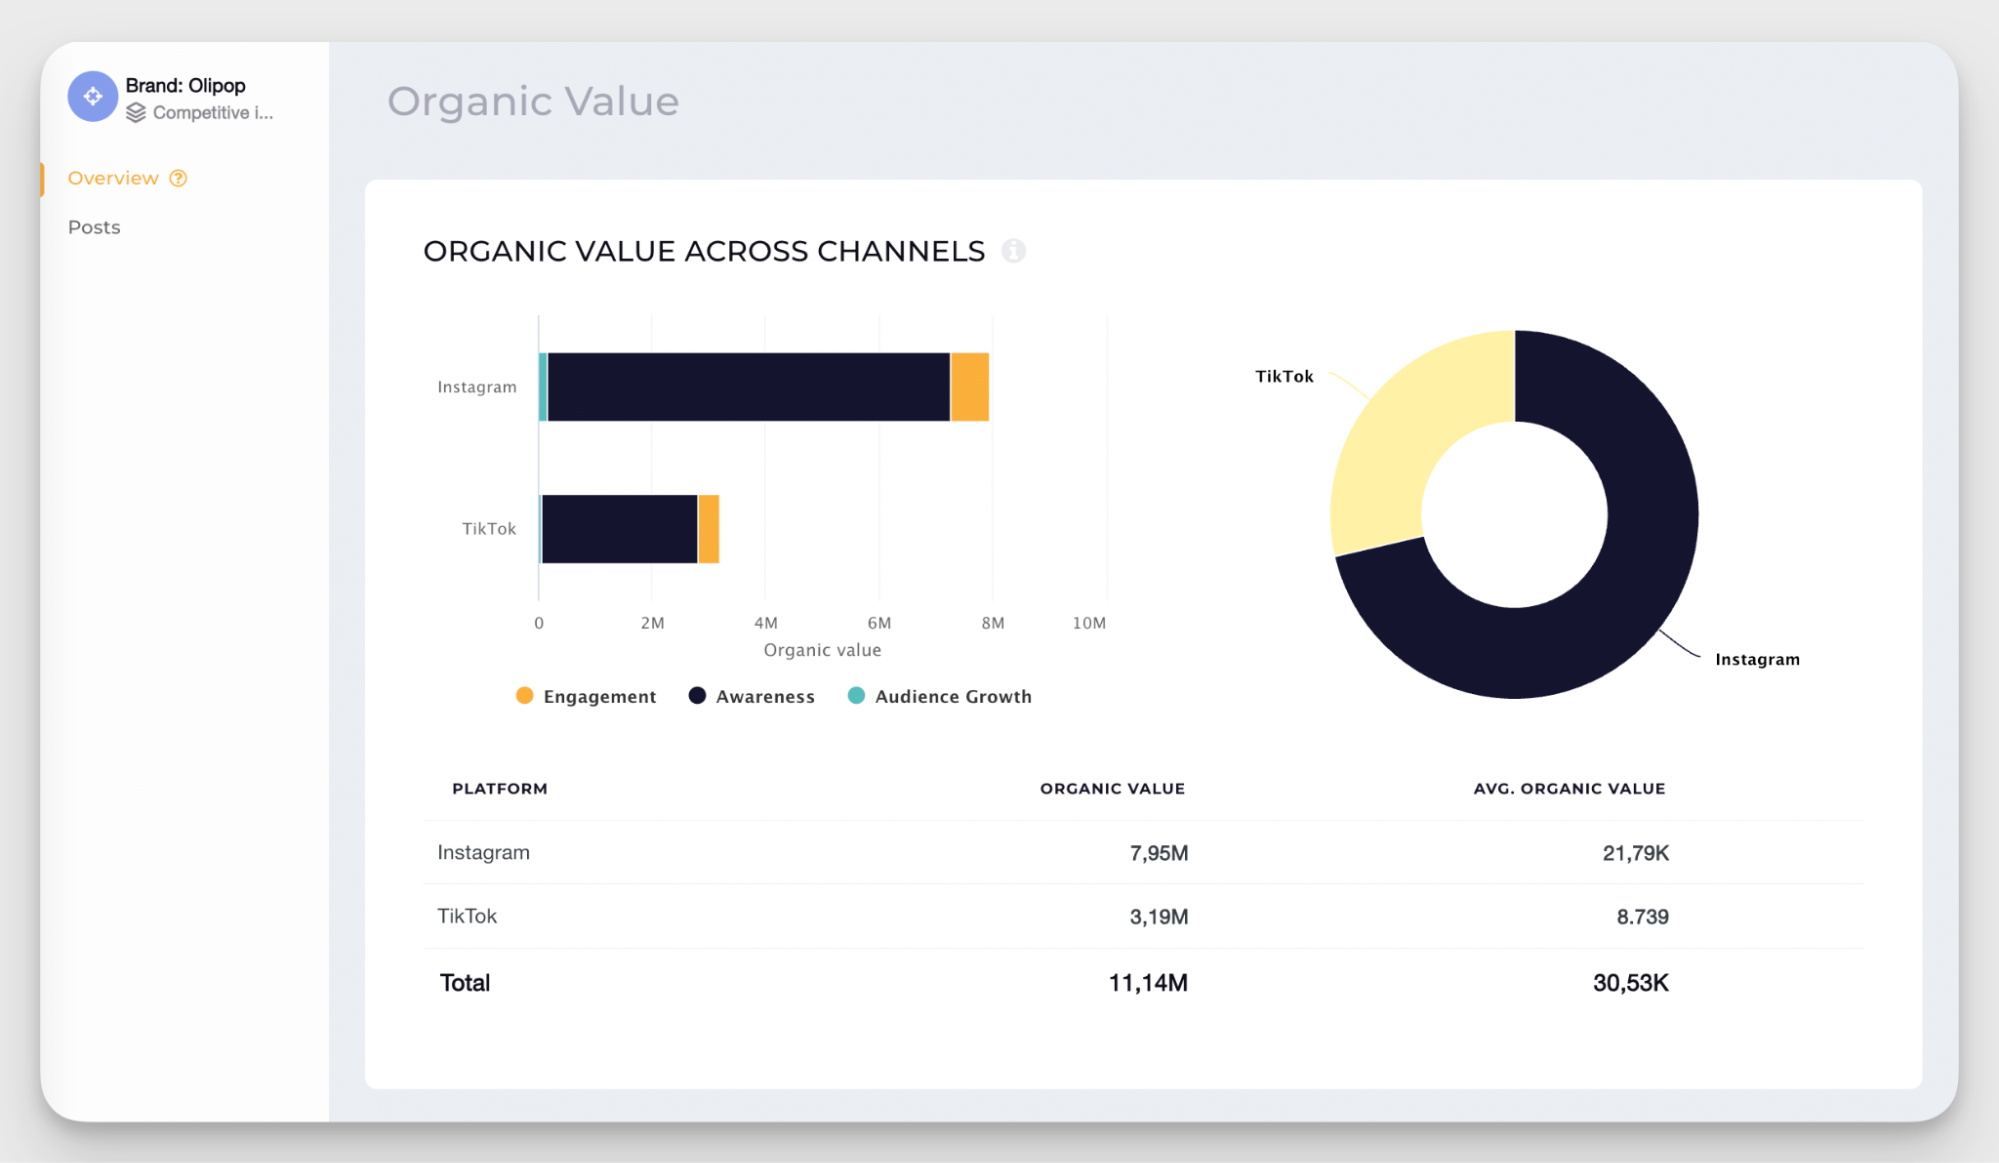
Calculating this at the brand level and comparing it across your competitive set adds a dimension to your competitive intelligence report that speaks directly to what stakeholders care about most, turning social media into a channel that produces measurable business value your organization can track over time.
Step 7 – Build the report and visualize findings
This is where everything you have gathered, analyzed, and benchmarked across the previous six steps comes together into a document that stakeholders can actually read, understand, and act on.
A strong competitive intelligence report leads with the executive summary, moves through the data in a logical sequence that builds toward a clear conclusion, and closes with specific recommended actions that tell decision-makers exactly what needs to happen next.
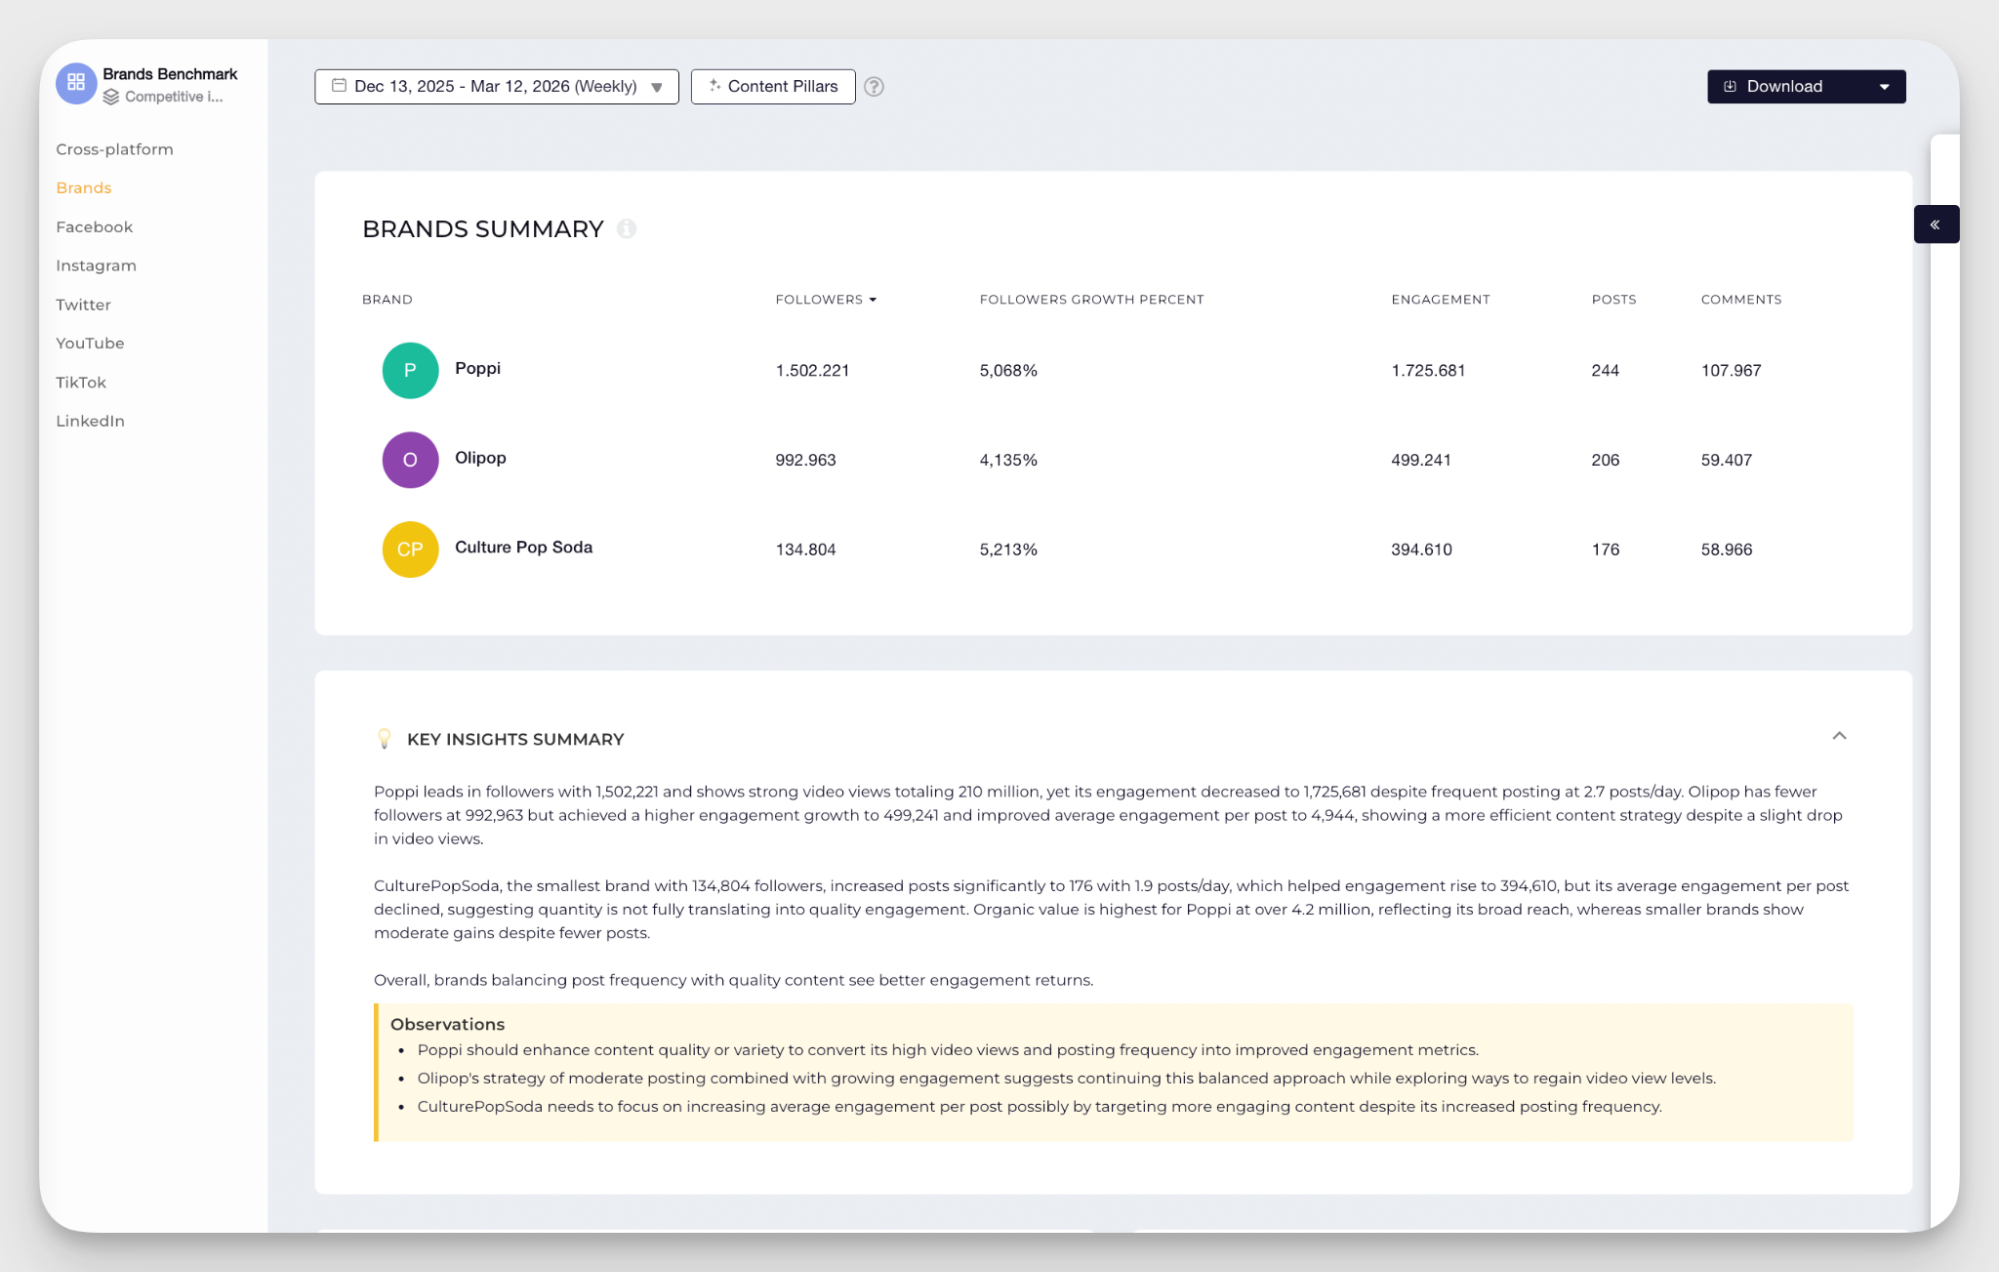
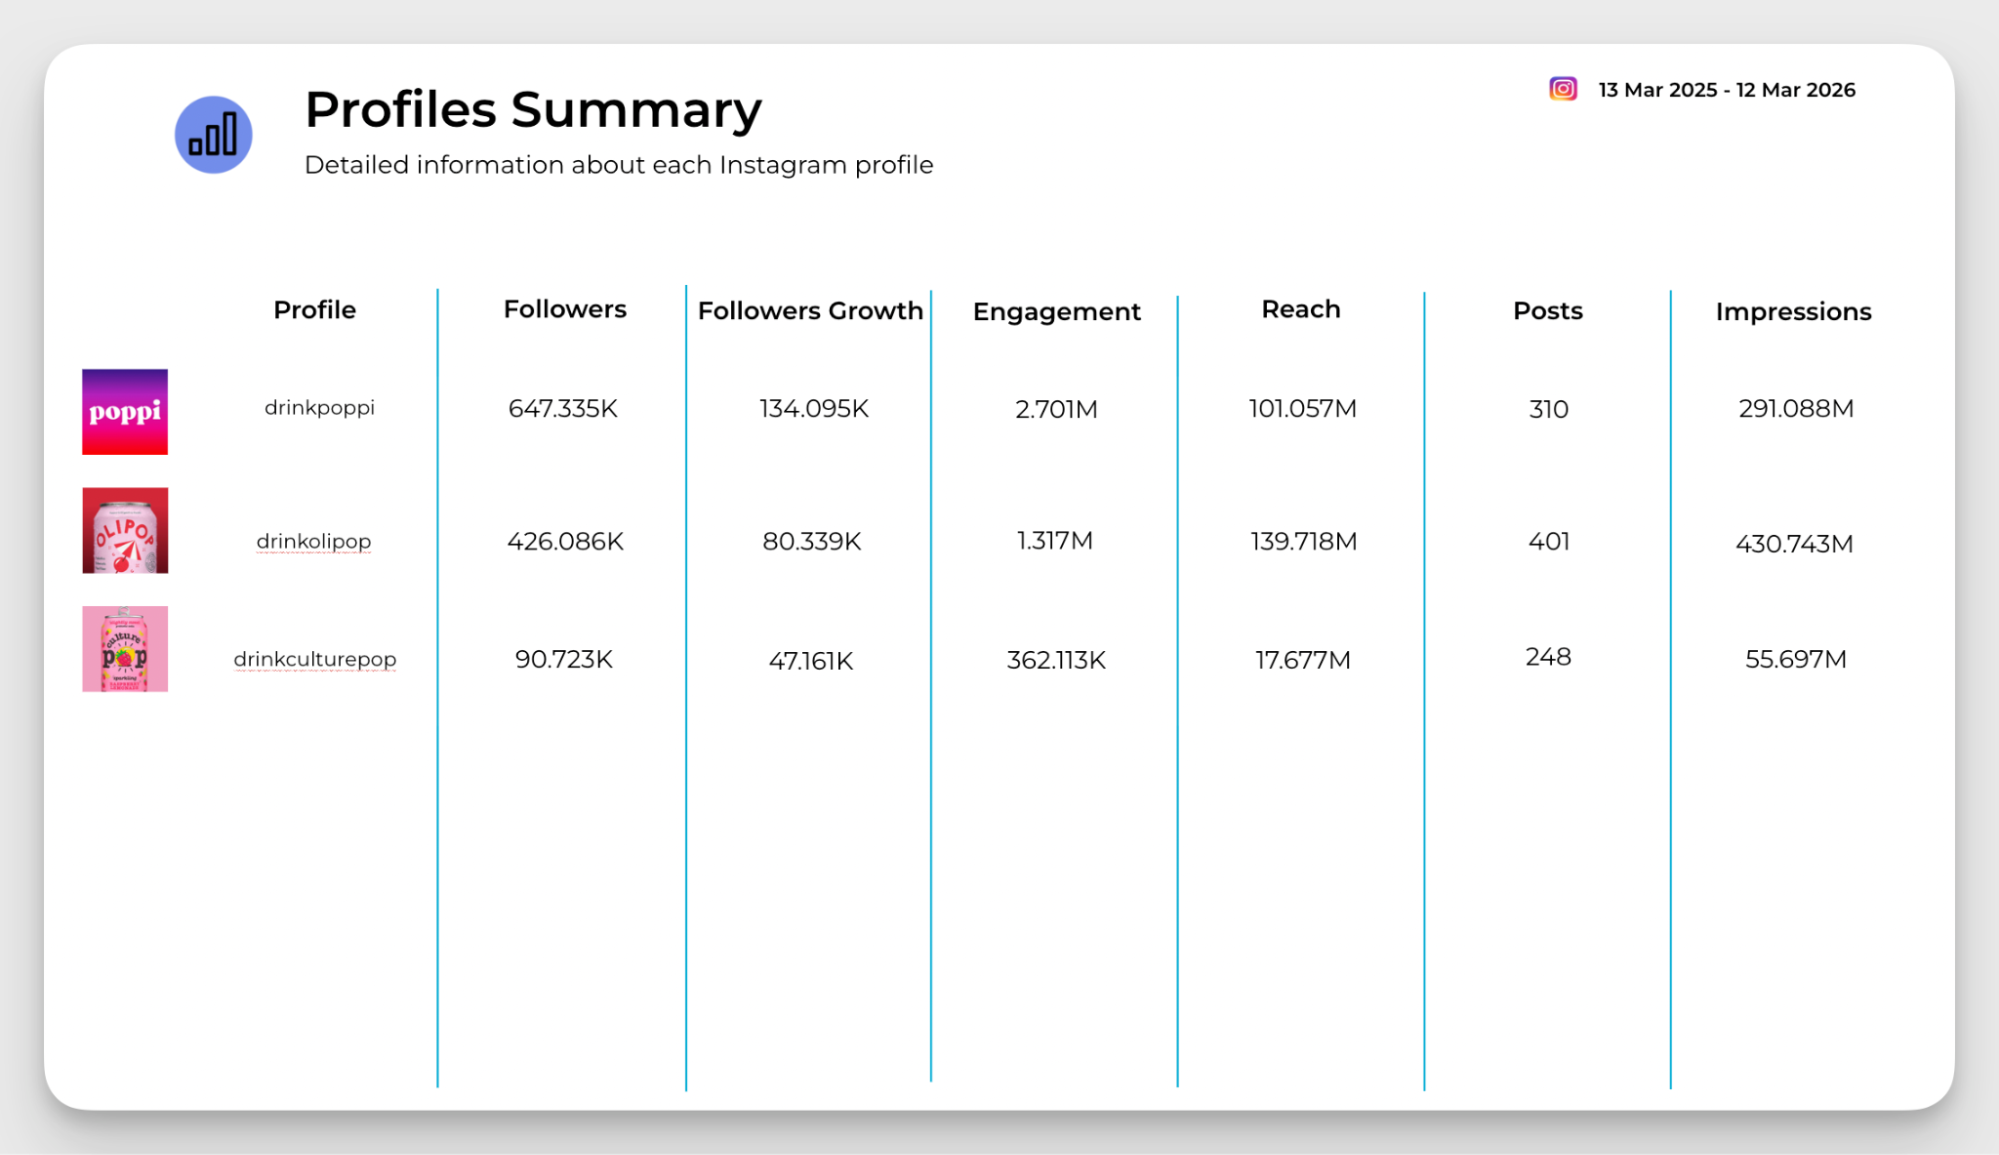
The screenshot below shows what a complete profile summary looks like when pulled directly from Socialinsider, giving you a clean, shareable view of how every competitor in your set is performing across followers, follower growth, engagement, reach, posts, and impressions for any time period you select.
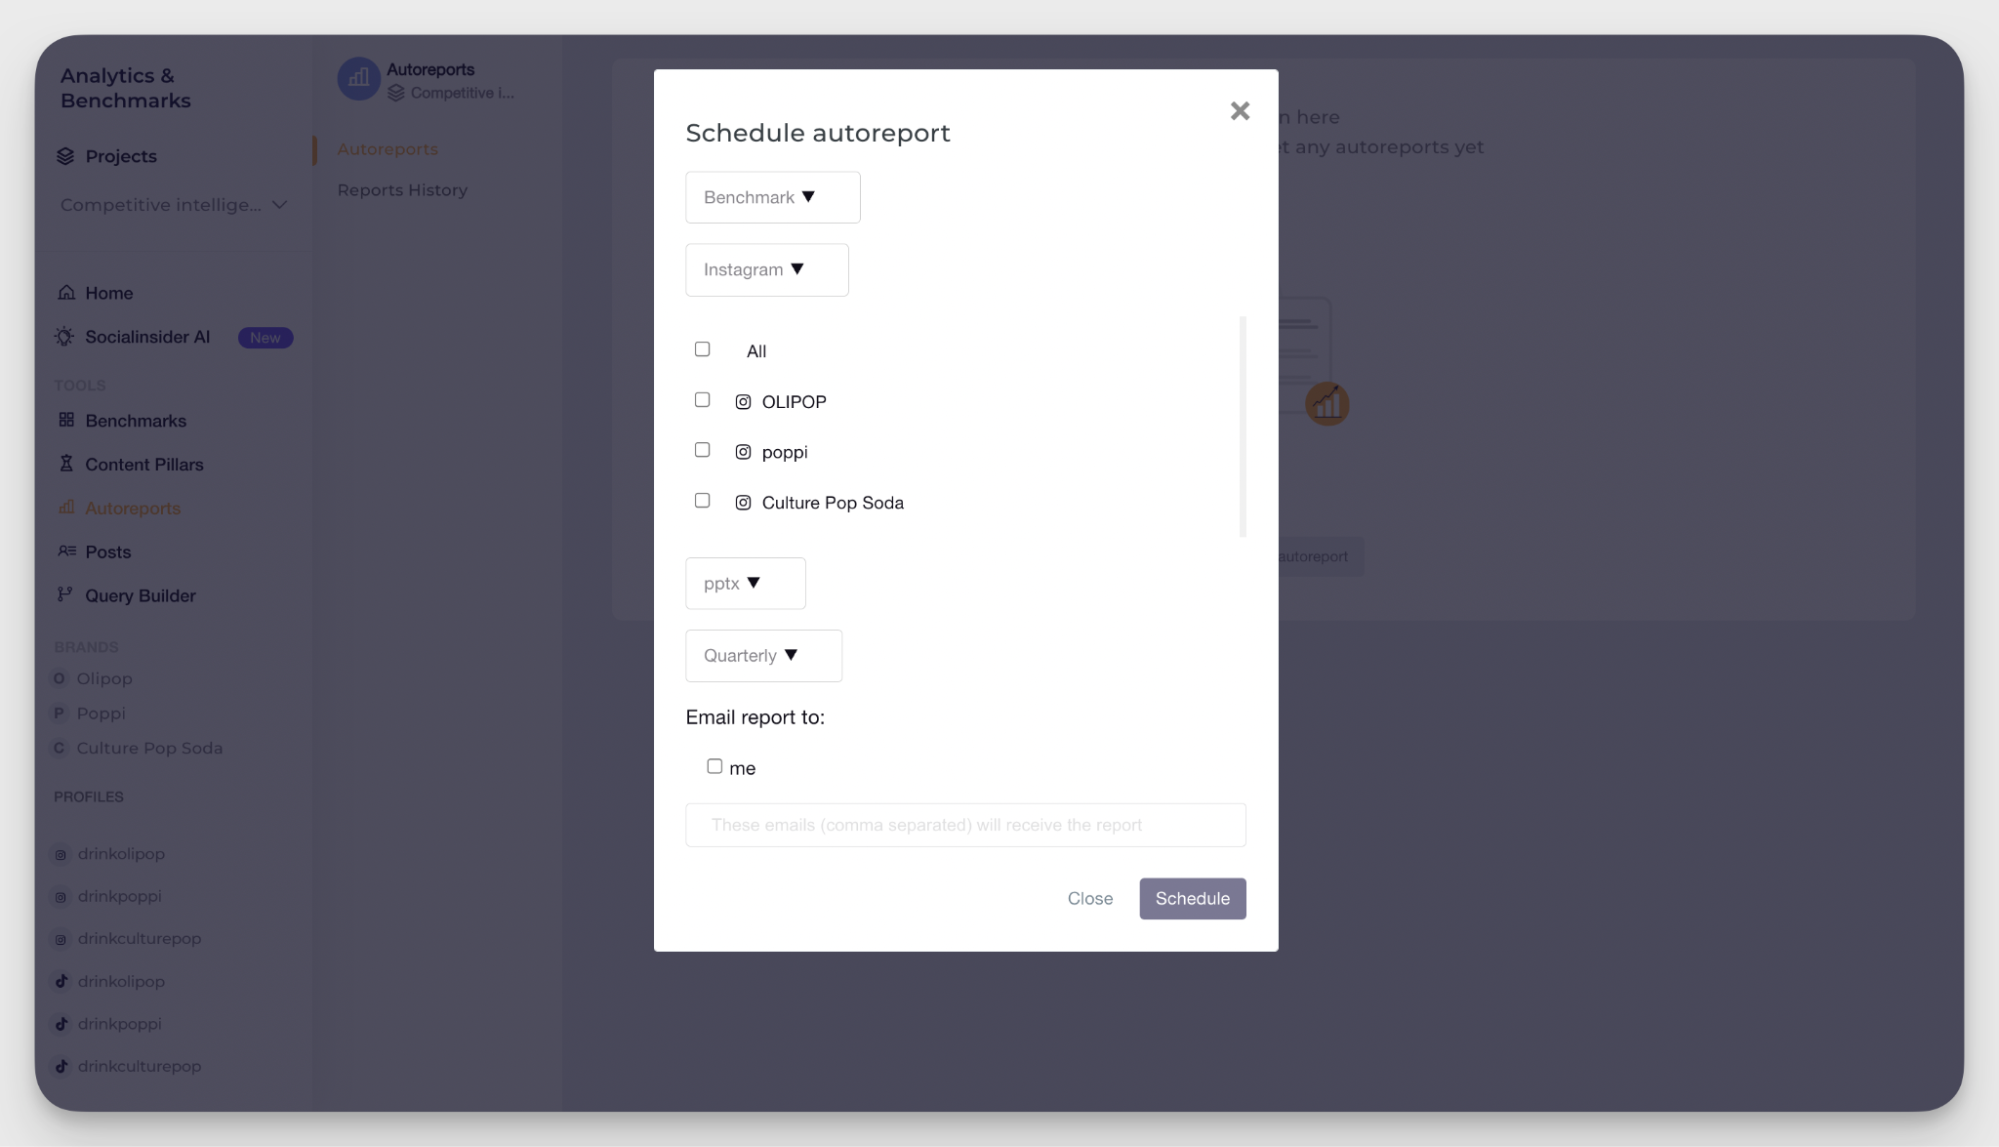
What makes this step significantly easier is setting up automated competitive intelligence reports so your team doesn't have to rebuild this document from scratch every month or quarter. Inside Socialinsider, setting up a recurring competitive intelligence report takes less than two minutes.
- Head to the Autoreports section in the left sidebar and click to schedule a new autoreport.
- From the modal that appears, select Benchmark as your report type.
- Choose the platform you want to analyze.
- Tick the specific brands from your competitive set that you want included.
- Select your preferred file format, either PDF or PPTX.
- Set your delivery frequency to weekly, monthly, or quarterly, depending on how often your stakeholders need the update.
- Enter the email addresses of everyone who should receive the report and click Schedule.
From that point forward, Socialinsider handles everything automatically. Your stakeholders receive a fully populated competitive intelligence report directly in their inbox on the schedule you set, with no manual data pulling, no formatting, and no chasing people to share access to a dashboard.
How senior social media teams turn competitive intelligence into a repeatable system?
Building a competitive intelligence report once is useful. Building the organizational habit around it is what separates teams that react to competitors from teams that consistently stay ahead of them.
Senior social media leaders who get the most out of competitive intelligence treat it less like a deliverable and more like an ongoing process with clear ownership. In practice, that means a few things.
- Assigning a clear owner. The report should not be a team effort that defaults to whoever has time that week. Someone needs to own the cadence, maintain the competitor list, and be accountable for turning findings into recommendations. In leaner teams, that is often the head of social directly. In larger teams, it gets delegated — but the leader stays responsible for ensuring the insights actually reach decision-makers in a usable form.
- Tying the cadence to business rhythms. Quarterly reports work well when aligned to planning cycles, because that is when budget decisions are being made and strategic priorities are being set. If your organization reviews marketing strategy every quarter, your competitive intelligence report should land one to two weeks before that conversation happens — not after it. Arriving with benchmarked data while decisions are still being made is what turns the report from a reference document into a strategic input.
- Creating a feedback loop with leadership. The report should not just flow upward. The most effective senior social teams use stakeholder reactions to competitive intelligence findings to sharpen what they track next quarter. If a CMO consistently asks about share of voice but never engages with content pillar breakdowns, that is a signal to restructure what the report leads with. Over time, this feedback loop makes the report progressively more useful and progressively harder to deprioritize.
- Separating signal from noise for different audiences. A social media analyst and a VP of Marketing need different things from the same data. Senior leaders who operationalize this well maintain one source of truth — a full report — but build in a condensed version for executive consumption. Two or three headline insights, a clear competitive position summary, and one or two recommended actions is often all that is needed to keep leadership engaged and informed without pulling them into the weeds.
Final thoughts
A competitive intelligence report is only as valuable as the consistency with which you build it. Brands that track their competitive set on a regular cadence spot opportunities early, respond to threats before they become expensive, and walk into every stakeholder meeting with data-driven marketing arguments that actually move budgets and strategies.
The seven steps in this guide give you the framework I wish I had when I was starting out, whether you are building your first competitive intelligence report or overhauling a process that has become too manual to sustain.
If you want to skip the manual work entirely and start generating competitive intelligence reports that your stakeholders will actually look forward to receiving, Socialinsider gives you everything you need in one place.
FAQs on competitive intelligence reports
What tools should you use to build a comprehensive competitive intelligence report?
Socialinsider is a social media analytics platform used to build competitive intelligence reports for social media. Social media leaders use Socialinsider to pull the quantitative layer of a competitive intelligence report: competitor engagement rate, follower growth, reach, posting cadence, content pillar distribution, and top-performing posts — across Instagram, TikTok, Facebook, LinkedIn, YouTube, and X .
Socialinsider's autoreporting feature generates and delivers scheduled competitive intelligence reports automatically, removing the manual assembly step.
Elena Cucu
Content & SEO Manager @ Socialinsider with 8 years of experience in marketing. I like to describe myself as a social butterfly with a curious mind, passionate about dancing and psychology.

Know what your competitors do — before your manager asks
Get instant social benchmarks & reports without manual work.


