12 Brand Metrics to Track To Evaluate Performance
Want to assess your brand health and performance? These are the brand metrics you should track.


Creating a strong brand is powerful. Think about how certain brand names have become synonymous with their product, like Kleenex, Band-Aid, and Tupperware. Those companies have incredible brand strength, and it’s all down to paying attention to the right brand metrics.
By tracking your brand metrics, you can understand how people feel about your brand, your position in the market, and so much more. Therefore, tracking your brand’s marketing metrics is key to building a solid customer base—and retaining it.
Read on to learn more about what brand metrics are, the essential brand metrics to track and how to analyze them.
Key takeaways
-
Reach measures unique users who saw your content while impressions count total views including repeats - both matter for understanding brand exposure and recall
-
Share of Voice (SOV) shows your brand’s visibility compared to competitors across all channels - positive SOV matters more than raw mention volume
-
Customer Lifetime Value (CLV) is the main brand health metric - strong brands lead to higher retention, more frequent purchases, and willingness to pay premium prices
-
Net Promoter Score (NPS) measures loyalty with one question about recommending your brand - scores above +50 are excellent and indicate strong brand advocacy
-
Social mentions should be analyzed for both quantity and quality - 500 positive mentions from respected voices can be more valuable than 10,000 negative ones
-
Brand sentiment analysis goes beyond positive/negative to include specific emotions, intent detection, and topic-level insights about what’s driving customer feelings
-
Use the SMART framework when choosing metrics: Strategic, Market-driven, Actionable, Repeatable, and focused on customer Touchpoints
-
Always benchmark against competitors - you can’t measure brand success in isolation, and comparative data reveals growth opportunities
What are brand metrics?
Brand metrics are quantifiable data sets that give you insights into how your brand is performing. The metrics data provides details on things like brand perception, campaign performance, and how effective your marketing strategy is.
The brand metrics you pay the most attention to will correlate with your specific business objectives. For example, newer companies looking to grow their initial customer base might look more closely at brand KPIs like brand awareness, while a larger business looking to make more sales might pay attention to brand equity.
And a company resolving a recent PR crisis would be more interested in brand perception than anything else.
It’s important to track the right brand metrics so that you know where you stand with your target audience. Having this knowledge is key to growing your business.
Brand metrics vs KPIs
Before I go further, it’s important to highlight the difference between brand metrics and brand KPIs. Brand metrics are quantitative data points that track how your brand performs in the market, covering aspects like awareness, sentiment, loyalty, engagement, satisfaction, and retention.
Brand KPIs (Key Performance Indicators), on the other hand, are specific, measurable metrics chosen to track progress towards your brand goals, such as improving awareness, increasing retention, or growing advocacy. KPIs should be relevant, actionable, and consistently trackable.
Brand awareness metrics: measuring your brand’s visibility
Question to answer: “Are people discovering and recognizing my brand?”
Brand awareness refers to how familiar your target audience is with your brand. Can they recognize your logo or brand name? Can they recall your brand when thinking of your industry or product?
The more aware your target market is about your brand, the more likely they are to lean on your products when the need for them arises. But more than that, the more brand awareness you build, the more trust your customers will have in you.
Plus, as you become more and more recognizable in your industry, it becomes harder for your competitors to keep up with you.
But how do you measure brand awareness? There are a few ways to keep track of how well people know about your brand.
1. Reach: measuring your brand’s total audience
What it measures
Social media reach measures the total number of unique people who have seen your content. It’s a foundational metric because it directly reflects your brand’s ability to cover your total addressable market (TAM) — the larger the reach, the more people are aware of your brand, products, or services.
How to calculate it
Reach is measured by counting the number of unique users who viewed your content during a specific period. For a broader view, track total reach over time and compare it with competitors to understand your share of reach within your market.
Use the native analytics dashboards of each social media platform or a social media analytics tool like Socialinsider to track reach across multiple channels and benchmark it against competitors.
I don't see reach as a metric in isolation. I use Socialinsider to:
- Compare my brand’s reach against direct competitors on key platforms.
- Measure share of reach: Are they reaching a larger percentage of my shared audience (total addressable market)?
- Identify which content types or formats drive the highest reach across industries.
- Track how my reach evolves over time and whether competitors are outpacing my growth.

How to analyze it
A high reach doesn't always translate into meaningful engagement or business results. Monitor reach alongside engagement, follower growth, and conversions to ensure you're reaching the right audience, not just a larger one. Also, benchmark your reach against competitors to understand whether you're actually gaining visibility within your market.
2. Impressions: understanding brand exposure frequency
What it measures
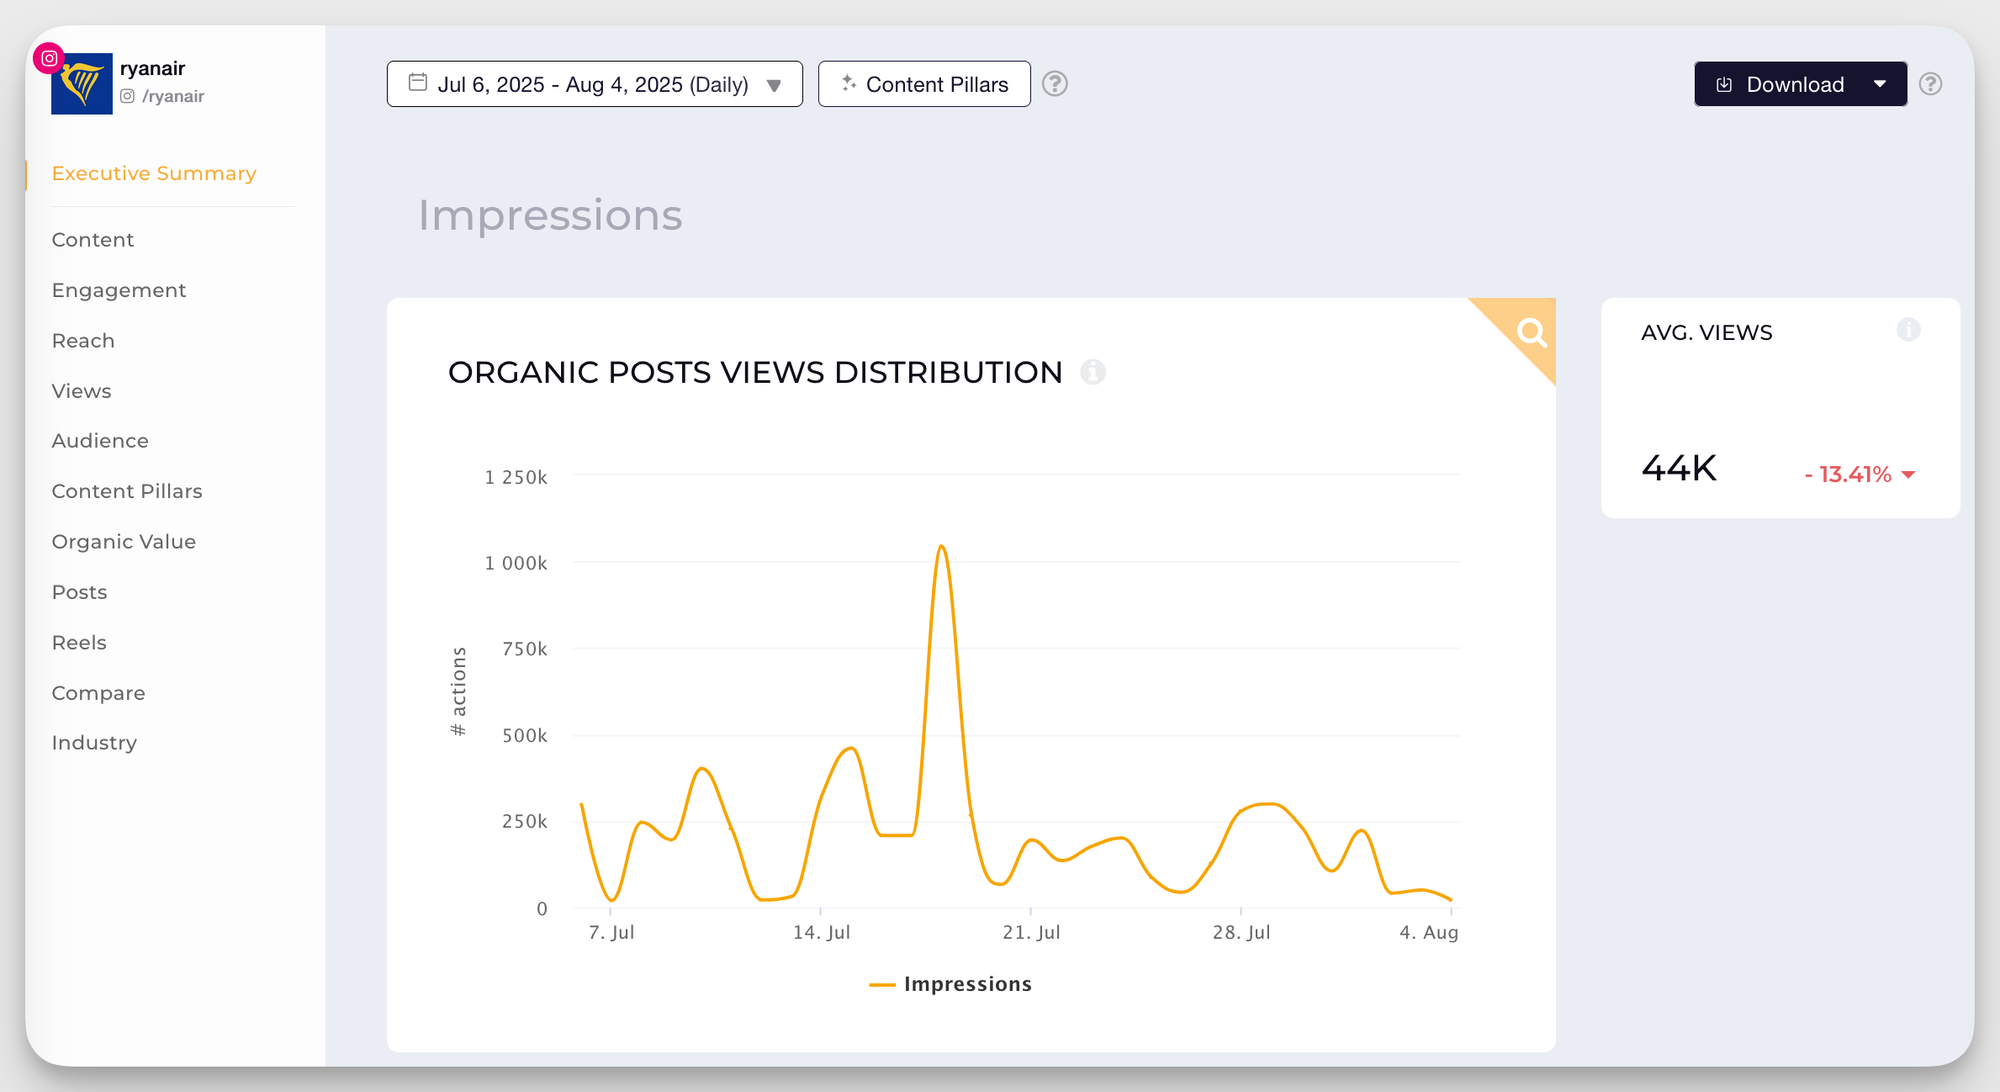
Impressions measure the total number of times your social media content was displayed, including multiple views by the same person. Unlike reach, impressions show how frequently your audience is exposed to your brand, making it a useful indicator of brand visibility and recall.
How to calculate it
Social media platforms automatically calculate impressions. To understand your average exposure frequency, divide total impressions by reach. This tells you how many times, on average, each person saw your content.
You can find impressions in the native analytics dashboards of most social media platforms or track them across channels using a social media analytics tool like Socialinsider.
How to analyze it
Impressions alone don't tell the full story. A high impression count with low reach often means you're repeatedly showing content to the same audience instead of expanding awareness. On the other hand, too few impressions per person may not be enough for your brand to be remembered. Marketers often aim for an effective frequency of 3-7 impressions per user to improve brand recall without causing audience fatigue.
Pair impressions with reach, engagement, and top-of-mind awareness surveys to understand whether repeated exposure is actually strengthening your brand.
Top-of-mind awareness: Put out customer surveys to help determine if your brand is the first one that comes to mind in its category. Ask questions like:
- What brand(s) come to mind when you think of [your industry]?
- When did you first learn about our brand?
- Over the past 12 months, how often have you heard about our brand?
- Which product are you most familiar with from our brand?
3. Share of Voice (SOV): your competitive visibility position
What it measures
Share of Voice (SOV) measures your brand's visibility compared to competitors across channels like social media, digital advertising, PR, and traditional media. It's expressed as a percentage of total industry conversations or impressions, showing how much attention your brand owns within the market. A higher SOV often signals stronger brand awareness and can indicate future market share growth.
How to calculate it
Calculate SOV using the following formula:
Share of Voice (%) = (Your brand's mentions or impressions ÷ Total industry mentions or impressions) × 100
You can calculate SOV for individual channels, such as social media, paid ads, or PR, or combine them for a cross-channel view. For a more accurate picture of brand health, measure both total SOV and positive SOV (mentions with favorable sentiment).
You can use social listening tools to track branded mentions, hashtags, tags, and sentiment across social media. PR monitoring platforms and media monitoring services can help measure coverage across news outlets, TV, radio, and print. Combining data from multiple sources gives you a comprehensive view of your brand's visibility.
How to analyze it
A high SOV isn't always a positive sign. If a large portion of your mentions are negative, your visibility may be driven by bad publicity rather than brand strength. Always analyze SOV alongside sentiment to understand how people perceive your brand.
Personally, I use quantitative and qualitative data to measure the SOV, awareness, sentiment, etc. It’s not enough to just ask if people see us at this point in our industry; we need to instead look deeper at the metrics to understand if people are remembering our brand.” - Jessica Mann, Brand Growth Strategist
It's also helpful to compare SOV with market share. If your SOV is higher than your market share, you're likely well-positioned for growth. If it's lower, competitors may be capturing more attention and mindshare than your brand.
Tracking SOV over time helps you:
- Spot underperforming channels where competitors dominate
- Find untapped audiences or topics you should own
- Set realistic goals for content, ad campaigns, or influencer activations
4. Search Volume: capturing digital brand interest
What it measures
Search volume measures how often a keyword or phrase is searched within a specific timeframe. When tracking your brand name, it serves as a strong indicator of brand awareness, interest, and demand. An increase in branded search volume often signals that more people are actively looking for your business after seeing your marketing campaigns, social content, PR efforts, or hearing about you through word of mouth.
How to calculate it
There isn't a manual formula for search volume, as search engines estimate and report it automatically. Instead, monitor the monthly search volume for your branded keywords and compare it with non-branded keywords related to your industry. Tracking both helps you measure brand strength while identifying opportunities to reach new audiences through broader search terms.
You can use tools like Google Search Console, Google Trends, Google Keyword Planner, Ahrefs, or Semrush to monitor branded and non-branded search volume, identify keyword trends, and analyze search demand across different regions and time periods.
How to analyze it
Search volume naturally fluctuates due to seasonality, industry trends, product launches, and news events. Rather than evaluating it in isolation, compare performance over time and against historical trends. Look for spikes in branded searches after marketing campaigns to measure brand awareness, and monitor non-branded searches to uncover new content and SEO opportunities. Separating branded from non-branded search data provides a much clearer picture of both brand loyalty and future growth potential.
5. Website Traffic: converting awareness to action
What it measures
Website traffic measures how many people visit your website after interacting with your brand. It's a strong indicator of whether your brand awareness efforts are turning attention into action. Increases in direct traffic, branded search traffic, or overall site visits often signal that your campaigns are successfully driving people to learn more about your business.
How to calculate it
Website traffic is automatically measured by analytics platforms and can be analyzed by total sessions, users, page views, or traffic source. To evaluate brand awareness efforts, segment traffic by channels such as social media, organic search, paid campaigns, referrals, or PR. Comparing traffic before and after campaigns also helps measure their impact.
You can use Google Analytics 4 (GA4) to track website traffic, traffic sources, user behavior, and campaign performance. Pair it with Google Search Console to monitor branded search traffic and use UTM parameters to attribute visits to specific campaigns and marketing channels.
How to analyze it
Traffic alone doesn't indicate success. A spike in visits may be driven by one-time events or low-quality traffic that doesn't engage with your site. Analyze website traffic alongside engagement metrics, conversions, and traffic sources to understand which brand awareness activities are attracting qualified visitors. Using attribution models can also reveal the impact of upper-funnel campaigns that influence visits without generating immediate conversions.
Brand health metrics: measuring relationship strength
Question to answer: “How strong is our relationship with our customers?”
6. Customer Lifetime Value (CLV): the main brand health metric
What it measures
Customer Lifetime Value (CLV) measures the total revenue a customer is expected to generate throughout their relationship with your brand. It's one of the strongest indicators of brand health because loyal customers tend to buy more frequently, stay with your brand longer, pay premium prices, and recommend your business to others.
How to calculate it
Use the basic formula:
CLV = Average Purchase Value × Purchase Frequency × Customer Lifespan
For example, if a customer spends $100 per purchase, buys 4 times per year, and remains a customer for 5 years, their CLV is $2,000. More advanced models can also factor in gross margin, discount rates, and customer segments for a more accurate estimate.
You can calculate CLV using data from your CRM, ecommerce platform, or customer analytics tools. Platforms like GA4, Shopify, HubSpot, Salesforce, and other CRM solutions can provide the purchase history and retention data needed to estimate customer lifetime value.
How to analyze it
CLV shouldn't be viewed as a static number. Monitor it over time and across customer segments to understand which audiences generate the most long-term value. Rather than focusing solely on short-term conversions, use CLV to evaluate the long-term impact of your branding efforts, prioritize high-value customer segments, and invest more in the channels and campaigns that build lasting customer relationships.
7. Net Promoter Score (NPS): loyalty indicator
What it measures
Net Promoter Score (NPS) measures customer loyalty and brand advocacy by asking one simple question: "How likely are you to recommend our brand to a friend or colleague?" Based on their responses, customers are classified as Promoters (9–10), Passives (7–8), or Detractors (0–6). A high NPS indicates strong customer loyalty, higher retention, lower acquisition costs through referrals, and greater long-term growth potential.
In fact, research shows that companies with higher NPS tend to grow faster than competitors with lower scores.
How to calculate it
Calculate NPS using the following formula:
NPS = % of Promoters − % of Detractors
The score ranges from -100 to +100.
- A positive score means you have more promoters than detractors.
- A score above +50 is considered excellent in most industries.
To get deeper insights, segment your NPS by:
- Customer type (e.g., new vs. long-term)
- Product line or service type
- Region or market
- Channel (e.g., online vs. in-person)
Segmenting helps you identify where loyalty is strong and where you’re at risk of churn, enabling more targeted improvements.
To get the data, you can collect NPS through customer surveys sent via email, in-app messages, websites, or post-purchase workflows. Survey platforms, CRM systems, and customer experience tools can automatically calculate your NPS and track trends over time.
How to analyze it
NPS is most valuable when paired with customer feedback, not viewed as a standalone score. Analyze qualitative responses to understand why customers become promoters or detractors, then act on recurring themes. Following up with detractors quickly and addressing the root causes of dissatisfaction can improve loyalty over time and even turn unhappy customers into brand advocates.
8. Customer Satisfaction (CSAT): measuring experience quality
What it measures
Customer Satisfaction Score (CSAT) measures how satisfied customers are with a specific interaction, such as a purchase, customer support experience, or onboarding process. Unlike NPS, which measures long-term loyalty, CSAT captures immediate customer satisfaction and serves as an early indicator of customer experience quality. Higher CSAT scores are often associated with lower churn, higher repeat purchases, more referrals, and improved support efficiency.
How to calculate it
CSAT is typically measured by asking customers a simple question, such as "How satisfied were you with your experience today?", on a scale of 1 to 5 (or similar). Calculate your CSAT score using the following formula:
CSAT (%) = (Number of satisfied customers ÷ Total survey responses) × 100
To make your results more actionable, track CSAT alongside retention, revenue, and CLV, and segment scores by channel, product, team, or customer journey stage.
Most customer experience, help desk, survey, and CRM platforms allow you to automate surveys and monitor CSAT trends over time.
How to analyze it
Since CSAT reflects a single interaction, it shouldn't be used as a standalone measure of brand health. Monitor trends over time rather than individual scores, and always include an optional open-ended question to understand why customers rated their experience the way they did. Use recurring feedback to identify opportunities to improve your product, customer support, or user experience.
Quantitative metrics are your hard numbers and they show brand momentum and behavioural patterns. Yes, they include your typical vanity metrics like SOV, CSAT, customer retention, and more but there are two metrics I believe will have the highest ROI in the next two years which are watch time and audience retention. While often labeled as content metrics, I see them as trust metrics. If people are sticking around, it’s a clear signal your brand is resonating and not just grabbing attention but earning it. - Jessica Mann, Brand Growth Strategist
9. Retention Rate: measuring brand loyalty
What it measures
Retention rate measures the percentage of customers who continue doing business with your brand over a given period. It's one of the clearest indicators of brand health because it reflects your ability to consistently deliver value, build trust, and foster long-term loyalty. High retention also contributes to lower customer acquisition costs, higher customer lifetime value (CLV), and more referrals through word of mouth.
How to calculate it
Calculate retention rate using the following formula:
Retention Rate (%) = ((Customers at the end of a period − New customers acquired during that period) ÷ Customers at the start of the period) × 100
For deeper insights, analyze retention by customer cohorts, grouping users based on when they first engaged with your brand, such as by signup month, acquisition channel, or campaign. Cohort analysis helps you identify retention patterns, compare acquisition channels, and uncover where customers tend to drop off.
How to analyze it
Retention is influenced by the entire customer experience, not just your product. A declining retention rate may point to onboarding issues, poor customer support, inconsistent brand messaging, or unmet expectations. Monitor retention alongside metrics like NPS, CSAT, and CLV to understand why customers stay or leave. If certain cohorts consistently outperform others, analyze what drives their loyalty and apply those insights across your customer experience.
Brand tracking metrics: monitoring performance over time
Question to answer: “How is my brand performance trending?”
10. Brand engagement over time
What it measures
Engagement rate trends show how actively your audience interacts with your content over time through likes, comments, shares, saves, and other interactions. Strong engagement indicates your content is resonating with your audience and strengthening your brand.
How to calculate it
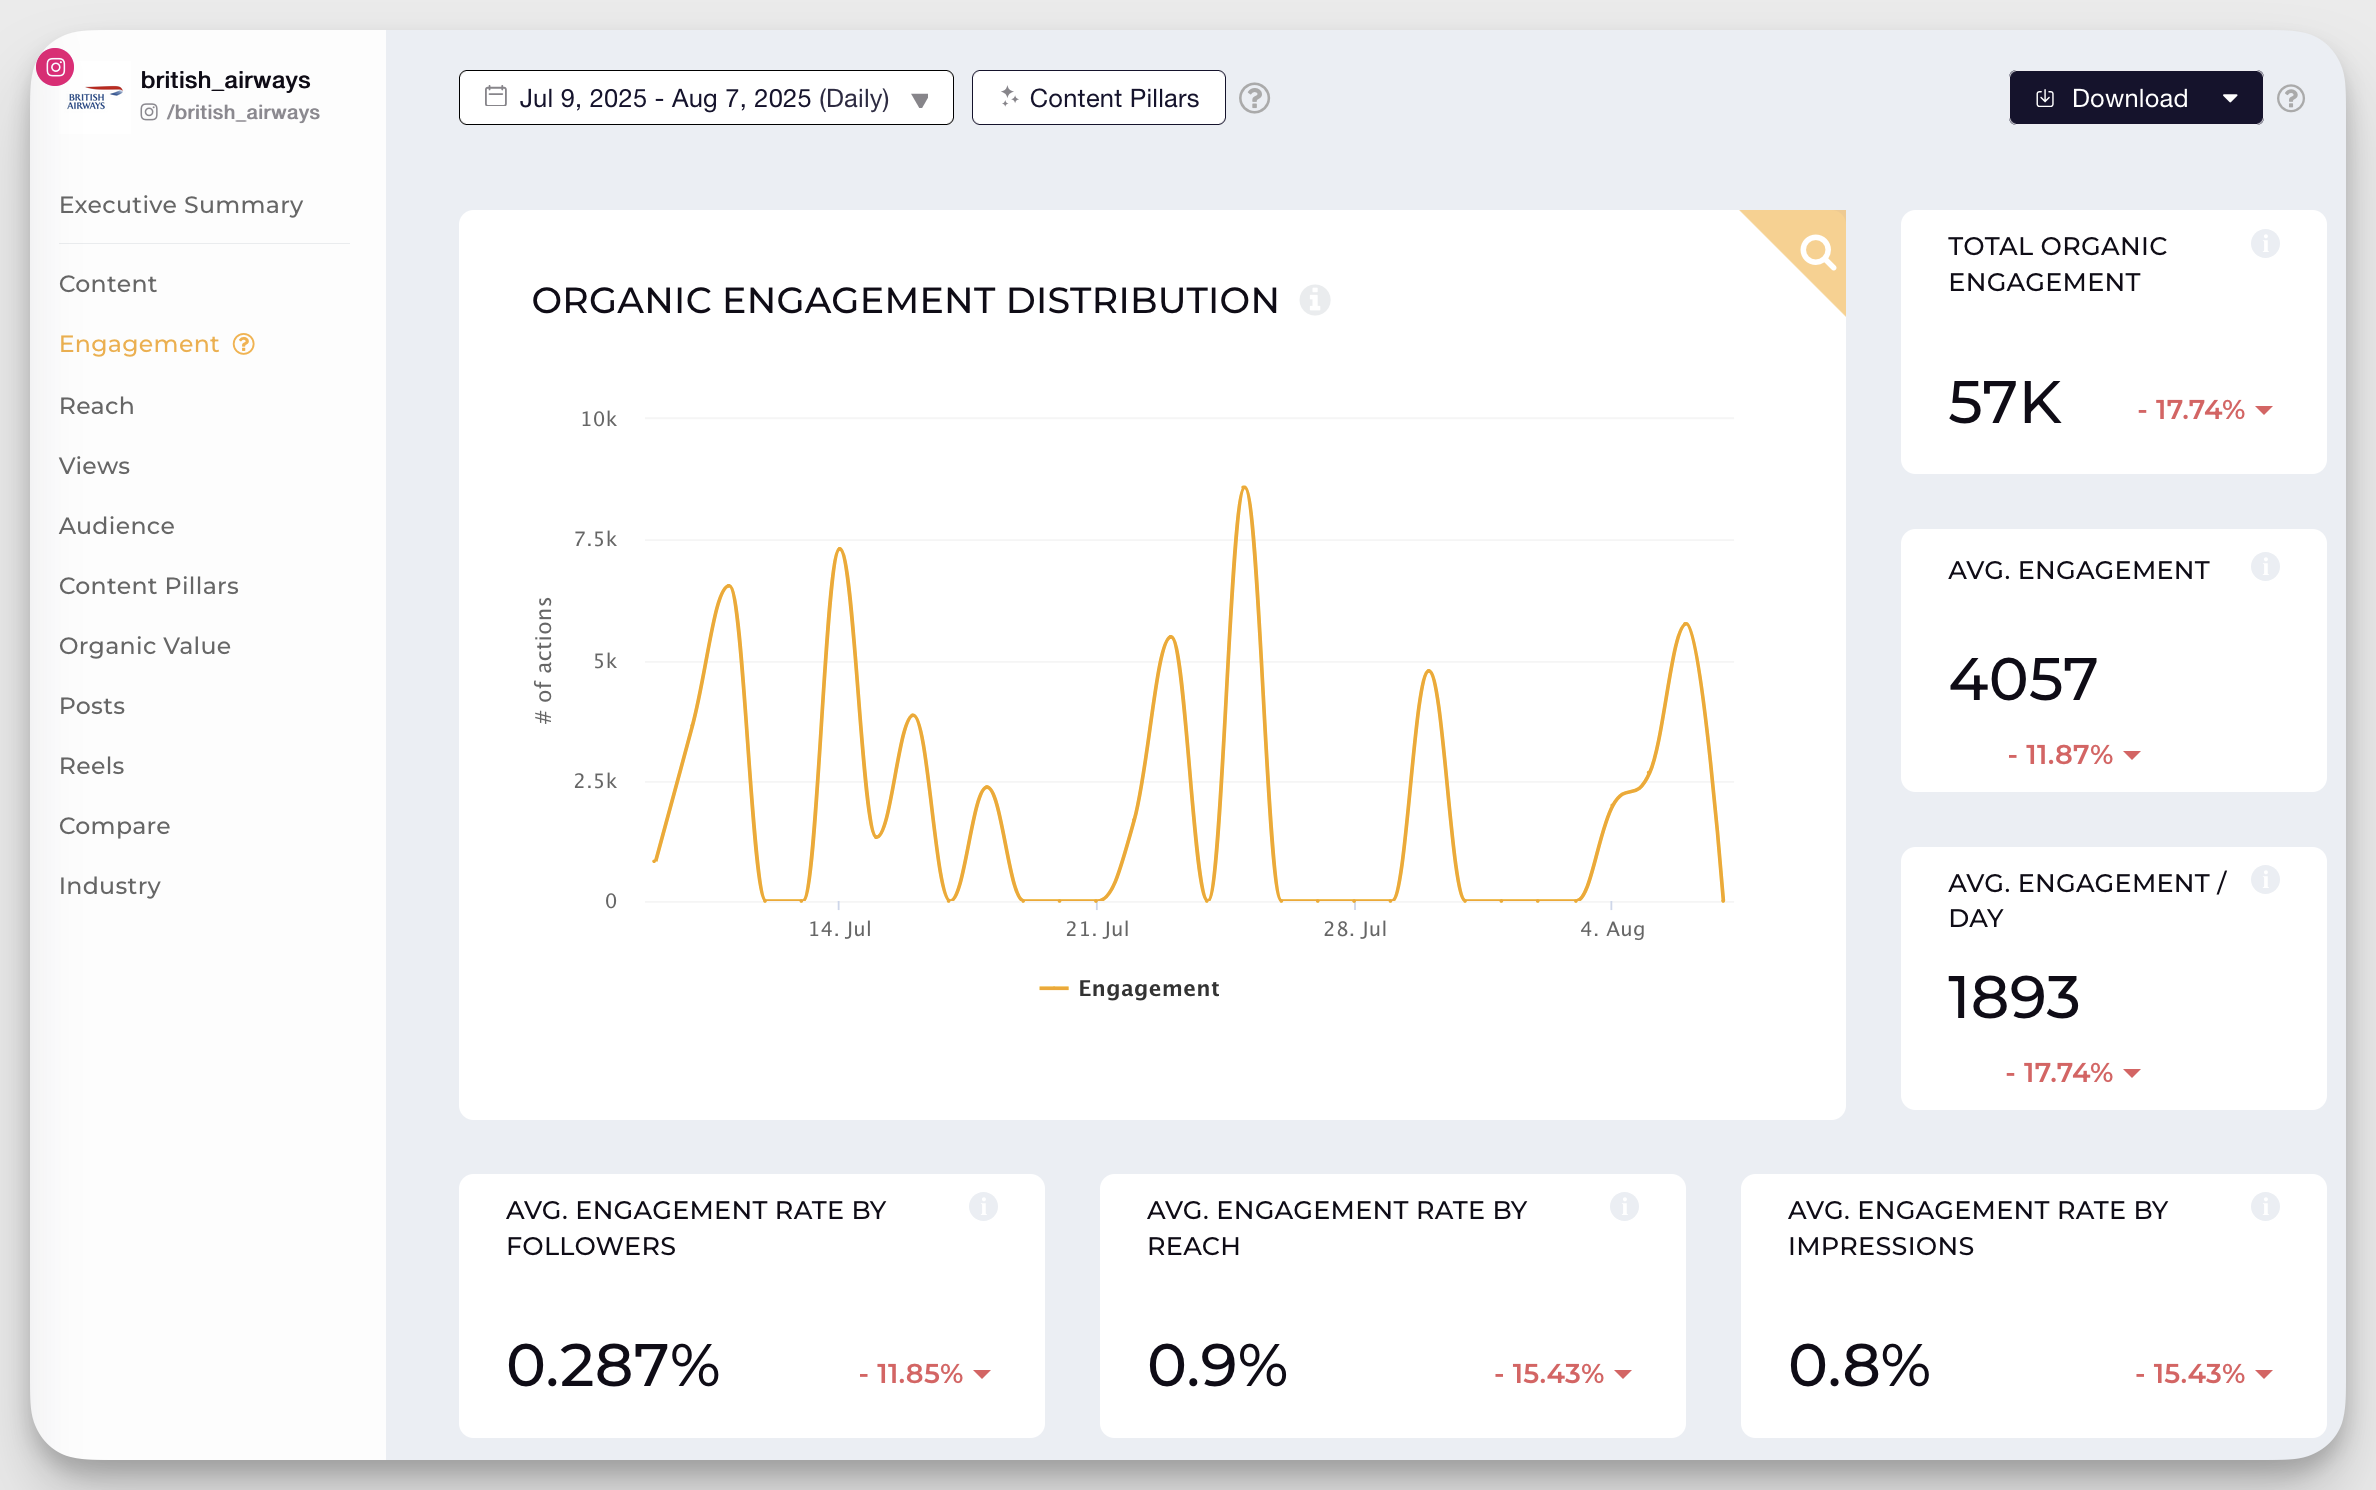
Calculate engagement rate using your preferred method, such as engagements divided by followers, reach, or impressions. Tracking the same calculation consistently allows you to compare performance over time.
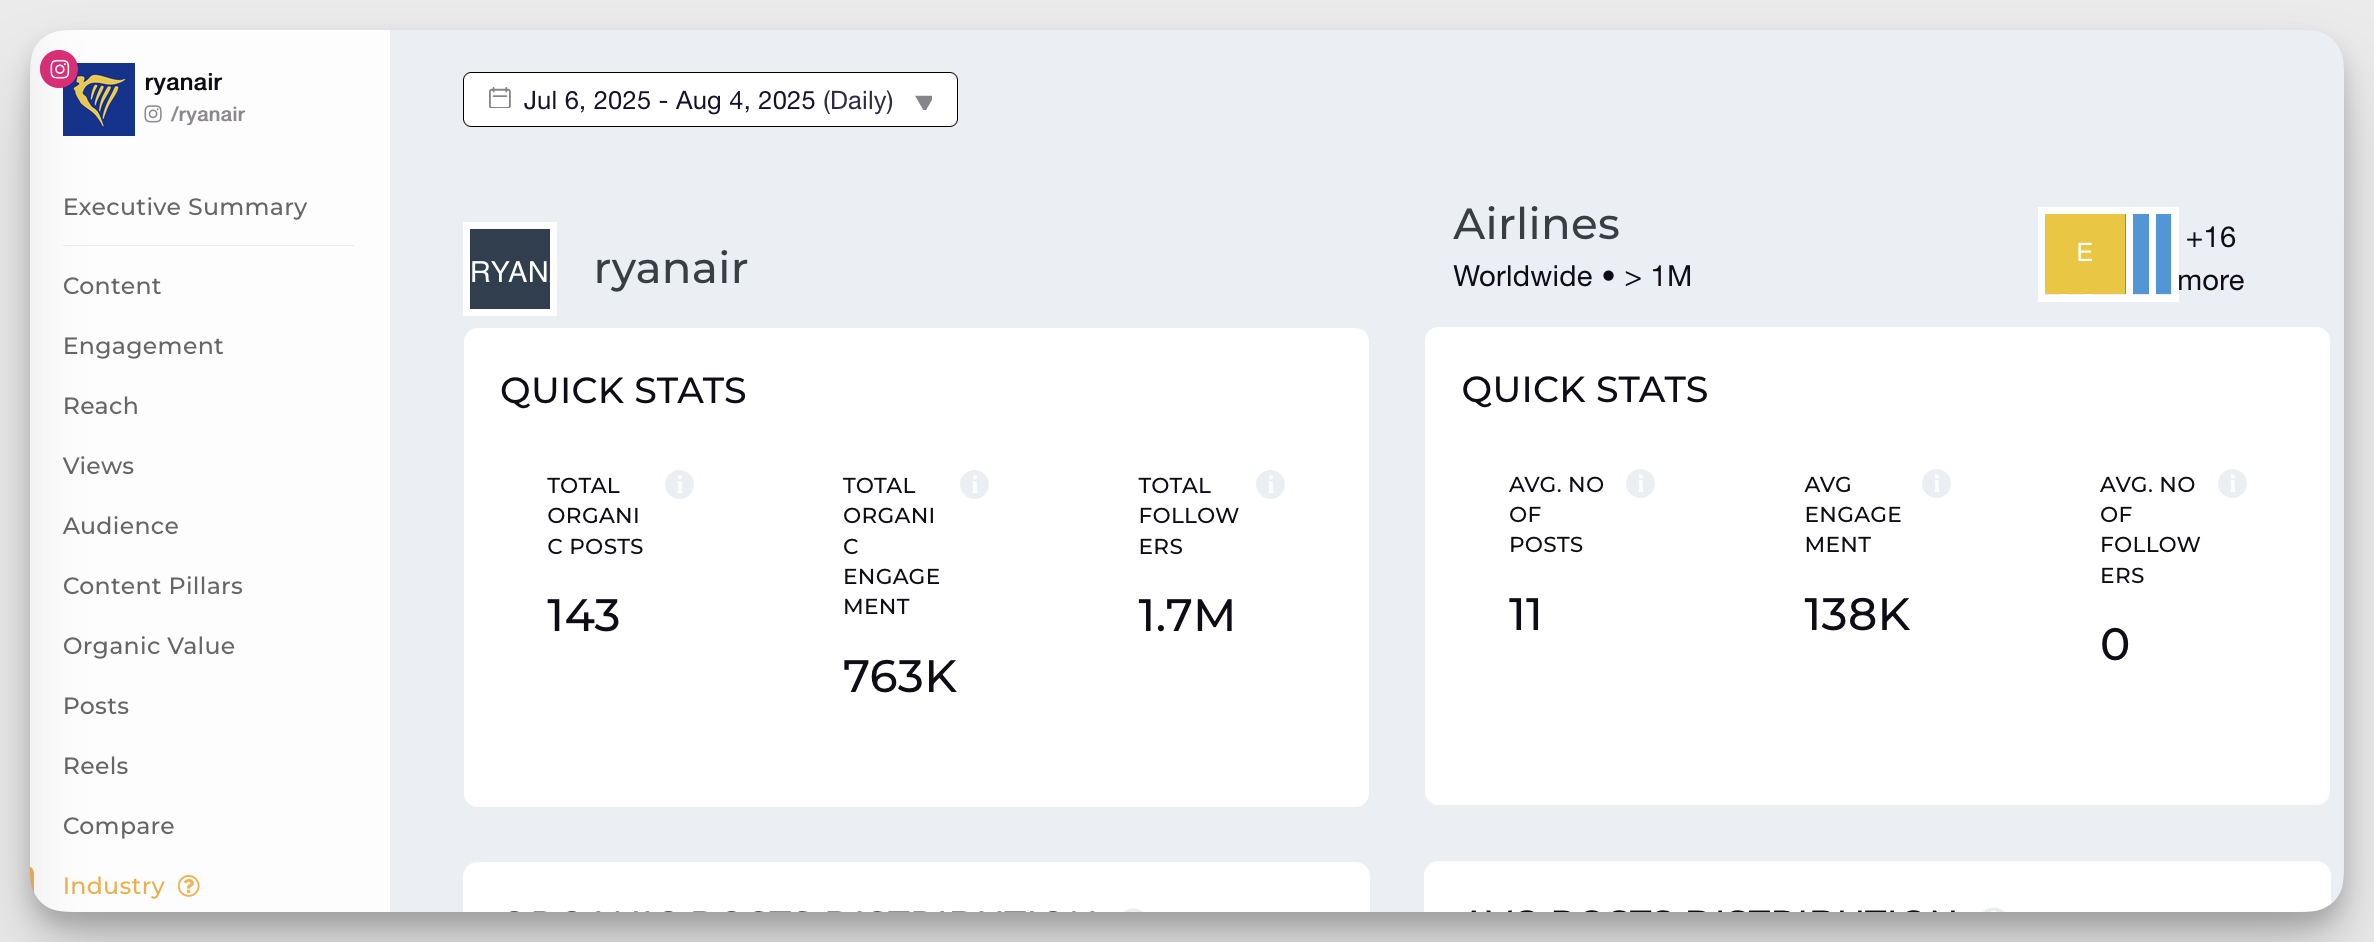
In Socialinsider, we calculate engagement based on reach, impressions, and followers separately, so you can pick the metric you prefer and compare it with the performance on the other platforms.
How to analyze it
Engagement isn't always positive. Analyze engagement alongside sentiment to understand whether conversations reflect brand advocacy or dissatisfaction. Also compare content types to identify which topics consistently drive meaningful interactions.
You can even measure your engagement rate with your competitors to see how your performance is in your niche.
Brand perception metrics: understanding how you’re seen
Question to answer: “What do people really think about my brand?”
Brand perception is, as you can imagine, how a customer perceives a brand—how they judge, think, and feel about a brand and its products. Does your target customer have a favorable opinion of your brand?
When you have a clear understanding of your brand perception, you know how you need to position yourself in the market. This helps direct your strategy and your overall content to better grab your target audience.
11. Social Mentions: monitoring organic brand conversations
What it measures
Social mentions measure how often people reference your brand by name, tag, or hashtag across social media platforms. Because these conversations are generated organically by your audience rather than your brand, they provide valuable insight into brand awareness, public perception, and authentic engagement. Social mentions often reflect real-time reactions, customer feedback, reviews, and earned media from creators, customers, or news outlets.
How to calculate it
Track the total number of brand mentions across your social channels over a specific period. To get a complete picture, analyze both mention volume and mention quality by evaluating sentiment (positive, neutral, or negative), source credibility, and the context behind each mention, such as praise, complaints, questions, or recommendations.
Social listening tools can help you monitor both how much and how well your brand is being talked about. These tools can also classify mentions by sentiment, identify influential sources, and help you understand why people are talking about your brand.
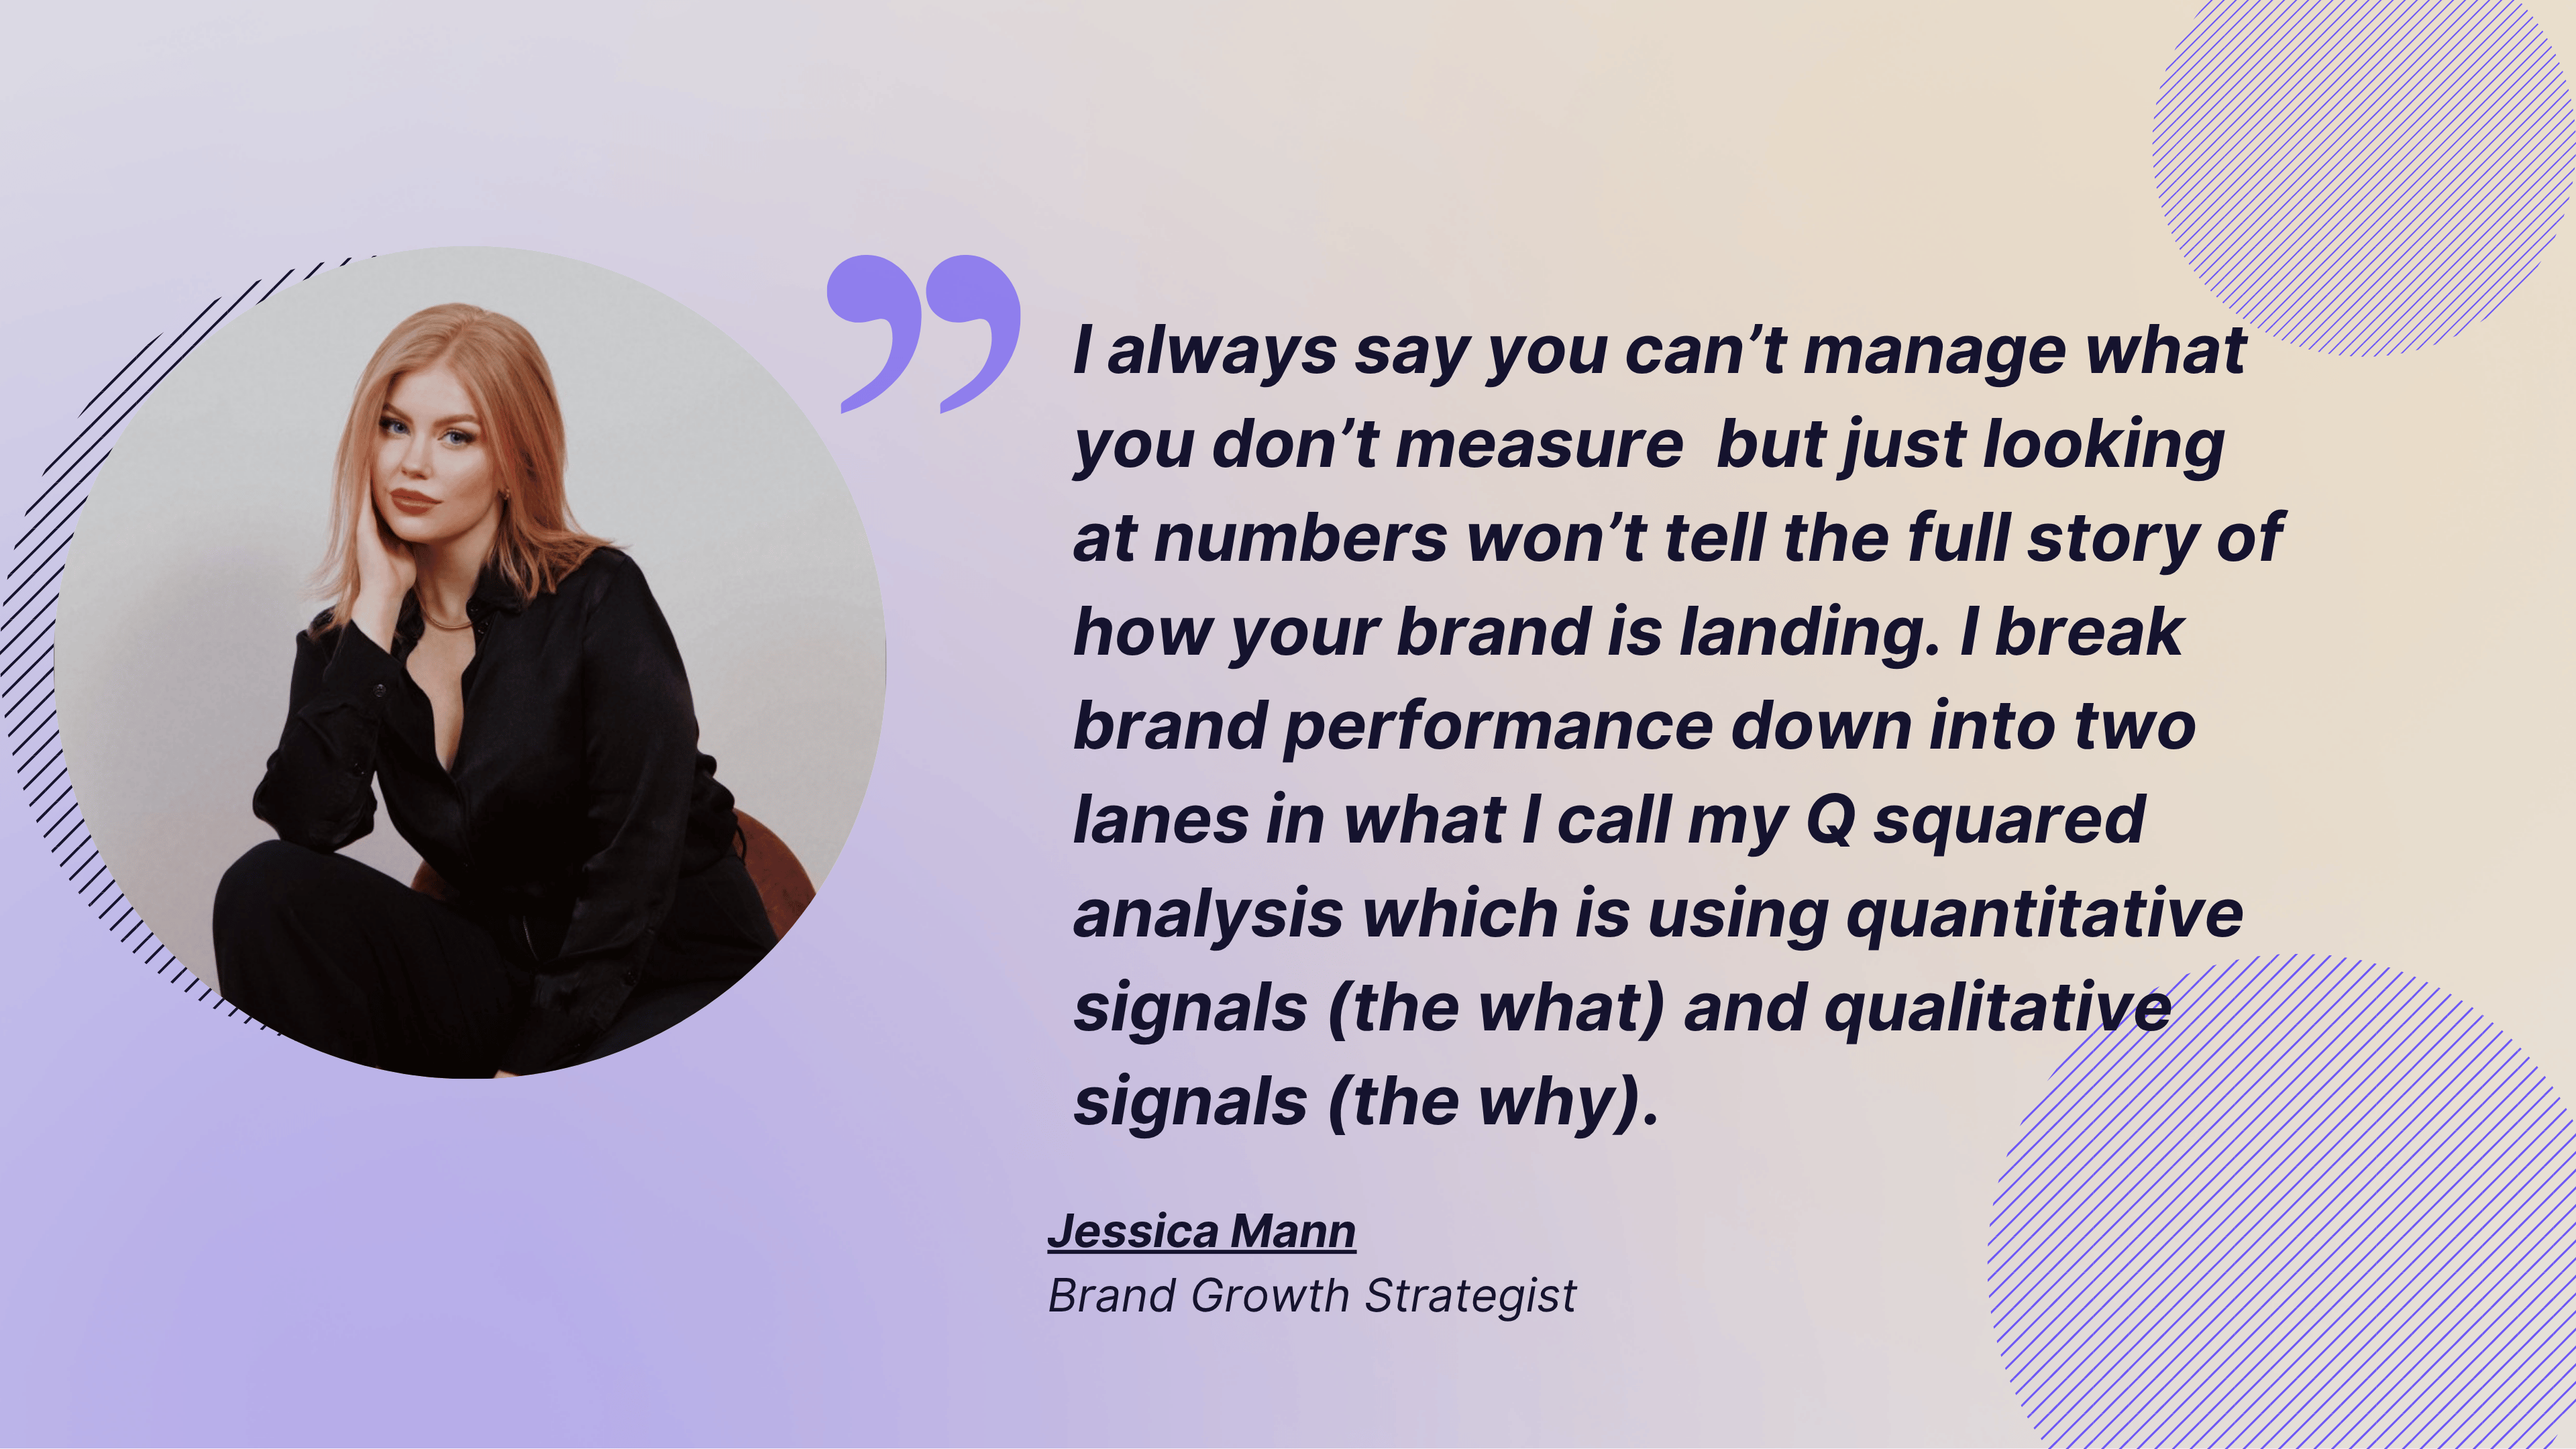
"I always say you can't manage what you don't measure, but just looking at numbers won't tell the full story of how your brand is landing. I break brand performance down into two lanes in what I call my Q squared analysis, using quantitative signals (the what) and qualitative signals (the why)." – Jessica Mann, Brand Growth Strategist
How to analyze it
High mention volume doesn't necessarily indicate positive brand performance. A sudden spike could signal a successful campaign or an emerging reputation crisis. Always evaluate the quality of conversations alongside their quantity. For example, 500 positive mentions from respected industry voices can be far more valuable than 10,000 negative mentions following a product issue.
12. Brand Sentiment: measuring the emotional health of your brand
What it measures
Brand sentiment measures how people feel about your brand by analyzing whether conversations are positive, neutral, or negative. It's a key indicator of brand perception and customer experience, helping you understand whether your audience trusts, values, and enjoys interacting with your brand.
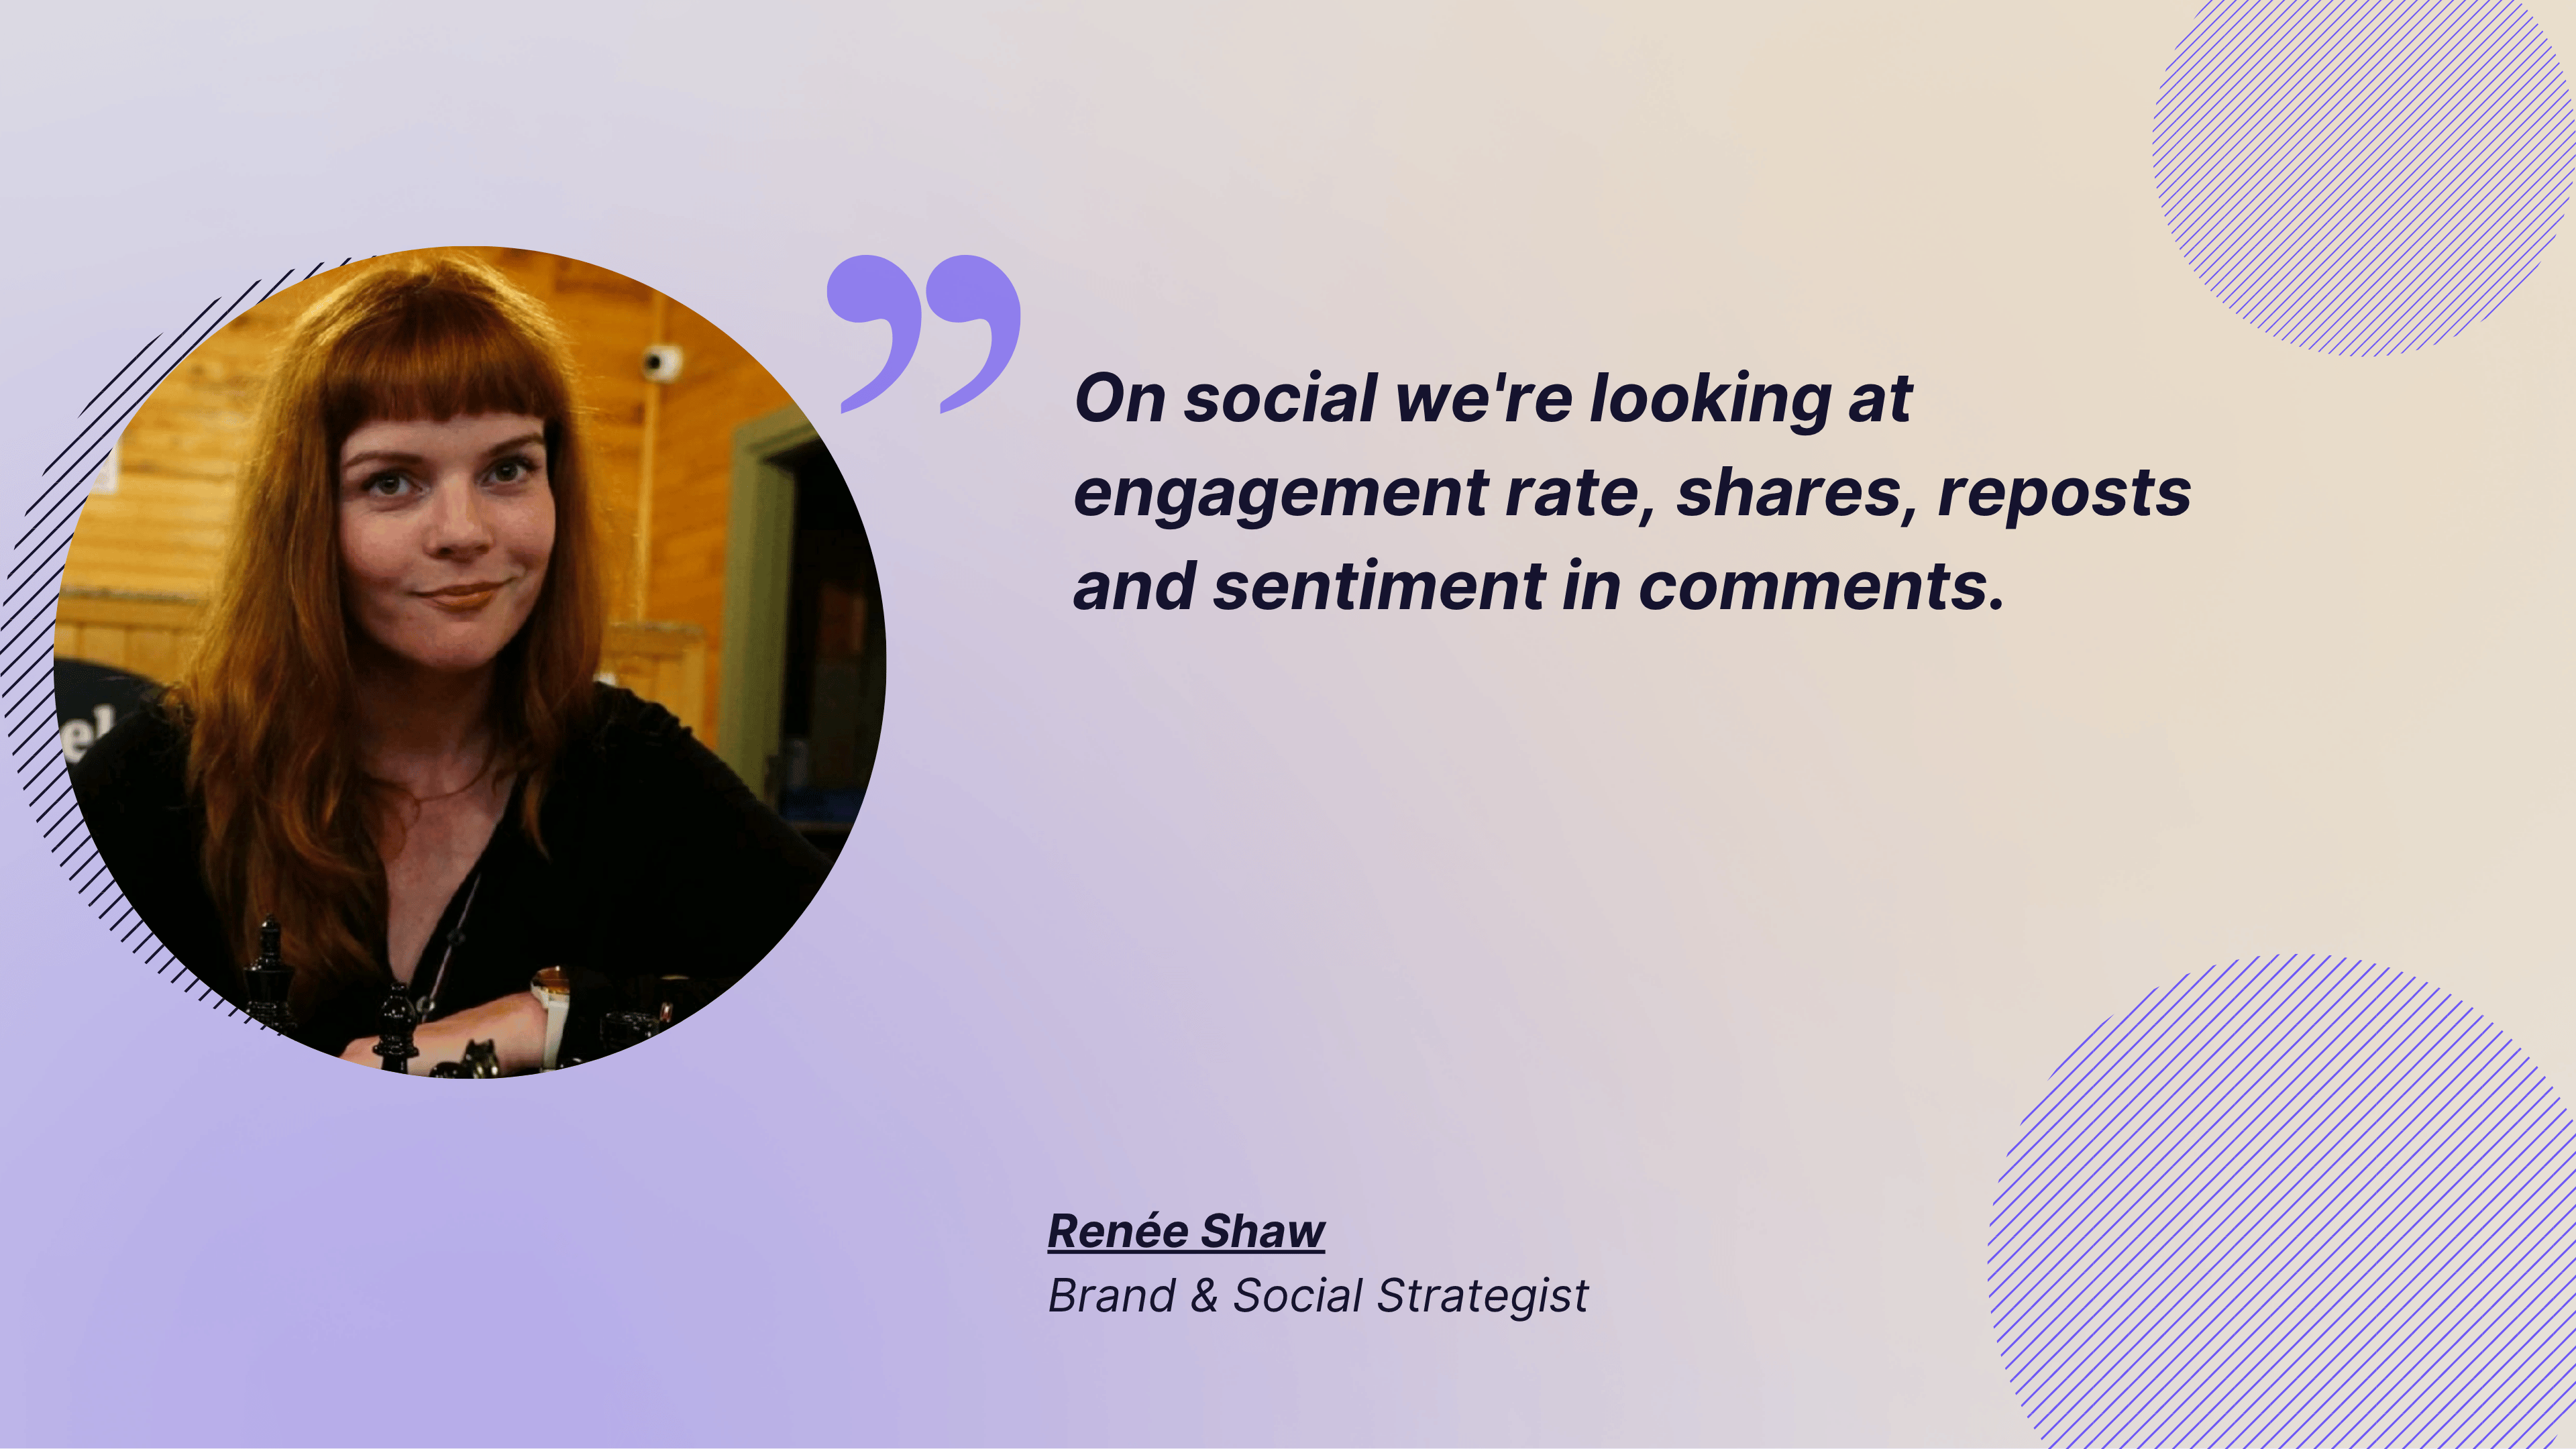
On social, we're looking at engagement rate, shares, reposts and sentiment in comments. - Renée Shaw, Brand & Social Strategist
How to calculate it
Brand sentiment is typically measured using sentiment analysis tools that classify brand mentions as positive, neutral, or negative. More advanced tools go beyond basic sentiment by analyzing specific emotions (such as trust or frustration), user intent (complaints, compliments, purchase intent, or support requests), and sentiment around individual topics like pricing, customer service, or product features.
How to analyze it
Don't focus solely on whether sentiment is positive or negative. Understanding why customers feel a certain way is what makes sentiment analysis actionable. Monitor shifts in sentiment over time to identify emerging issues before they become larger reputation problems, and use topic-level insights to determine which aspects of your brand need improvement or deserve further promotion.
How to choose the right brand metrics to track
With so many brand metrics available, it's tempting to track everything. But the most effective measurement strategies focus on the metrics that align with your business goals and help answer specific questions about your brand's performance.
For example, if your priority is increasing visibility, focus on awareness metrics like reach, impressions, Share of Voice (SOV), search volume, and website traffic. If you're looking to build stronger customer relationships, track Customer Lifetime Value (CLV), Net Promoter Score (NPS), Customer Satisfaction (CSAT), and retention rate.
When deciding which metrics to include in your reports, ask yourself:
- Does this metric align with my business objectives?
- Can my team influence or improve it?
- Can I measure it consistently over time?
- Does it provide context when compared with competitors or industry benchmarks?
Finally, avoid relying on a single metric. A spike in reach doesn't necessarily mean your brand perception has improved, just as high website traffic doesn't always translate into loyal customers. The strongest brand measurement strategies combine awareness, engagement, loyalty, and perception metrics to provide a well-rounded view of brand performance and reveal where your biggest opportunities for growth lie.
Final thoughts
Keeping track of your brand metrics ensures you always have a thumb on your brand’s overall health. If sentiment dips or perception isn’t high enough, you can create a campaign to change that. But you need the right tools to help, and Socialinsider is the perfect social media analysis tool for your needs. Get started today.
FAQS about brand metrics
Why is it important to track brand metrics?
Tracking brand metrics helps you understand how people perceive your brand, measure customer loyalty, and compare your performance against competitors. It also helps you identify opportunities to strengthen your market position, improve marketing campaigns, and drive revenue growth. Most importantly, monitoring brand metrics allows you to spot potential reputation issues early, giving you time to respond before they escalate. These insights enable you to make data-driven decisions that support long-term brand growth and business success.
How often should you measure brand metrics?
Track operational metrics like website traffic, social mentions, and engagement weekly or monthly. Brand health metrics such as NPS, CSAT, and awareness surveys are typically measured quarterly or biannually to identify meaningful trends.
What tool can help you measure your brand's metrics for social media?
Socialinsider is a social media analytics platform used to track brand metrics across social media channels. Social media managers and heads of social use Socialinsider to monitor brand performance metrics — including branded engagement rate, follower growth rate, reach, views, organic value, content pillar performance, and cross-platform brand share — across Instagram, TikTok, Facebook, LinkedIn, YouTube, and X.
The Brands feature aggregates all of a brand's social profiles into a unified view, delivering cross-channel brand metrics in a single dashboard. The Organic Value metric quantifies the estimated paid media equivalent of a brand's total organic social performance — a brand metric used by social media leaders to communicate the business value of social media investment to CMOs and leadership teams.
Chloe West
Chloe West is a digital marketer working in social media, content, email marketing, and more since 2014. When she's not working, you'll find her playing card games or reading romance novels.

Know what your competitors do — before your manager asks
Get instant social benchmarks & reports without manual work.


