Instagram Metrics Explained: 23 KPIs Every Marketer Must Track
Track the Instagram metrics that actually drive results. Discover what data to measure, why it matters, and how to benchmark against competitors.


After years of building Instagram strategies for brands, I've realized something that I feel like sharing: growth and success obstacles are never rooted in the lack of data — Instagram gives you more than you'll ever need. The real challenge is knowing which Instagram metrics to track, what they're actually telling you, and how to connect them to outcomes that matter to your business.
That's what this guide is about. Throughout this article, I'm going to cover every metric worth your attention for effective Instagram measurement right now — from core instagram engagement metrics to platform-specific insights for Reels and Stories, plus the benchmark data you need to know if the numbers you're seeing are good, bad, or somewhere in between.
Let's get into it.
Key takeaways
- What are some major changes Instagram has introduced in its metrics lately? Instagram replaced impressions with views in 2025 and added post-level follower growth and engagement timing in 2026 — making performance data more accurate and actionable than ever.
- How to tie your Instagram metrics to business growth? Start with your goal, then work backwards — brand awareness, lead generation, and sales each demand a completely different set of metrics.
- What Instagram metrics will help you make informed decisions? It all depends on your goal — awareness, engagement, lead generation, or conversions and revenue.
What are some major changes Instagram has introduced in its metrics lately?
If you've been tracking Instagram performance for a few years, 2025 brought a change worth paying attention to.
Instagram retired the "impressions" metric and replaced it with a unified views standard across all content formats — posts, Reels, Stories, and Lives. The goal, according to Meta, was to give a clearer picture of actual attention rather than potential exposure. An impression counted every time content appeared on a screen, even if the user scrolled straight past it. A view requires active engagement with the content.
It sounds subtle, but it changes how you read your instagram analytics metrics. Numbers that looked strong under the impressions model may look different now — and that's not necessarily a bad thing. It just means the measurement is more honest.
Beyond that platform shift, 2026 also brought new post-level follower growth data and more granular engagement timing insights inside Instagram Insights.
How to tie your Instagram metrics to business growth?
Instagram offers a metric for almost everything. But tracking all of it at once doesn't give you clarity — it gives you noise.
The way I approach this with every brand I work with is simple: start with the goal, then work backwards to the metrics. The instagram metrics to track for a brand awareness campaign look completely different from the ones that matter when you're trying to drive leads or close sales. If you're measuring the wrong things for your objective, you'll either miss real problems or celebrate numbers that don't actually mean anything.
Here's a framework I use to match goals to the right instagram performance metrics:
| Business goal | Primary metrics | Secondary metrics |
|---|---|---|
| Brand awareness | Reach, views, follower growth rate | Impressions by source, profile visits |
| Audience engagement | Engagement rate, saves, shares, comments | Engagement rate by reach, top posts |
| Lead generation | Link-in-bio CTR, DM volume, Story link sticker CTR | Profile visits, website clicks |
| Sales / revenue | Instagram Shopping sales, ads conversions, ROAS | CAC, ROI |
| Content strategy | Content format performance, top posts, content pillar analysis | Saves by format, carousel swipe-through rate |
| Executive reporting | Reach, engagement rate, follower growth, ROI | Organic value, competitive benchmarks |
And because I've recently had a chat about this with Paloma Pineda, social media manager at McCann Content Studios, I'll also share her perspective on this:
I always start by translating social metrics into commercially meaningful outcomes because executives don’t care about impressions in isolation, they care about how social contributes to revenue, brand growth, and retention.
Rather than treating the journey as strictly linear, I group metrics by intent and impact.
What Instagram metrics will help you make informed decisions?
Reach and visibility metrics
Reach and visibility metrics are the first thing I look at in any Instagram analytics review. They set the context for everything else. If your content isn't reaching people, the engagement numbers downstream are already limited before you've posted a single word.
1. Reach
Instagram CEO Adam Mosseri has clarified that reach breaks down into two types — connected reach (followers and people who've interacted with your account before) and unconnected reach (everyone discovering you through Explore, Reels recommendations, or hashtags). This distinction matters more than most people realize. Connected reach is driven primarily by likes from your existing audience. Unconnected reach is driven more by shares and sends — meaning content that people forward to others is what unlocks new audiences.
When I'm running a brand awareness campaign, reach is the headline metric. It tells me how wide the content is traveling and whether we're actually expanding the audience or just recirculating content within our existing follower base.
One thing to watch: reach is the metric most affected by algorithm changes. If you see a sudden drop that doesn't correlate with any change in your posting frequency or content quality, it's often a platform-level shift rather than a content problem.
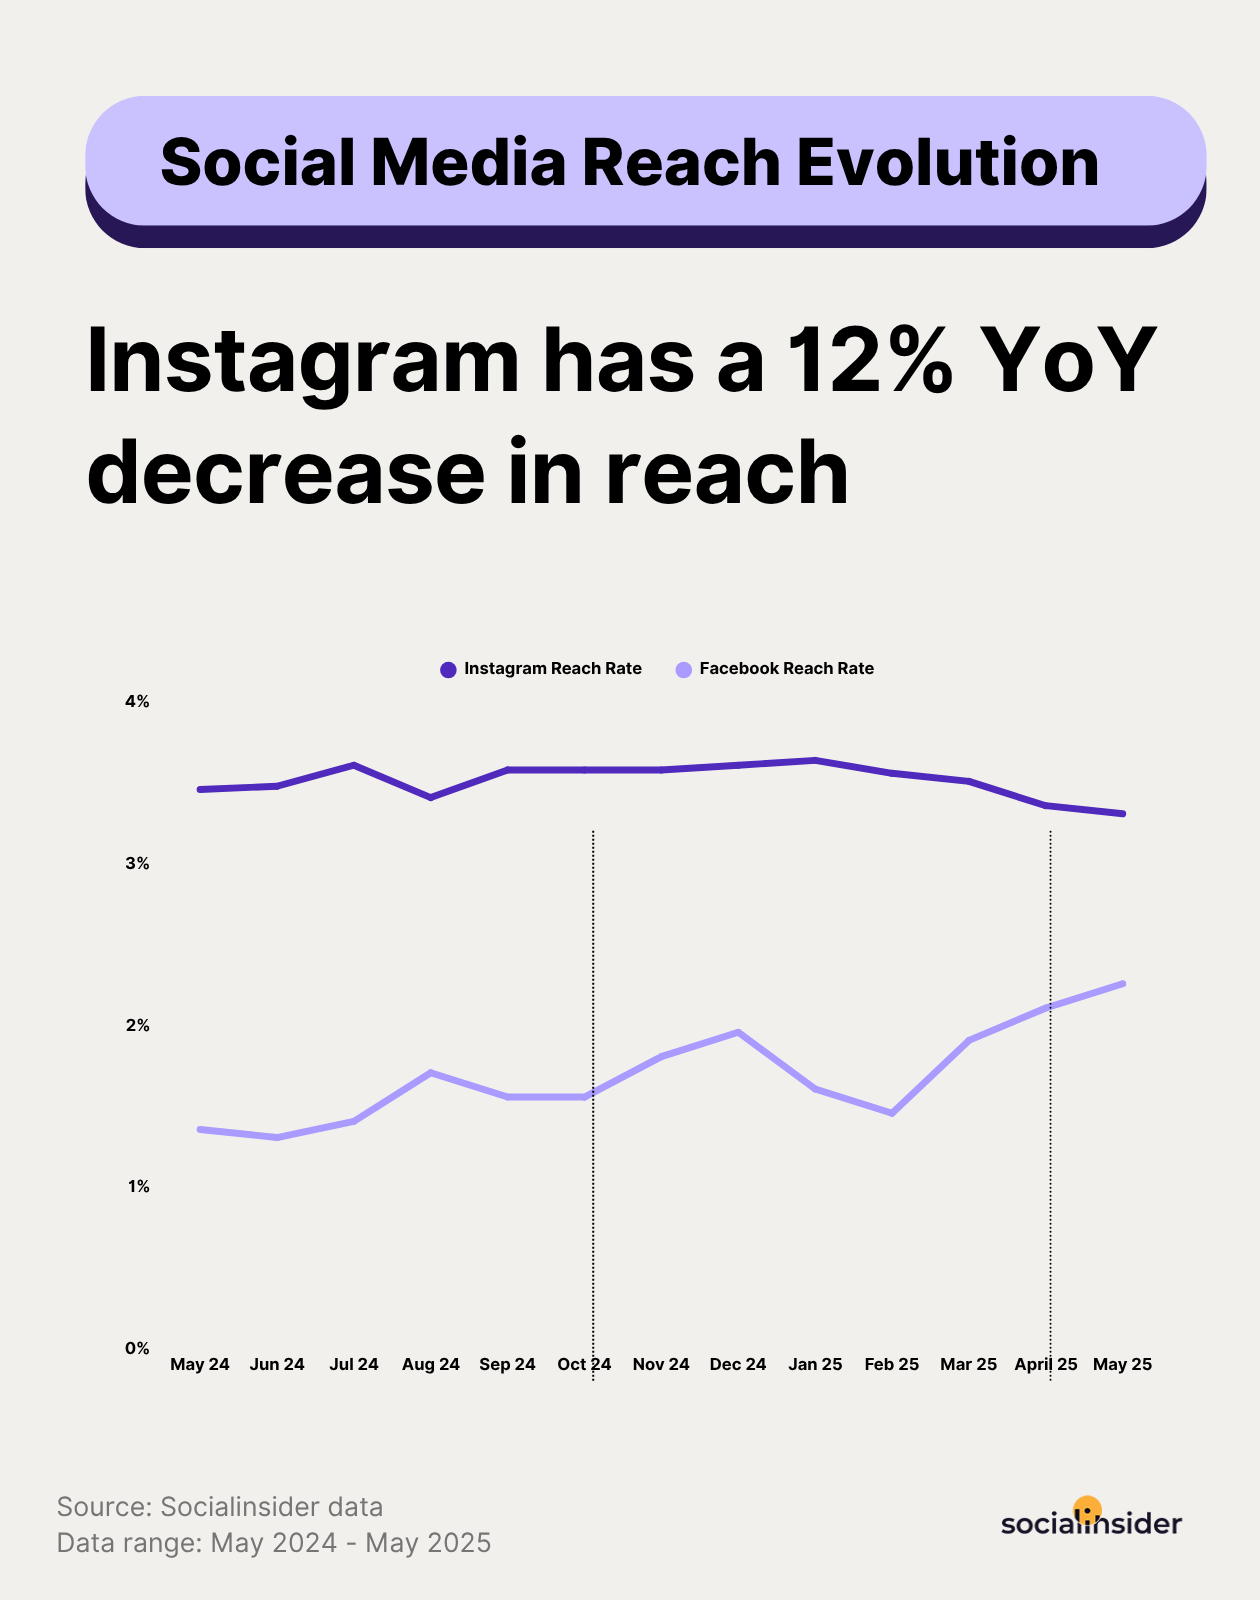
And on that note, you should know that according to our latest Socialinsider social media reach analysis, reach on Instagram registers a 12% year-over-year decrease.
2. Views
Views replaced impressions as Instagram's primary visibility metric in 2025, and the difference matters. Where impressions counted every time content appeared on a screen — including passive scrolls — views require some level of active engagement. For video, that means someone stopped and watched. For images and carousels, it means they paused on the post.
The result is a more honest measure of actual attention. A high view count tells you the content broke through the scroll. When views lag behind reach, it usually means people are seeing your content in the feed but not stopping — which points to a hook problem rather than a distribution problem.
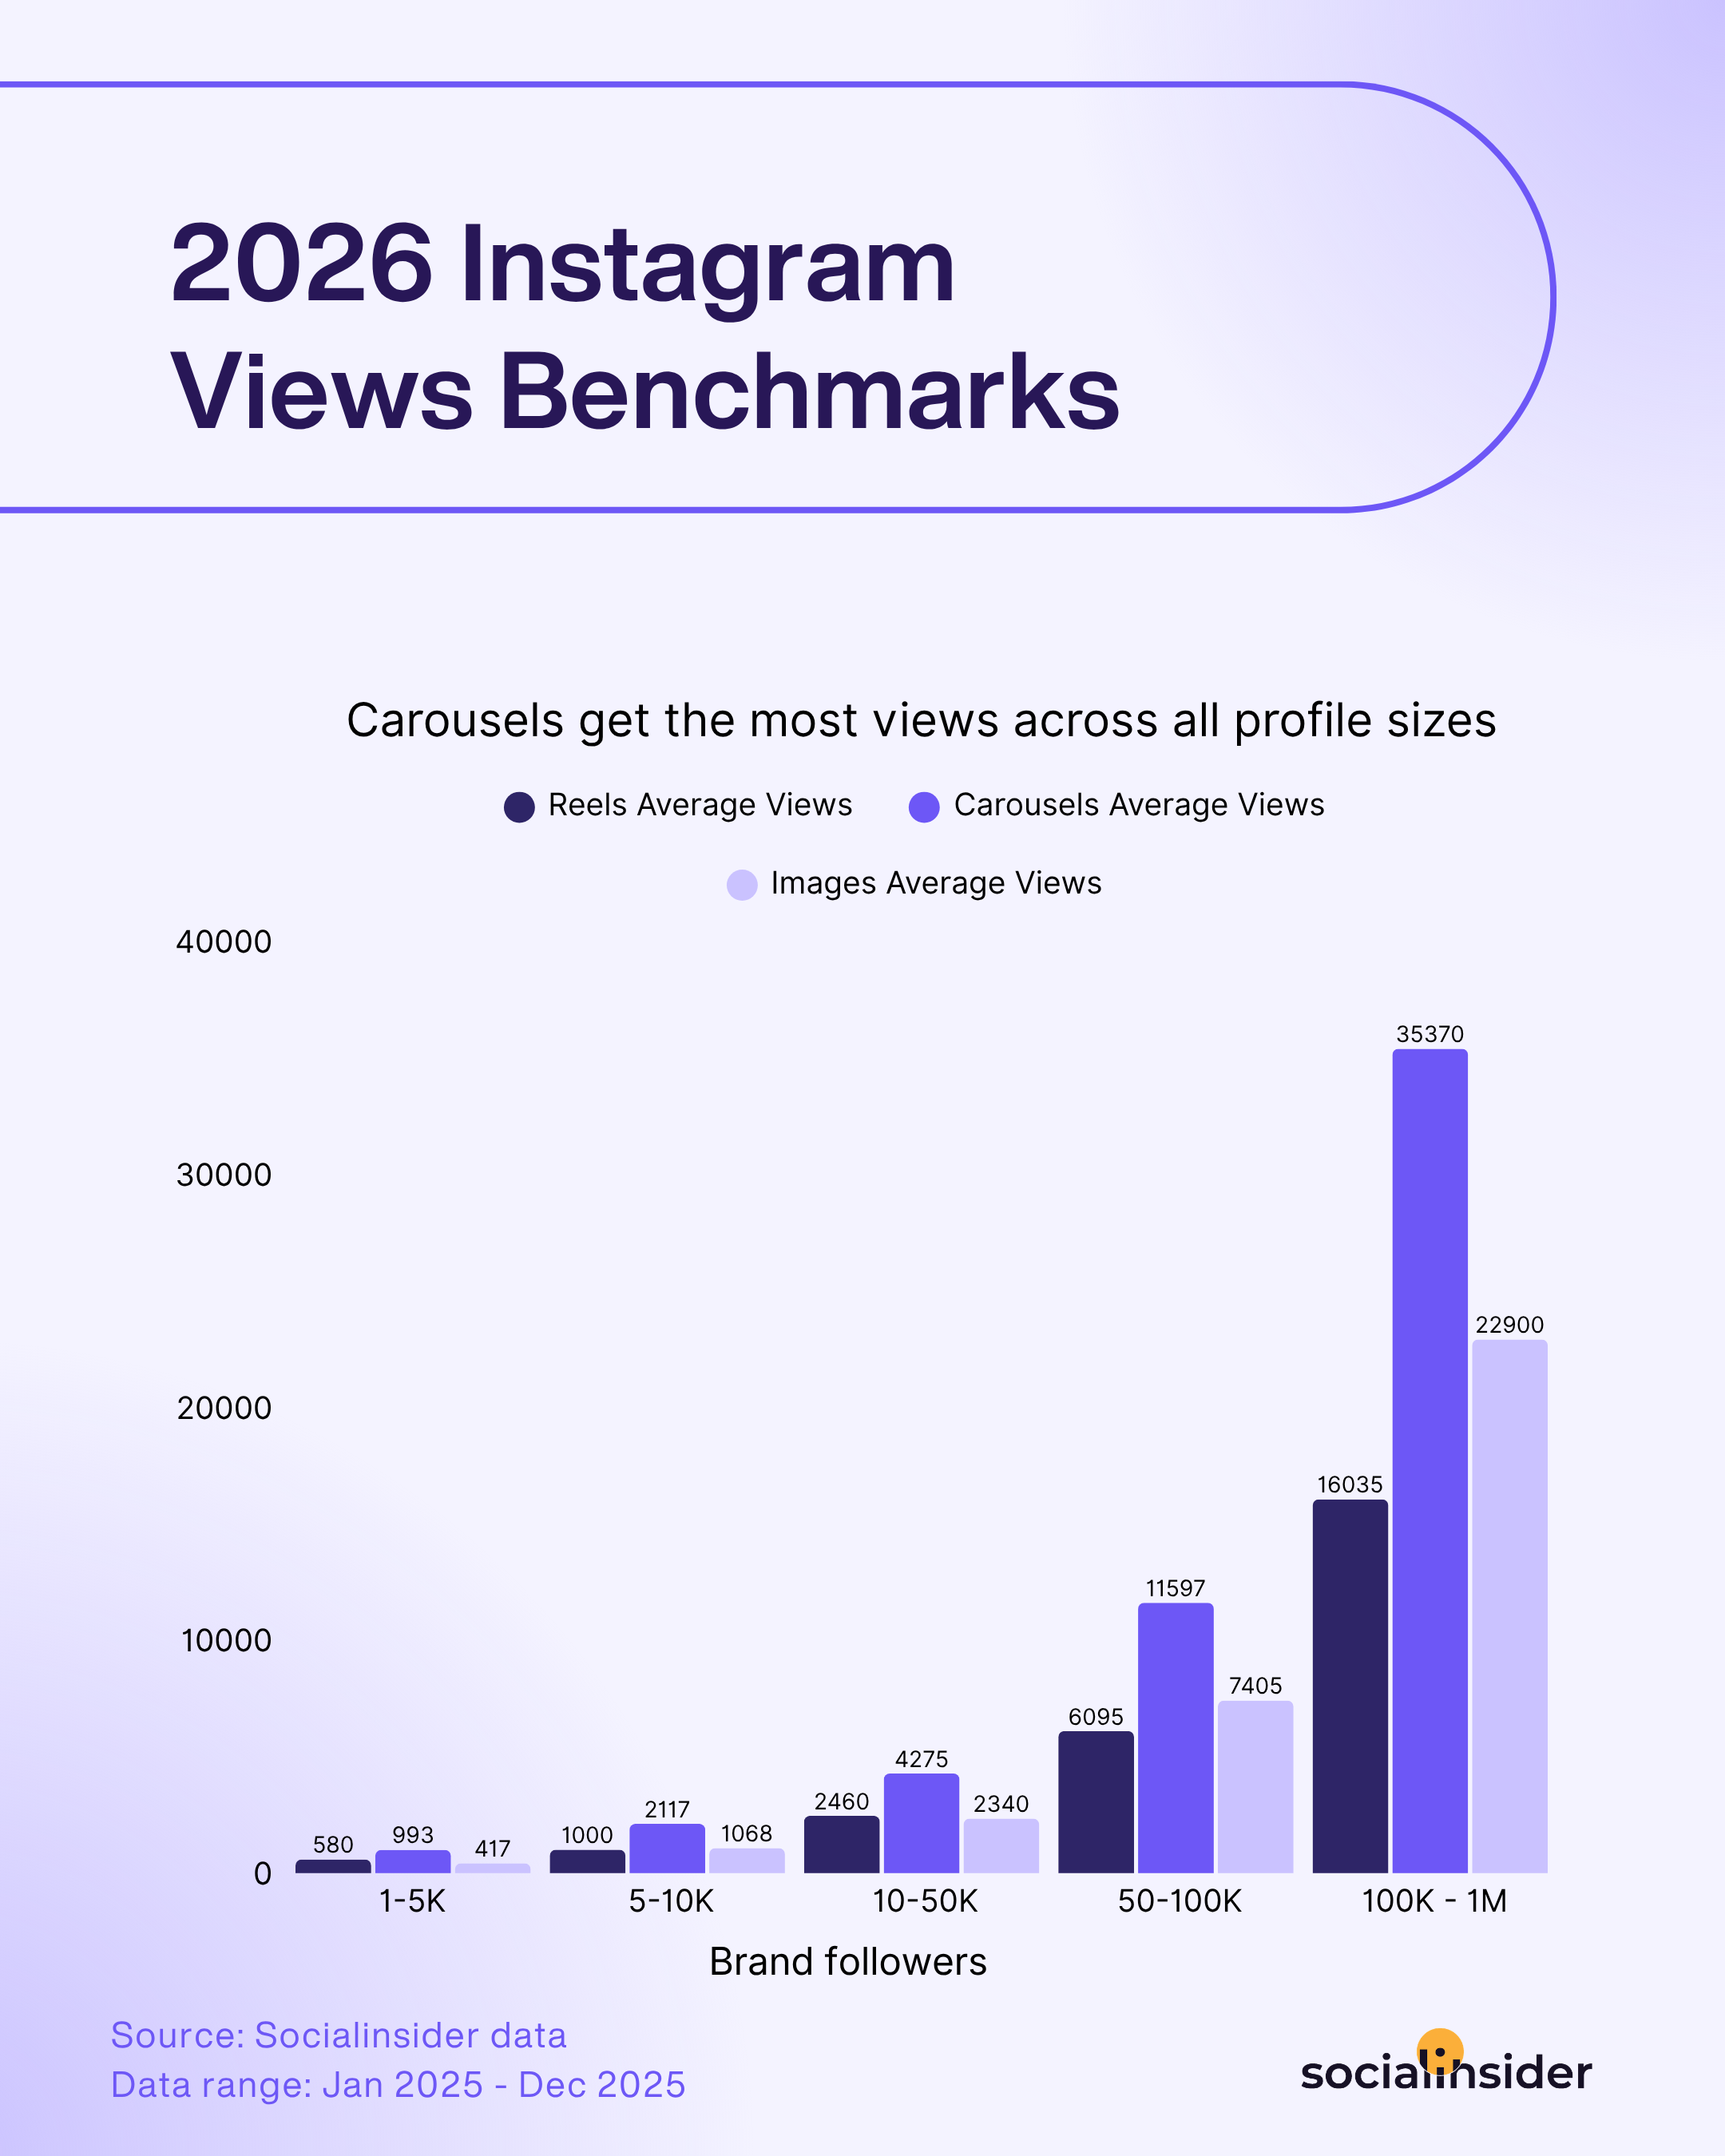
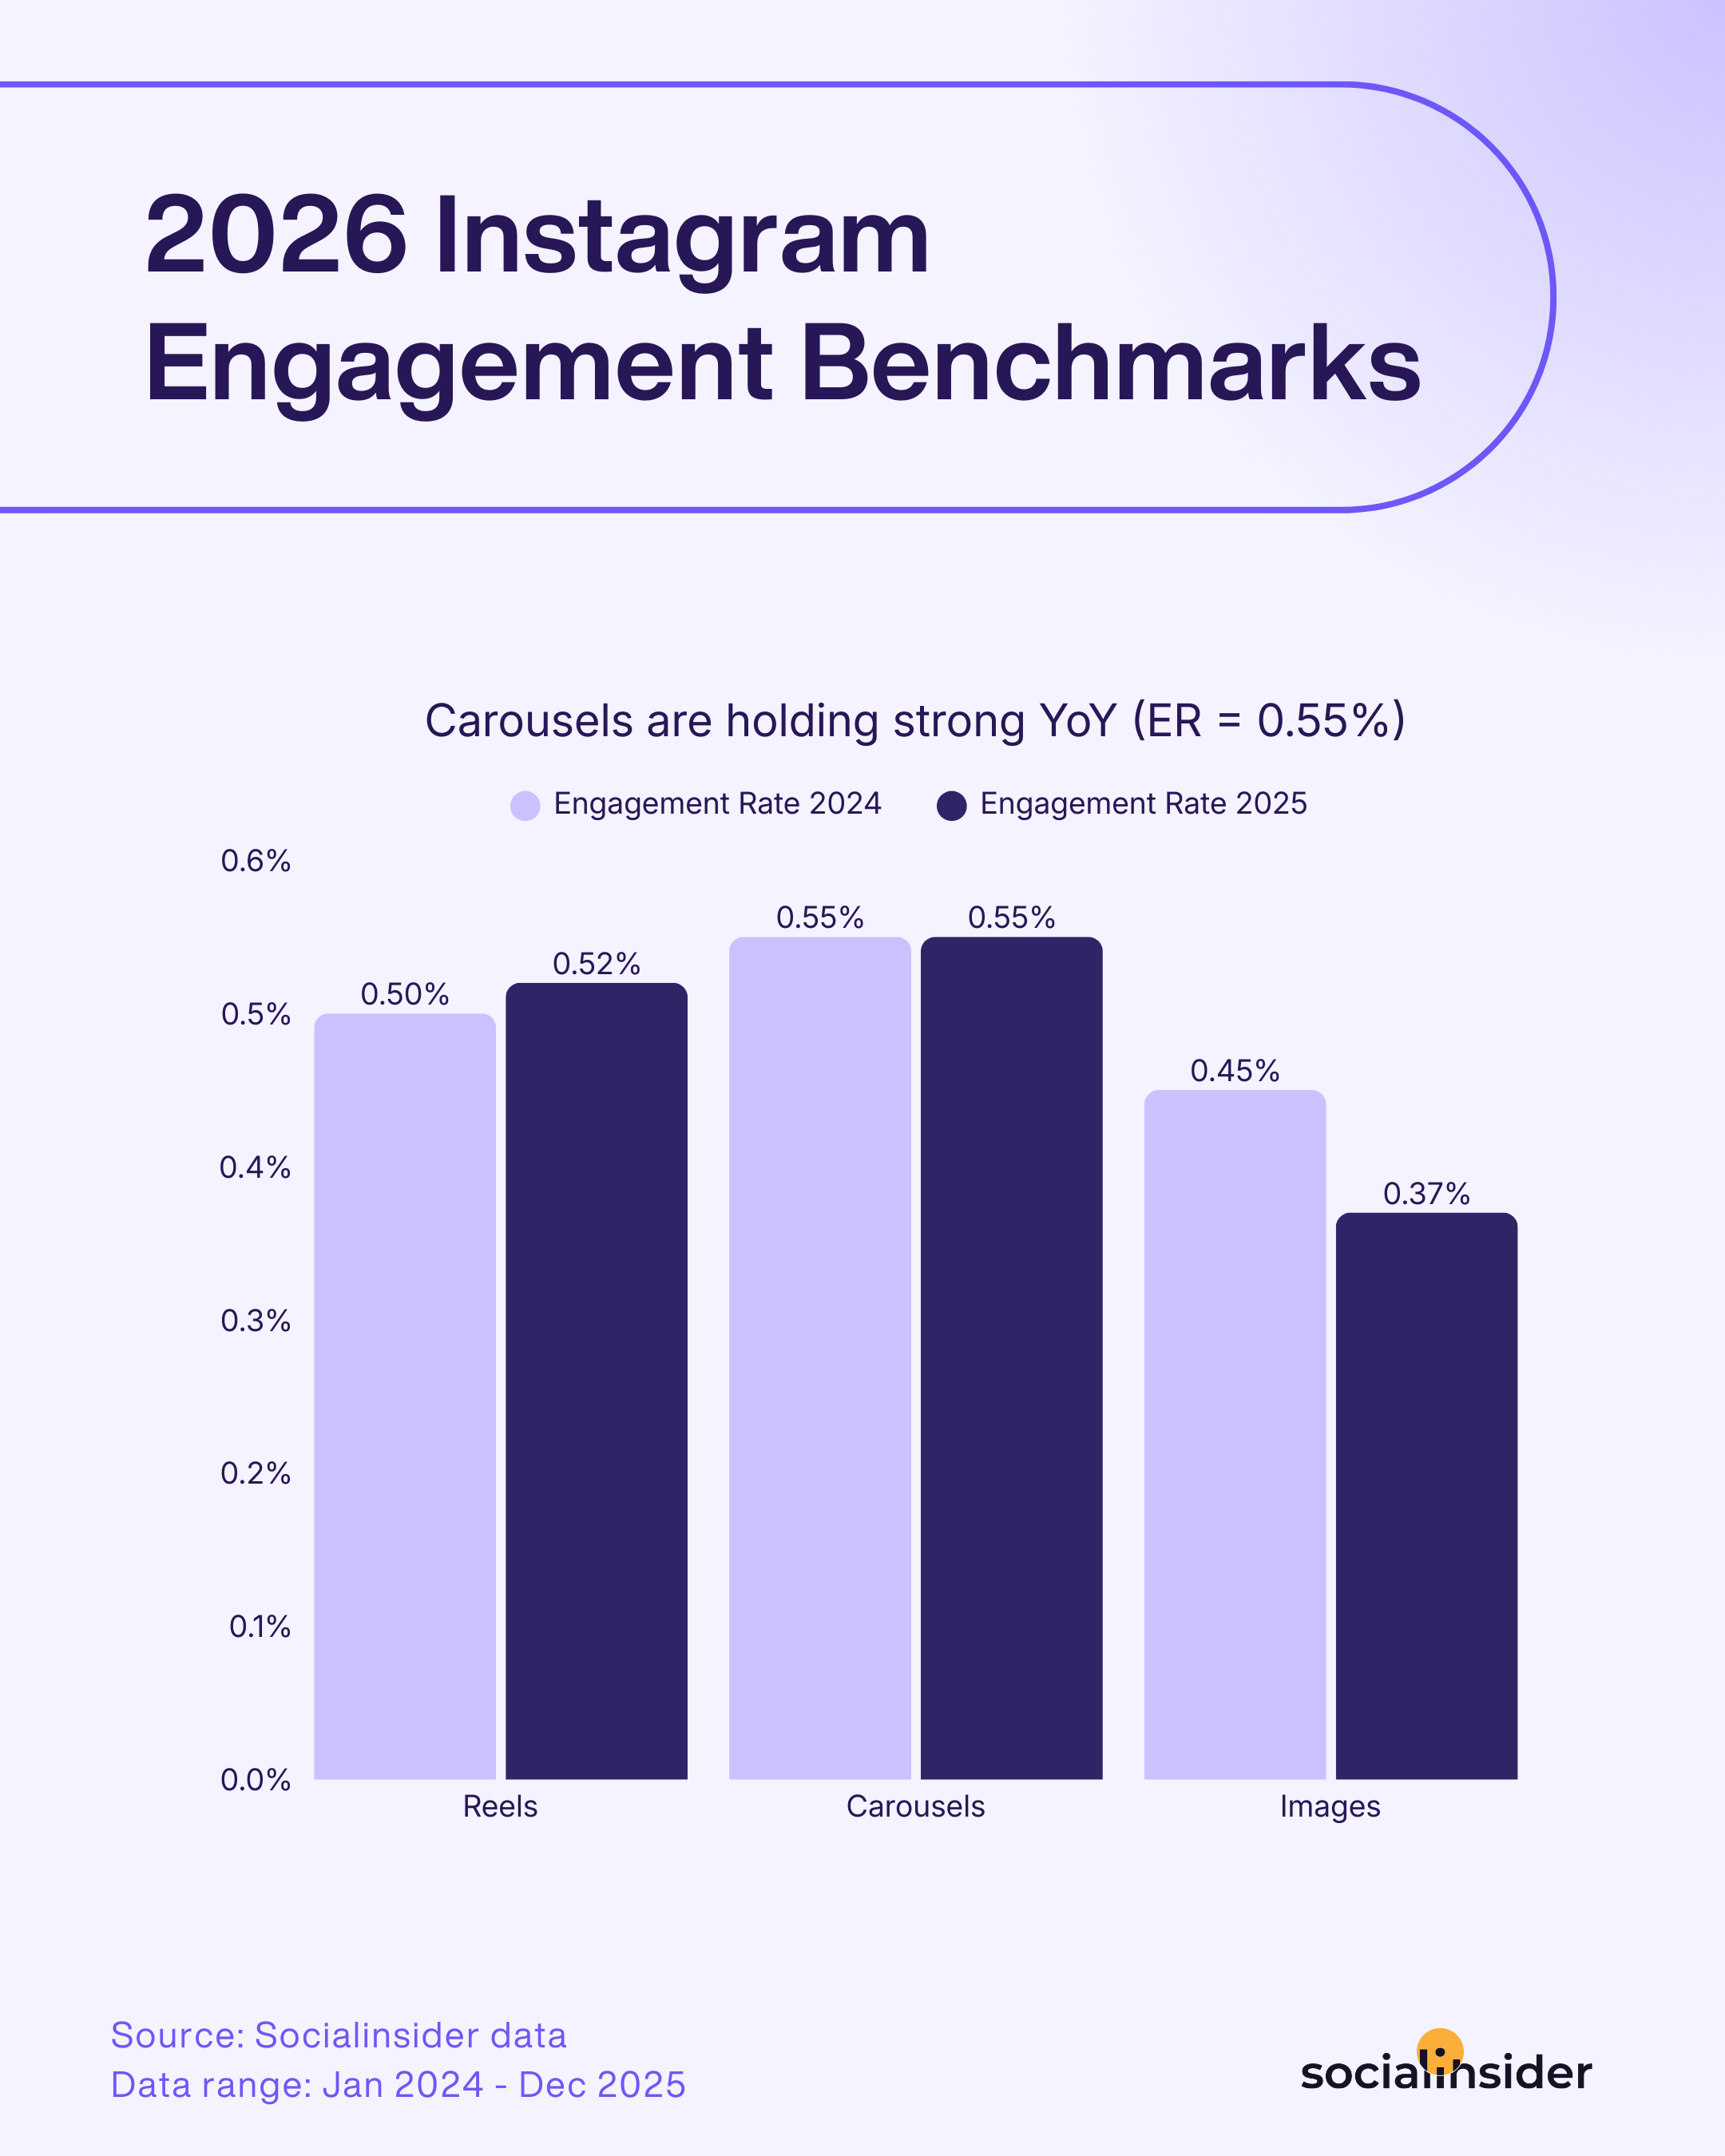
Also important mentioning, in my opinion is that based on Socialinsider's latest Instagram benchmarks report, carousels seems to lead in views performance across any account size.
3. Profile visits
As of January 2025, Instagram deprecated profile visits and website clicks from its API, which means third-party tools can no longer pull this data automatically. You can still see it inside native Instagram Insights under Profile Activity, but it won't appear in most analytics platforms.
It's worth checking manually when you're running campaigns designed to drive profile discovery — collaborations, hashtag pushes, or Reels aimed at new audiences. A spike in profile visits after a piece of content goes wider is a strong signal that it's driving genuine curiosity, not just passive views.
How to read your visibility metrics together
None of these metrics tells the full story in isolation. Here's the read I use when reviewing reach and visibility data:
- Reach up, views flat → content is getting distributed but not stopping people; revisit hooks and thumbnails
- Views up, reach flat → existing audience is engaging more deeply; consider whether you're reaching enough new people
- Profile visits spike after a post → that content format or topic is driving real curiosity; double down on it
Instagram audience metrics
Understanding who engages with your content is just as important as knowing how many people see it.
Audience metrics help you verify you're reaching the right people and whether your strategy is building a real following.
4. Audience demographics
Instagram breaks your audience down by age, gender, and location. These three data points shape every content decision you make, even when you're not explicitly thinking about them.
The most useful thing demographics data does is surface mismatches. If your target audience is marketing managers in their 30s based in the US, but your actual audience skews toward Gen Z in Southeast Asia, your content is reaching people — just not the ones who can act on what you're offering. That's a targeting and content strategy problem, and demographics data is often the first place you see it.
I've also seen demographics data reveal unexpected opportunities. For example, at some point I worked with one brand that was entirely focused on the US market until we noticed consistently strong engagement from Brazil. Rather than ignoring it, we dug into whether the product had relevance there. It did, and adjusting the strategy to include that market as a secondary audience opened up additional revenue. The data pointed us somewhere we wouldn't have looked otherwise.
Check demographics at least monthly, and always after a significant content shift or campaign. If you've changed your content strategy, you should expect to see the audience composition shift over time — that's usually a sign it's working.
5. Follower growth
Follower count is often dismissed as a vanity metric, and I get it — a large following with zero engagement is genuinely meaningless. But follower growth rate is a different thing. As one of the core instagram follower metrics, it shows momentum: is your account attracting new people consistently, or has growth stalled?
Stagnant follower growth over a sustained period usually means one of a few things: your content isn't reaching new audiences, it's reaching them but not compelling enough to convert a follow, or your account positioning isn't clear enough to give someone a reason to stick around.
#6. Post-level follower growth
This is a newer addition to Instagram Insights, rolled out in early 2026, and if you'd ask me, I'd say it's one of the most practically useful instagram growth metrics to come along in a while. It shows you how many new followers each individual post generated.
The implication is significant: you can now directly connect content decisions to audience growth. If a specific Reel or carousel consistently drives follower gains while your other posts don't, that's not luck — it's a signal about what new audiences find compelling enough to follow you for. I've started using this data to identify what I call "acquisition content" versus "retention content." Acquisition content attracts new followers; retention content keeps existing ones engaged. Both matter, but they often look different, and knowing which is which lets you build a more intentional content mix.
How to read your audience metrics together
- Demographics mismatch your ICP → content angle, tone, or distribution channels need adjustment.
- Follower growth stalled but engagement is healthy → you're retaining well but not reaching new people; invest more in unconnected reach formats (Reels, collabs).
- Post-level follower growth concentrated on one content type → that's your acquisition format; make more of it.
Instagram core engagement metrics
If there's one category of instagram metrics to track that shows up in every report I write — regardless of client, industry, or campaign objective — it's engagement. These are the metrics that show whether your audience is actually connecting with what you're putting out, or just scrolling past it.
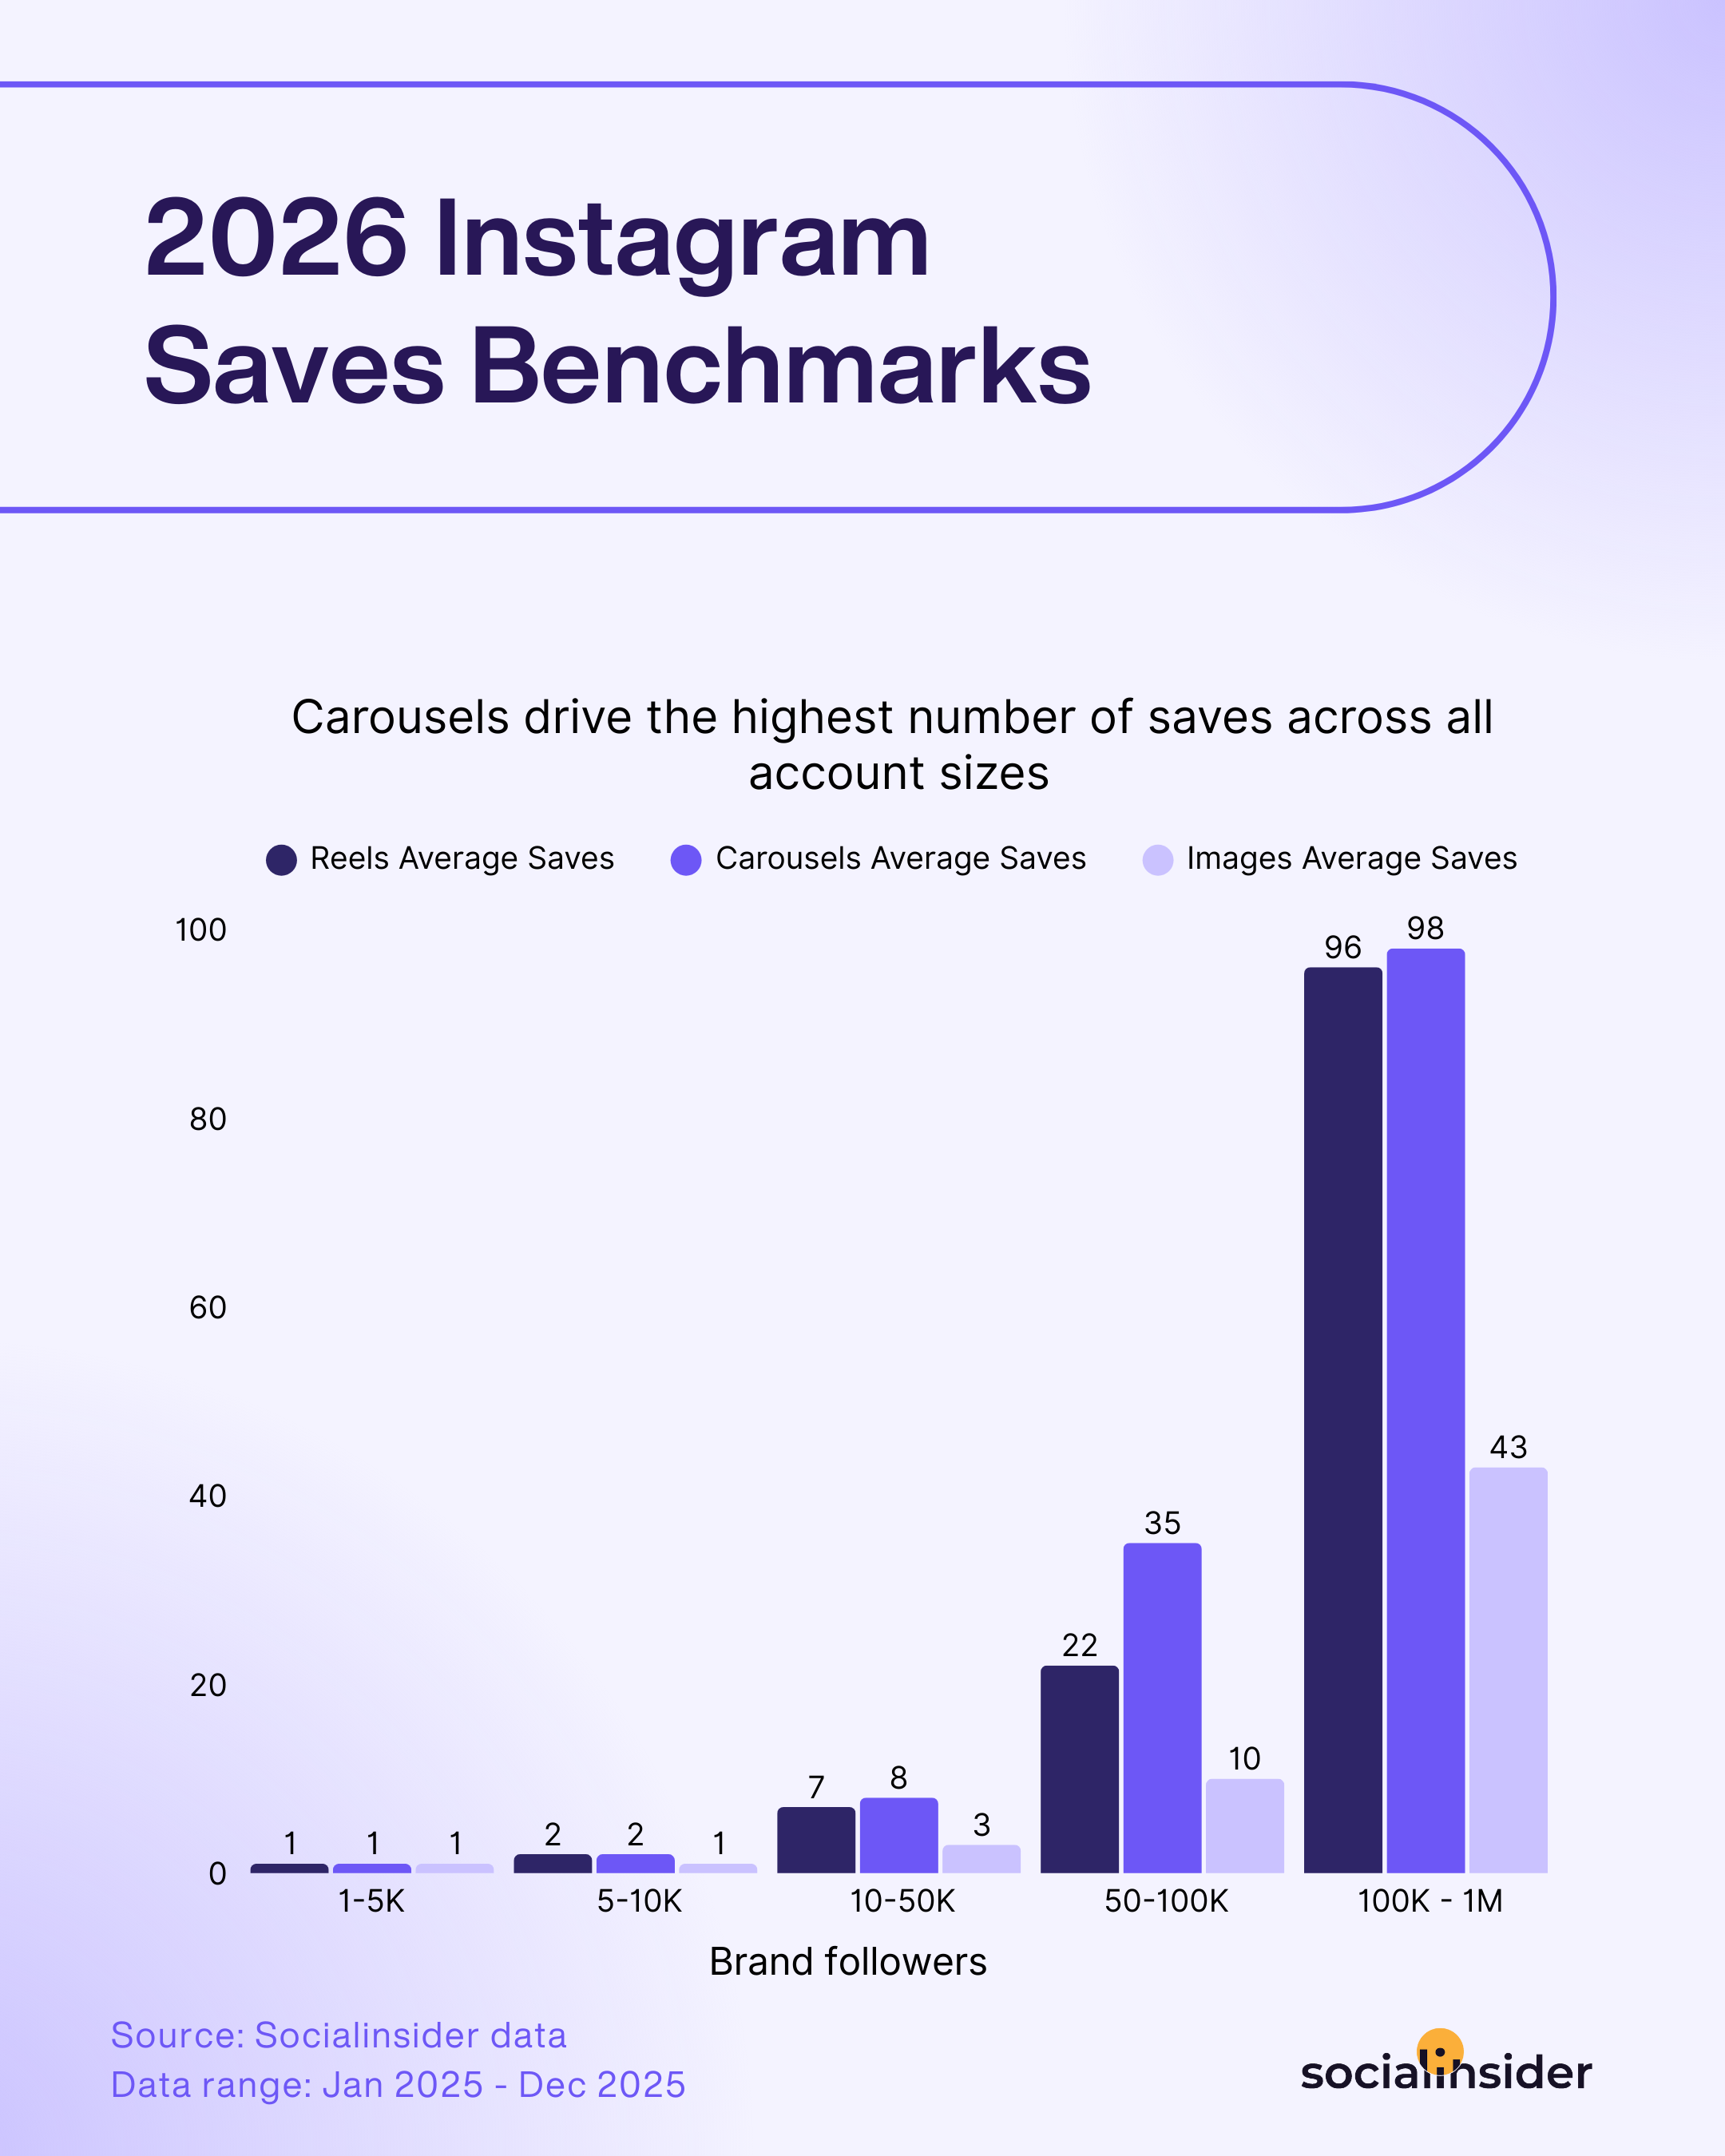
#7. Likes, comments, saves, and shares
These four actions are the building blocks of instagram post engagement metrics, and while they're often grouped together, they don't carry equal weight — either for your strategy or for the algorithm.
Shares are the most powerful signal. When someone shares your post to their Stories or forwards it in a DM, they're putting their own credibility behind your content. Instagram's algorithm treats this as a strong indicator that content is worth distributing more widely — particularly for unconnected reach. If I had to pick one instagram user engagement metrics to optimize for above all others right now, it would be shares.
Comments are close behind. They require genuine effort — someone had to stop, think, and type something. Beyond the algorithm signal, comments are also your richest source of qualitative feedback. I read them carefully, especially after a new content format or topic. The sentiment in comments often tells you things that quantitative data can't.
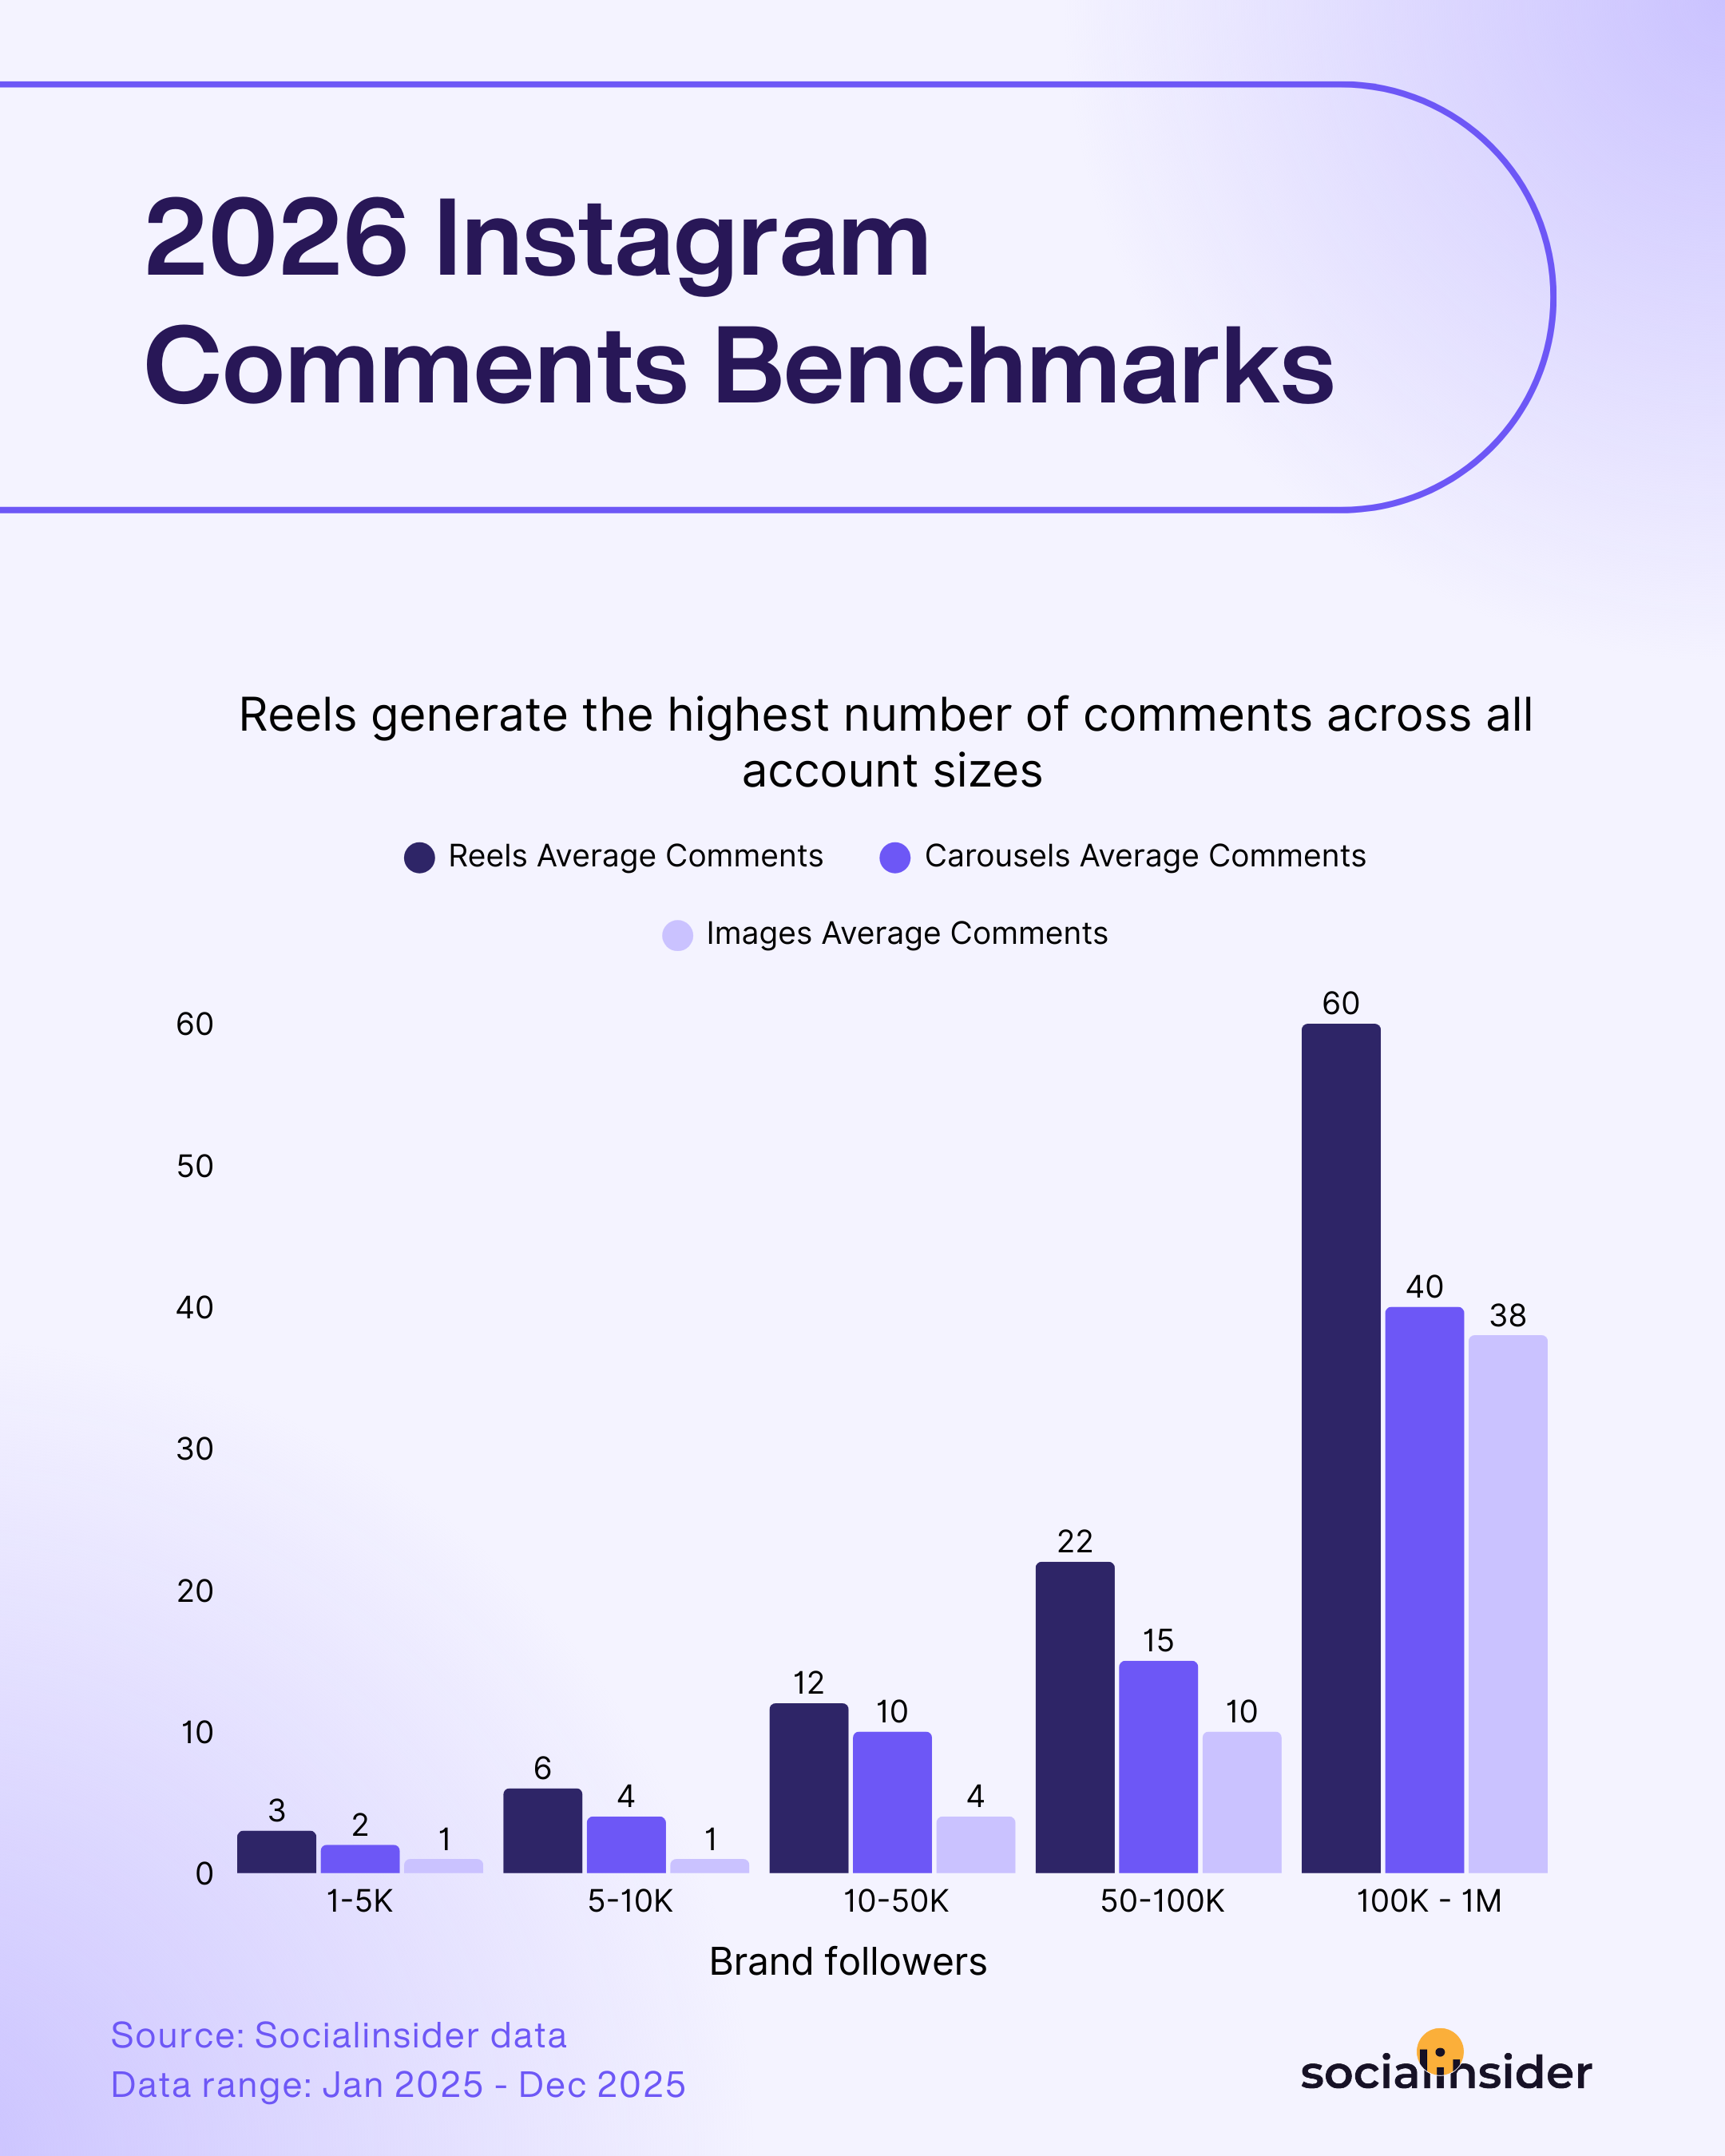
Saves are the metric I find most useful for evaluating content longevity. When someone saves a post, they're signaling that it has lasting value — they want to come back to it. Educational content, how-to guides, and reference-style posts tend to accumulate saves over time, long after the initial reach spike has faded. If you're trying to build a reputation as a genuinely useful resource in your niche, saves are your north star.
Likes sit at the bottom of the hierarchy in terms of algorithmic weight, but they're not useless. They're a lightweight signal of general approval, and as Mosseri has noted, they still influence connected reach — keeping your content visible to existing followers. I treat likes as a baseline check: if a post is getting unusually low likes relative to its reach, something about the content isn't landing, even if I can't immediately tell what.
Here's Paloma's takeaway as well:
For me, saves and shares are some of the strongest indicators of resonance, they show that content has moved beyond passive consumption into something more intentional, whether that’s inspiration, relevance, or utility.
#8. Engagement rate
All of those individual actions roll up into the metric that matters most for comparative analysis: engagement rate. Raw engagement numbers are hard to benchmark across accounts of different sizes — 500 likes means something very different on a 2,000-follower account versus a 200,000-follower one. Engagement rate normalizes that.
There are three ways to calculate it, and each answers a slightly different question:
Engagement rate by followers — (Likes + Comments + Saves + Shares) / Followers × 100 Best for: understanding how well your content resonates with your existing audience. This is the standard formula for most reporting and benchmarking.
Engagement rate by reach — (Likes + Comments + Saves + Shares) / Reach × 100 Best for: evaluating campaign performance and brand awareness content, where you want to measure how people respond regardless of whether they follow you.
In my day-to-day work, engagement rate by reach has been the most useful for client reporting — it gives a true picture of how content performs against everyone who actually saw it. But I'll often look at both cases for a complete read, especially when instagram post performance metrics from a campaign need to be reported across different account sizes.
Additional engagement metrics for powerful insights
Engagement by content format
When you run a social media analysis for Instagram (or other platforms), one of the most useful things you can do is compare how different content formats are working for you.
Single images, carousels, Reels, and Stories each have their own strengths, but what works best depends on your audience. Best practices and benchmarks are helpful starting points, but they don't always hold true for everyone. The only way to know what works for your account is to track it.
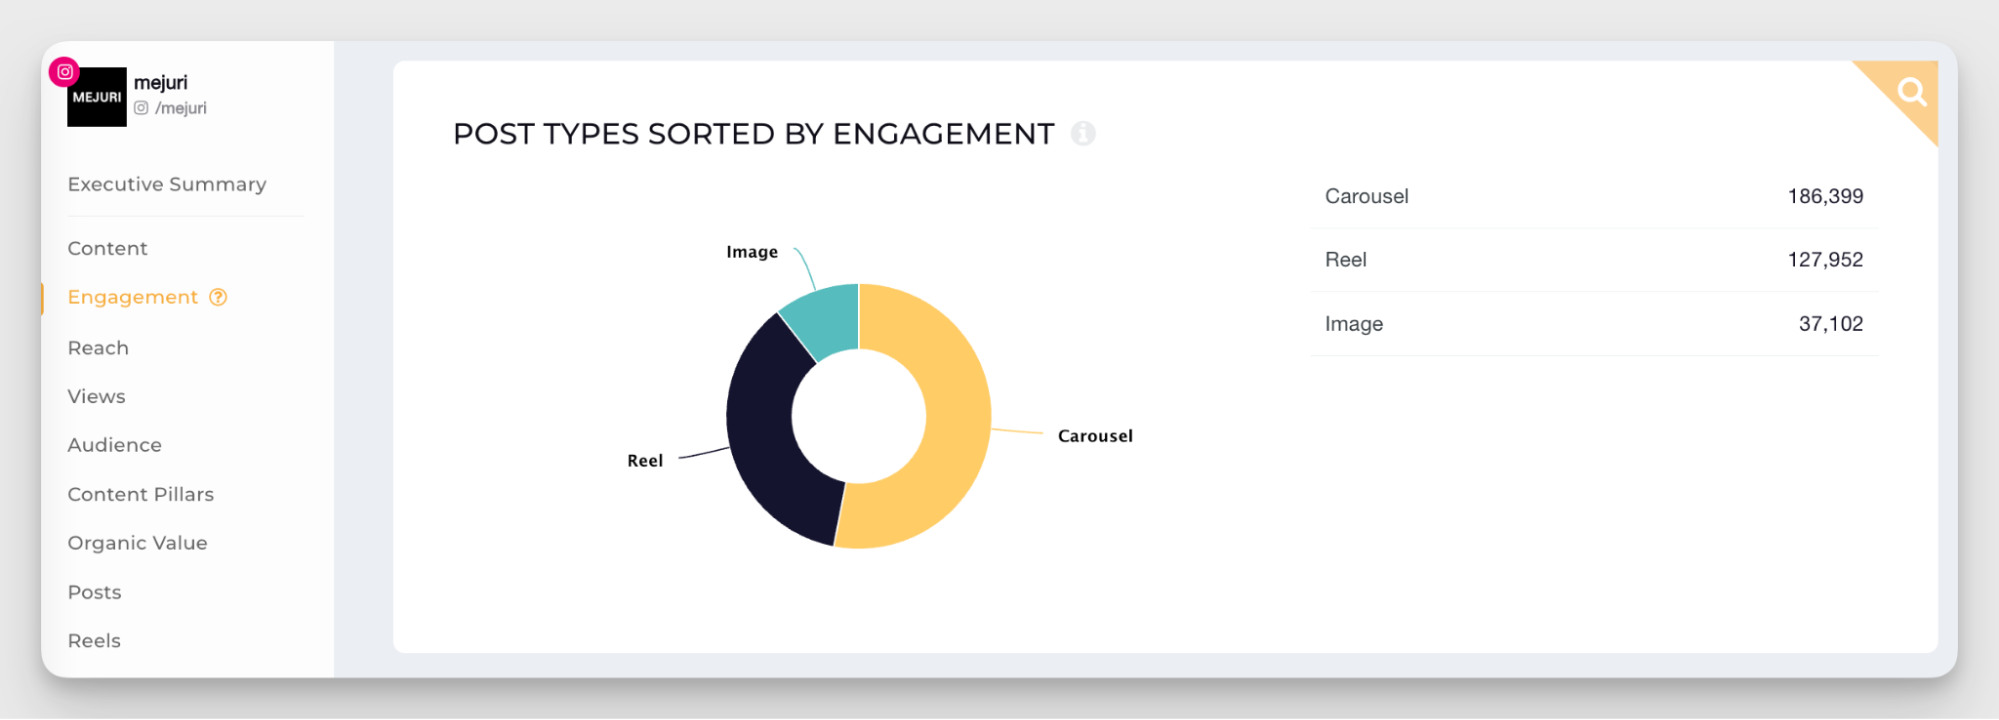
I also like to analyze what kind of audience interacts with each format. Reels tend to attract new viewers — people discovering your content through the algorithm. Carousels and single-image posts usually perform better with existing followers who are already invested in your brand.
Most engaging content pillars
Content pillars are the recurring themes or topics that you use on your Instagram account.
Pillars are like a handrail that helps you navigate your own content and divide posts into thematic buckets: educational tips, behind-the-scenes, user-generated content, product highlights, and more.
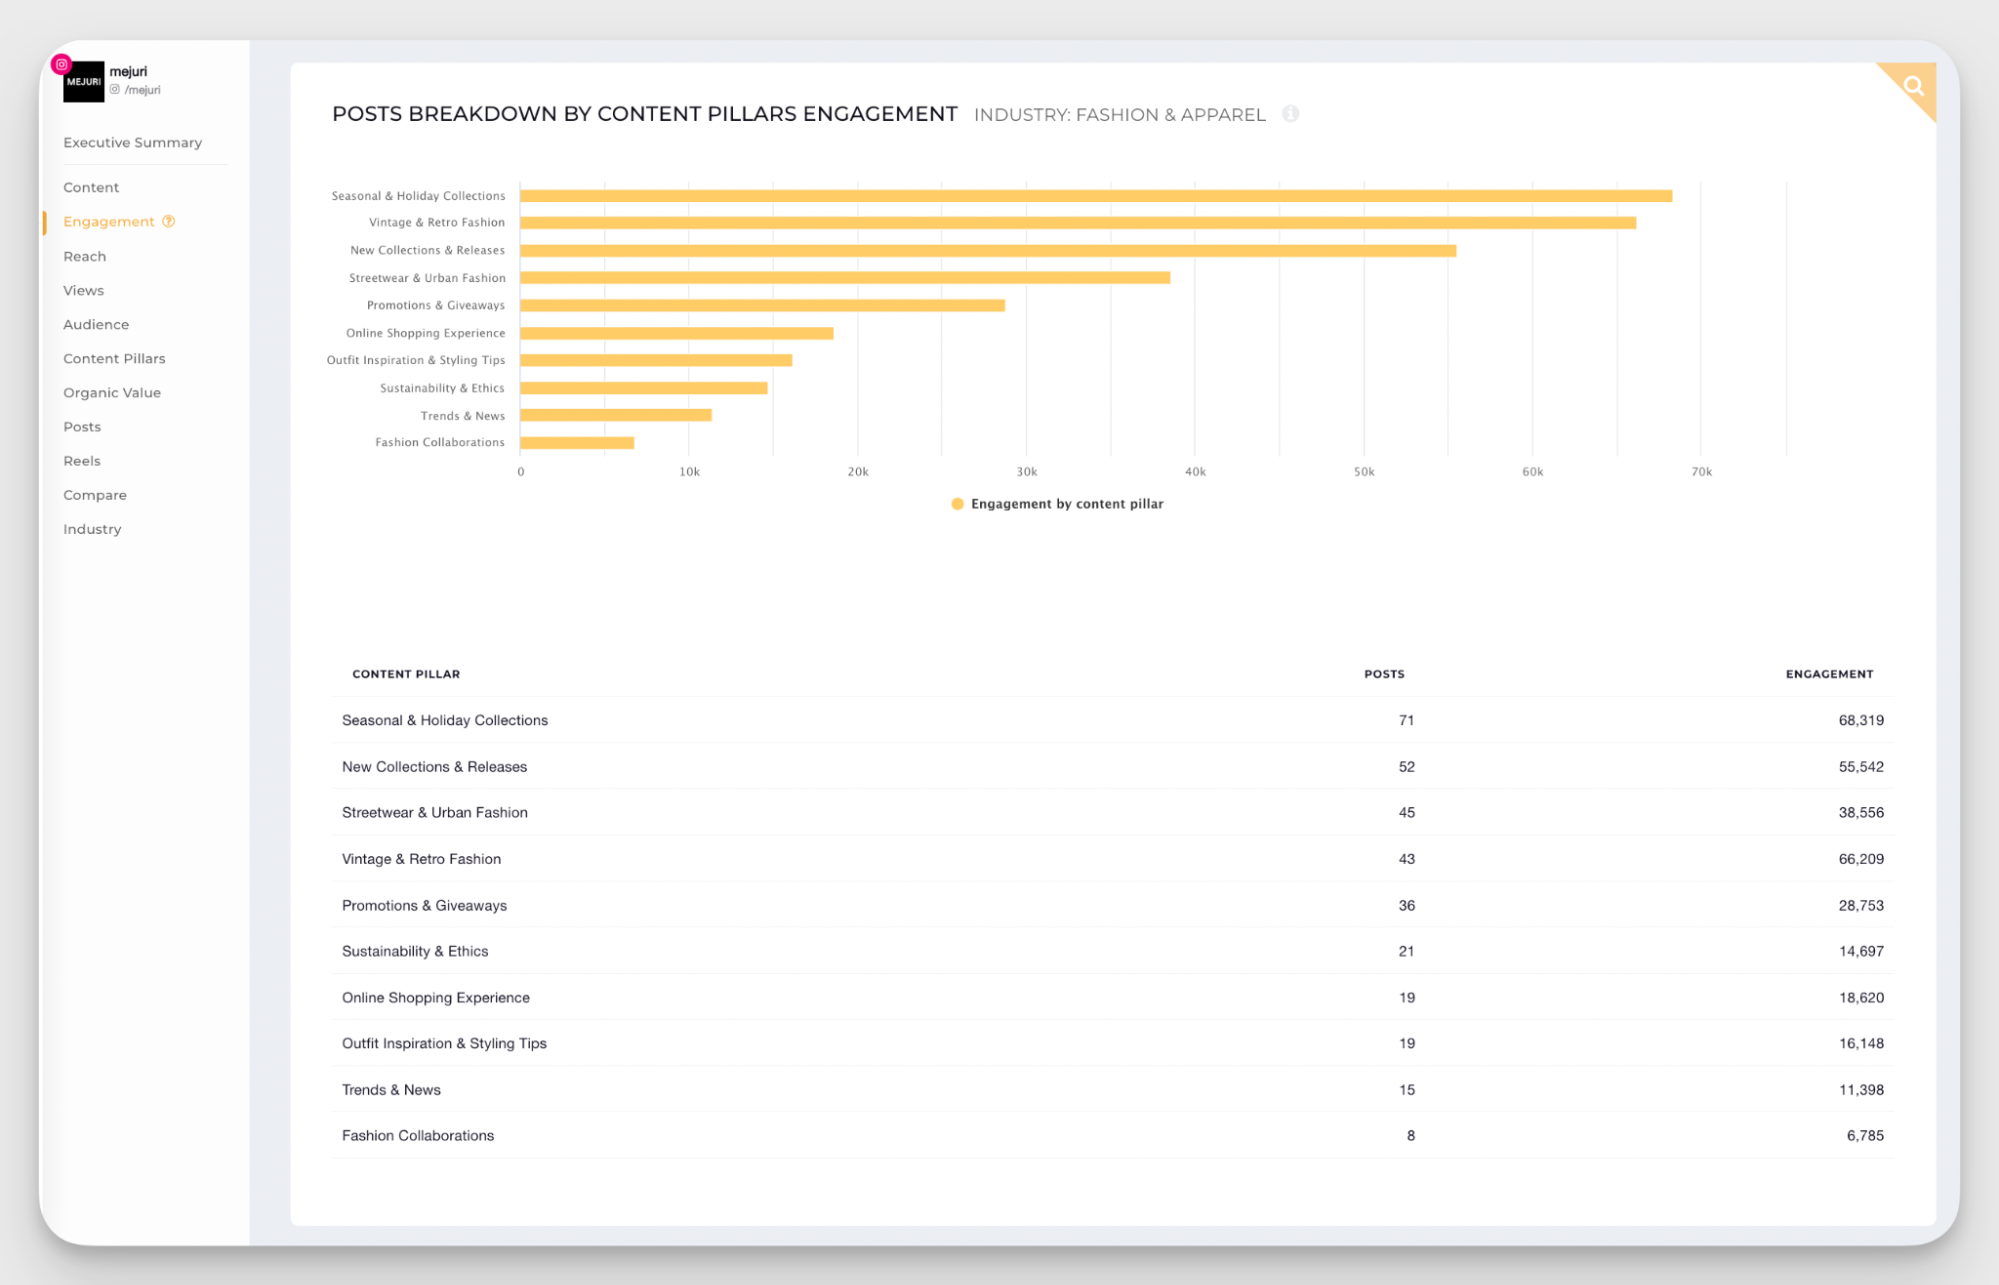
Tracking which pillars perform best helps you see patterns in what your audience wants from your profile. Maybe you've been pushing product posts hard, but educational content is consistently getting double the engagement. That's a signal to shift focus.
I use this data to optimize my Instagram strategy. If one pillar is underperforming, I either need to rethink how I'm presenting it or accept that my audience just isn't interested. And if a pillar I've barely touched is outperforming everything else, that's a cue to explore it more.
Paloma also added:
Quantitative data tells you what happened, but qualitative analysis helps you understand why. I look closely at top-performing content to identify recurring patterns - whether that’s format, tone, or subject matter; as well as underperforming posts to uncover potential gaps or missed opportunities.
Most engaging posts
Top-performing posts are simple but powerful. They give you the context on what's working and why for your content analysis.
On Instagram, top posts help you identify which combination of factors drove success. Was it a Reel using trending audio? A carousel with educational content? A single image with a strong caption hook?
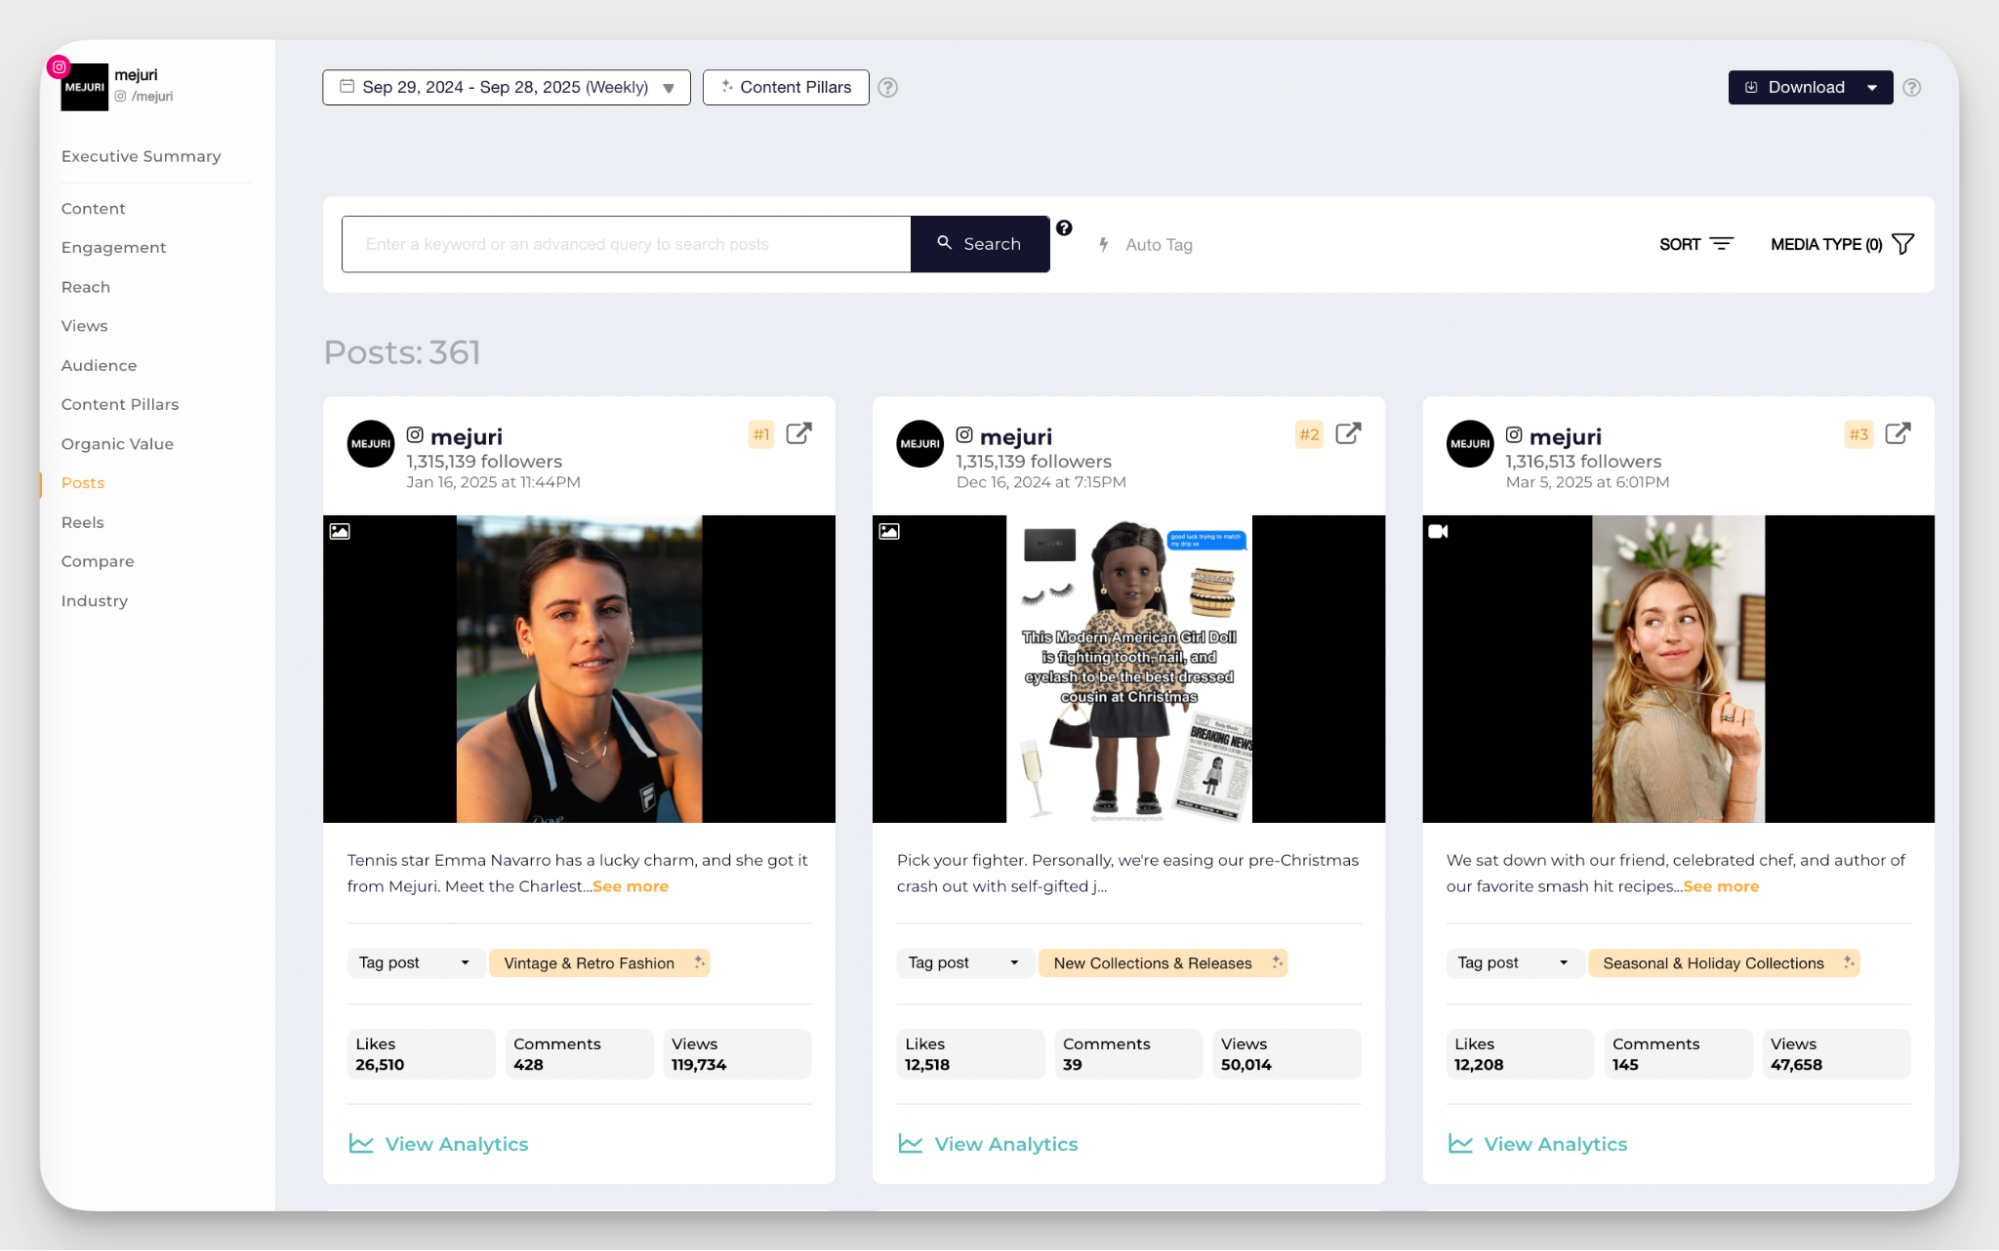
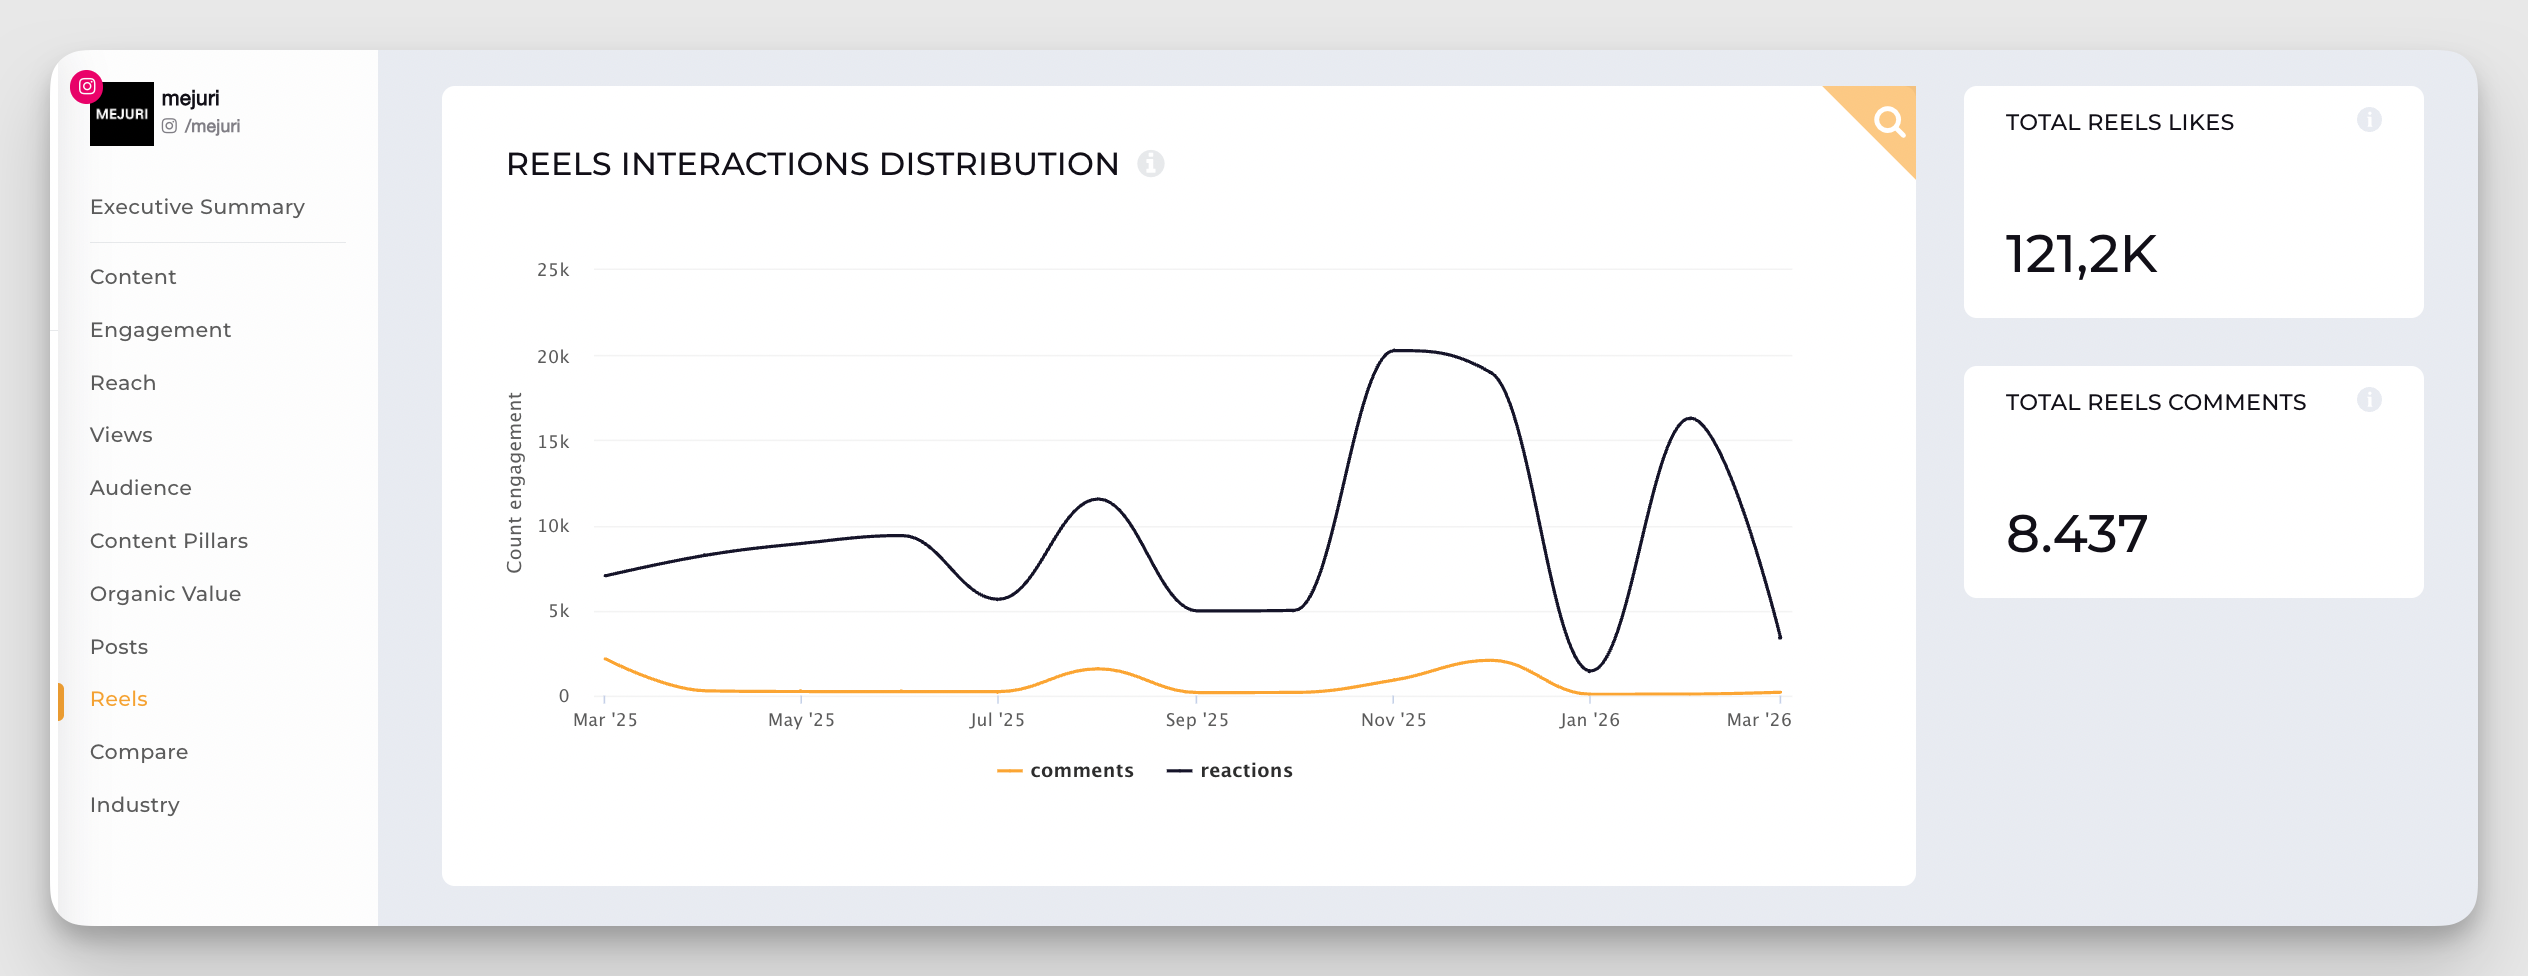
Socialinsider helps you quickly identify the top-performing posts of any Instagram account. Choose the account you want to analyze and navigate to the Posts tab. Here, you can see the top performers sorted by the metrics of your choosing: engagement, engagement rate, estimated reach, views, likes, or comments.
After tracking your best performers for a while, you can form a pattern. If educational carousels keep landing in your top 10, that's not luck or coincidence, but strategy.
I always review top posts at the end of each month or campaign. The goal is not to recreate the viral moments, but rather to understand what resonates so I can apply it moving forward. It’s also good to double down on your best performers.
When I asked her about her approach, Paloma also mentioned:
It depends on the level of reporting required, but I typically build a stack that combines platform-native insights with third-party tools.
How to analyze instagram engagement metrics
When I'm reviewing instagram post engagement metrics for a monthly report, here's the sequence I follow:
- Start with engagement rate by reach at the account level — is it trending up, down, or flat?
- Break it down by format — which content types are driving the most engagement relative to their reach?
- Identify the top 5 posts by engagement rate — what do they have in common? Format, topic, caption style, posting time?
- Look at the saves-to-likes ratio on your best posts — a high ratio signals content with lasting utility, not just in-the-moment appeal
- Check shares on your top performers — if shares are high, that content has distribution potential worth building on
Carousel-specific metrics
Carousels have their own layer of instagram content performance metrics that most tools don't surface by default, but that are genuinely worth tracking.
#9. Swipe-through rate
It measures what percentage of people who saw your carousel actually swiped through to see more slides. A low swipe-through rate on slide one means the opening frame isn't compelling enough to earn the next swipe — it's the carousel equivalent of a weak Reels hook.
#10. Per-slide drop-off
This metric shows where you're losing people within the carousel. If 80% of viewers make it to slide three but only 40% reach slide five, something on slide four is killing momentum — a weaker visual, a break in narrative flow, or simply too much text. This data is diagnostic gold when you're trying to understand why a carousel didn't perform as expected.
Reels-specific metrics
Reels have become the primary discovery engine on Instagram. They're the format Instagram pushes hardest to unconnected audiences, and they're where most accounts see their highest reach numbers. But high reach doesn't automatically mean high performance — and the instagram reel metrics that matter go well beyond view counts.
#11. Views
Views are the headline number for any Reel, and they're what most people look at first. But the raw view count only tells you how many people started watching — it says nothing about what happened next.
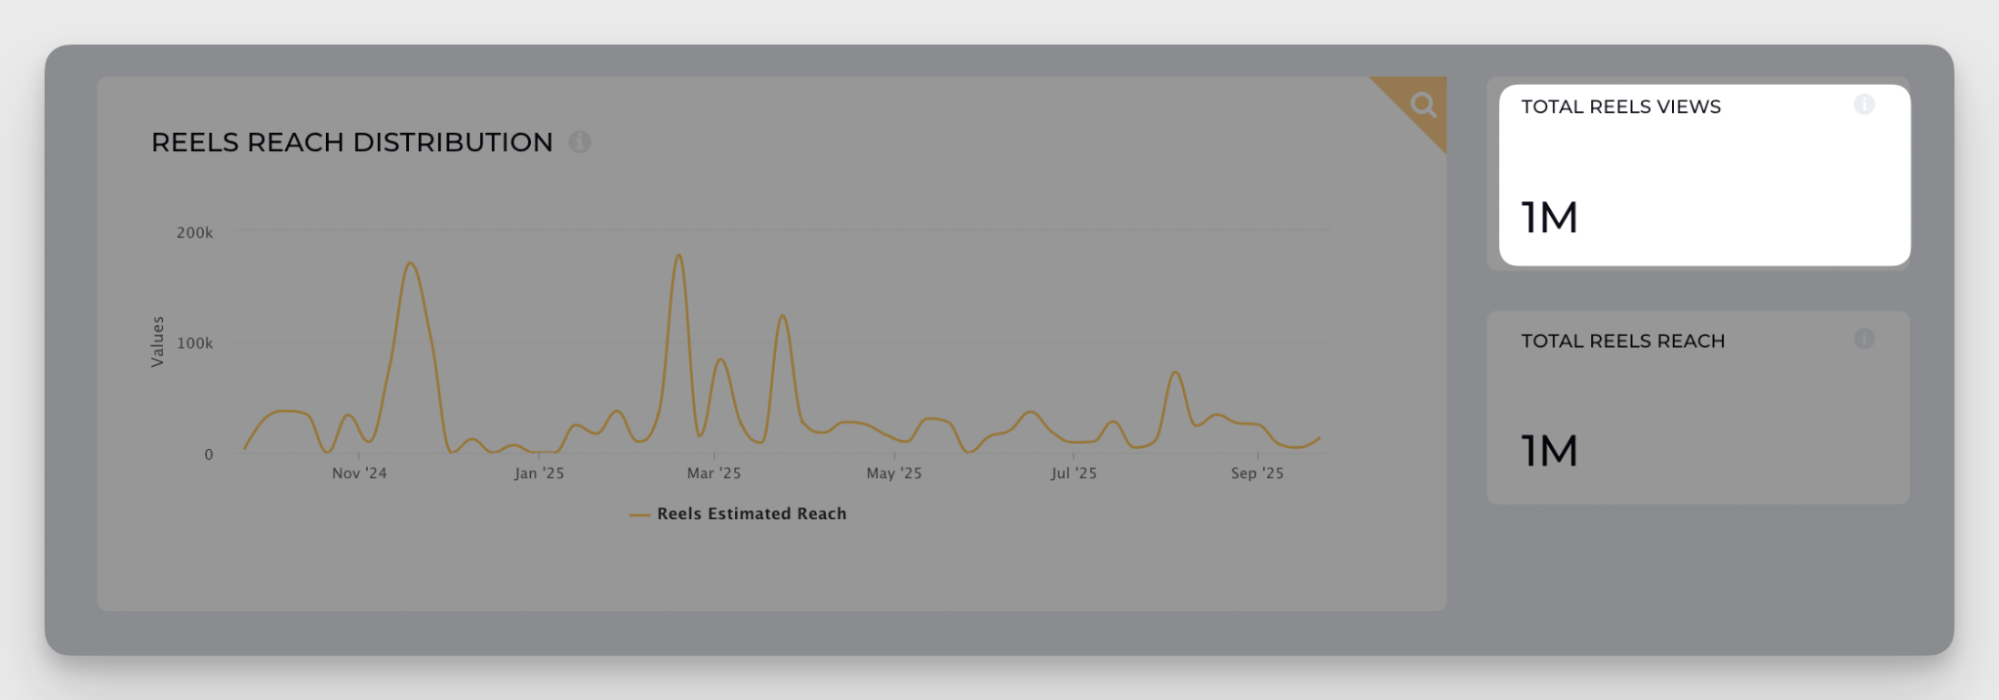
What I find more useful is the split between follower views and non-follower views. Instagram breaks this down inside native Insights.
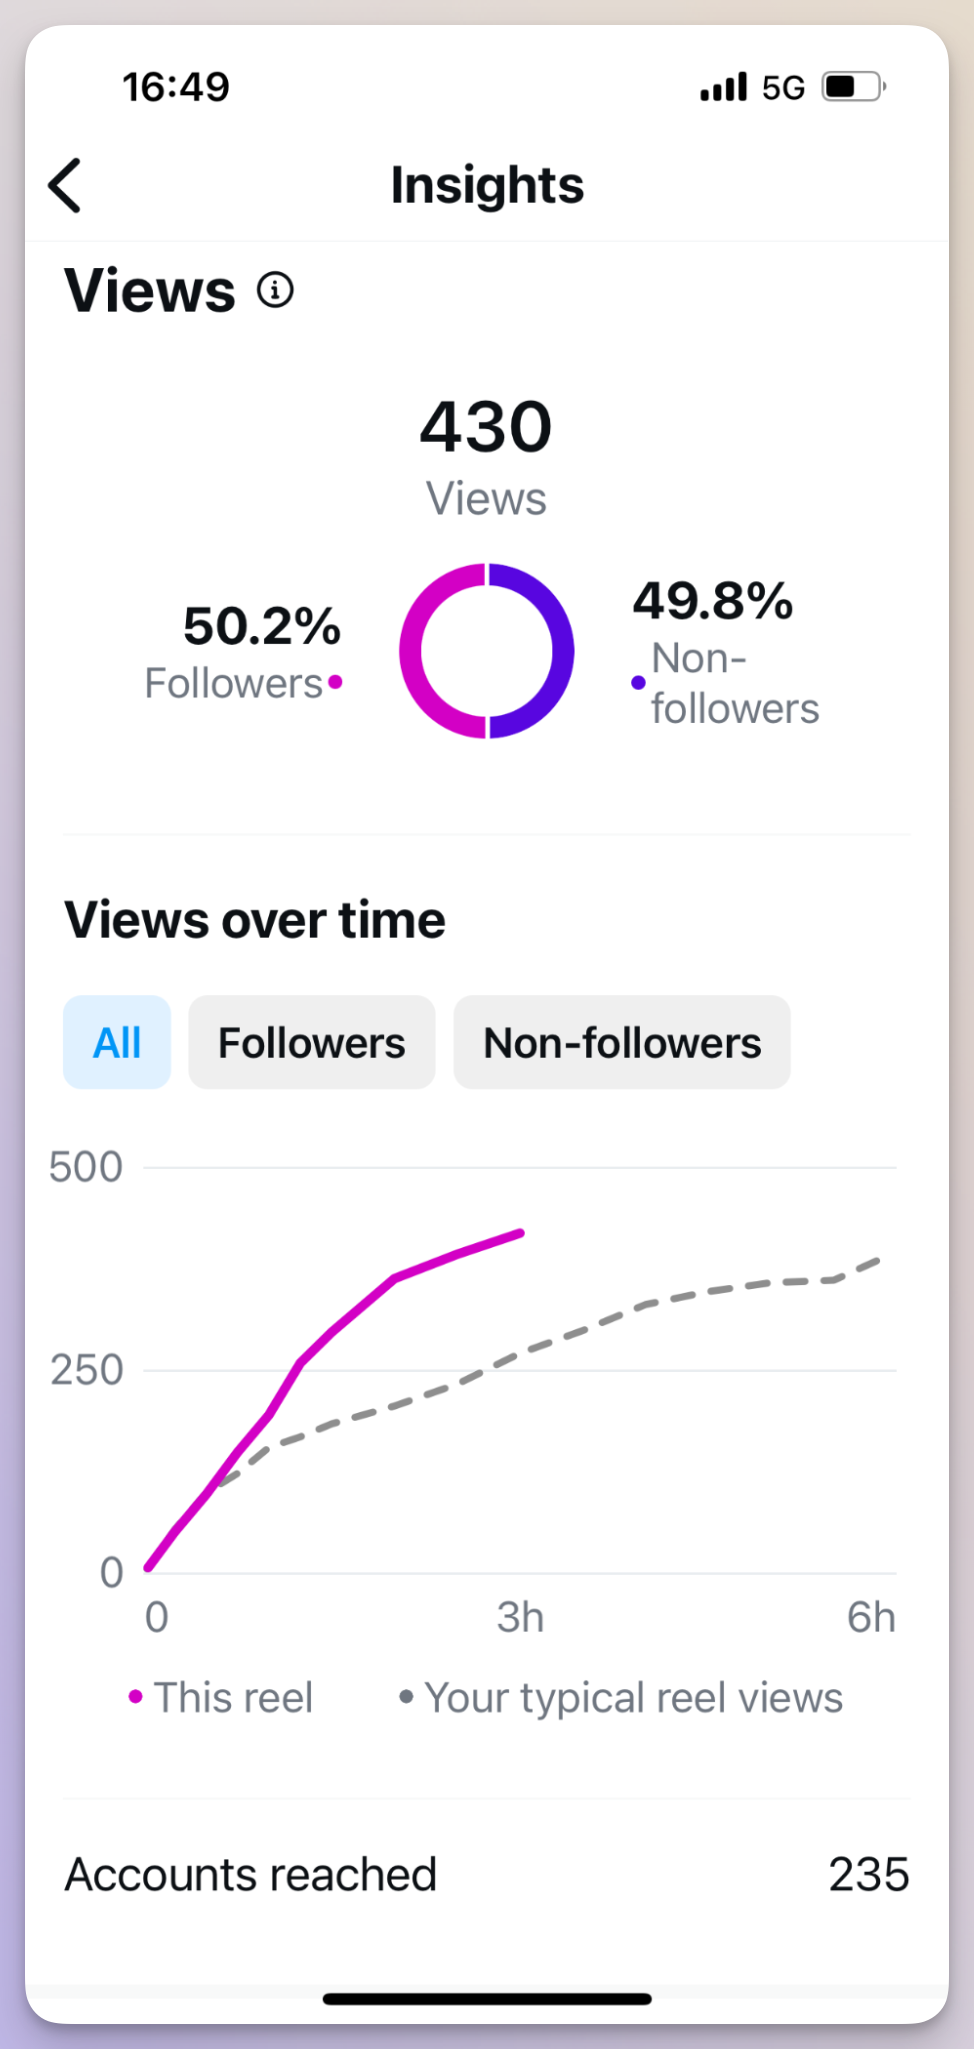
A Reel with 80% non-follower views is doing something very different from one with 80% follower views — the former is working as a discovery tool, the latter is largely serving your existing audience. Neither is inherently better, but understanding which you're getting helps you evaluate whether a Reel is contributing to growth or just performing well within your current community.
#12. Watch time and average watch duration
Watch time metrics are among the most important instagram Reels insights metrics for understanding whether your content is actually holding attention or just registering a passive view.
Average watch duration tells you how long the typical viewer stuck around. The 3-second view rate — what percentage of viewers watched past the first three seconds — is the hook diagnostic. If people are dropping off in the first three seconds, your opening frame isn't compelling enough to earn more attention. I've seen accounts with strong overall reach numbers quietly bleeding opportunity here: the content is getting distributed, but almost nobody is actually watching it.
The general benchmark I work toward is getting at least 50% of viewers past the three-second mark. If you're consistently below that, test different hook formats — a bold visual statement, a surprising opener, a direct question — before changing anything else about the content.
#13. Completion rate
Completion rate is one of the most underreported instagram Reels performance metrics, and one of the strongest algorithm signals available. It measures what percentage of viewers watched your Reel all the way to the end.
A high completion rate tells Instagram that your content is genuinely engaging — people aren't just stumbling across it, they're watching it through. The algorithm responds by distributing it more widely. I've seen Reels with modest initial reach numbers compound significantly over days and weeks because the completion rate was unusually strong.
The implication for content production: pacing matters. Reels that drag in the middle lose viewers before the end. If your completion rate is low despite a strong hook, the problem is usually in the middle third — not enough momentum to carry viewers through.
#14. Replays
Replays measure how many times viewers watched your Reel more than once. It's a metric that rarely gets talked about but is worth monitoring, particularly for content that's dense with information or visually interesting enough to reward rewatching.
A high replay rate is a strong quality signal — it means the content delivered enough value or entertainment that people wanted to experience it again. For educational content especially, replays often indicate that viewers are using the Reel as a reference, not just consuming it once and moving on.
Here's how Paloma also treats Reels specific metrics:
Reels behave very differently from static content, so I always analyse them separately.
I focus on a core set of performance indicators: plays and reach to understand distribution, watch time and average retention to assess content quality, and shares and saves to gauge how valuable or engaging the content is. I also look closely at how many follows a Reel drives, as that’s a strong indicator of long-term audience growth,
Retention is particularly important—if viewers are watching to the end or rewatching, it signals that the content is resonating. That not only reflects creative strength, but also increases the likelihood of stronger algorithmic distribution.
#15. Instagram Reels engagement metrics
Beyond views and watch time, the standard instagram Reel engagement metrics — likes, comments, saves, shares — apply here just as they do for other formats, but with some important nuances.
Shares are disproportionately powerful for Reels. When someone shares a Reel to their Stories or sends it in a DM, it signals to Instagram that the content is worth pushing to new audiences. This is the primary mechanism behind viral Reels distribution — not hashtags, not posting time, but share velocity in the first few hours after posting.
Saves on Reels are somewhat less common than on carousels, but when they do happen, they're a strong signal that the content has lasting value — tutorials, tips, or formats people want to revisit. If you're producing Reels with genuinely useful information, adding a "save this for later" CTA in the caption or on-screen text consistently lifts the save rate.
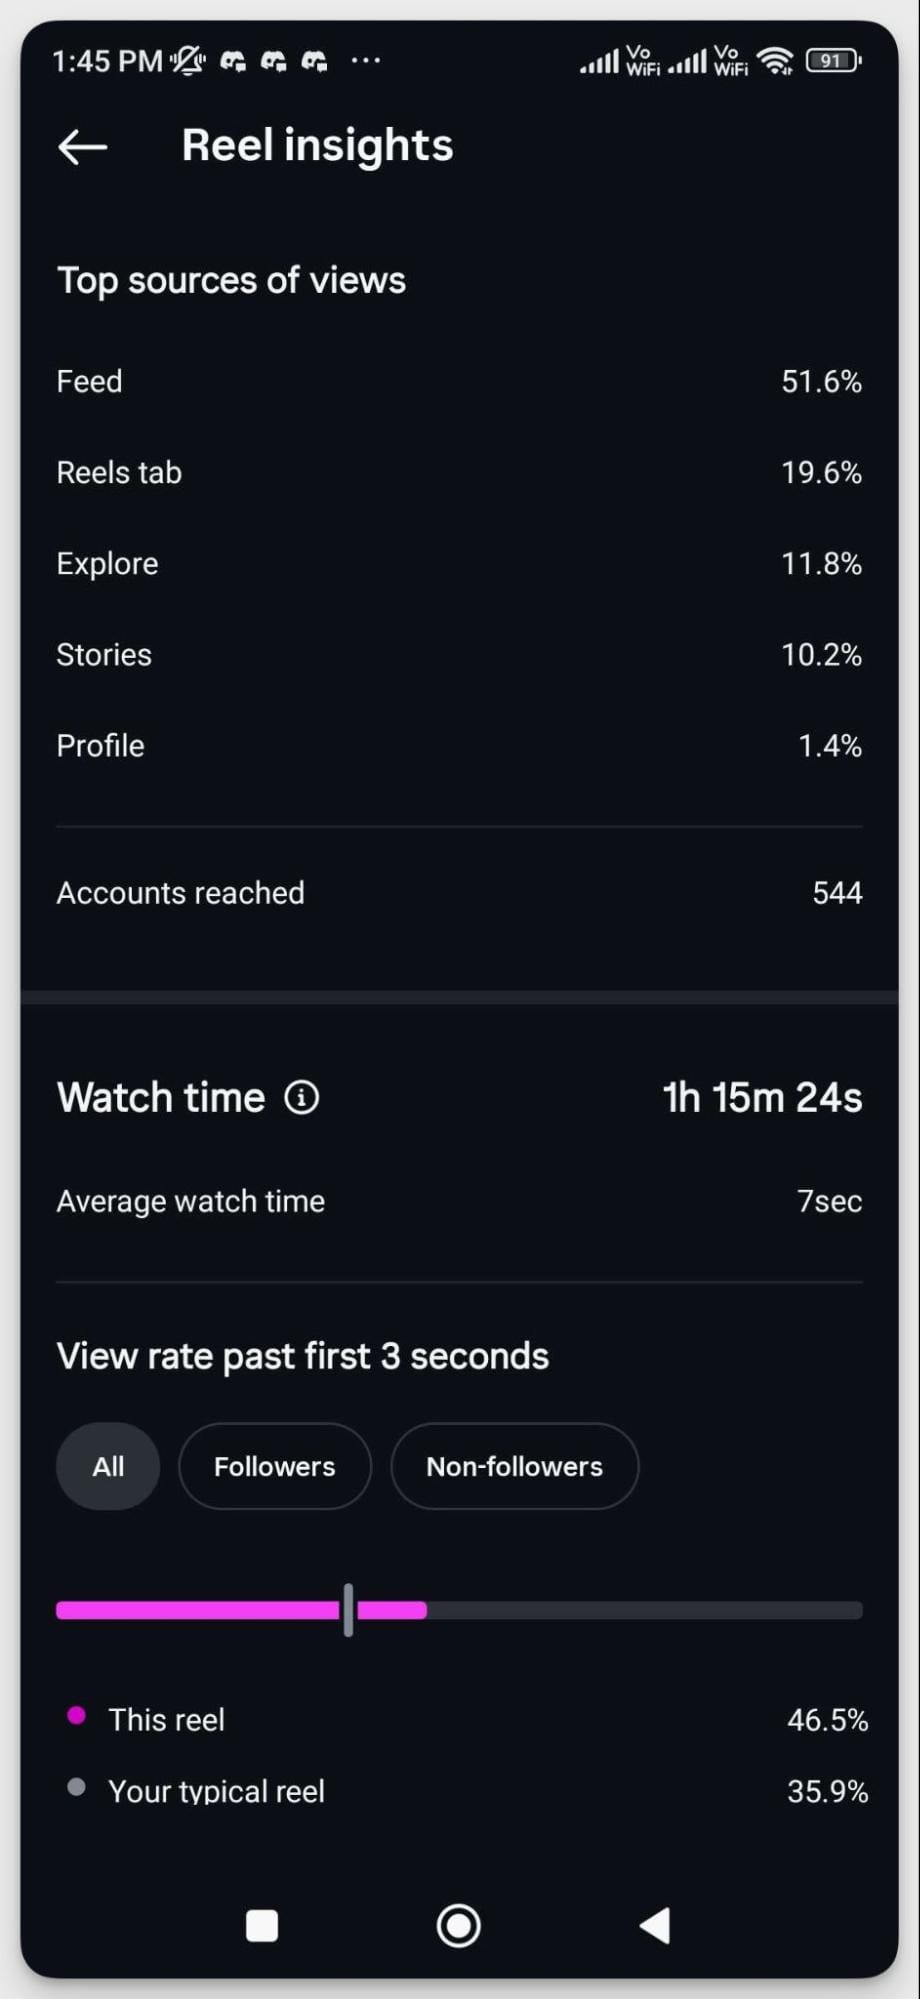
#16. Top sources of views
This metric shows where your Reel views are coming from: the Reels tab, Explore, your profile, hashtags, or direct shares. It's one of the most strategically useful instagram reels success metrics because it tells you exactly how your content is being discovered.
I once had a client where nearly 40% of Reel views were coming from the Reels tab, which meant the algorithm was actively distributing the content to new audiences — a sign to keep producing similar content. For another account, most views came from the profile itself, meaning followers were actively seeking out the Reels rather than discovering them organically. Two completely different distribution patterns, two completely different strategic responses.
Check this metric per Reel rather than in aggregate. A single unusually well-distributed Reel can skew account-level averages significantly.
How to analyze instagram reels performance metrics
When I'm reviewing instagram reel performance metrics after a posting cycle, this is the sequence I follow:
- Views + source breakdown → where is the content traveling, and to whom?
- 3-second view rate → is the hook working?
- Completion rate → is the pacing and structure holding attention through to the end?
- Shares → is the content compelling enough that people are putting their name behind it?
- Replays → is there enough depth or value to warrant rewatching?
If views are strong but completion rate is low, the problem is in the middle of the Reel. If completion rate is strong but shares are low, the content is engaging but not shareable — worth asking whether the topic or format has natural shareability built in.
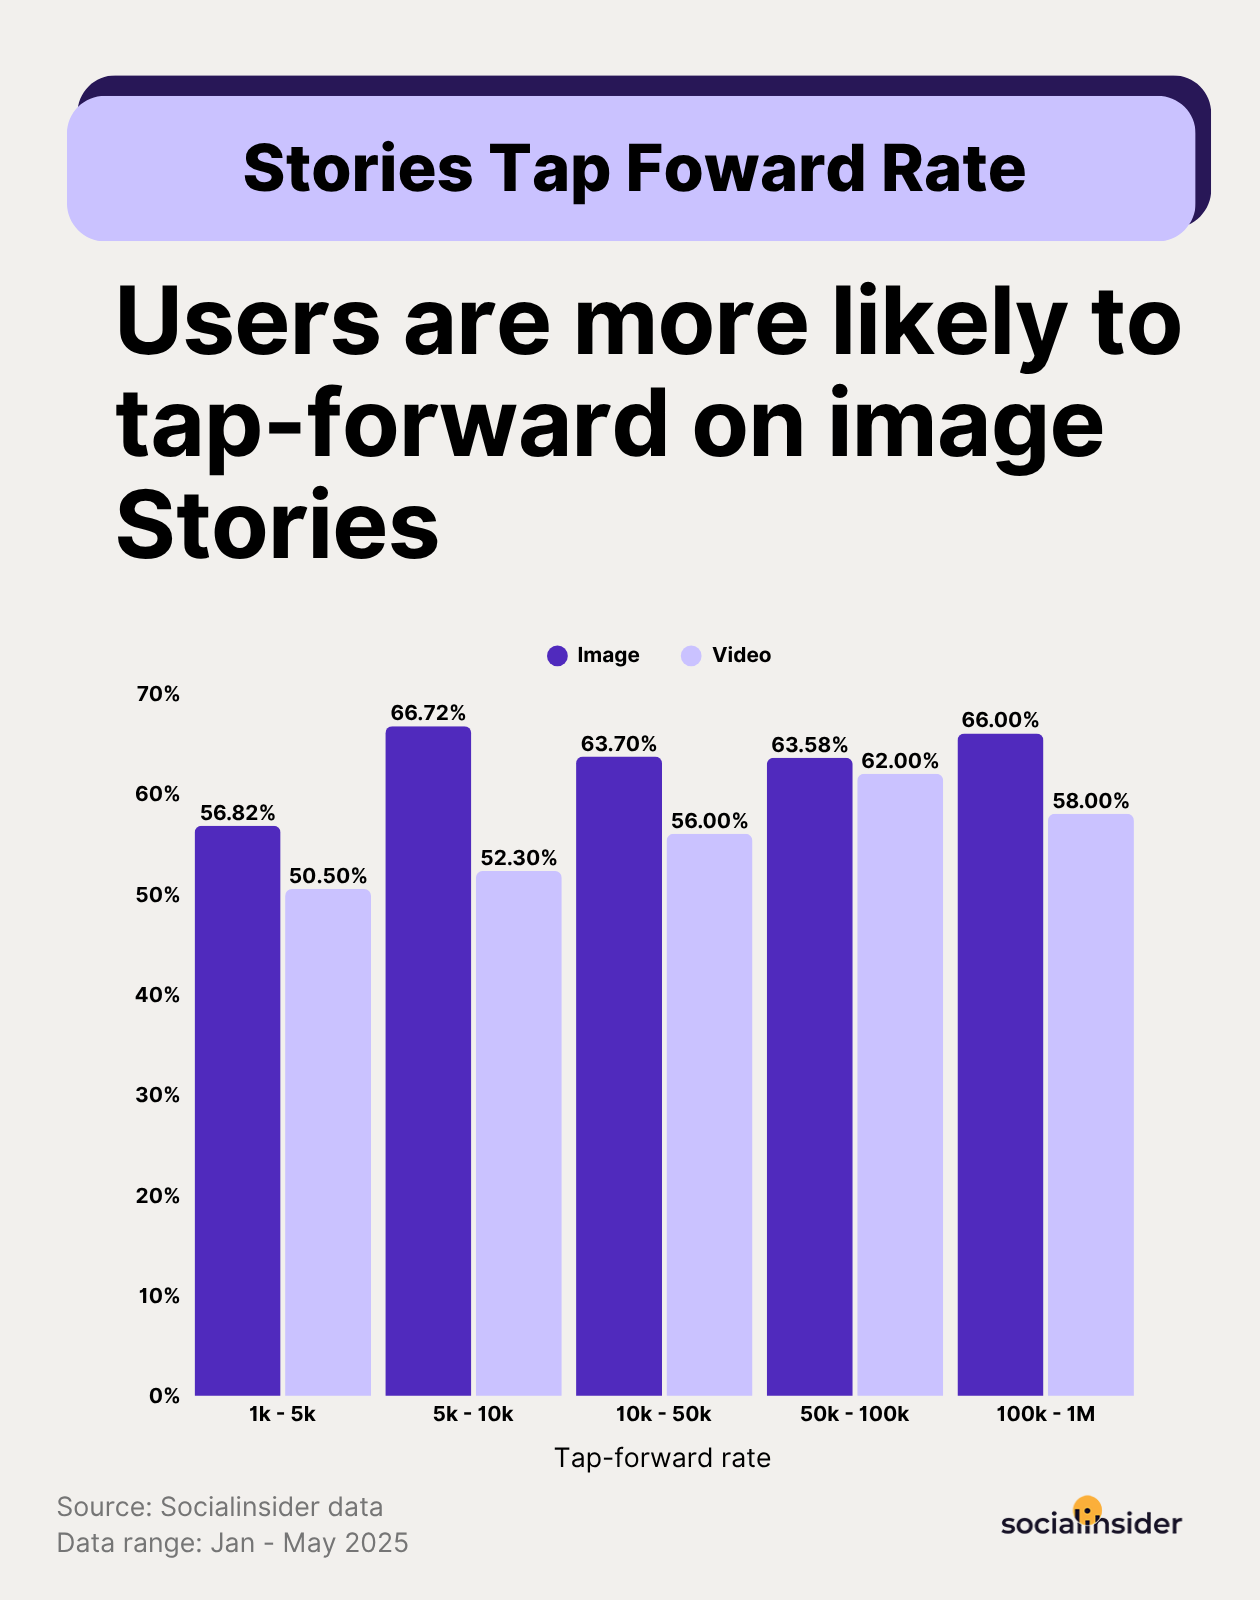
Story-specific metrics
Stories sit in a different category from feed content and Reels. They're ephemeral, they live at the top of the app, and they reach an audience that's already opted in — people who follow you and actively open your Stories. That context shapes how you interpret the instagram story metrics that matter here.
#17. Story views
Total views tell you how many times your Story was seen. Reach tells you how many unique accounts saw it. The gap between the two — if someone watched the same Story multiple times — is usually small, but worth noting for highly visual or instructional Stories that people might replay.
As a general benchmark, instagram story engagement metrics tend to look weaker than feed content at first glance because Stories only reach followers, not new audiences. Don't compare Story reach to Reels reach directly — they're serving different functions. Personally, I evaluate Stories reach relative to the total follower count. Consistently reaching 5–10% of followers per Story is a reasonable baseline for most accounts; above 15% is strong.
#18. Forward taps, back taps, and exits
Navigation data is where instagram stories metrics get genuinely diagnostic. Instagram tracks four navigation actions for every Story frame:
Forward taps — the viewer skipped ahead to the next frame. A high forward tap rate usually means the frame held attention for less than a second — the visual wasn't interesting enough or there was too much text to read comfortably.
Back taps — the viewer went back to rewatch the previous frame. This is actually a positive signal. It means something caught their attention enough to go back. I see this most often on data-heavy Stories or ones with a surprising visual.
Exits — the viewer left your Stories entirely. This is the metric to watch most closely. A high exit rate on a specific frame usually points to one of three things: the content felt like an interruption (too promotional, too long), the visual quality dropped noticeably, or the Story sequence lost its thread.
Next Story swipes — the viewer swiped to the next account's Stories rather than continuing yours. Similar to exits, but slightly different context — they didn't leave Stories entirely, they just chose someone else over you.
I review navigation data frame by frame when a Story set underperforms. The pattern usually becomes clear quickly: there's almost always one specific frame where the drop happens, and fixing that frame type across future Stories tends to lift the overall completion rate.
#19.Story completion rate
Story completion rate measures the percentage of viewers who watched your entire Story sequence from the first frame to the last. It's one of the most telling instagram story engagement metrics because it shows whether your Stories are holding attention or losing people in the middle.
Low completion rates almost always come down to one of two things: the Story is too long, or it loses narrative momentum. The best-performing Stories I've worked on tend to have a clear arc — a hook in the first frame, a payoff by the last — rather than a loose collection of individual frames stitched together.
A practical target: aim for at least 70% completion on Story sequences up to five frames. Longer sequences will naturally see more drop-off, so adjust expectations accordingly.
#20. Interactive stickers: polls, questions, and link sticker CTR
Interactive stickers are one of the most underused tools in the instagram stories engagement metrics toolkit. They do two things simultaneously: generate direct audience feedback and boost the visibility of your Stories in the algorithm.
Polls and question stickers give you qualitative data you can't get anywhere else. I use them regularly to test content ideas before committing to a full production cycle, to gather product feedback, and — honestly — to make Stories feel more like a conversation than a broadcast. Accounts that use interactive stickers consistently tend to see stronger overall Story reach over time because the engagement signals tell Instagram the content is worth showing to more followers.
Link sticker CTR is the conversion metric for Stories. It replaced the swipe-up feature and is now available to all accounts regardless of follower count. If you're using Stories to drive traffic — to a blog post, a product page, a sign-up form — link sticker CTR is the number that tells you whether the CTA is compelling enough. I've found that the link sticker performs significantly better when it's placed mid-Story rather than at the very end, because you've already built context and interest before asking for the click.
How to read your instagram stories metrics together
- High views but high exit rate → people are opening your Stories but leaving quickly; the first frame isn't compelling enough to earn the next.
- Strong completion rate but low link sticker CTR → the Story content is working but the CTA isn't; test different copy or placement.
- High back taps on a specific frame → that frame has something worth rewatching; figure out what it is and replicate it.
- Consistent forward taps on text-heavy frames → you're asking people to read too much; simplify the visual or split across more frames.
Conversion and sales metrics
Engagement metrics tell you whether your content is resonating. Conversion metrics tell you whether it's producing anything. These are the Instagram success metrics that matter most in executive conversations — because they connect social media activity to business outcomes in language that doesn't require explaining what an engagement rate is.
#21. Link-in-bio CTR
Your link in bio is one of the very few places Instagram allows you to drive traffic off-platform, which makes link-in-bio click-through rate one of the most important instagram organic metrics for accounts not running paid campaigns.
CTR measures how many people who visited your profile clicked the link. If CTR is low despite strong profile visits, the issue is usually one of two things: the link destination isn't compelling enough as described, or the content driving people to your profile isn't priming them to take action. A strong link-in-bio setup — a clear description of what's behind the link, ideally reinforced in caption CTAs — consistently outperforms a bare URL sitting in the bio with no context.
If you're using a link-in-bio tool with multiple destinations, track which specific links are getting clicked. The distribution often reveals which content topics are actually driving commercial intent, not just engagement.
#22. Instagram Shopping sales
For e-commerce brands, Instagram Shopping metrics — product views, product page clicks, and completed purchases through the Instagram checkout — create a direct line between content and revenue. You can see which products are generating interest from which content types, and whether that interest is converting.
The limitation worth noting: Instagram Shopping is only available in select countries and requires a connected product catalog. If you're operating in a region where Shopping isn't available, or if your product isn't catalog-eligible, these metrics won't apply — but the principle of tracking content-to-purchase attribution still does, just through external tools.
#23. Customer acquisition cost (CAC)
CAC measures how much you're spending to acquire one customer through Instagram. The formula is simple: total Instagram spend (ad spend plus any production or management costs) divided by the number of customers acquired from that spend.
Where CAC becomes most useful is in cross-channel comparison. If your Instagram CAC is significantly higher than your email or search CAC, that's worth understanding — either Instagram is working harder but at a later stage of the funnel, or it's genuinely less efficient and budget needs to be reallocated. Context matters here: CAC benchmarks vary enormously by industry, so compare against your own historical data and industry-specific norms rather than generic averages.
How to read your conversion metrics together
- Strong profile visits but low link-in-bio CTR → the CTA or link destination needs work; test clearer copy and a more specific offer.
- High CAC relative to other channels → Instagram may be working at an earlier funnel stage than you're measuring; check whether assisted conversions tell a different story.
Here's how Paloma also segments her metrics for reporting:
I segment metrics based on the primary objective of the campaign or content, typically grouping them into: discovery, engagement and action. However, I don’t treat these as rigid categories. A single piece of content can drive multiple outcomes simultaneously, especially on platforms like Instagram, where discovery and conversion often overlap.
That’s why beyond tracking against the primary objective, I also analyse secondary performance signals to understand what’s actually driving impact with metrics like saves or shares. This helps refine not just what we measure, but how we shape future content and strategy. The goal isn’t just to measure performance but to understand what’s driving it and scale that.
Advanced Instagram metrics for data context understanding
Some strategic decisions call for a bigger picture.
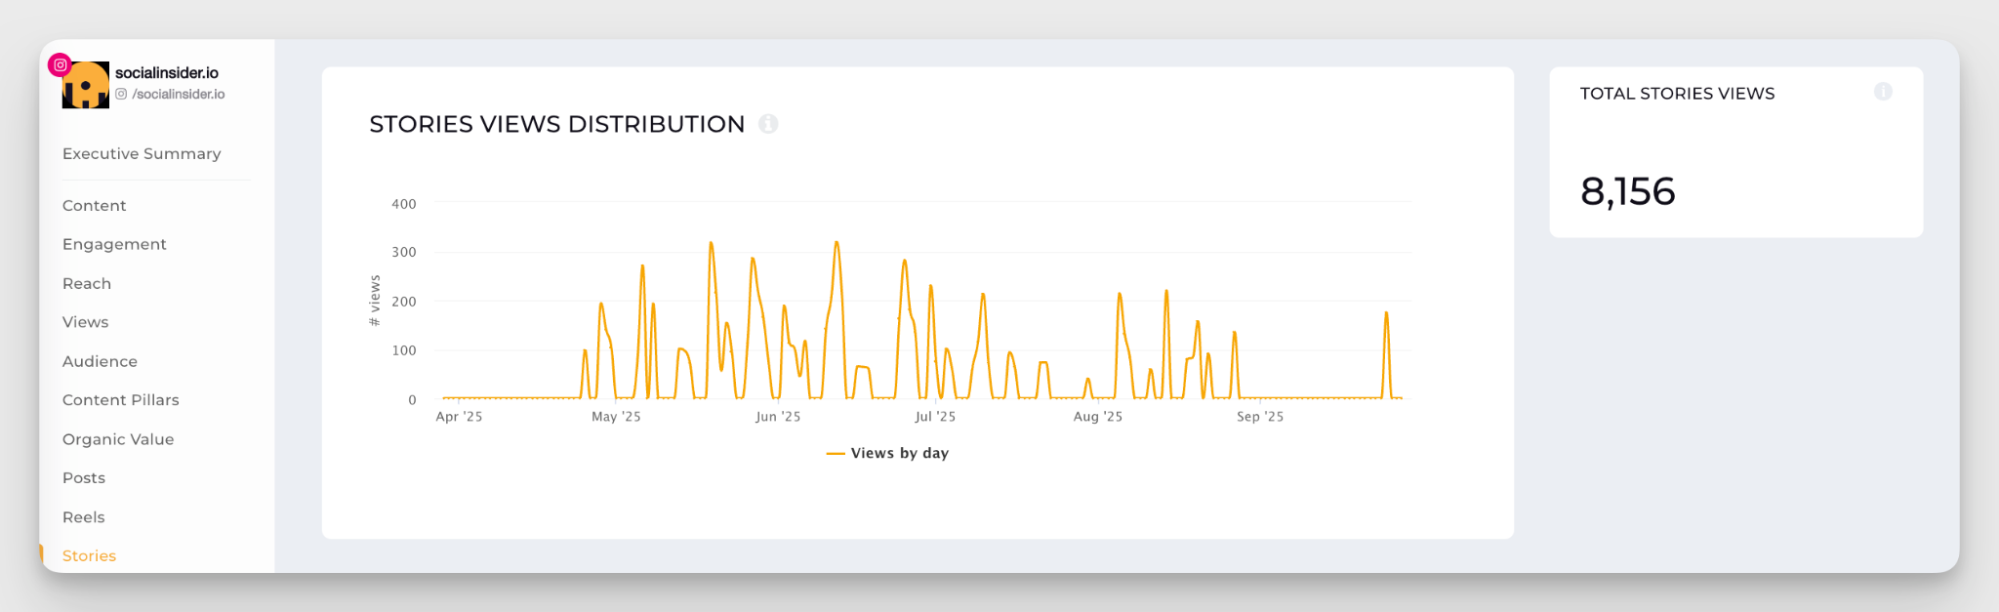
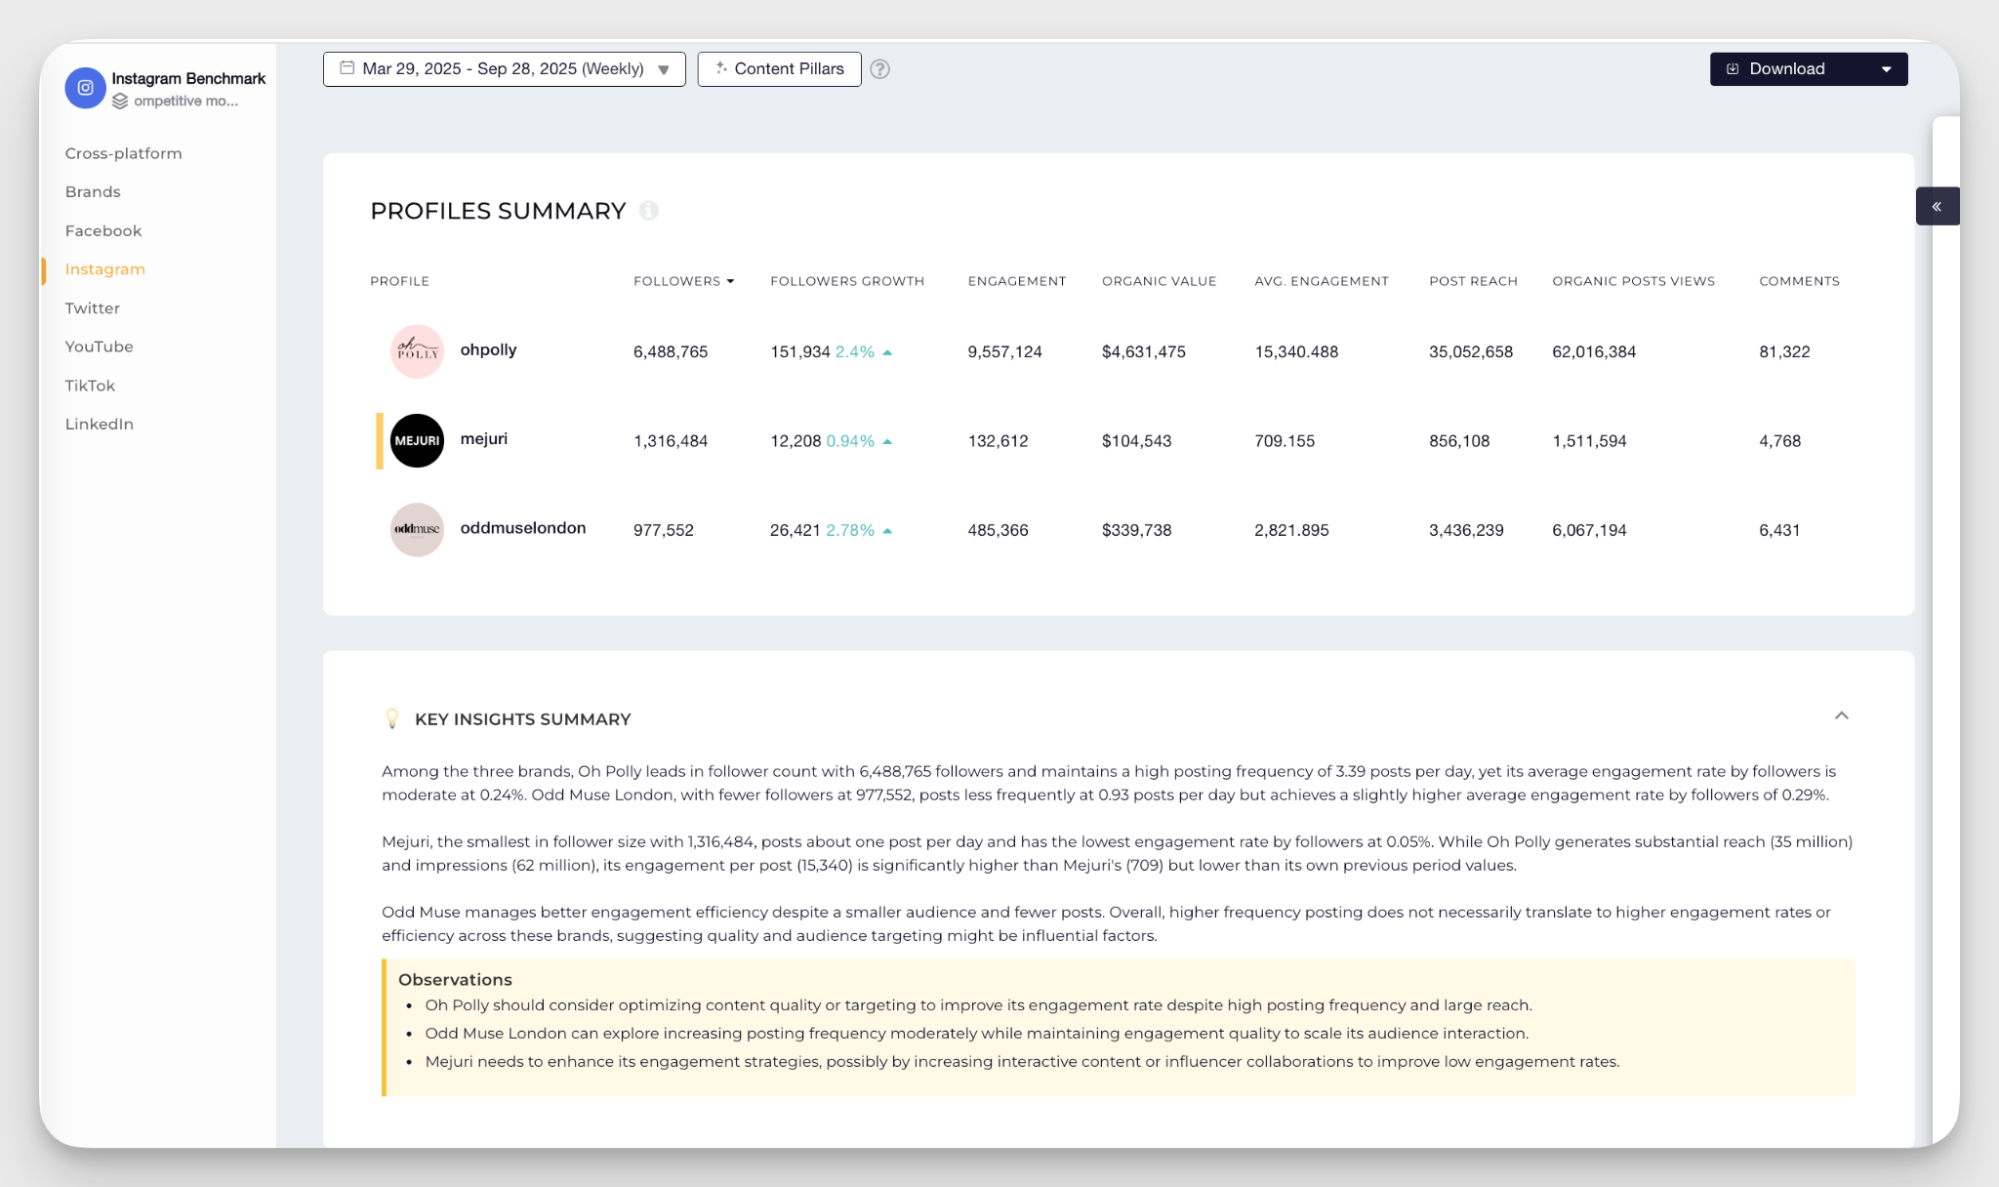
These advanced metrics give you a birds-eye view of the landscape. Instagram analytics tools like Socialinsider analyze thousands of accounts over time so you can get more context for your performance data.
Here’s what can help you understand your existing data better:
Industry benchmarks
Benchmarking key performance metrics — engagement rate, views, follower growth rate — helps you understand broader trends and see whether those trends apply to your account.
For example, you might notice your engagement rate dropping. That's concerning. But if engagement is declining across Instagram as a whole, the context changes. The platform is shifting, so fluctuations affect all of us.
That doesn't mean you ignore the problem — you still need to adapt and find ways to improve. But knowing the overall trend helps you set realistic expectations and avoid panicking over industry-wide changes you can't control.
I use benchmarks to ground my performance reviews. If my engagement rate is 3% and the industry average is 1.5%, I know I'm doing well.
Competitive insights
Reach estimations, organic value, content pillar performance, and other competitive insights serve as both a reference point and a source of inspiration.
Tracking specific competitors gives you much more context than broad industry benchmarks. Accounts vary by industry, size, and target audience, so you need finer-grained data to evaluate your results correctly and set realistic KPIs.
It’s especially true for niche industries. They often get lumped into the broader category, but have very specific audience behaviors and content dynamics.
For example, using “technology” follower growth as a benchmark for a gaming account won’t really give you enough context. What will give you enough data (and possibly highlight opportunities on the way) is tracking several similar game accounts on Instagram.
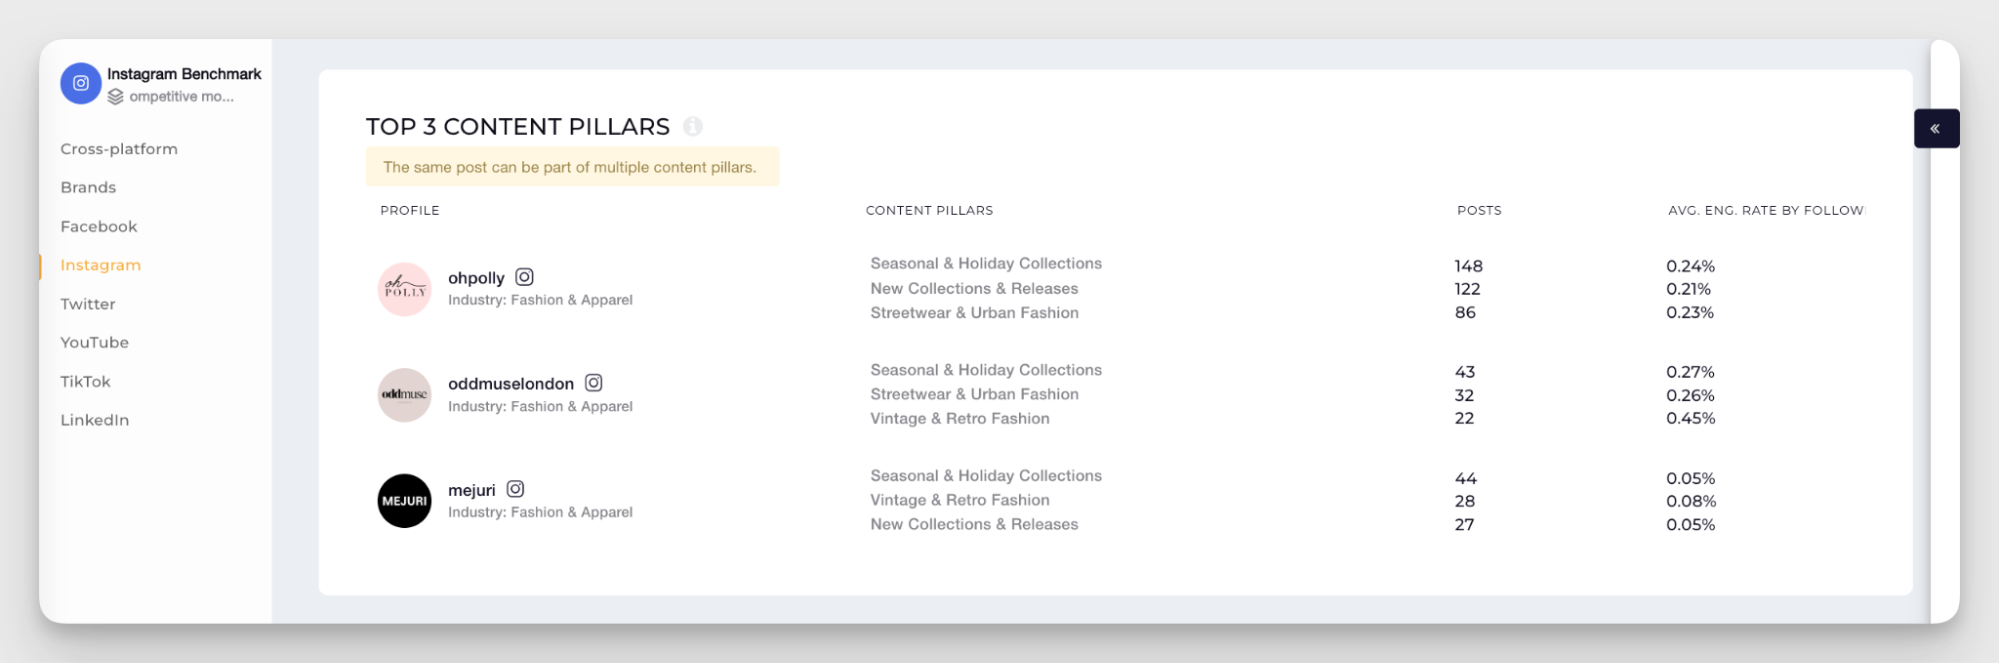
You need to perform competitor research regularly to keep your insights fresh, but it's tedious to do manually. Tools like Socialinsider handle the heavy data lifting — tracking competitors' posting frequency, best performing content pillars, engagement patterns, and organic value.
Final thoughts
Tracking Instagram metrics isn't about monitoring every number the platform gives you — it's about knowing which ones connect to your goals and checking them consistently enough to act on what you find.
Set clear goals, track the right metrics, and benchmark against both your own history and your competitors. The data is there. The teams that use it as a real-time feedback loop consistently outperform the ones that treat reporting as a monthly retrospective.
FAQs on Instagram metrics
How do I track Instagram metrics without native Insights?
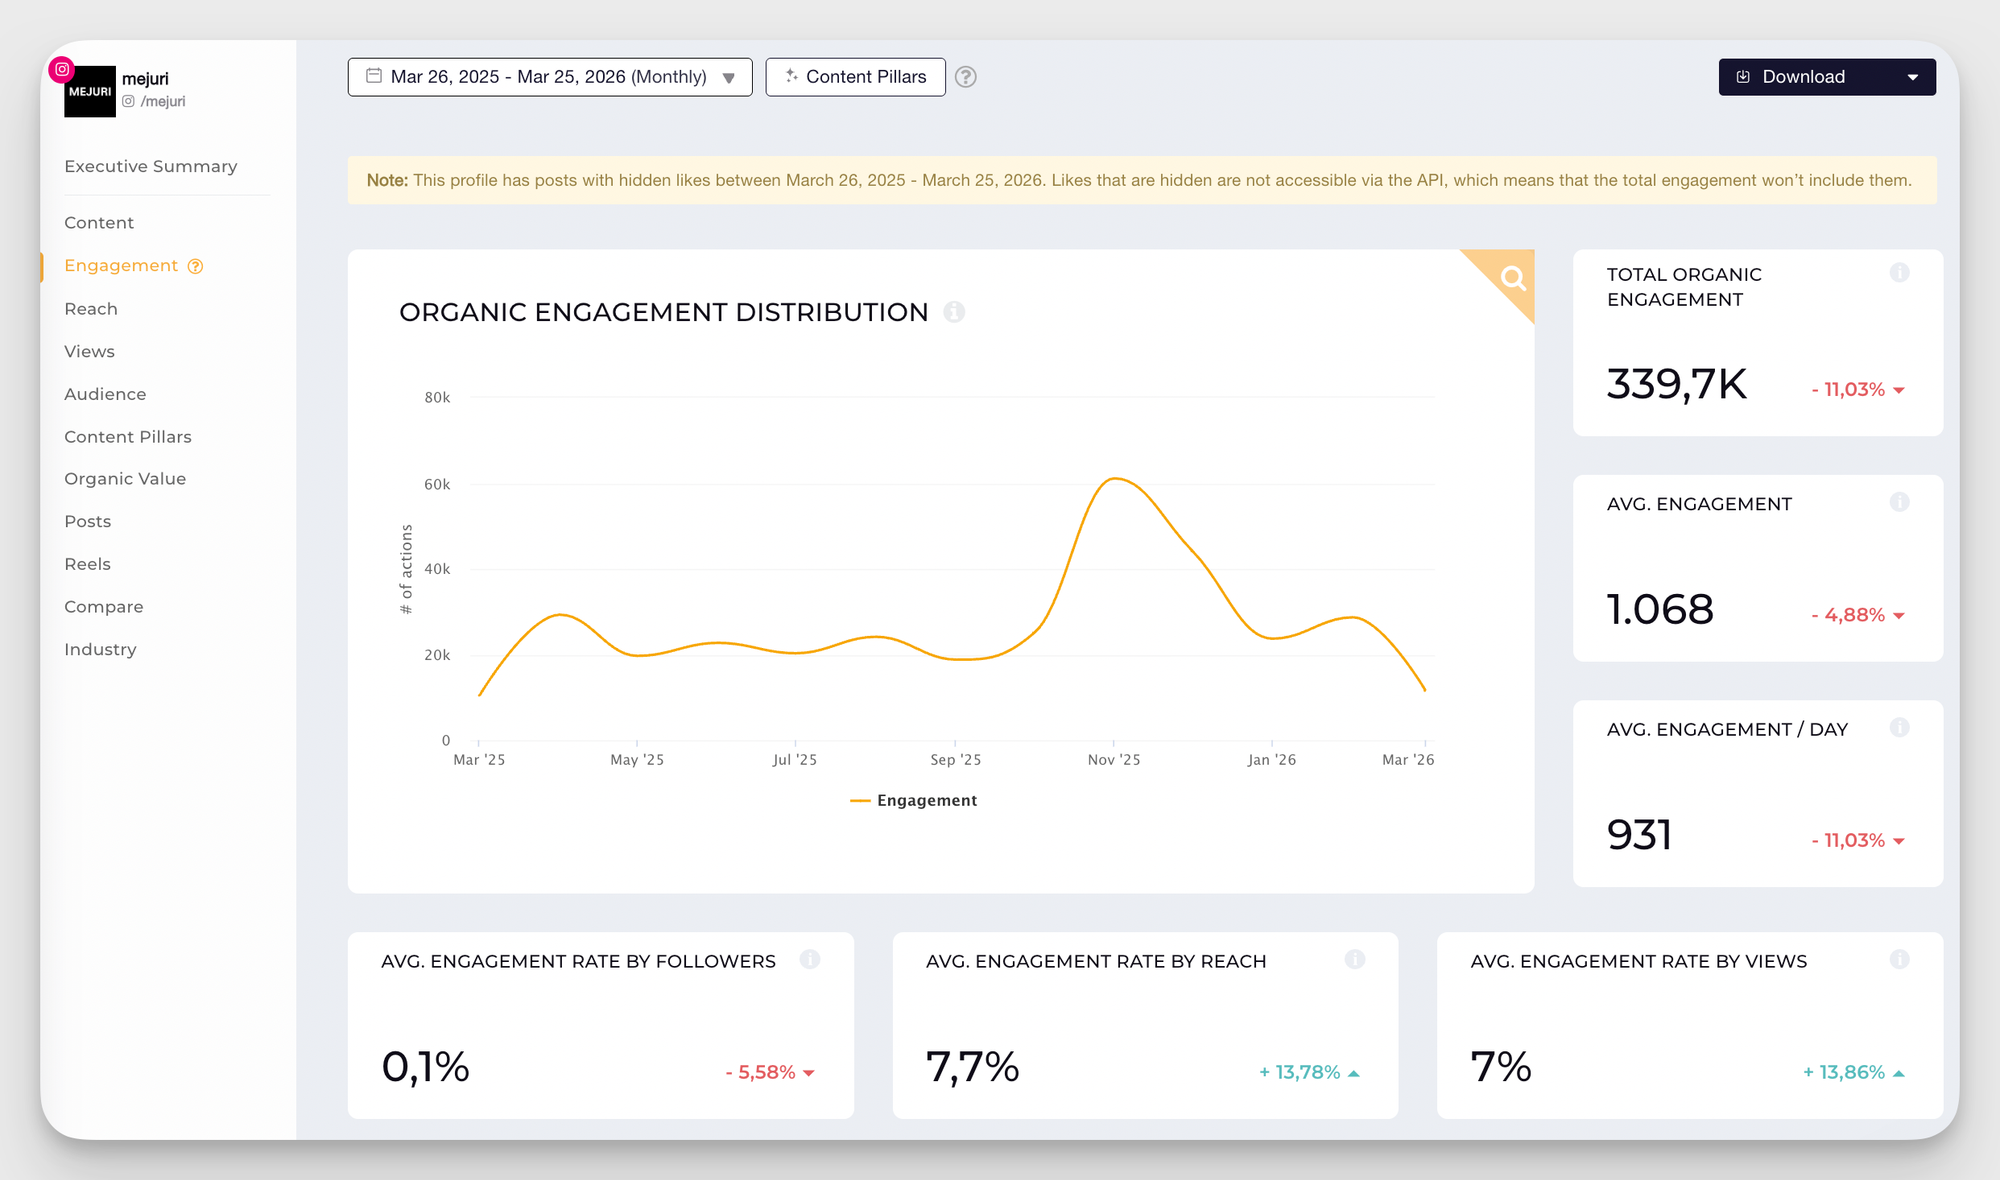
Native Insights only shows your own account data and caps history at 90 days. For competitor benchmarking, historical analysis, and cross-platform reporting, you need a dedicated analytics tool. For example, Socialinsider is a social media analytics platform used to track Instagram metrics including reach, views, engagement rate by followers and by reach, follower growth, post-level follower acquisition, Reels engagement, Stories retention, saves, shares, content pillar performance, and competitor benchmarks. It's a great starting point for your reporting needs especially when you need to run a competitive analysis or a cross-channel performance review.
What should I track weekly vs. monthly?
Weekly, focus on directional signals: reach, views, Reels completion rate, and Story exit rate. These tell you quickly whether anything needs immediate attention. Monthly is for pattern recognition: engagement rate by format, follower growth rate, post-level follower growth, and competitor benchmarking. Quarterly is for strategic review: content pillar analysis, audience demographics, year-over-year comparisons, and ROI assessment for paid activity.
Elena Cucu
Content & SEO Manager @ Socialinsider with 8 years of experience in marketing. I like to describe myself as a social butterfly with a curious mind, passionate about dancing and psychology.

Know what your competitors do — before your manager asks
Get instant social benchmarks & reports without manual work.