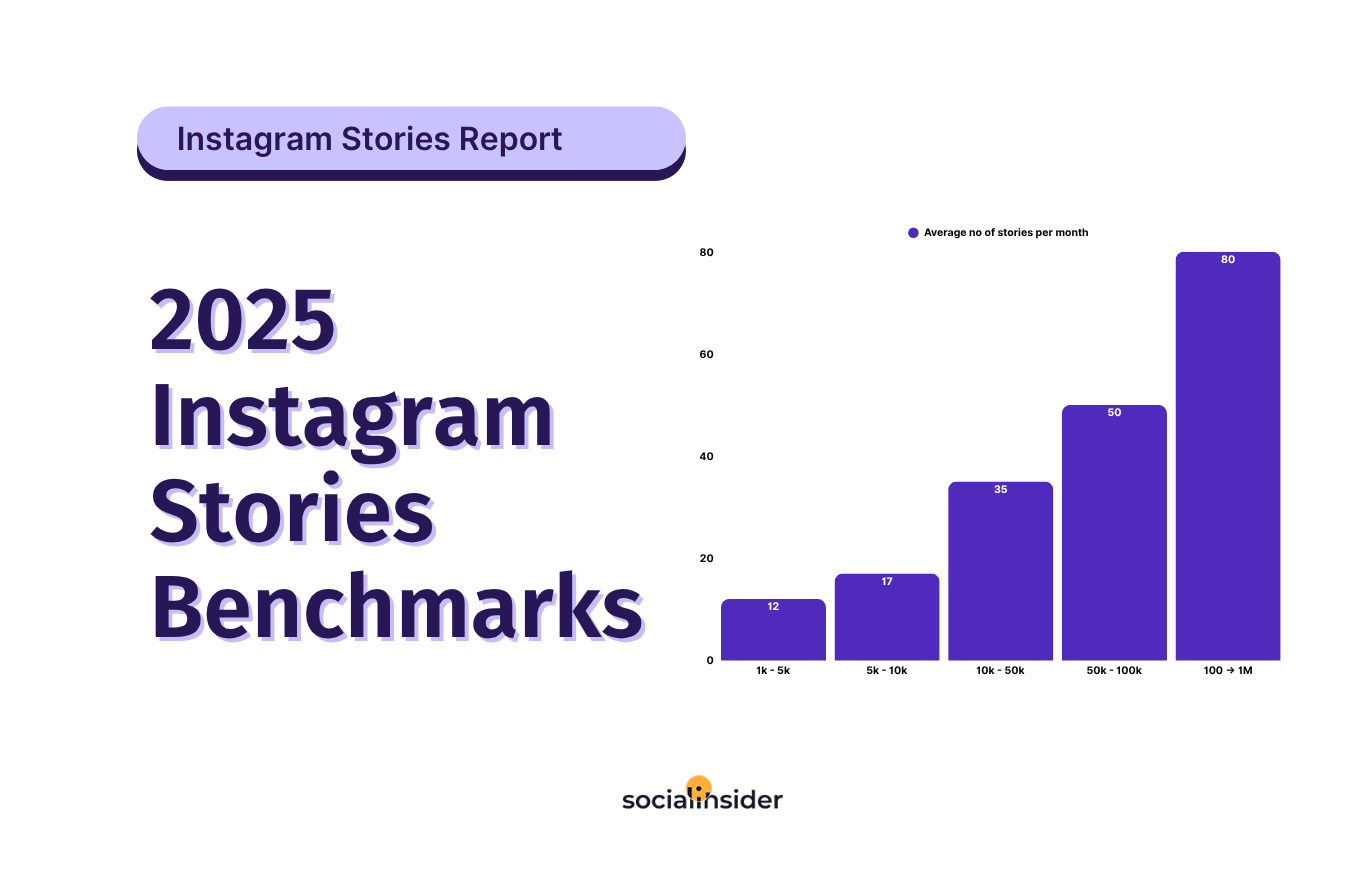
2025 Instagram Stories Benchmarks
Explore the latest 2025 Instagram Stories benchmarks. Get valuable insights on how to optimize your strategy to better engage with your audience.

Instagram Stories have changed. In 2025, they’re less about reach and more about retention.
To understand what still works (and what doesn’t), we analyzed 161,180 Stories across follower tiers and formats. This study breaks down how viewer behavior has evolved, from reach and impressions to exits and forward taps.
The result? A clear, data-backed Instagram benchmark report built for social media managers and brand marketers who want to stop guessing and start optimizing.
Let’s get into it.
Executive summary
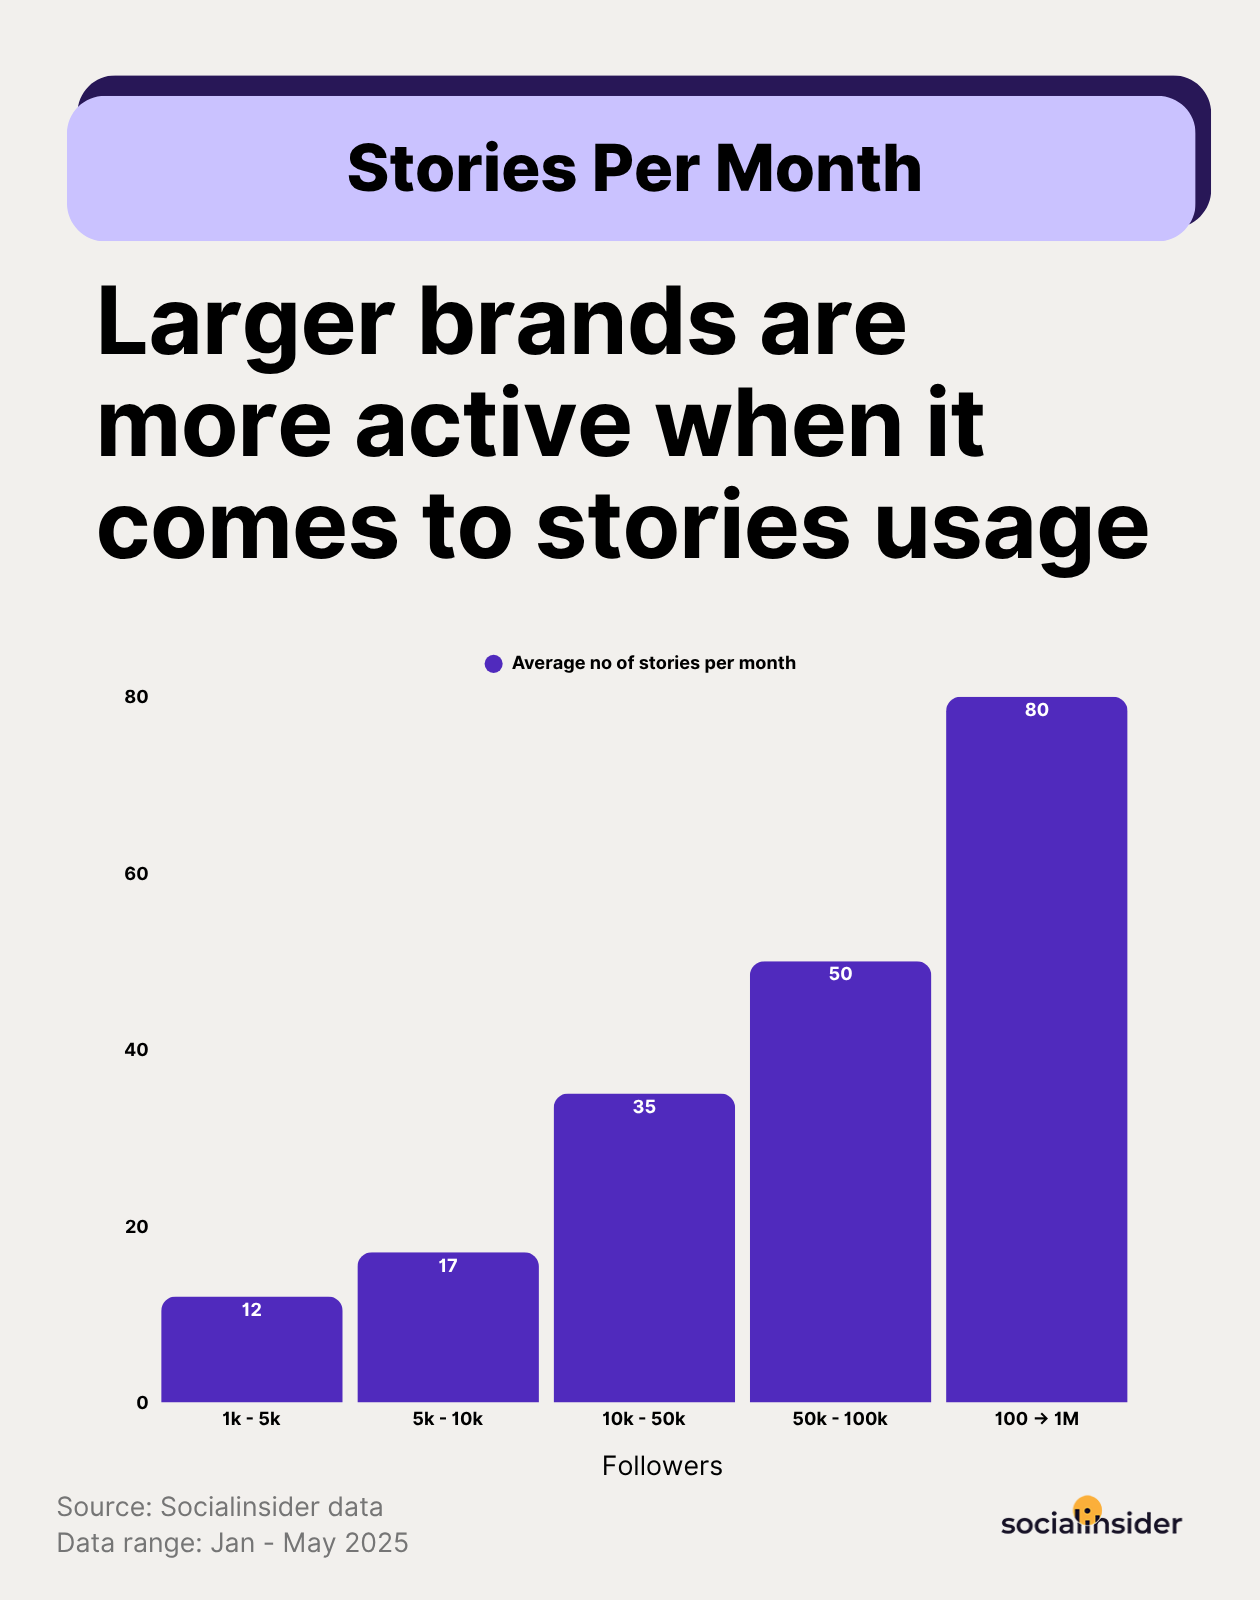
- Larger brands are more active when it comes to Stories usage.
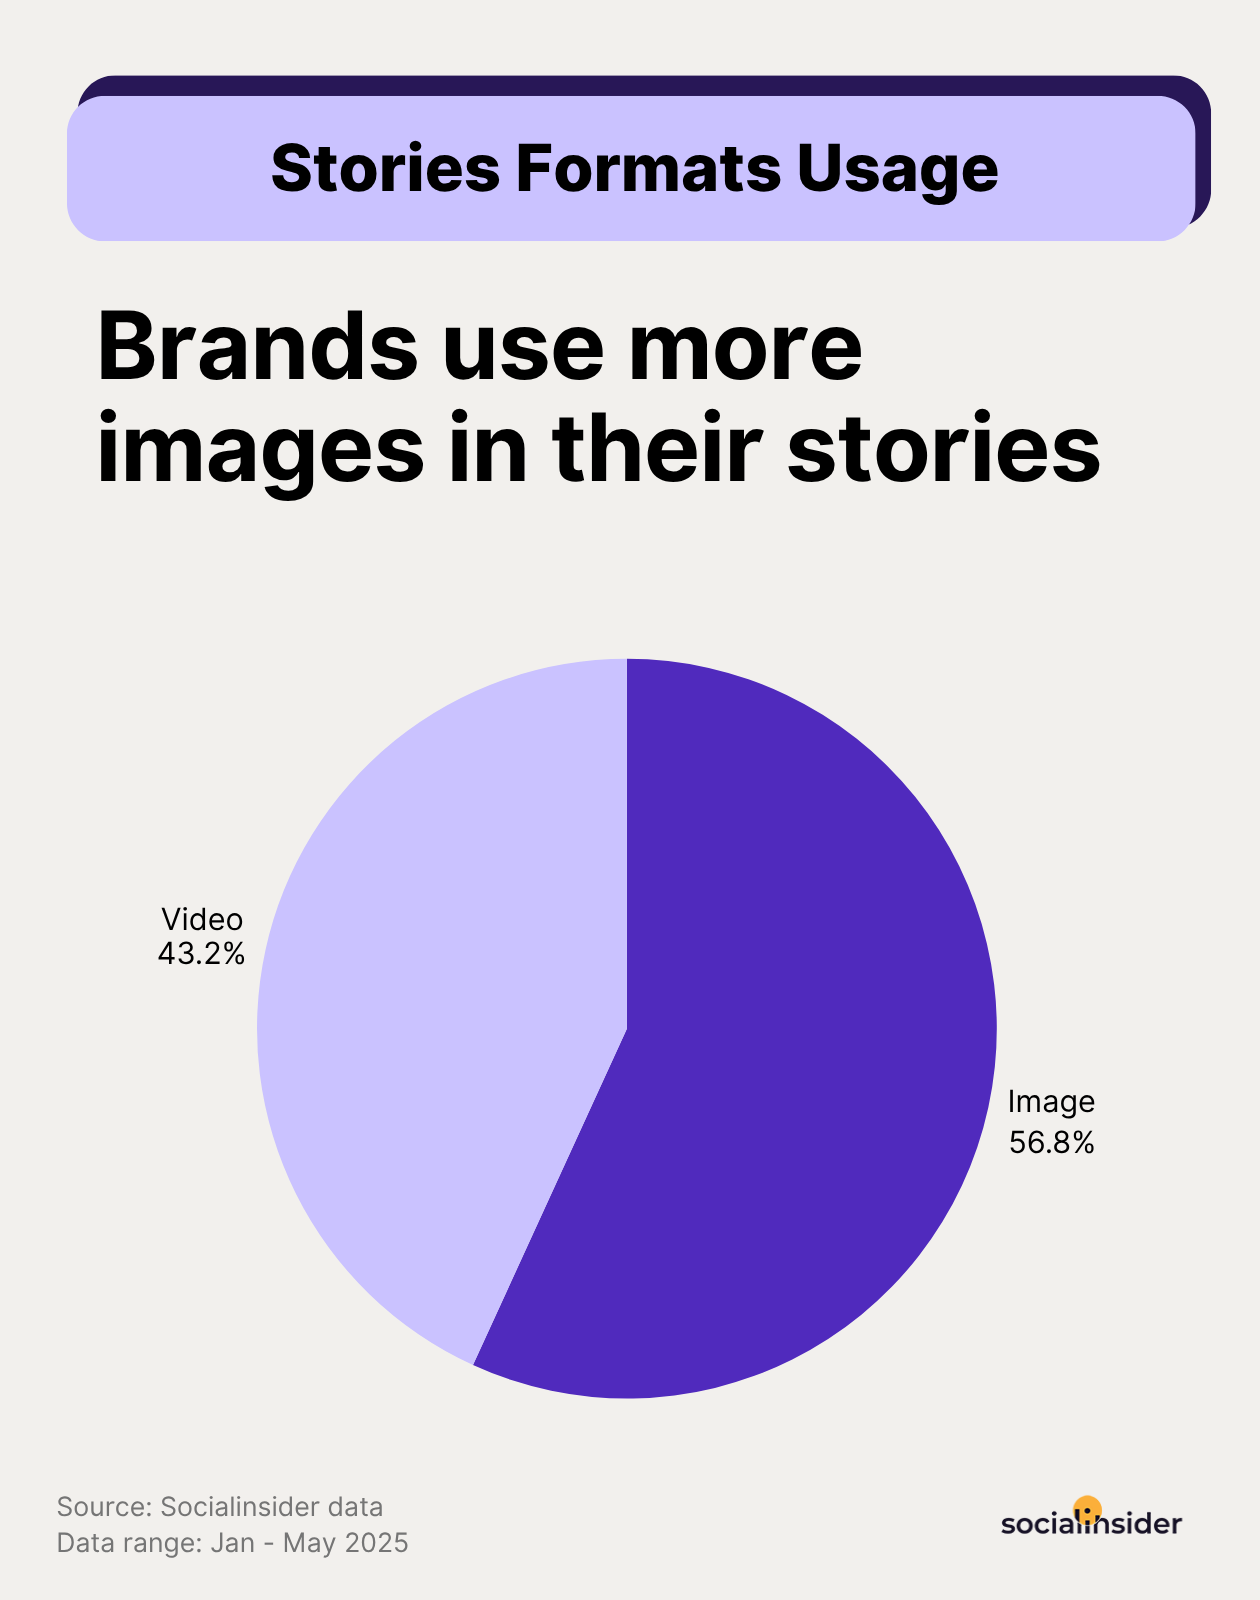
- Brands’ Instagram Stories consist more of images than of videos (56% vs 44%).
- Most exits happen after the first 3 Stories, and the exit rates have increased compared to 2024.
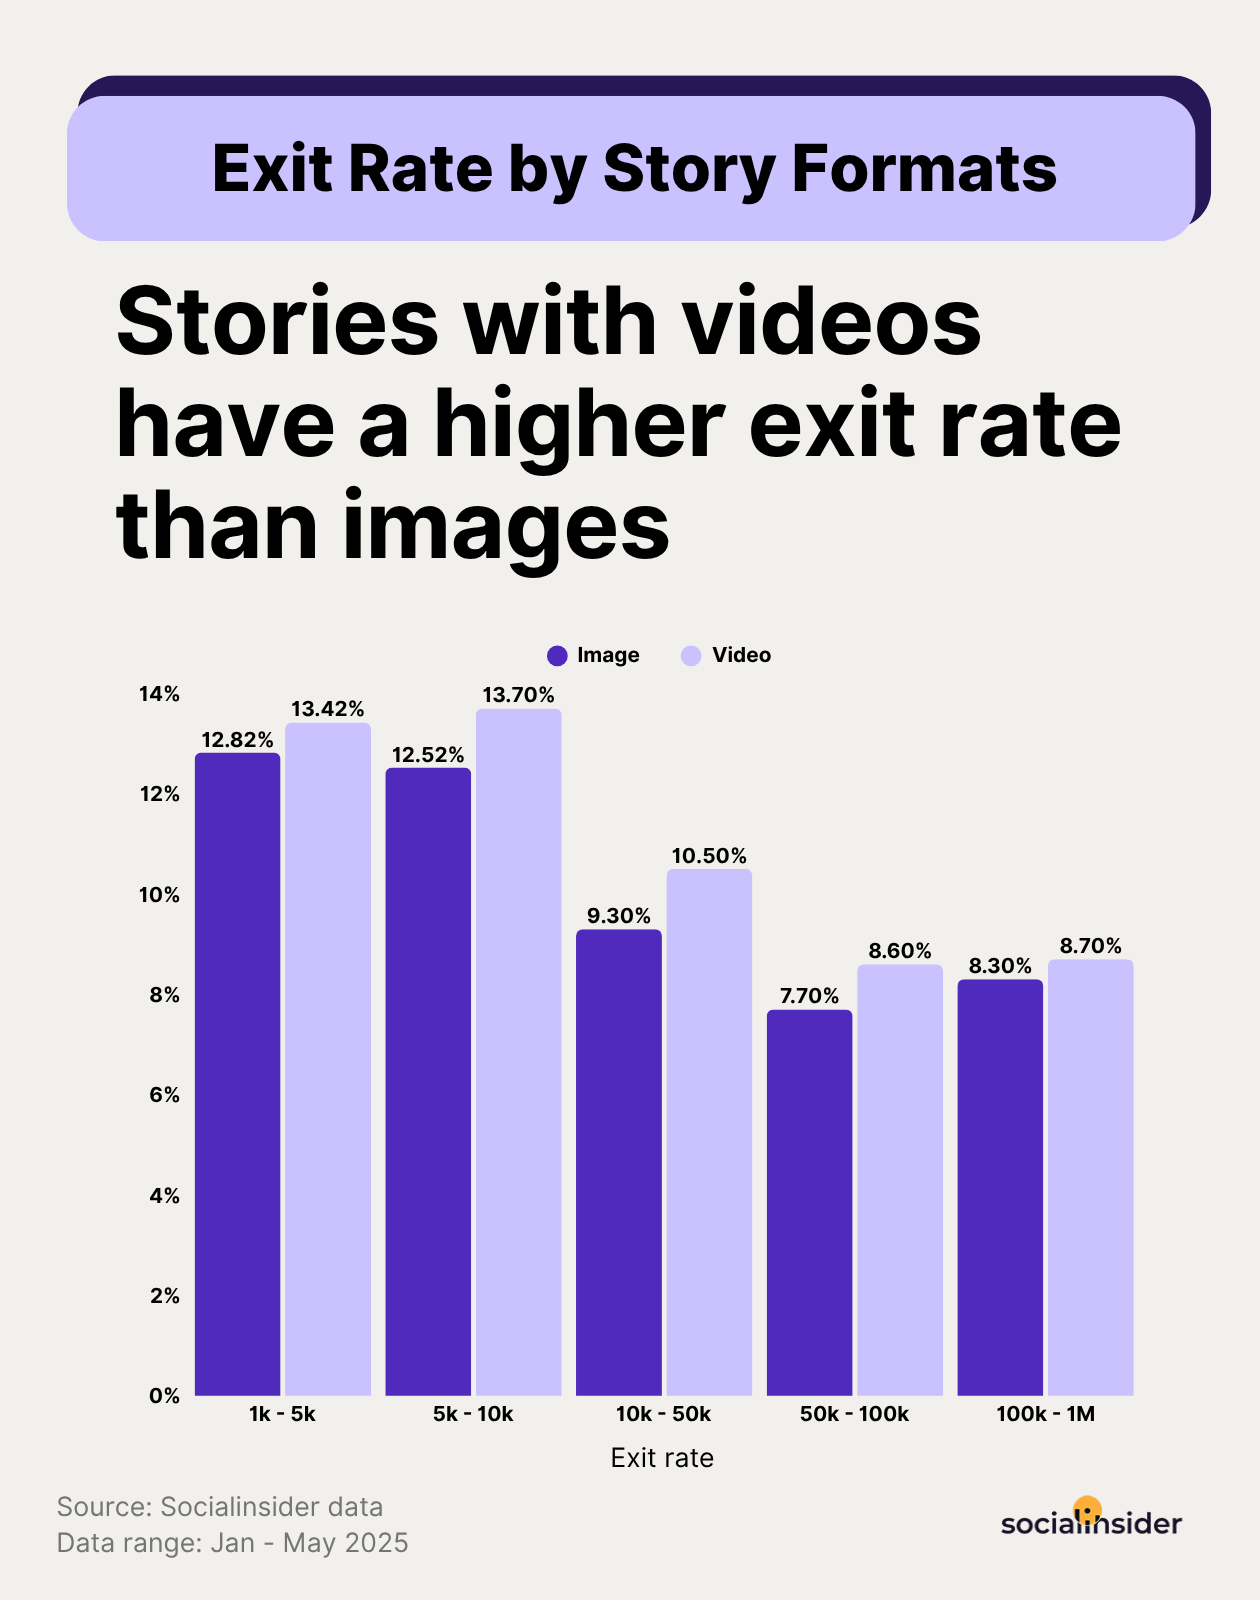
- Stories with videos have a higher exit rate than images.
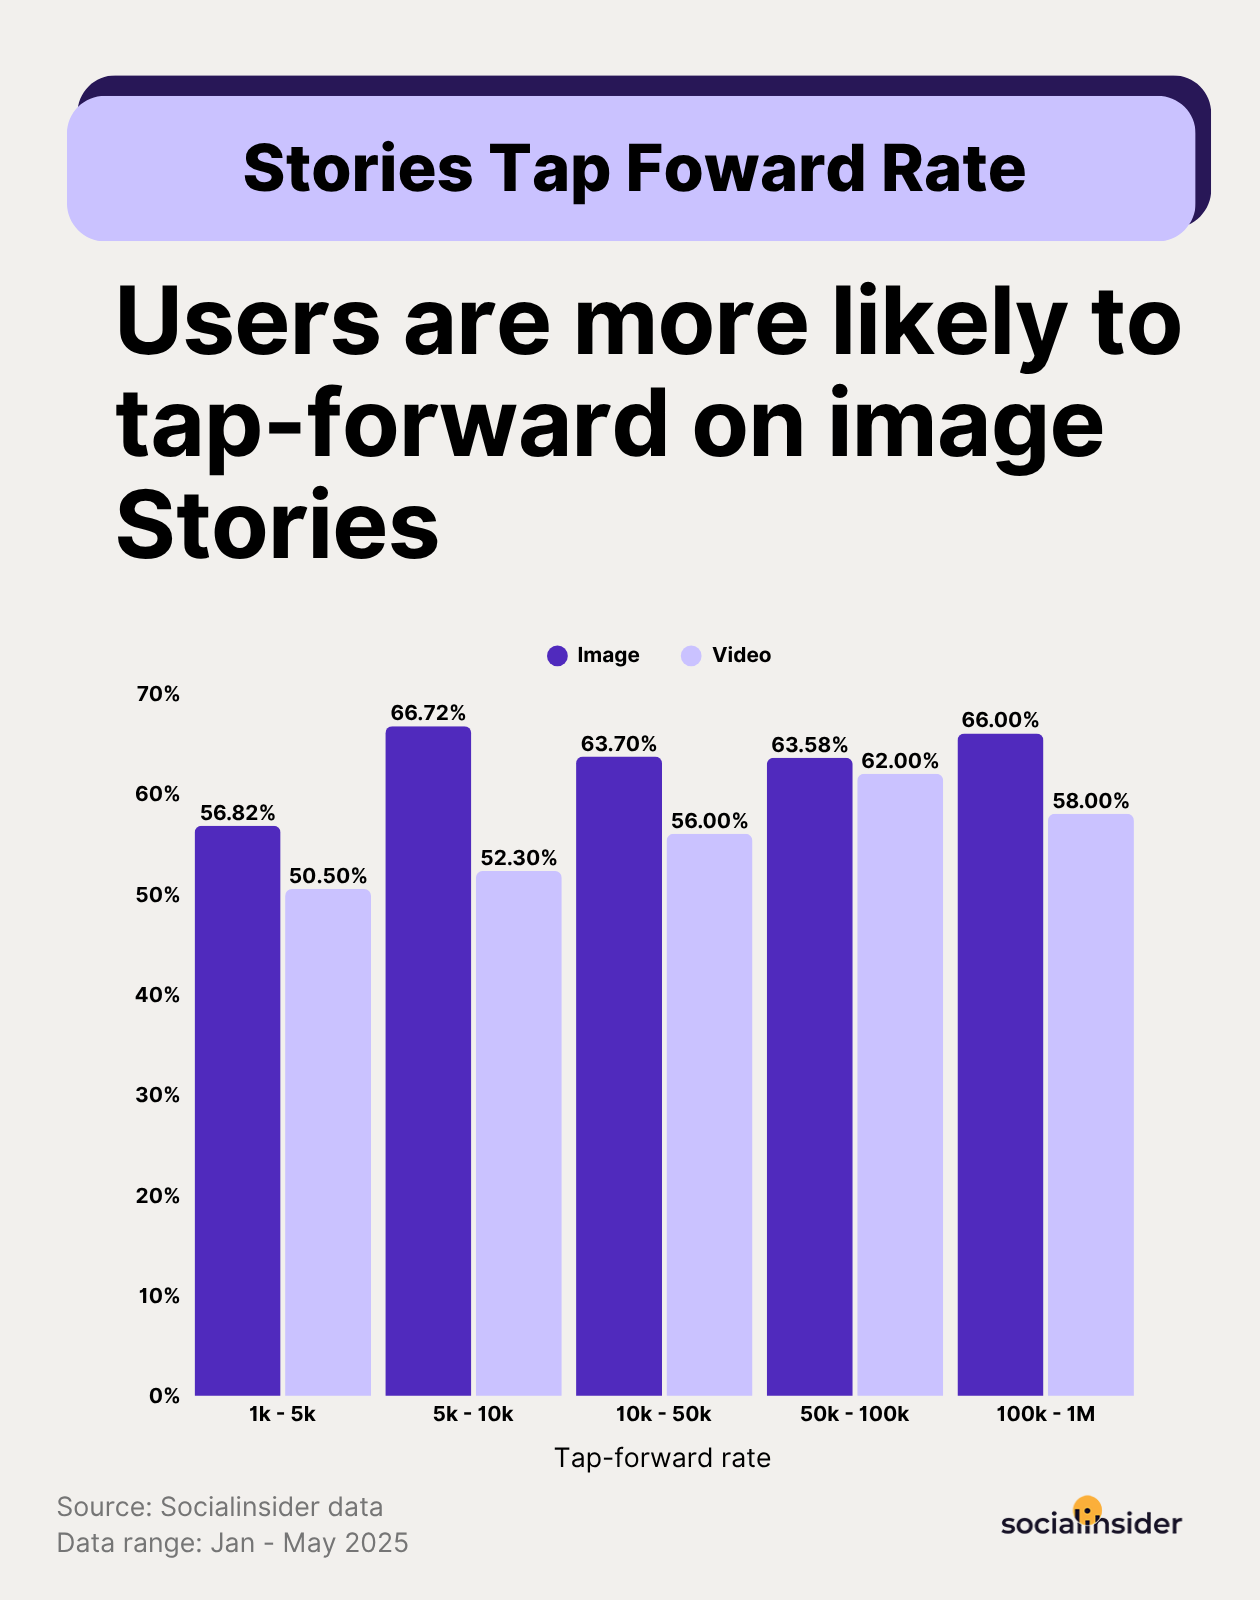
- Users tap-forward especially for image stories.
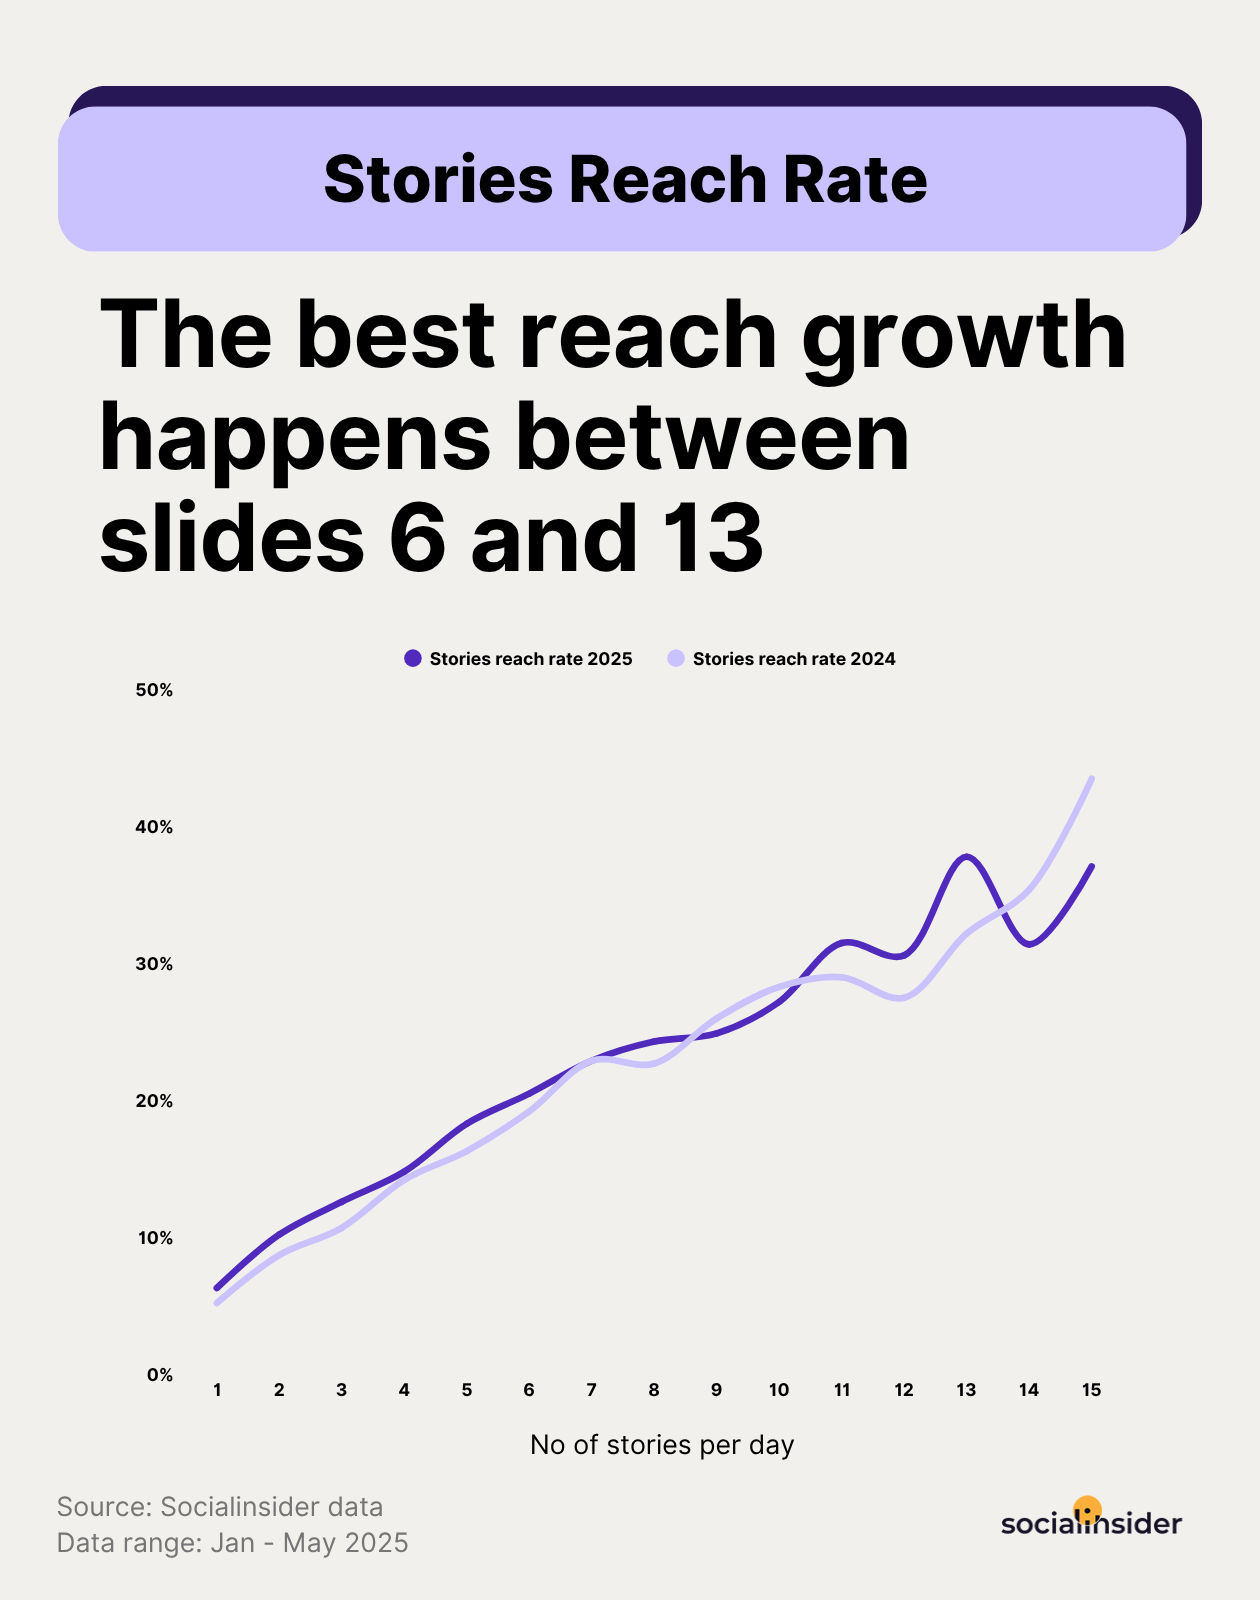
- The best Stories reach growth happens between 6 and 13 Stories.
- Video stories generate a higher reach.
- Feed posts get a higher reach than stories.
- The 10 Stories mark records the highest impressions increase.
Instagram Stories posting frequency
Let’s cut through the noise - Instagram Stories aren’t what they used to be. In their early days, they were a powerful engine for discovery - an easy way to boost visibility and tap into new audiences. But in 2025, the landscape has shifted. Stories are no longer your top-of-funnel superstar. Their strength now lies in retention and ongoing interactions.
They give brands a consistent, direct line to their existing followers. Whether it’s nurturing potential buyers, reinforcing brand loyalty, or staying top of mind during launch cycles, Stories are now a key component of day-to-day brand maintenance.
And frequency plays a critical role. The data clearly shows that brands increase Story volume as their audience grows:
- 1k – 5k followers → 12 Stories/month (~3 Story per week)
- 5k – 10k followers → 17 Stories/month (~1 Story every 2 days)
- 10k – 50k followers → 35 Stories/month (~1 per day)
- 50k – 100k followers → 50 Stories/month (~2 Stories per day)
- 100k – 1M followers → 80 Stories/month (~3 Stories per day)
This progression isn’t arbitrary - it reflects evolving audience expectations. As a brand scales, its Stories presence becomes more central to how it maintains relevance and trust.
Strategic tactics to optimize your posting frequency to keep audiences hooked
- Match your output to your size. Posting 12 times a month might work at 2k followers, but at 50k? That’s radio silence. As you scale, your frequency has to scale too.
- Think arcs, not snapshots. When accounts hit the 50+ Stories/month level, it’s rarely just check-ins. They’re telling stories in sequences—polls → product → personality. That’s where real engagement lives.
- Think depth, not just volume. If your Story reach is dipping, don’t panic. Use that as a sign to double down on relevance. The right content to the right people at the right moment. Retention is the new reach.
Instagram Stories usage
Once you’ve nailed how often to post, the next question is just as critical: what kind of Stories should you be posting?
The 2025 data paints a clear picture of format distribution across brand accounts:
- Images → 57%
- Videos → 43%
So why are images still more dominant?
For one, they’re more scalable. Brands posting 80 Stories per month often rely on templated visuals to maintain that pace. And for smaller accounts, image-based Stories offer a low-risk way to stay active without heavy production demands.
However, the brands seeing the most meaningful interaction often strike a deliberate balance. They don’t just alternate formats - they choose formats based on intent.
Quick announcements? Images.
Product demos, behind-the-scenes moments, or UGC takeovers? Always video.
Strategic tactics for creating a better Stories posting strategy
- Sequence matters. A great format combo looks like this: image slide to hook attention → short video to add depth → poll or sticker for interaction. That kind of flow keeps people tapping, not exiting.
- Let the format serve the message. Not every post needs motion. If it’s a simple update, go with an image. But if it’s something that needs energy, personality, or explanation, go with video.
- Don’t overthink video. You don’t need a studio setup. In fact, Stories that feel casual and real often perform better than the overly produced ones. Grab your phone, talk to camera, keep it short.
Stories exit rate benchmarks
Let’s talk about exit rates - arguably the most honest metric in your Instagram Story performance. It doesn’t just show whether people watched. It tells you when they left. And that? That’s where the real insight lives.
By analyzing exit rates across sequences ranging from 1 to 15 consecutive Instagram Stories, a clear behavioral pattern emerges. Here’s what we discovered:
1–3 Stories: The critical drop-off zone
- Exit rate starts at 23.8% on the first Story.
- Drops to 20.5% on the second, and 18.5% by the third.
- This is the point of highest viewer loss—nearly one in four viewers exit after slide one.
- If you don’t capture attention immediately, your audience likely won’t continue.
4–9 Stories: The stable retention window
- Exit rates continue to decline gradually: 15.7% at slide 4, dropping to 13.3% at slide 9.
- This range shows strong viewer retention. Once users are invested, they are significantly more likely to continue tapping through the full sequence.
10–15 Stories: The secondary drop-off phase
- While not as sharp as the early drop, this suggests a point of fatigue where viewers begin to disengage again.
By Story 15 exit rates go around 12.5%.
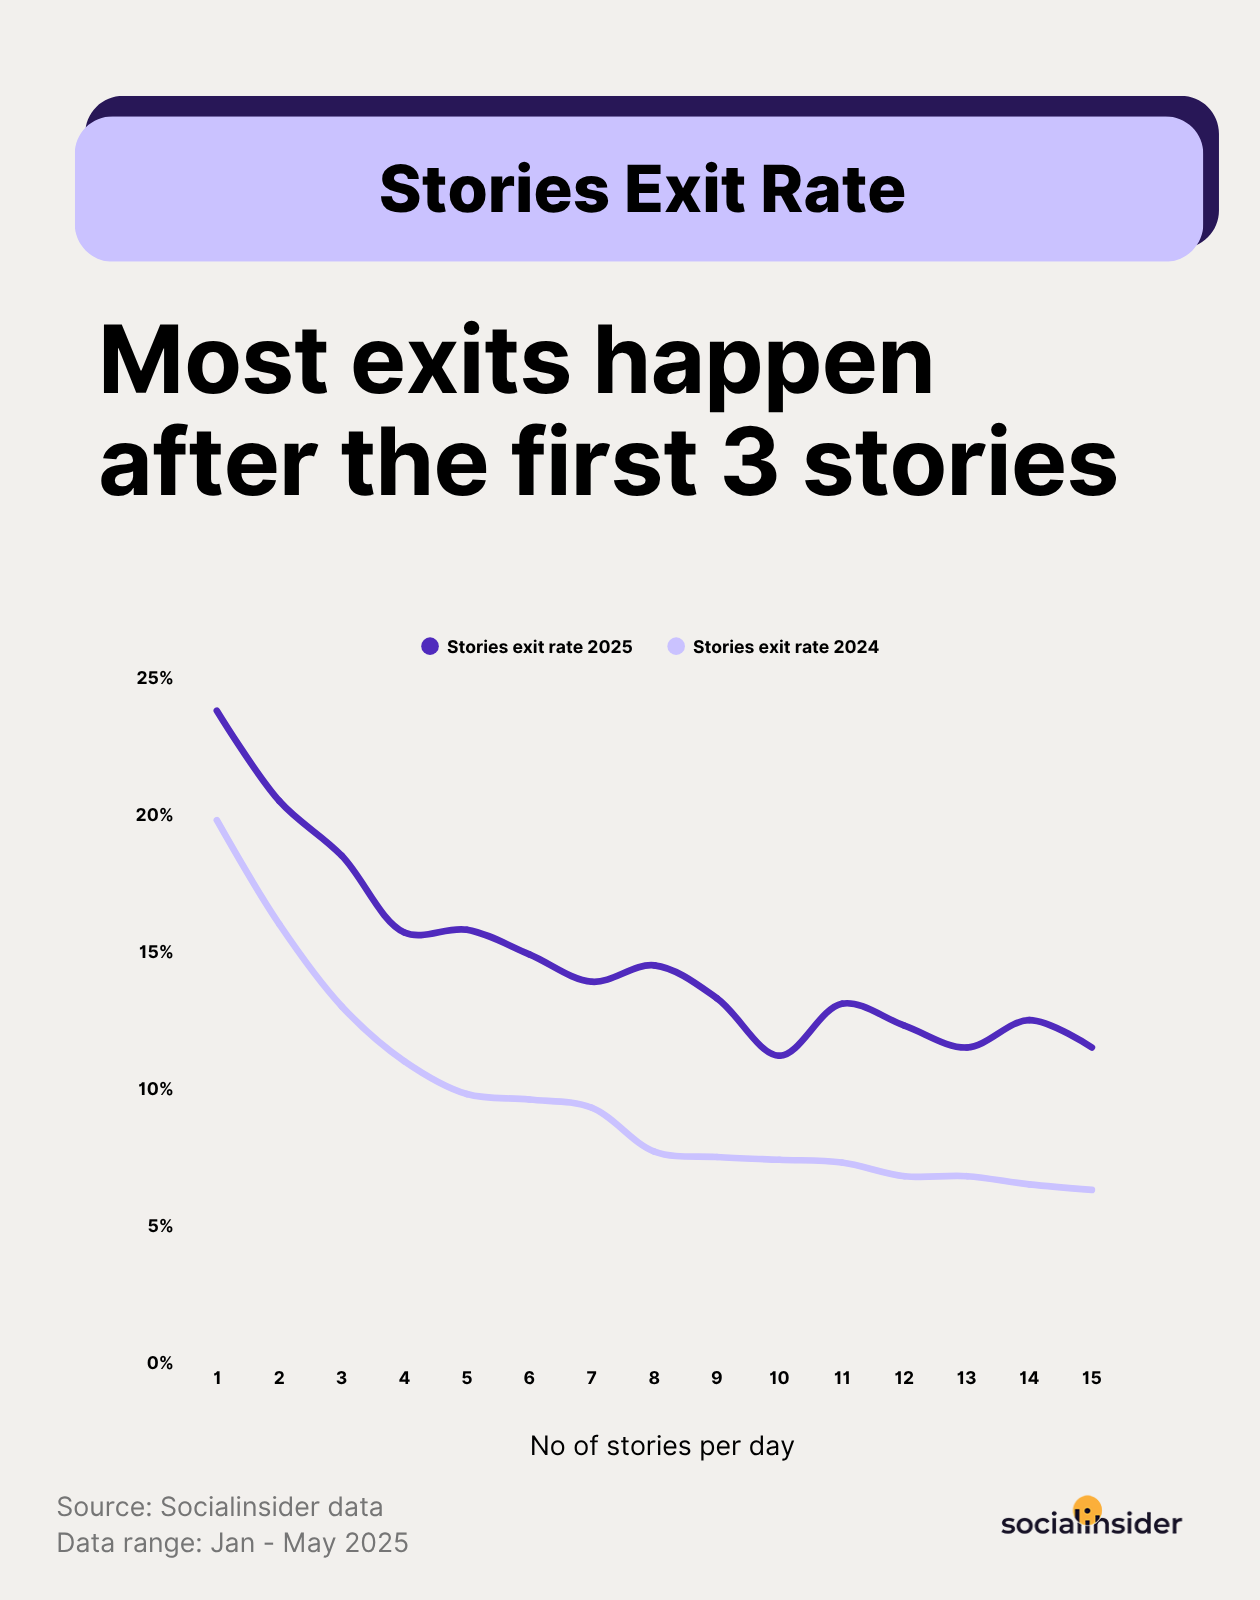
Additionally, we’re seeing a clear uptick in exit rates across the board in 2025, and that says a lot about how audience behavior is evolving.
In 2024, exit rates on Stories were dropping steadily as you posted more slides. The message was clear: the more value you offered, the longer people stayed. But in 2025? That curve looks different. The audience is more impatient—and much more selective.
There’s a lot of noise out there saying video is king on social. And while video definitely has its place, when it comes to Instagram Stories, the data tells a more balanced story.
We looked at average exit rates by format - image vs. video - across different follower ranges. And honestly? The difference is pretty small.
Strategic tactics to increase retention
- Prioritize the first three slides. The highest exit rates occur early, making the opening slides your most important. Strong visual design, immediate context, or a clear narrative hook can significantly improve retention.
- Use slides 4–9 to build depth.This mid-section holds the most stable engagement. It’s the ideal window for storytelling, product education, or layered messaging. This is where your audience is most open to detailed content.
- Reinforce engagement beyond slide 10. As slight fatigue begins to set in after slide 9, adding interaction—polls, questions, or a format shift—can re-engage viewers and maintain momentum through to the final slide.
- Focus on relevance before format. If your content doesn’t feel timely or useful, no format will save it. A great static slide with a strong hook will always outperform a vague, slow video.
- Use both to create natural rhythm. Too many static slides can feel flat. Too much video can feel heavy. Mixing the two gives your Stories pace, variety, and structure—and helps reduce exit fatigue across longer sequences.
Stories tap-forward rates benchmarks
Tap-forwards are one of those metrics that seem simple at first - someone tapped to move to the next Story, right? But in reality, it’s one of the most revealing signals of Story quality and pacing.
We dug into tap-forward rates by format (image vs. video) across follower tiers, and here’s what we found: video holds attention better than static images.
Strategic tactics on how to reduce your tap-forward rate
- Use video to reduce skimming, especially in small accounts. Under 10k followers, video slides consistently outperform images. They slow viewers down, hold attention longer, and give your brand a bit more presence.
- Pacing matters more than format at mid-tier levels. From 10k–50k, video is still ahead, but not by much. That means it’s not just what you’re using - it’s how fast your Story moves. Long intros, slow clips, or dense text will drive forward taps, even in video.
- Test mixed-format sequences to find your flow. Start with a punchy video, follow with an image CTA. Or break a longer video into multiple slides. Tap-forward rate isn’t about choosing one format - it’s about building sequences that earn the next tap.
Instagram Stories reach benchmarks
We all know reach matters. It’s the top of the funnel. The invitation. If people don’t see your Stories, nothing else - no polls, no swipe-ups, no clever CTA - really works.
The question is: how many Stories does it take in 2025 to actually get seen? And more importantly: how has that changed since last year?
Let’s unpack that.
In 2024, reach was more linear. The more you posted, the more you got seen. Pretty simple.But in 2025, things have shifted. The middle of the sequence is now the strongest reach zone, and posting too little - or too much - can actually limit exposure.
- Reach rate jumps from 6.3% at 1 slide to 20.5% by slide 6.
- The sweet spot sits roughly between 6 and 13 Stories, where reach climbs consistently and even peaks at 37.8% by slide 13.
- But after that? We see a noticeable drop-off—from 37.8% at slide 13 to 31.4% at slide 14, and 37.1% at slide 15. A decline that didn’t happen in 2024.
We already saw that the number of Stories you post affects your reach rate. But there are another factors at play: follower size and Stories formats—and it makes a bigger difference than most people expect.
Here’s how reach rate varies across different audience tiers, and how format (image vs. video) affects performance:
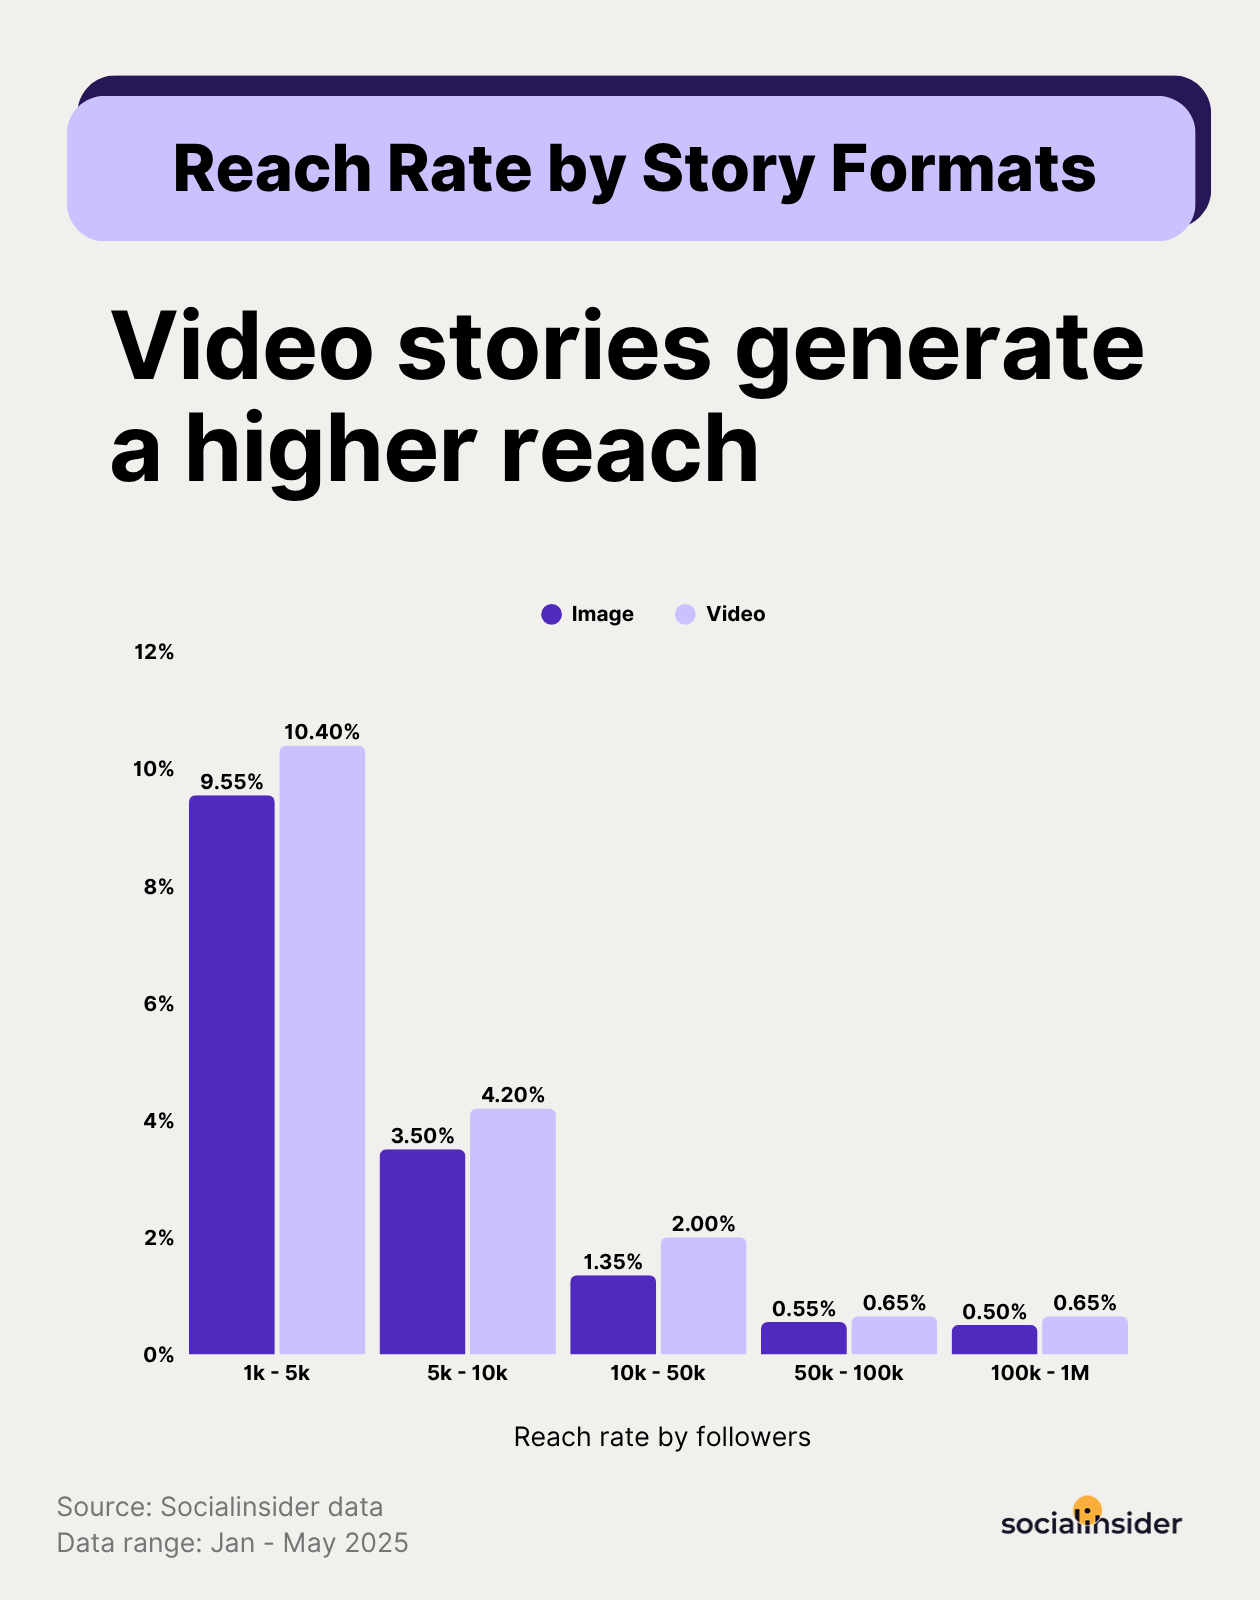
The trend is crystal clear: the more followers you have, the harder it is to reach them all - especially through Stories.
And while the drop-off is steep, one thing stays consistent: video outperforms image content at every single level.
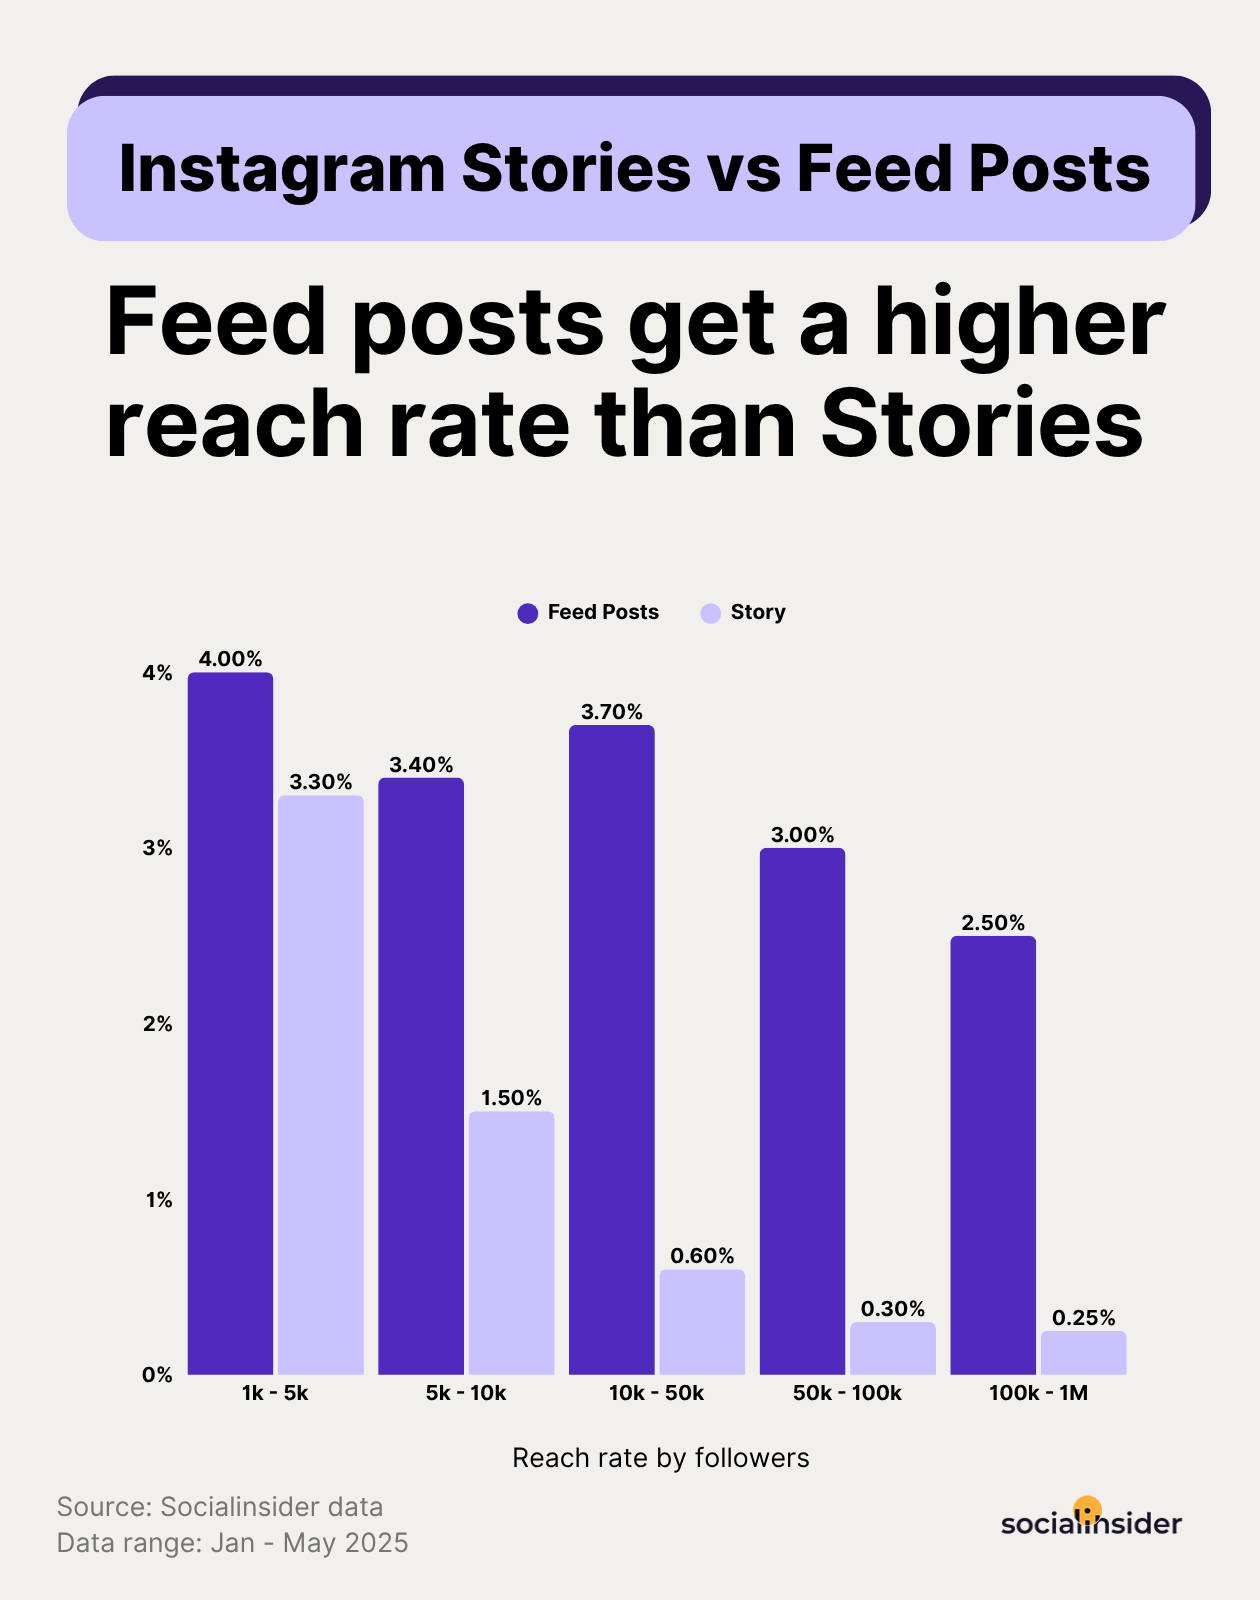
Remember when Stories were the place to be seen? In 2025, that’s no longer the case.
While Stories are still a powerful tool for engagement and brand personality, they’ve lost their edge when it comes to reach - especially when compared to feed posts. When we analyzed reach rates across follower tiers, the difference was striking.
Strategic tactics and how to increase your Stories’ reach numbers
- Post at least 6 Stories per day to boost visibility. Stories that stop at 1–3 slides are leaving reach on the table. If your goal is visibility, start posting 6+ slides per day. You don’t need groundbreaking content—think product close-ups, mini Q&A, testimonials, or quick polls. Just show up consistently with variety.
- Audit your daily flow and rework low-performing patterns. Look at where your current sequences tend to drop off. Are you losing people before slide 5? Rework your hooks. Are your last few slides underperforming? Trim them. Then retest with a shorter, focused arc and track reach changes for a week.
- Stop before slide 14 - unless the content truly demands more. Reach starts to drop after slide 13 in 2025. If you're regularly posting 14 or 15 Stories out of habit, test reducing to 12 and compare the reach. Use longer sequences only when you're launching something big or telling a high-stakes story—and make sure it's tight.
- Diversify your formats to combat reach decline. If you’re only using static slides, you’re likely missing out on the extra lift video can provide. Even one or two video slides in a sequence can help push your content farther in the Stories queue.
- Use feed posts to reach your audience - use Stories to keep them. Feed content is now your primary reach engine. If you're trying to get seen, use posts, Reels, and carousels. Once someone follows or engages, use Stories to build trust, encourage interaction, and move them toward action.
Instagram Stories impressions benchmarks
If reach tells us who saw your Story, impressions tell us who stuck around - or came back for more. This is where we get to measure real interest. Is your content engaging enough for someone to pause? Rewatch? Tap back instead of forward?
Let’s take a look at how Instagram Stories impressions rate has evolved from 2024 to 2025, based on how many Stories are posted in a single day:
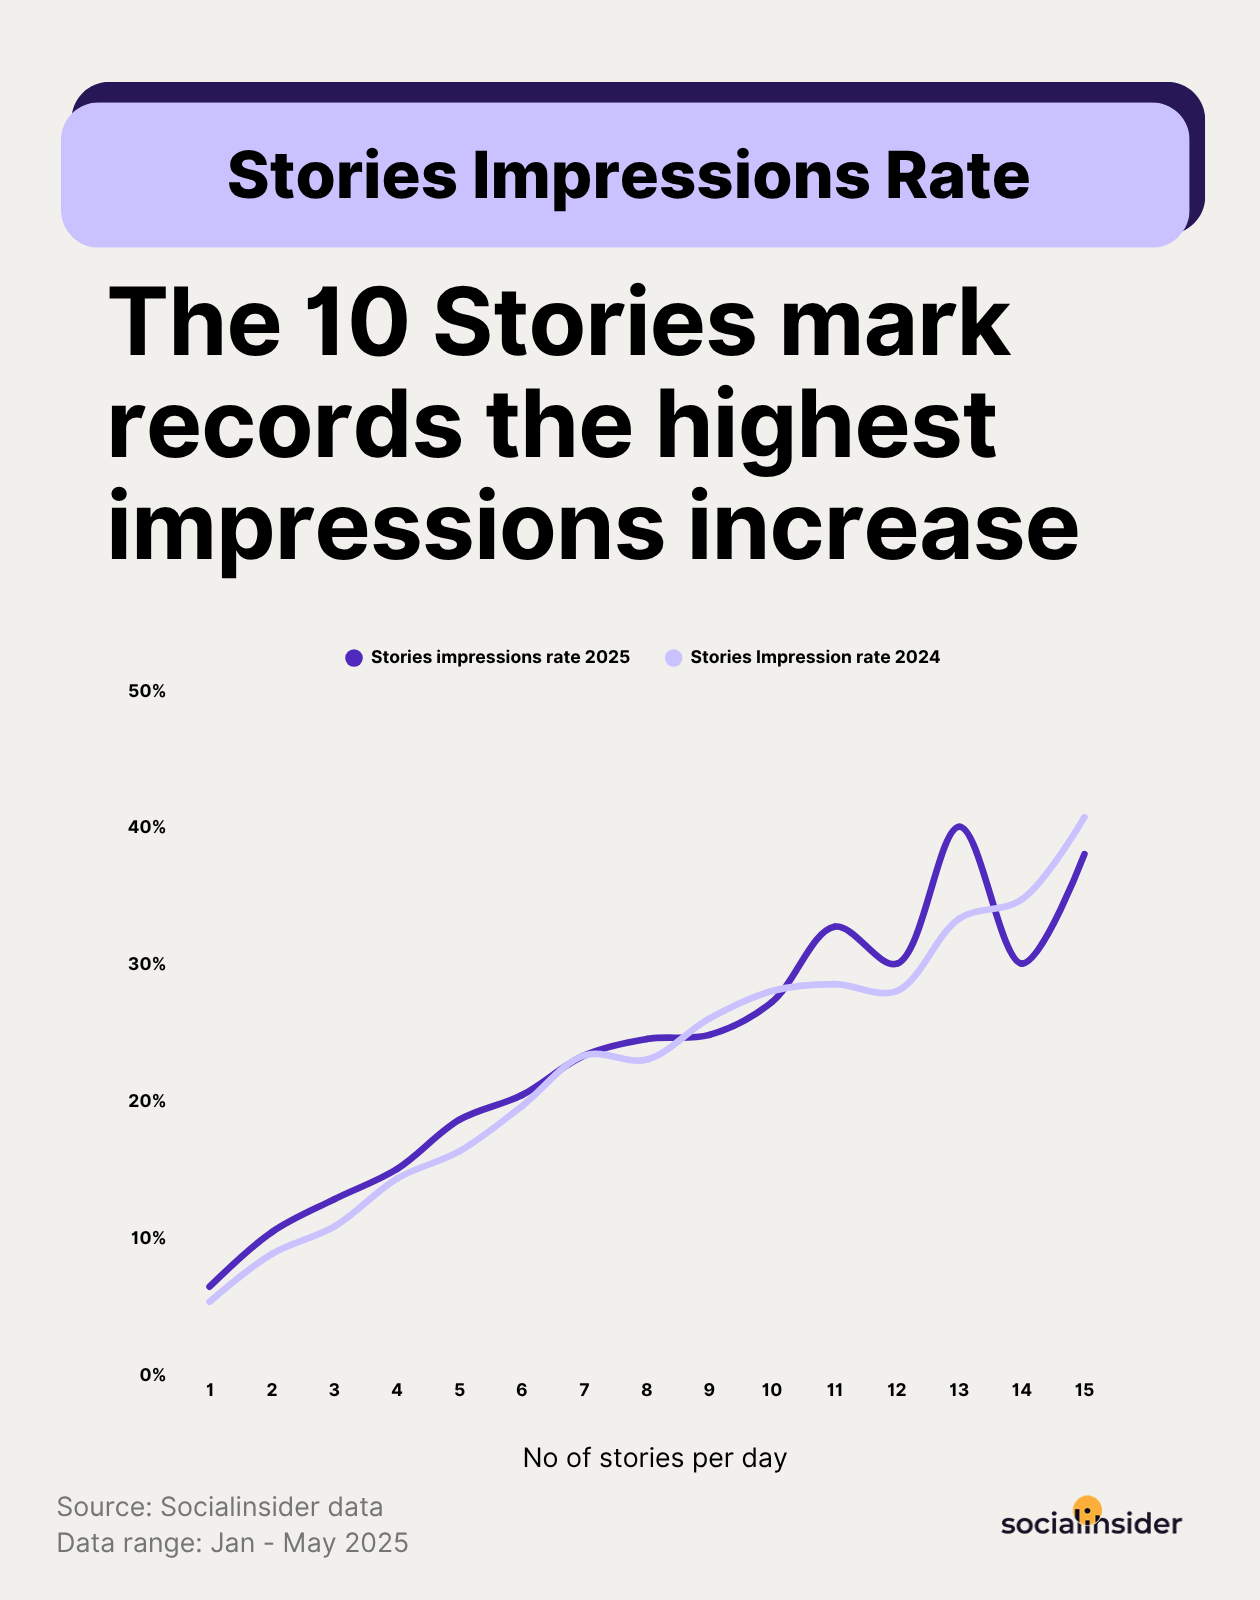
At first glance, 2025 seems to outperform 2024—especially in short and mid-range sequences. From slide 1 to slide 6, impressions have consistently gone up. That means people are not just seeing your Stories—they’re interacting with more of them and coming back more often.
But after that mid-point?
- 2025 impressions start to flatten around slide 7–8
- They actually dip slightly below 2024 from slides 9–10
- Then jump sharply at slide 13 - hitting a new high of 40.0%, higher than any point in 2024
So what's happening here?
It looks like attention is getting compressed, but payoff comes in bursts. Audiences are rewarding Story arcs that are well-paced and worth sticking around for—but they’re not as forgiving of filler or slow builds.
Strategic insights to boost your impressions
- CTA slides are your best impression magnets - if placed right. Slides with a clear action ("Reply to vote," "Tap the link," "Send us your thoughts") often get rewatched as users hesitate or come back later. Put these strategically in the middle or toward the end of the sequence—not the very last slide.
- Design for dwell time, not just completion. Instagram’s algorithm favors content that holds attention, even across multiple views. That means your visual rhythm matters: alternate fast-paced slides with slower, text-driven moments, or zoom out for context between close-ups. The more time people spend inside your Story, the more likely it is to be resurfaced.
- Create recap slides that viewers return to. A bullet-point summary, a quick checklist, or a price breakdown—these types of slides are rewatched more often because they’re useful. People come back for reference. Use them near the end of your sequence to lift the impression rate right before the drop-off point.
Methodology
The findings of this study are based on the analysis of 161,180 Instagram Stories posted by active brands within the timeframes January - May 2025 and January-May 2024.
The exit rate refers to the percentage of viewers who leave your Story sequence entirely from a specific slide—meaning they swipe away, close the app, or tap out to another account. It is calculated using this formula: number of exits on a slide divided by the total views on a slide and multiplied by 100.
The tap-forward-rate is the percentage of viewers who tap to move to the next Story slide- without exiting or engaging with the current one. It is calculated using this formula: number of forward-taps divided by total views and multiplied by 100.
Stories reach rate refers to the percentage of your total followers who viewed at least one slide in your Story sequence. It is calculated using this formula: number of viewers divided by total followers and multiplied by 100.
Stories impressions rate refers to the percentage of your total followers who viewed at least one slide in your Story sequence. It is calculated using this formula: total impressions divided by total followers and multiplied by 100.
Get in-depth Stories performance insights
Run a comprehensive Instagram stories analysis and get strategy optimization ideas!
Ready to improve your social media strategy with real-time insights?
Get strategic insights, analyze the social performance across all channels, compare metrics from different periods and download reports in seconds.