[What Data Says] Social Media Posting Frequency vs Engagement: What Content to Prioritize in Your Strategy?
Explore these social media posting frequency vs engagement insights and learn how to optimize your posting strategy for stronger engagement.
If there's one thing I've learned from digging into the Socialinsider data, it's that social media algorithms don't play by the same rules. Each platform has its own logic, its own favorite formats, its own definition of what actually deserves to be seen. A posting strategy that's working beautifully on Instagram can fall completely flat on Facebook — not because the content is bad, but because the context is different.
That's why instead of handing you a generic "post X times per week" checklist, I'm breaking this down platform by platform — looking at how posting frequency and content format interact, and what that actually means for engagement.
Executive summary
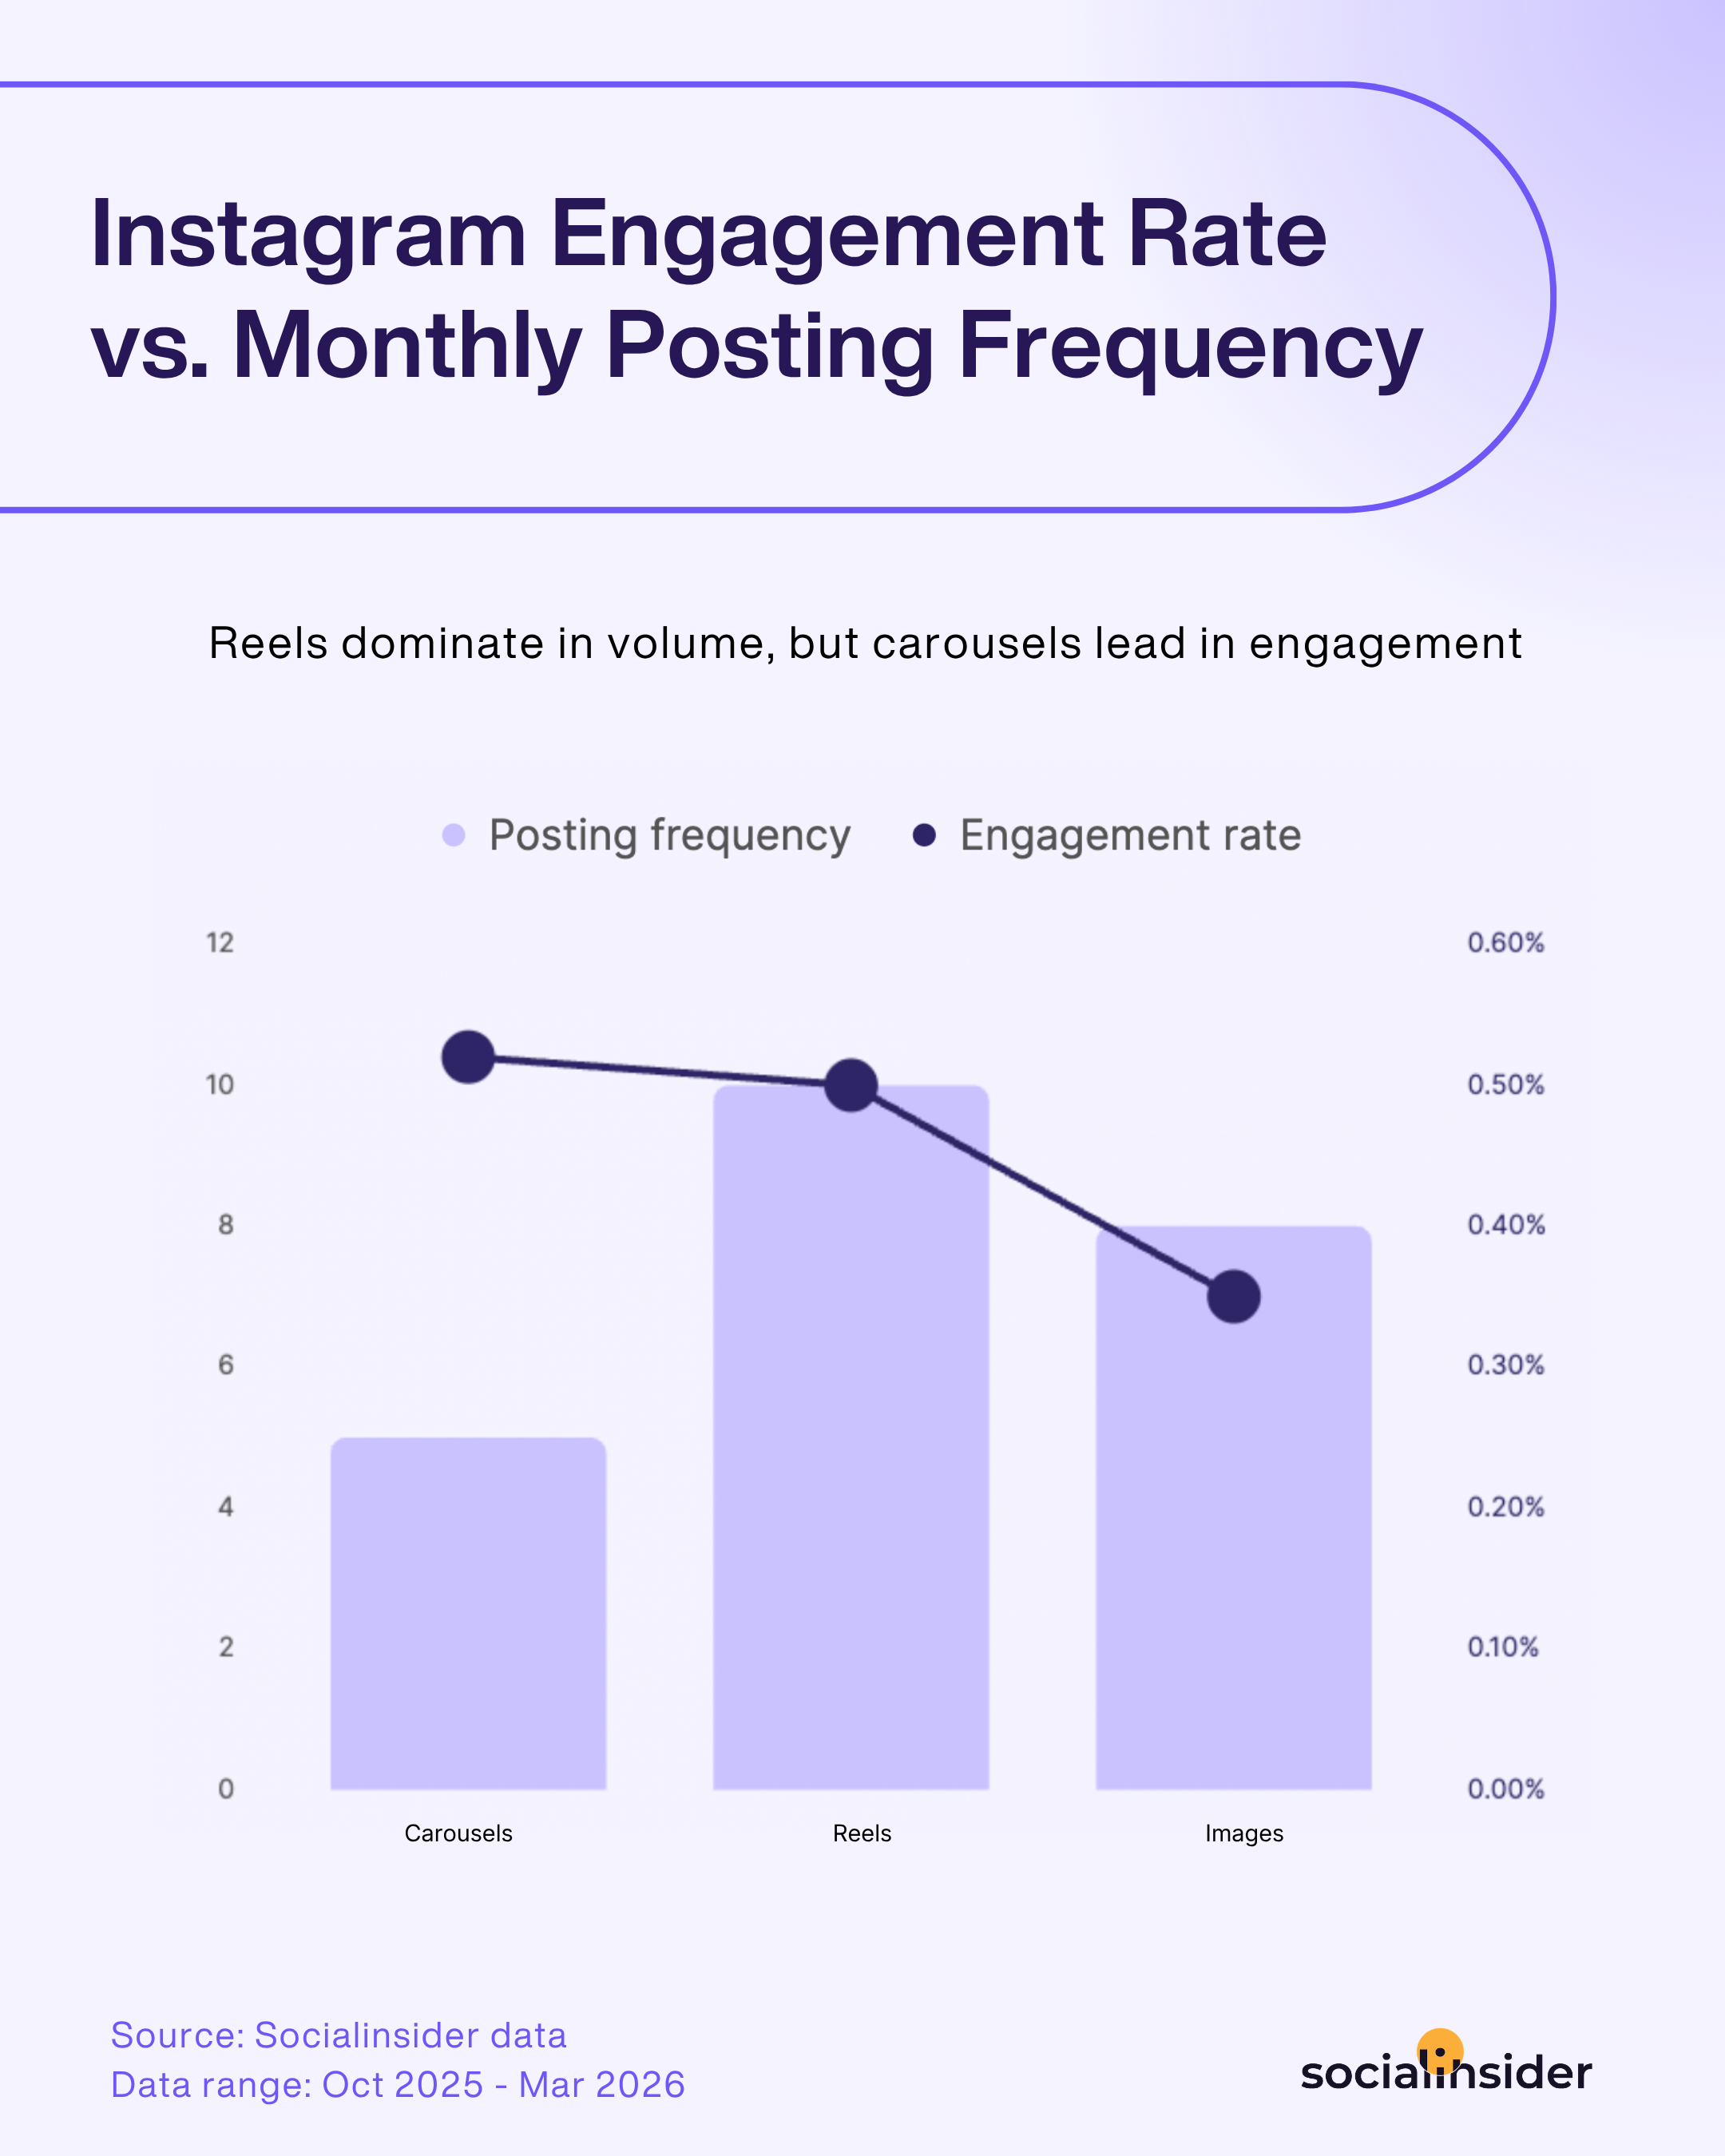
- In Instagram’s case, Reels dominate in monthly posting volume, but carousels lead in engagement.
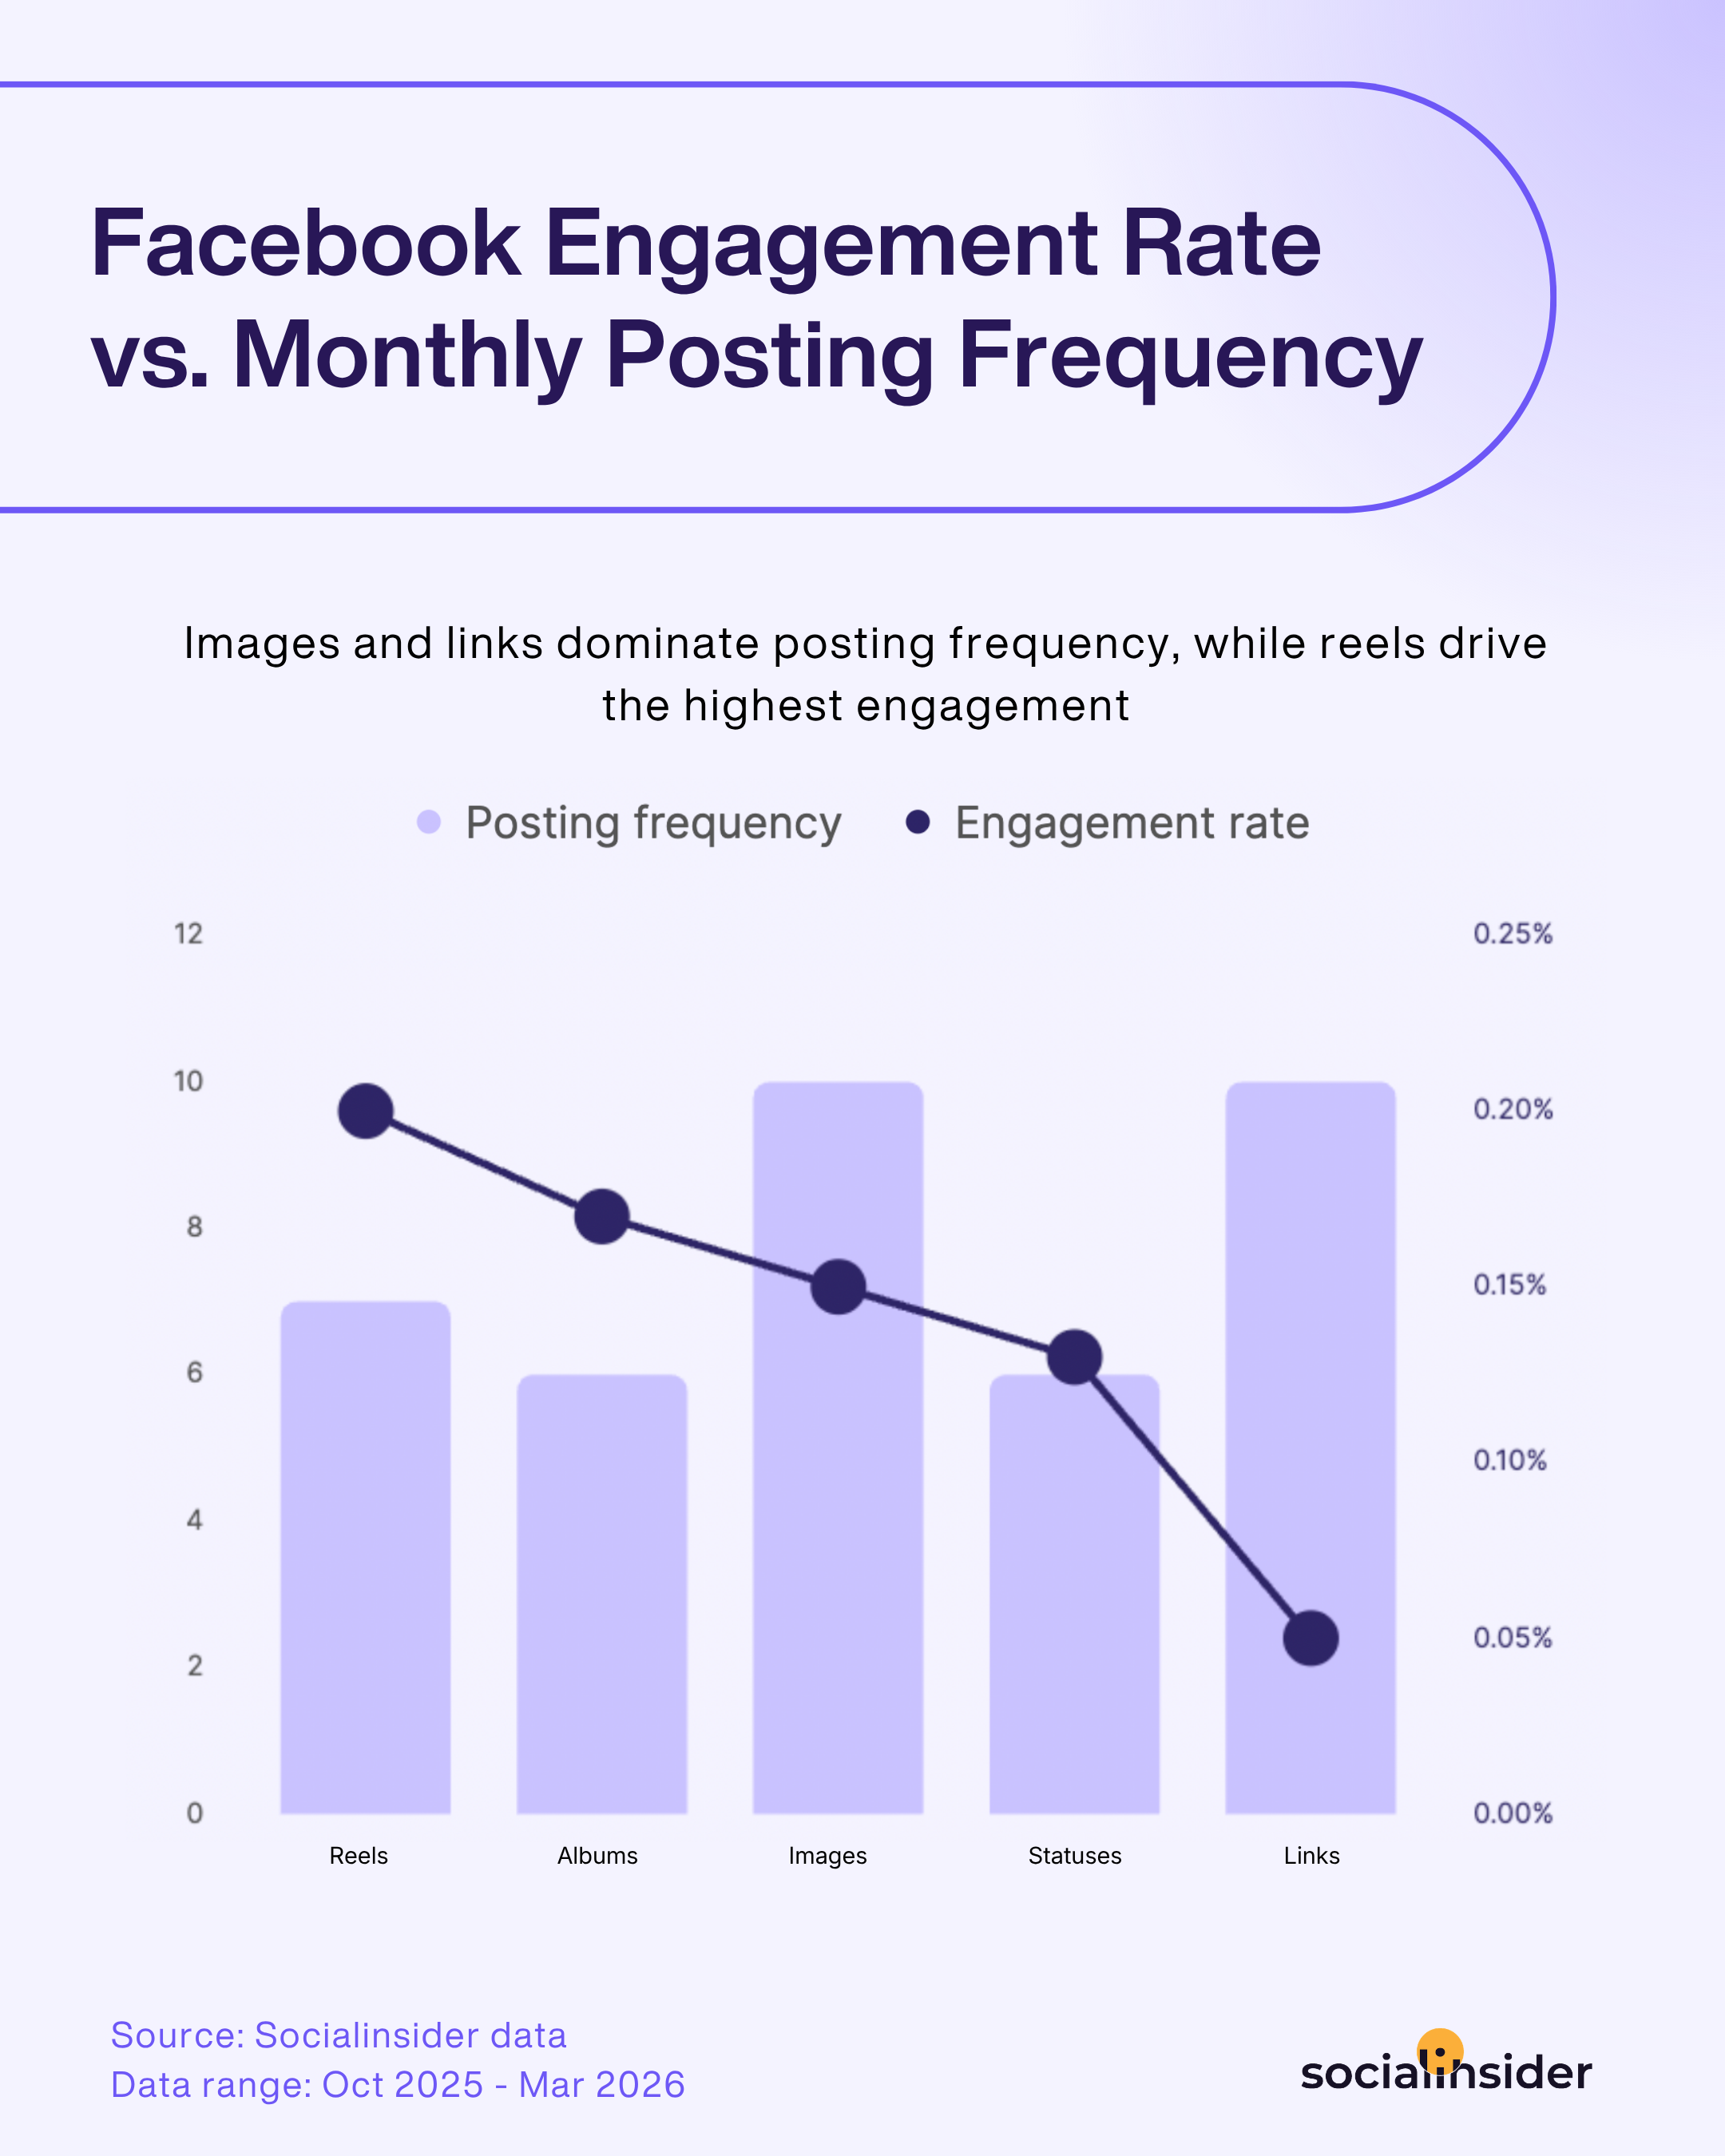
- For Facebook, images and links dominate monthly posting frequency, while reels drive the highest engagement.
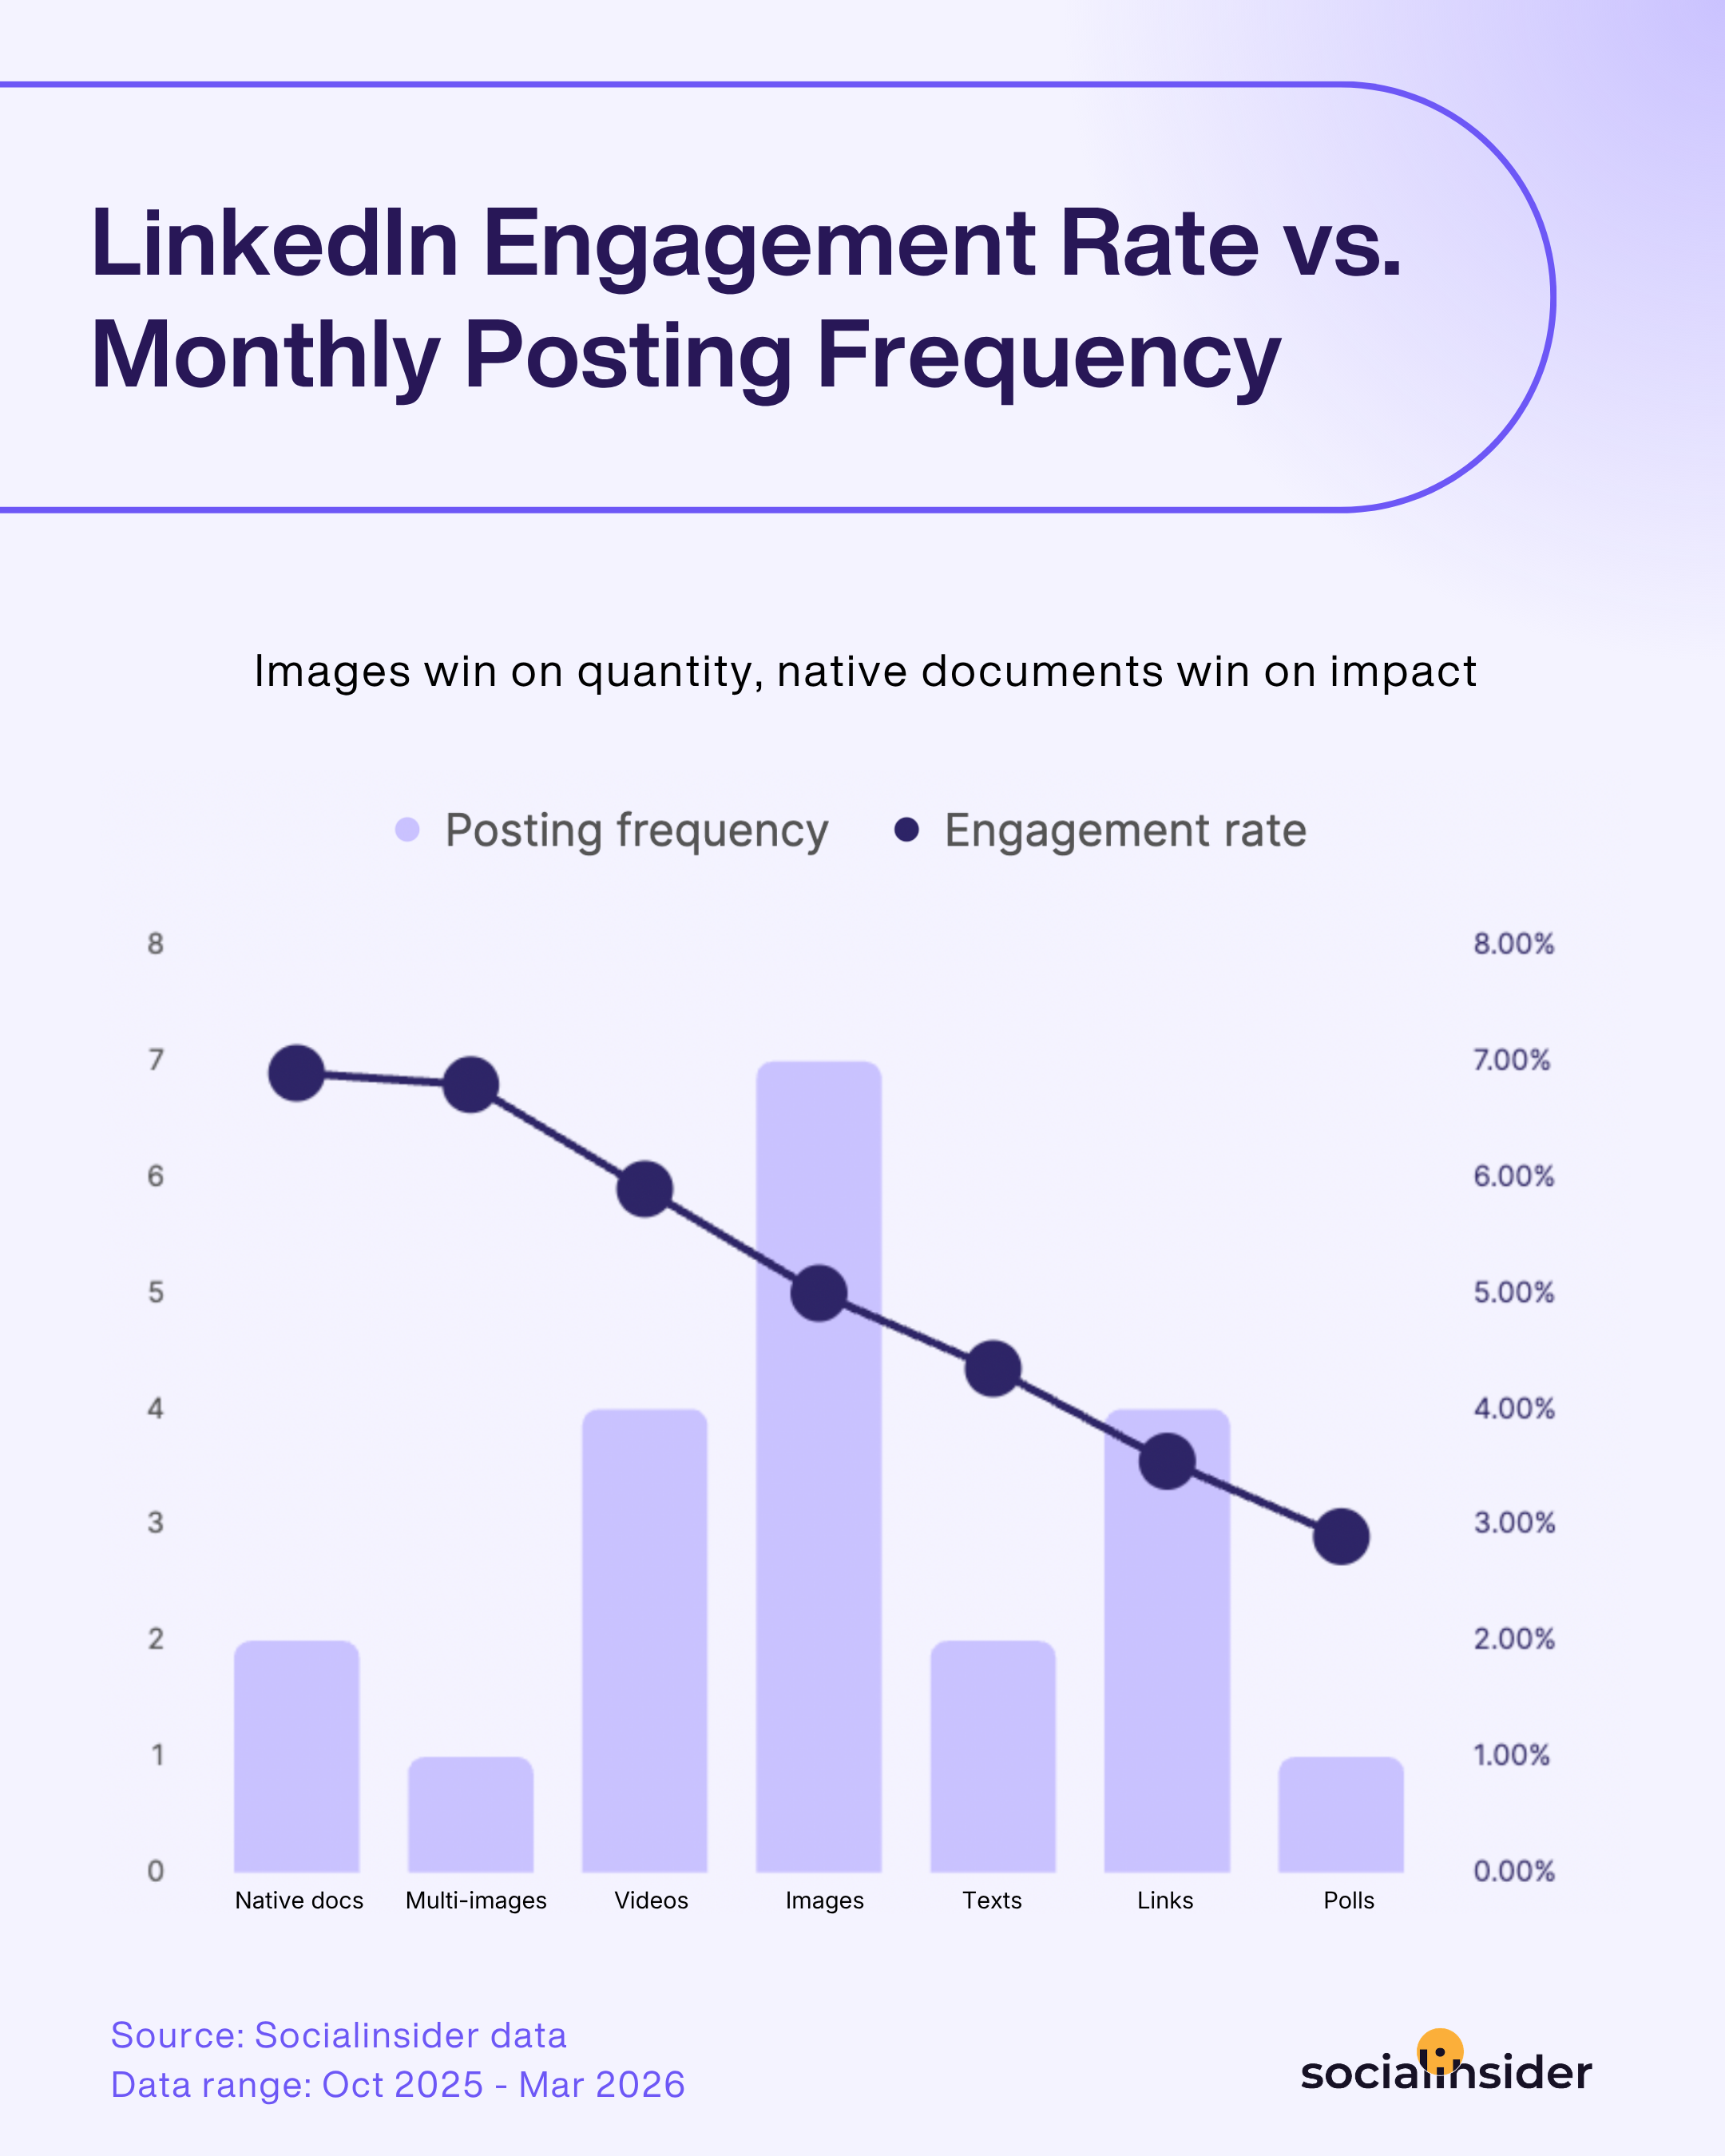
- In LinkedIn’s case, images win on quantity, native documents win on impact.
Instagram posting frequency vs engagement
Based on Socialinsider’s Instagram benchmarks study, a particular insight that marketers should always keep in mind when juggling their Instagram posting frequency is that each content format serves a different purpose — and betting everything on just one of them is rarely a good idea.
That said, in Instagram’s case, according to Socialinsider’s latest data, Reels are clearly where most brands are putting their chips right now, with an average volume of 10 posts per month. And from a point of view, that’s understandable, since Reels are Instagram's biggest reach driver, and the platform is still actively pushing them. But when you look at the engagement numbers, the story gets a little different.
When analyzing performance from an engagement perspective, the Socialinsider data indicates that Carousels - the format that brands are betting on the least is actually the one winning the most.
With an average monthly volume of 5 posts per month, carousels lead the engagement chart at 0.52%. And Reels follow closely, indeed, averaging a 0.50% engagement rate — but brands are publishing twice as many to get there.
So, for me, In Instagram’s case, the pattern is clear: volume and performance don't always move in the same direction.
What are your competitors posting, and what’s it getting them?
Most brands post twice as many Reels as carousels, yet carousels win on engagement. But what does that look like in your category?
That’s where I’d use Socialinsider AI. Add your competitors to a project and ask something like “How many posts did each of our competitors publish on Instagram last month, in which formats, and how much engagement did each format generate?” You get their posting mix and the return on every format, brand by brand, in one answer. Is someone winning with half the output? Is everyone overinvesting in Reels? Now you know where your mix should go. Pretty handy, no?
How to check it:
- Create a project. Click the project dropdown, select “Add New Project” and give it a name.
- Add your profile and competitors. Paste each Instagram profile URL into the search box, click “Search,” then “Add profile.”
- Open Socialinsider AI. Start a conversation from your project [verify: entry point label].
- Ask about their mix. Ask how many posts each competitor published, in which formats, and how much engagement each format generated. Include the timeframe.

- Compare with your own. Follow up with something like “How does our format mix compare to theirs, and what should we change?”
Facebook posting frequency vs engagement
Facebook is an interesting case — and honestly, one that still surprises me every time I look at the data. If Instagram's lesson was about carousels quietly outperforming, Facebook's lesson is about the sheer gap between what brands post most and what actually resonates.
Images and links are the two most posted formats on Facebook, both averaging 10 posts per month. And I get it — they're easy to produce, easy to schedule, and have been the default Facebook content type for years. But when you flip to engagement, they're sitting at the bottom of the chart.
Reels, posted 7 times per month on average, lead Facebook engagement at 0.20%. Albums follow at 0.17% with just 6 monthly posts. Meanwhile, links — despite matching images at 10 posts per month — generate a near-negligible 0.05% engagement rate. That's a significant investment of posting frequency for almost no return.
What this tells me about Facebook posting frequency is similar to what we saw on Instagram, but with a sharper edge: the formats brands rely on most heavily are consistently underdelivering, while video and richer visual formats are doing the heavy lifting with less volume.
The takeaway for your Facebook posting frequency strategy? It might be time to rethink the default.
LinkedIn posting frequency vs engagement
If Facebook's data was surprising, LinkedIn's is almost humbling. Because the gap between what brands post most and what actually performs best is wider here than on any other platform I've looked at.
Images dominate LinkedIn posting frequency at 7 posts per month — by far the most published format. Videos and links follow at 4 each, while native documents, multi-image posts, texts, and polls are all sitting at 2 or fewer monthly posts.
And then you look at engagement, and everything shifts.
Native documents — posted just twice a month on average — lead the engagement chart at a striking 6.90%. Meanwhile, images, despite being the most posted format, come in fourth at 5.00%.
Links tell a familiar story: 4 posts per month, 3.55% engagement. A decent return, but not exactly justifying the volume when native documents are delivering nearly double the engagement rate at half the frequency.
For me, this is the clearest illustration yet of what LinkedIn posting frequency best practices should actually look like in 2026. It's not about flooding the feed — it's about showing up with the formats your audience finds genuinely valuable.
In a nutshell, here are my LinkedIn posting frequency recommendations: post less of what's easy, and more of what works.
Are you posting more of what works, or more of what’s easy?
Native documents get the highest engagement at a fraction of the volume. But how does your own page compare? Are you leaning on images while your documents quietly outperform?
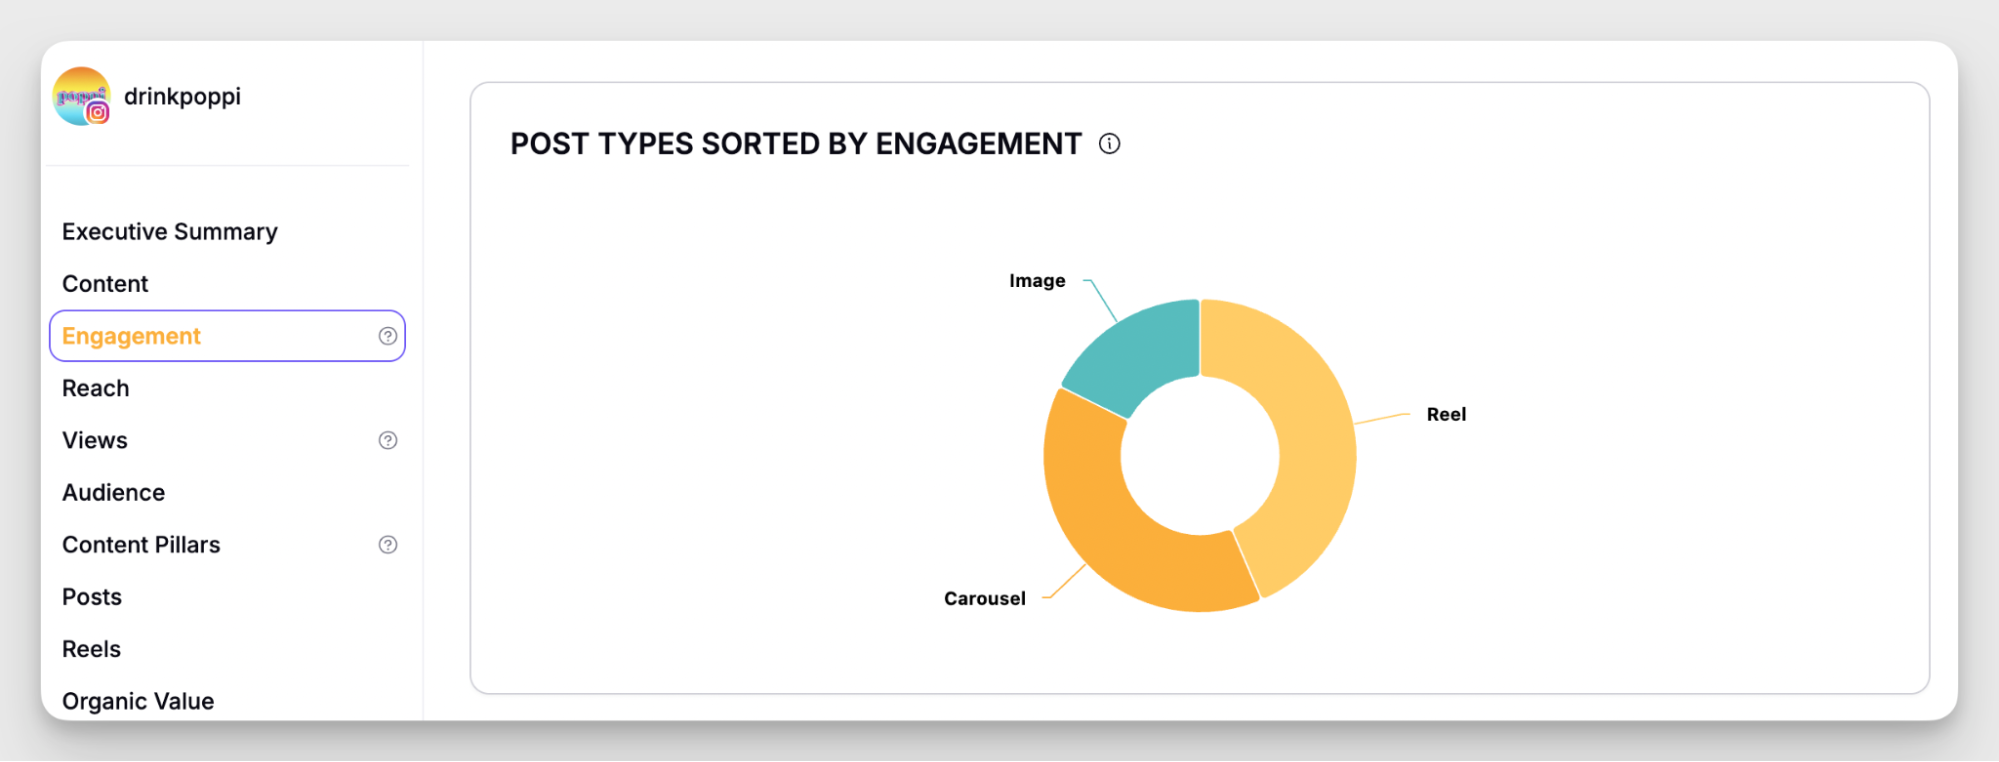
Socialinsider answers both halves of that question on one screen. In the Executive Summary, the Posts by type chart shows your usage mix: how much of your output goes to each format. Right next to it, your post types are ranked by engagement. Put the two side by side, and the gaps jump out. A format at the top of the engagement ranking but at the bottom of your mix? That’s where your next posts should go.
- Add and connect your LinkedIn page. Paste your company page URL into the search box of a Socialinsider project, click “Search,” then “Add profile.” Connect the page, since impressions are only available for pages you manage.
- Open the Executive Summary. Click your page in the left-side menu and open Executive Summary. Set the timeframe to the last 90 days.
- Check your usage mix. The Posts by type chart shows how your posts split across formats.

- Check what performs. The engagement chart shows your post types ranked by engagement.

- Compare the two. Look for formats that rank high on engagement but take up a small share of your mix. Those are the ones to post more of.
Social media posting frequency best practices for 2026
If there's one thing the data across all these platforms keeps telling me, it's that posting frequency is only half the equation. Here are the practices I keep coming back to when building a strategy that actually holds up.
Start with benchmarks, but don't stop there
Industry benchmarks are a useful starting point — they tell you what brands in your space are doing and give you a baseline to work from. But they're not a prescription. Your audience, your content quality, and your resources all shape what the right frequency looks like for you specifically. Use the numbers as a reference, not a rulebook.
With Socialinsider, you can dig into your best-performing posts and content formats across platforms — and use that data to build a posting strategy based on your own results, not someone else's averages. If your carousels are consistently outperforming your Reels, that's your signal to shift the mix.
Prioritize consistency over volume
Posting 10 times a week for a month and then going quiet is worse than posting 4 times a week every week. Algorithms reward predictable activity, and audiences build habits around accounts they can rely on. Find a frequency you can sustain with quality content, and stick to it.
Treat each platform as its own strategy
As the data shows, what works on LinkedIn won't necessarily work on Facebook, and what works on Facebook won't necessarily work on Instagram. Each platform has its own algorithm, its own preferred formats, and its own audience expectations. A copy-paste approach across channels is one of the fastest ways to get mediocre results everywhere.
Test, measure, and adjust — always
No posting strategy is ever truly finished. Audience behavior shifts, algorithms update, and new formats emerge. Build regular performance reviews into your workflow, stay curious about what the numbers are telling you, and don't be afraid to change course when the data points in a new direction.
Methodology
The findings of this study are based on the analysis of 24,615,414 Facebook posts, 21,280,832 Instagram posts and 765,457 LinkedIn posts coming from brands between 1K - 1M followers that had an active presence on these platforms over October 2025 - March 2026, belonging to different industries.
The study's sample consisted of:
- 2,331,292 Instagram posts, 1,078,762 Facebook posts, and 99,903 LinkedIn posts coming from 91,565 Instagram accounts, 19,305 Facebook business pages, and 3,522 LinkedIn company pages with less than 5000 followers.
- 1,591,202 Instagram posts , 1,064,233 Facebook posts, and 75,191 LinkedIn posts, coming from 45,380 Instagran accounts, 13,673 Facebook business pages, and 2,084 LinkedIn business pages with followers between 5000-10000.
- 5,720,780 Instagram posts, 5,442,743 Facebook posts, and 232,543 LinkedIn posts, coming from 127,207 Instagram accounts, 43,733 Facebook business pages, and 4,656 LinkedIn business pages with followers between 10000 -50000.
- 2,834,562 Instagram posts, 3,510,052 Facebook posts, and 107,447 LinkedIn posts, coming from 48,412 Instagram accounts, 19,471 Facebook business pages, and 1,729 LinkedIn business pages with followers between 50000-100000.
- 12,966,442 Instagram posts, 13,519,588 Facebook posts, and 339,468 LinkedIn posts, coming from 109,334 Instagram accounts, 44,789 Facebook business pages, and 3,611 LinkedIn company pages with 100000 followers.
The reason accounts with fewer than 1000 followers or more than 100000 followers were left out is that they usually alter the data, being the most common sizes that produce outliers.
The sample size for this analysis includes only organic posts.
The average engagement rate per post (by followers) on Facebook is calculated as the total engagement of a post (the sum of reactions, comments, and shares) divided by the number of followers of the page, multiplied by 100. The result is then averaged across all posts in the sample.
The average engagement rate per post (by followers) on Instagram is calculated as the total engagement of a post (the sum of likes, comments, saves, and shares) divided by the number of followers of the account, multiplied by 100. The result is then averaged across all posts in the sample.
The average engagement rate per post (by impressions) on LinkedIn is calculated as the total engagement of a post (the sum of reactions, comments, shares, and clicks) divided by the number of impressions the post received, multiplied by 100. The result is then averaged across all posts in the sample.

Elena Cucu
As Content & SEO Manager at Socialinsider, Elena Cucu helps social media leaders make sense of the numbers behind their performance. Featured in TechCrunch, TNW, and ReadWrite.

Know what your competitors do — before your manager asks
Get instant social benchmarks & reports without manual work.