Socialinsider vs. Rival IQ : Which One Is More Powerful for Performance Reporting?
Explore the key differences between Socialinsider and Rival IQ. Find out which social analytics platform offers the best data for your needs.


Socialinsider and Rival IQ aim to make competitor monitoring easier on social media, but they differ in how deep they go and how you work with the data.
Both tools help with social media analytics and competitor research. But once you start using them, you notice the difference, from how data is structured to how much context you get from it.
In this article, I’ll walk you through my experience testing both Socialinsider and Rival IQ, so you can decide which one fits better with your workflow. Read on!
Key takeaways
-
Socialinsider key social media analytics features: Socialinsider stands out through in-depth competitor benchmarking, cross-channel analysis, LinkedIn insights, and flexible, insight-rich reporting that adds strong strategic context to performance data.
-
Rival IQ’s key social media analytics features: Rival IQ offers solid competitor tracking and post-level insights with useful reporting and paid performance indicators, but lacks depth in benchmarking context and LinkedIn analytics.
Main capabilities of Socialinsider vs Rival IQ
Both Socialinsider and Rival IQ sit in the same category: social media analytics tools with competitor research. They help you track performance, benchmark against competitors, and understand how your content stacks up in your industry.
Let’s break down what each tool brings to the table.
Socialinsider key social media analytics features
Socialinsider focuses heavily on competitor research and benchmarking. If you want to separate different groups of accounts, you create a project. If you want to group the accounts under one layer, you create a Brand.
This setup gives me multiple layers of social media analysis. I can:
- Analyze competitors cross-channel or per channel
- Look at performance at the brand level (all accounts grouped together)
- Analyze social media content on a post-by-post level
So, let’s see what I can find out with Socialinsider.
Cross-channel analysis
Socialinsider gives you a solid overview of brand performance in one aggregated report.
I find this especially useful for quick strategic check-ins. When you need to answer executive-level questions, this view gives you a clear snapshot without digging through multiple dashboards.
For example, this one view shows how HubSpot performed over a month-long period.
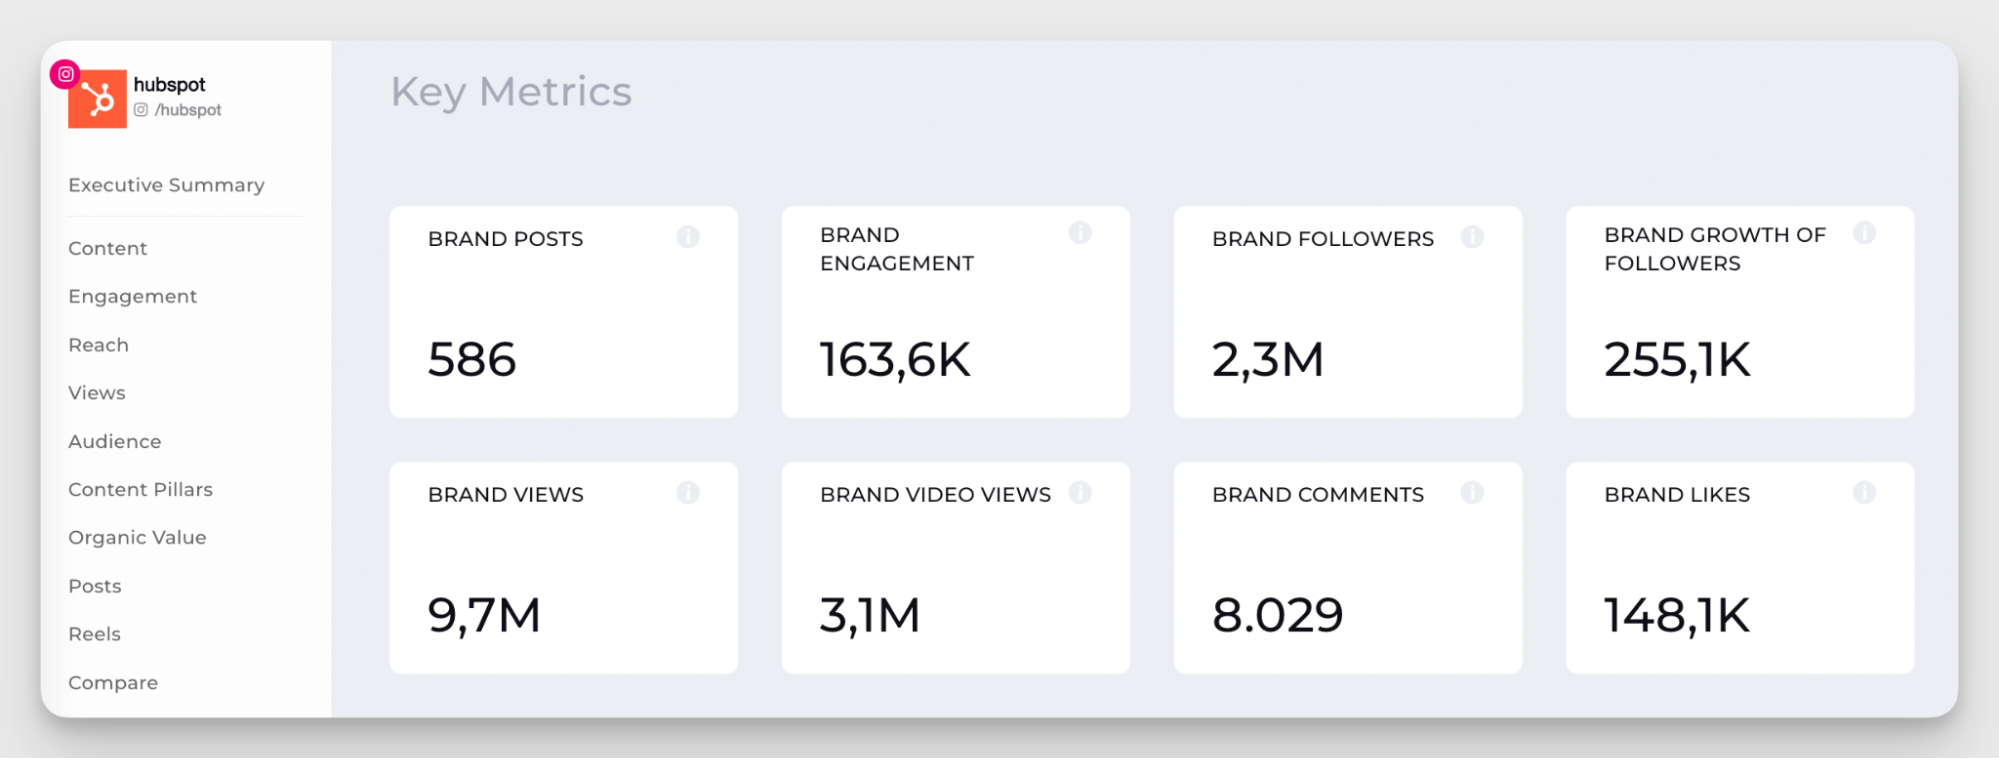
Besides brand metrics, it also comes with key takeaways based on performance across all platforms, so you can quickly understand how a brand is doing and what its current state is.
Then, if you scroll further, you get a cross-channel breakdown of key metrics like follower growth, engagement rate, content pillars, organic value, and top-performing posts.
Performance benchmarks
Competitor benchmarking is one of Socialinsider’s strongest features. Socialinsider’s client Alfonso (Noxsport) says:
One of the things I liked about Socialinsider was the combined reporting and comparing with the benchmark that you have in the reports with your competitors.
It gives you a clear view of the competitive landscape and shows exactly where each brand stands within it — yours included.
You can compare brand performance cross-channel or by platform on Facebook, Instagram, X/Twitter, TikTok, YouTube, and LinkedIn.
The first thing you see is the comparison table. Choose the metrics you find most important for your specific case — I went with follower growth, engagement, post count, average engagement, reach, views, and comments.
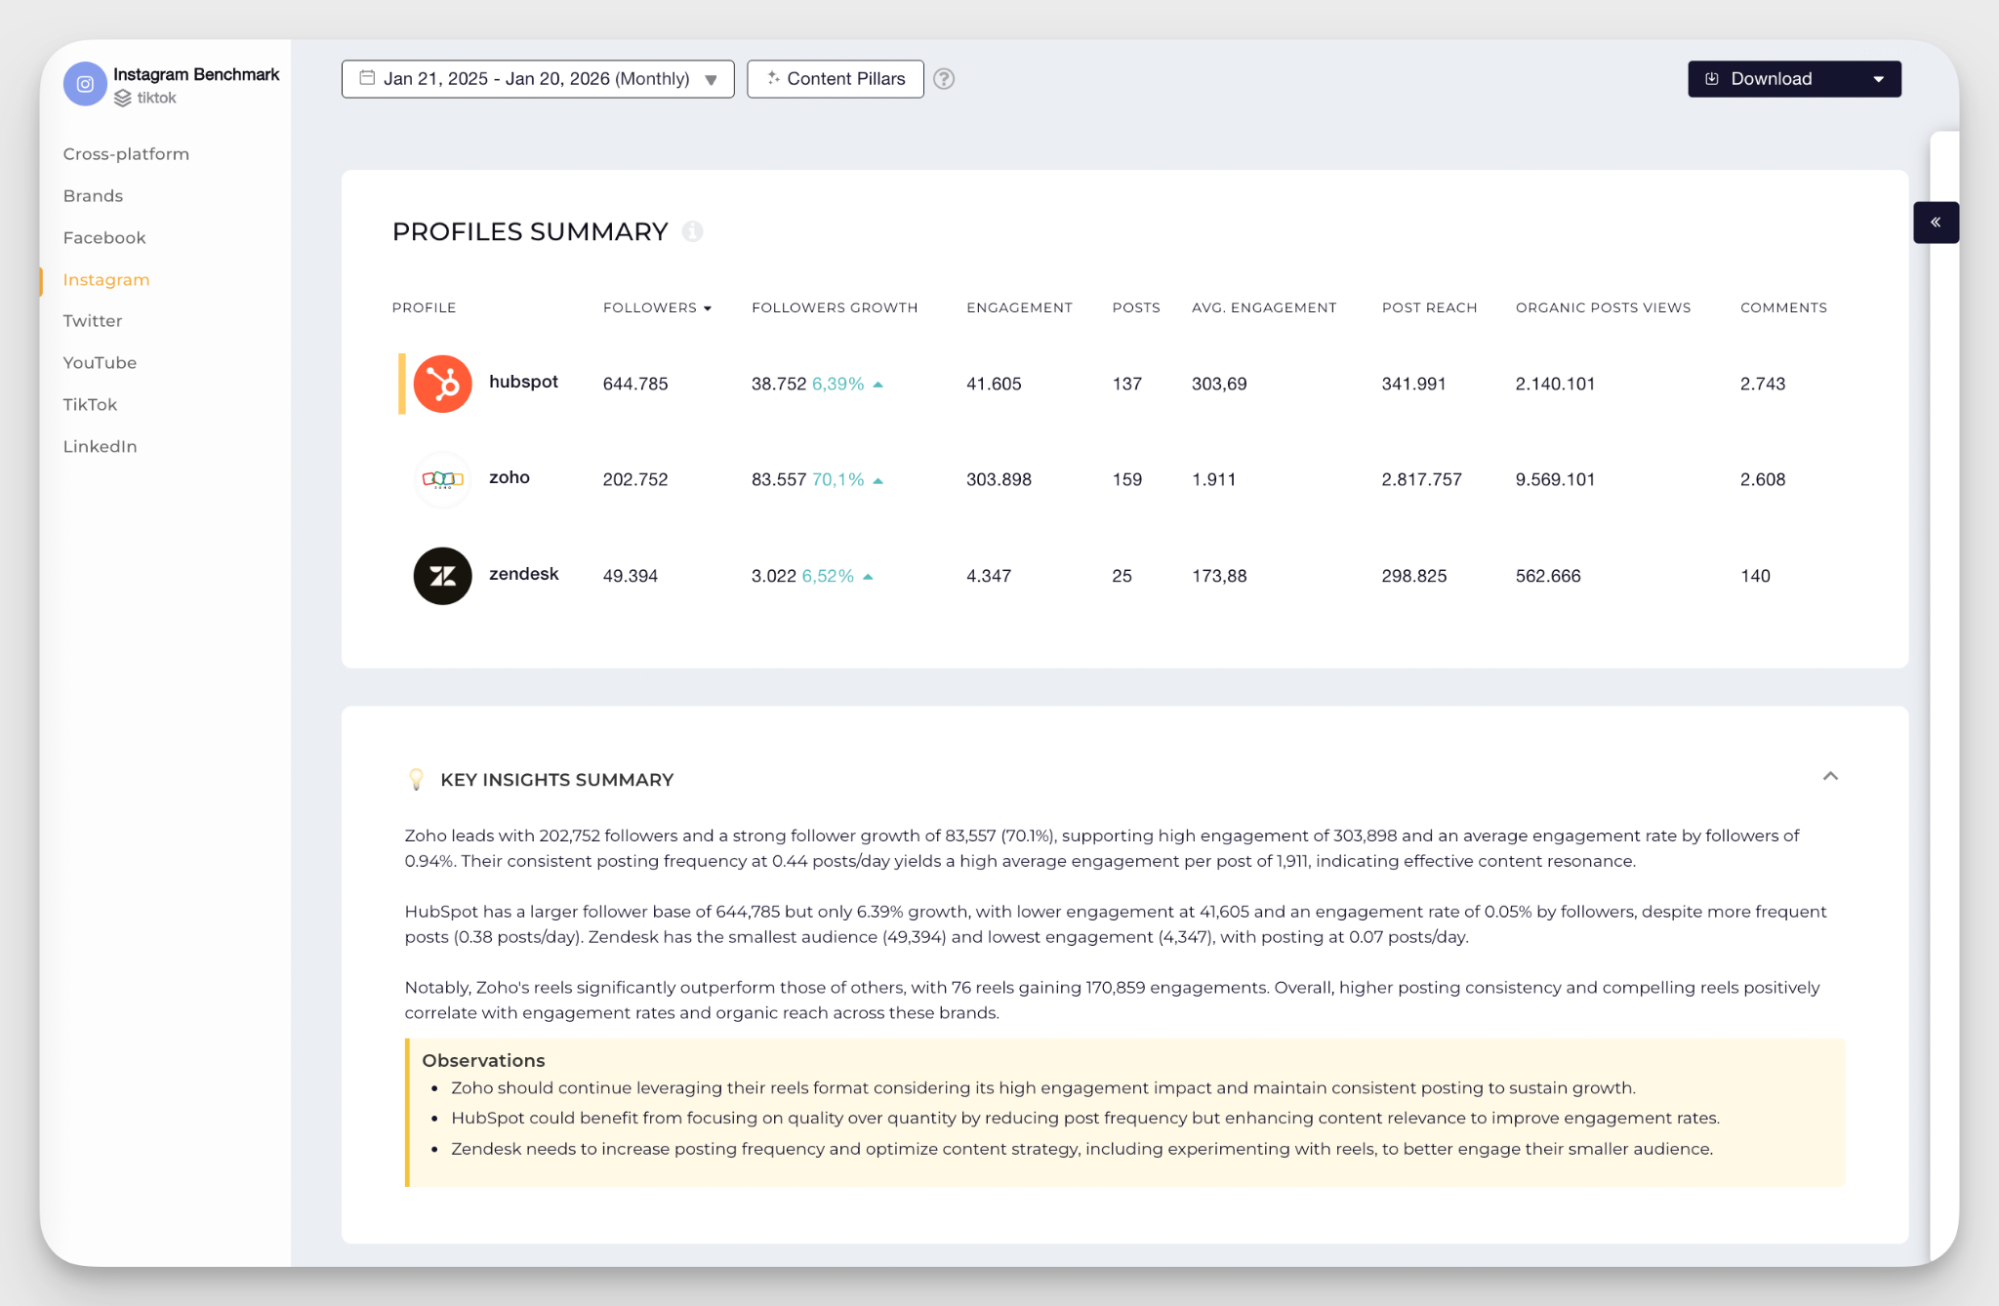
What I find really useful is the combination of a quick overview with deeper comparison layers. You get AI-powered key takeaways for a fast read on the situation, then you can dig into more detailed views like top posts, content pillars, engagement metrics, follower growth, post distribution, and other brand-to-brand comparisons.
It’s a very practical and quick way to understand how brands perform and what that performance looks like in the context of the market.
LinkedIn data
An immediate advantage here is LinkedIn analytics. Rival IQ doesn’t support LinkedIn competitor data, which can be a dealbreaker for B2B brands.
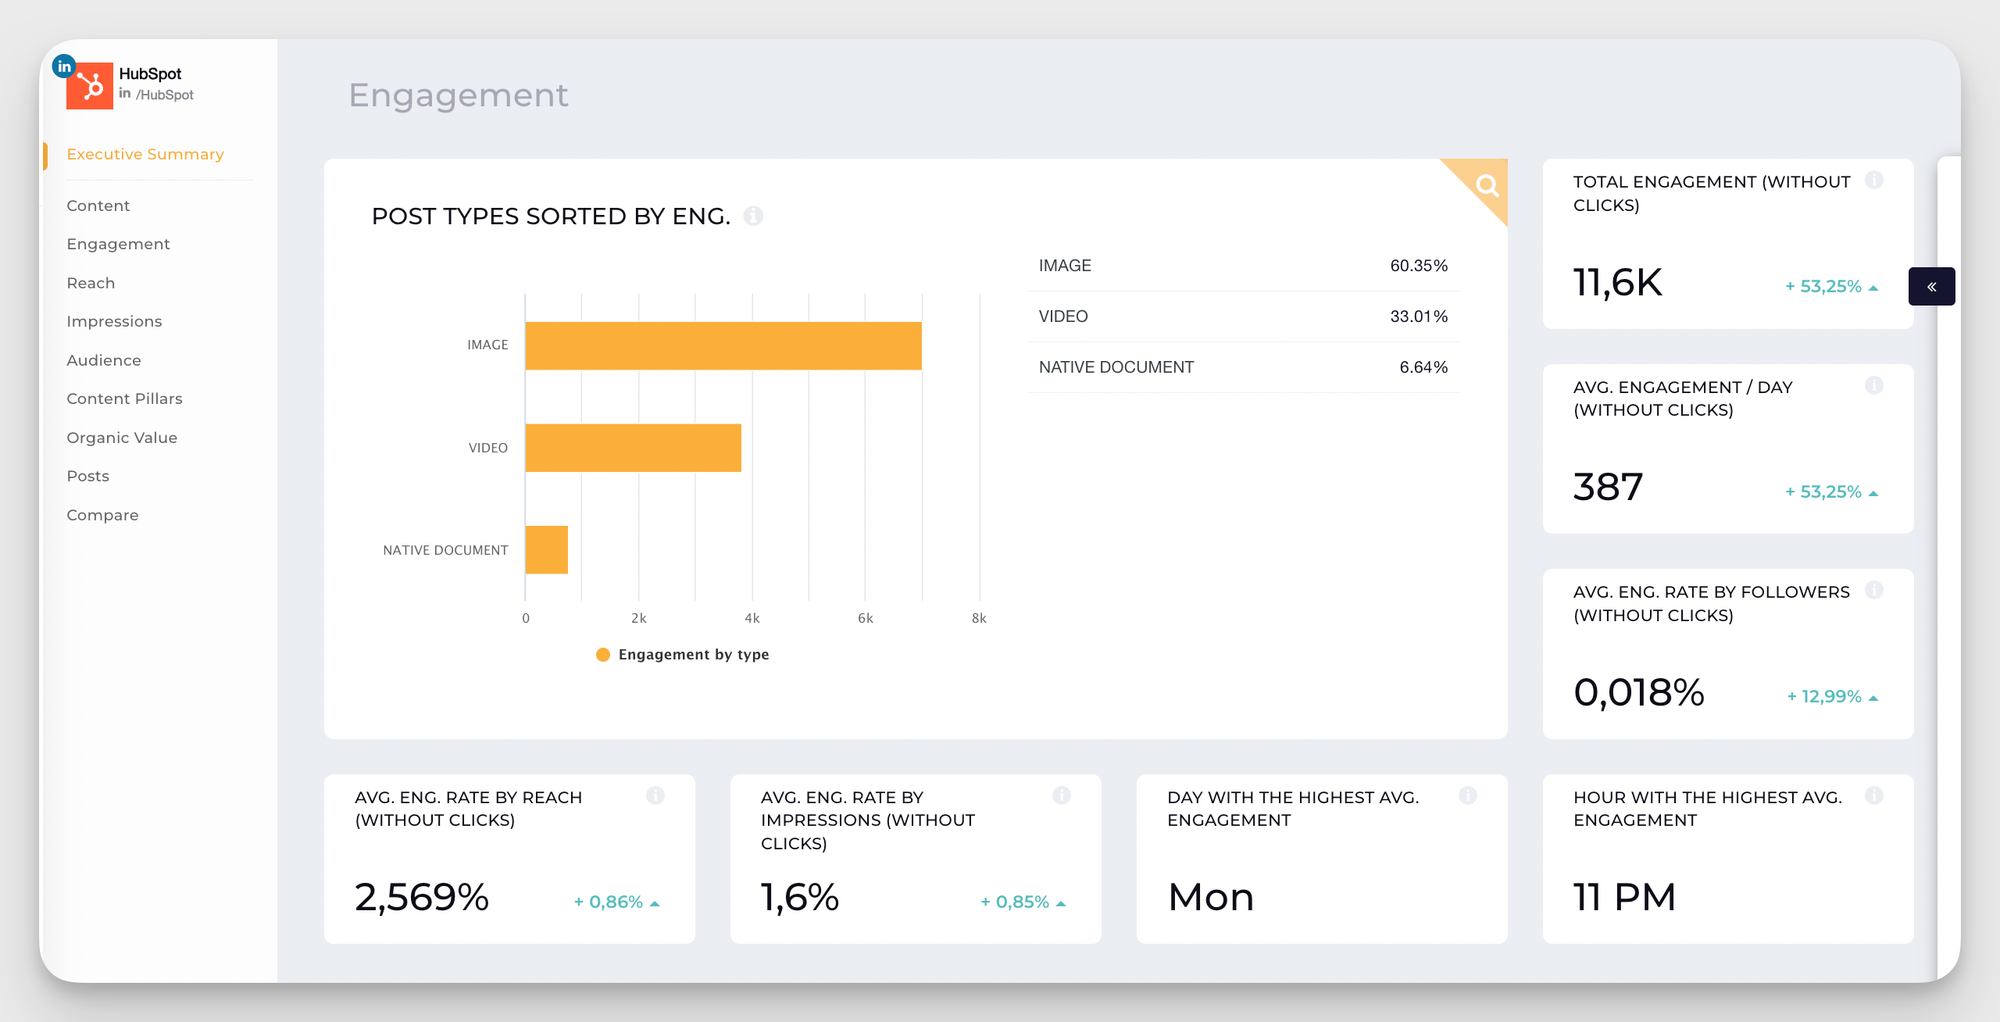
In Socialinsider, LinkedIn data is available at both page and post levels, which gives you much more room to explore performance in detail. You can look at metrics like engagement rate, total interactions, impressions, follower count and growth, engagement by post format, content pillars, and organic value.
This adds a lot more context. For example, my LinkedIn benchmark report says that I saw in the HubSpot has the highest engagement rate. But what does this engagement rate consist of?
I can explore this in a specific LinkedIn page report and dig into their page performance: from a more detailed engagement breakdown to content analysis.
The same logic applies to other platforms in Socialinsider, like TikTok, Instagram, Facebook, YouTube, or X/Twitter.
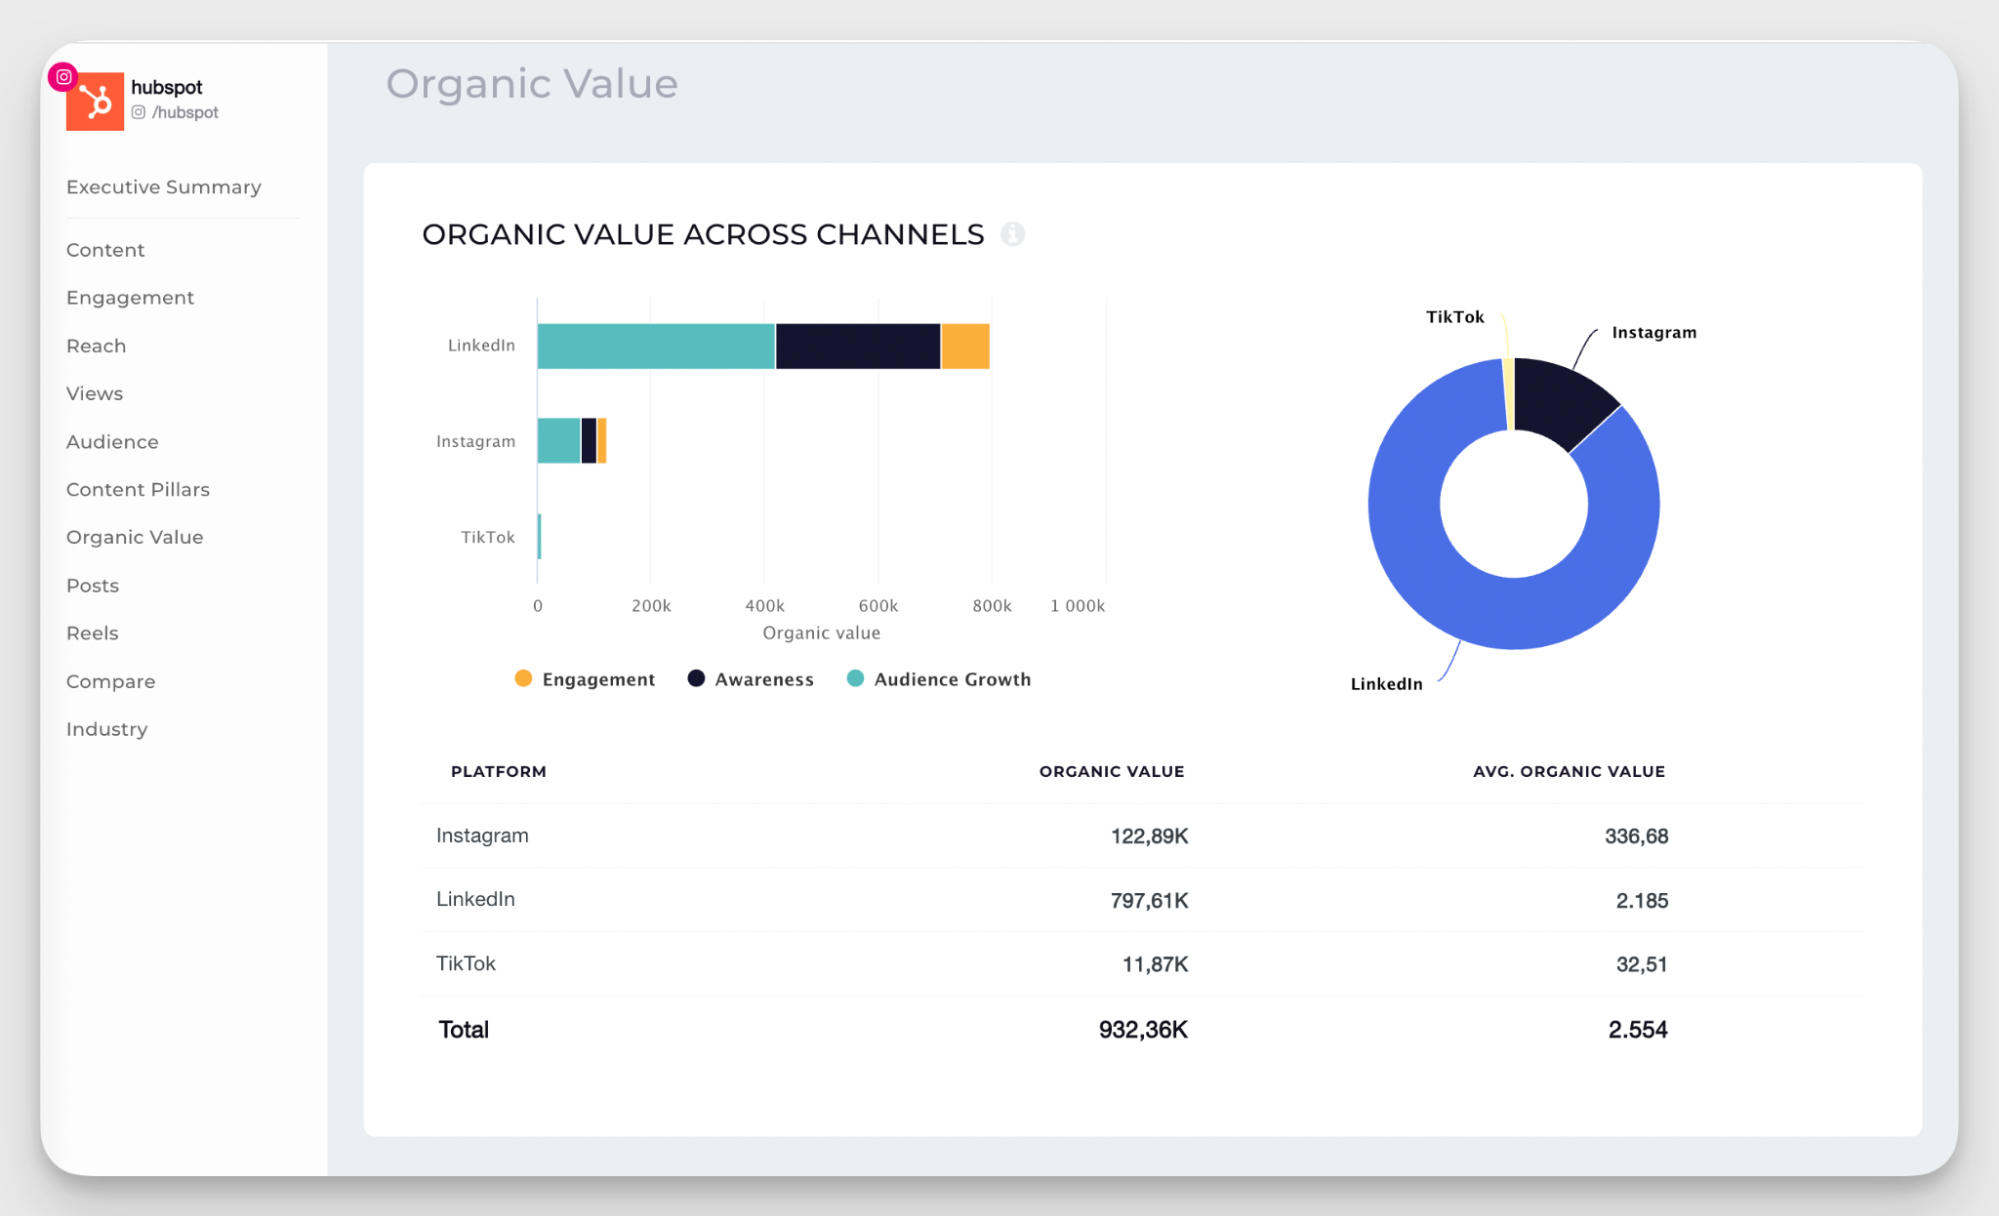
Organic value calculation
This is one of Socialinsider’s more unique features. It estimates how much your organic results would cost if you achieved them through paid ads.
Instead of just tracking engagement or reach, you get a monetary value attached to your performance. That makes it much easier to explain results to stakeholders.
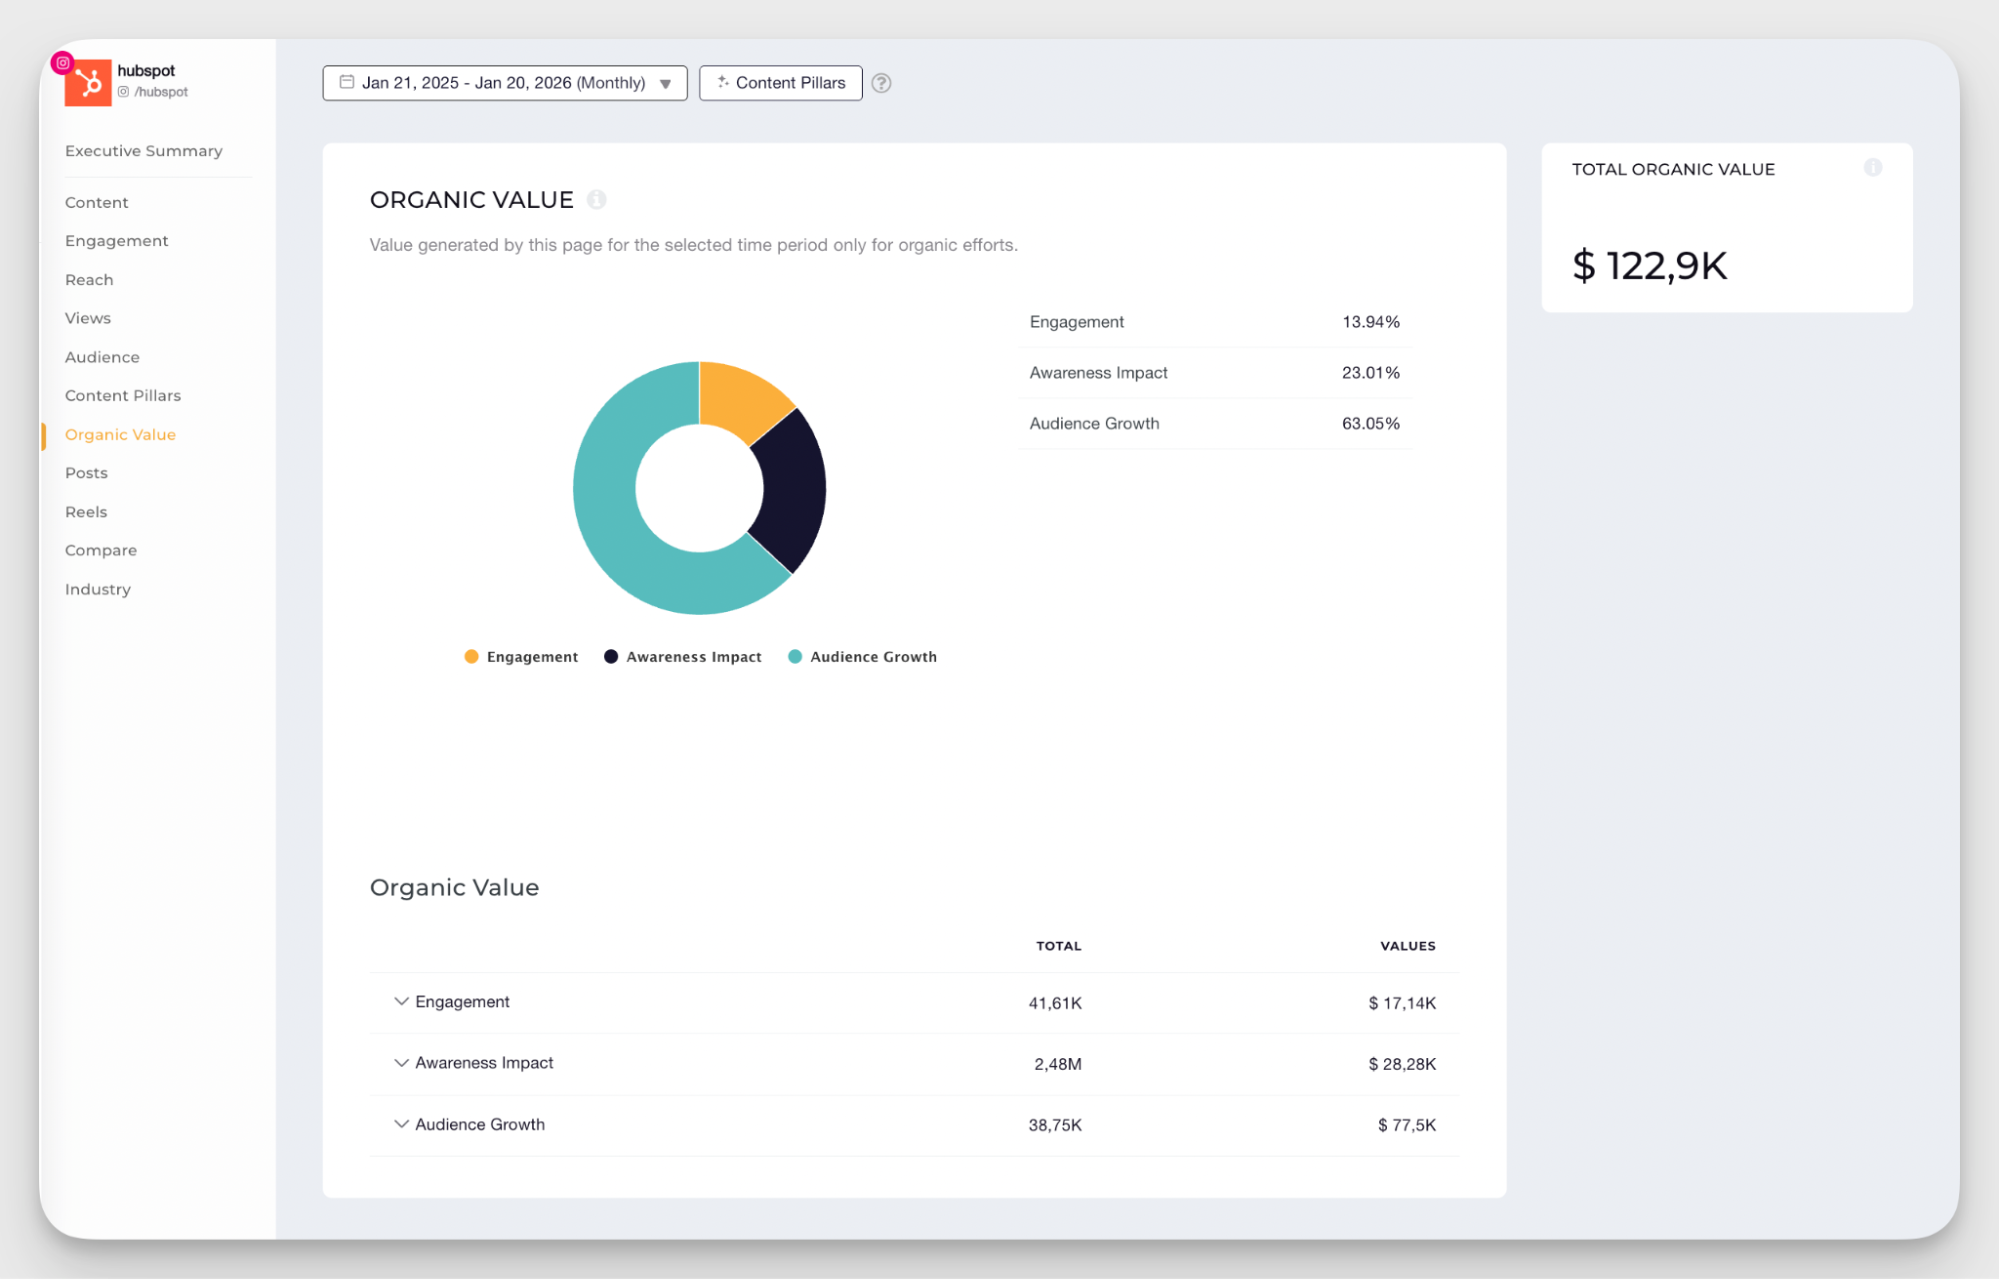
I personally find this very useful, since organic impact is usually hard to quantify. It also works for competitor analysis, helping you estimate how much their presence is worth.
The calculation uses industry benchmarks, but you can customize it with your own data, like cost per click or cost per follower.
Content tagging and categorization
Another layer of analysis in Socialinsider comes from content tagging. This sits somewhere in the middle — not as granular as post-by-post analysis, but not as broad as looking at all content together.
I find this especially useful when analyzing how specific topics or campaigns perform over time.
Socialinsider uses two tagging systems that work together:
- AI-driven industry content pillars (applied automatically)
- Brand pillars (custom tags you create using the Query Builder)
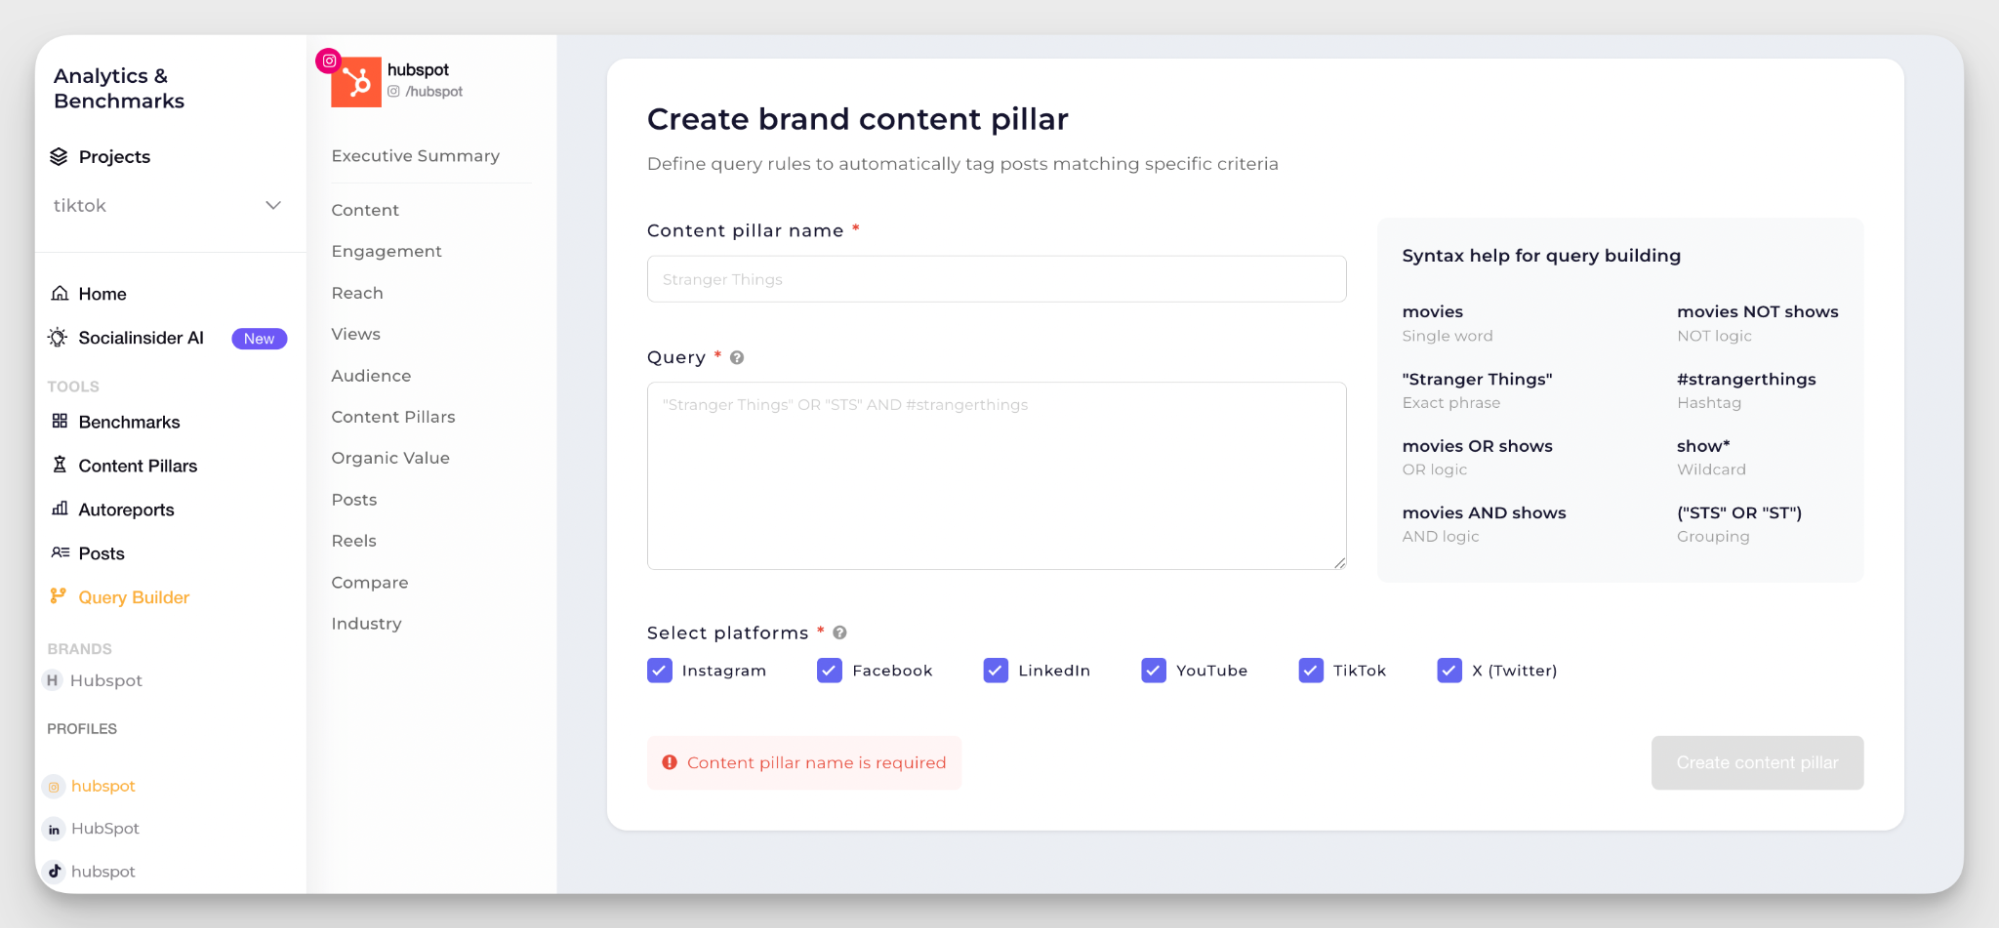
The AI pillars give you a starting point, so you’re not building everything from scratch. Then, custom brand pillars let you refine the system based on your social media strategy, using keywords and combinations.
AI-based industry content pillars
AI-based industry content pillars are the automatic layer of content categorization in Socialinsider. The platform analyzes posts based on industry context, assigns topics to each piece of content, and shows you which ones perform best.
You can analyze these pillars per channel, per brand, or across multiple brands.
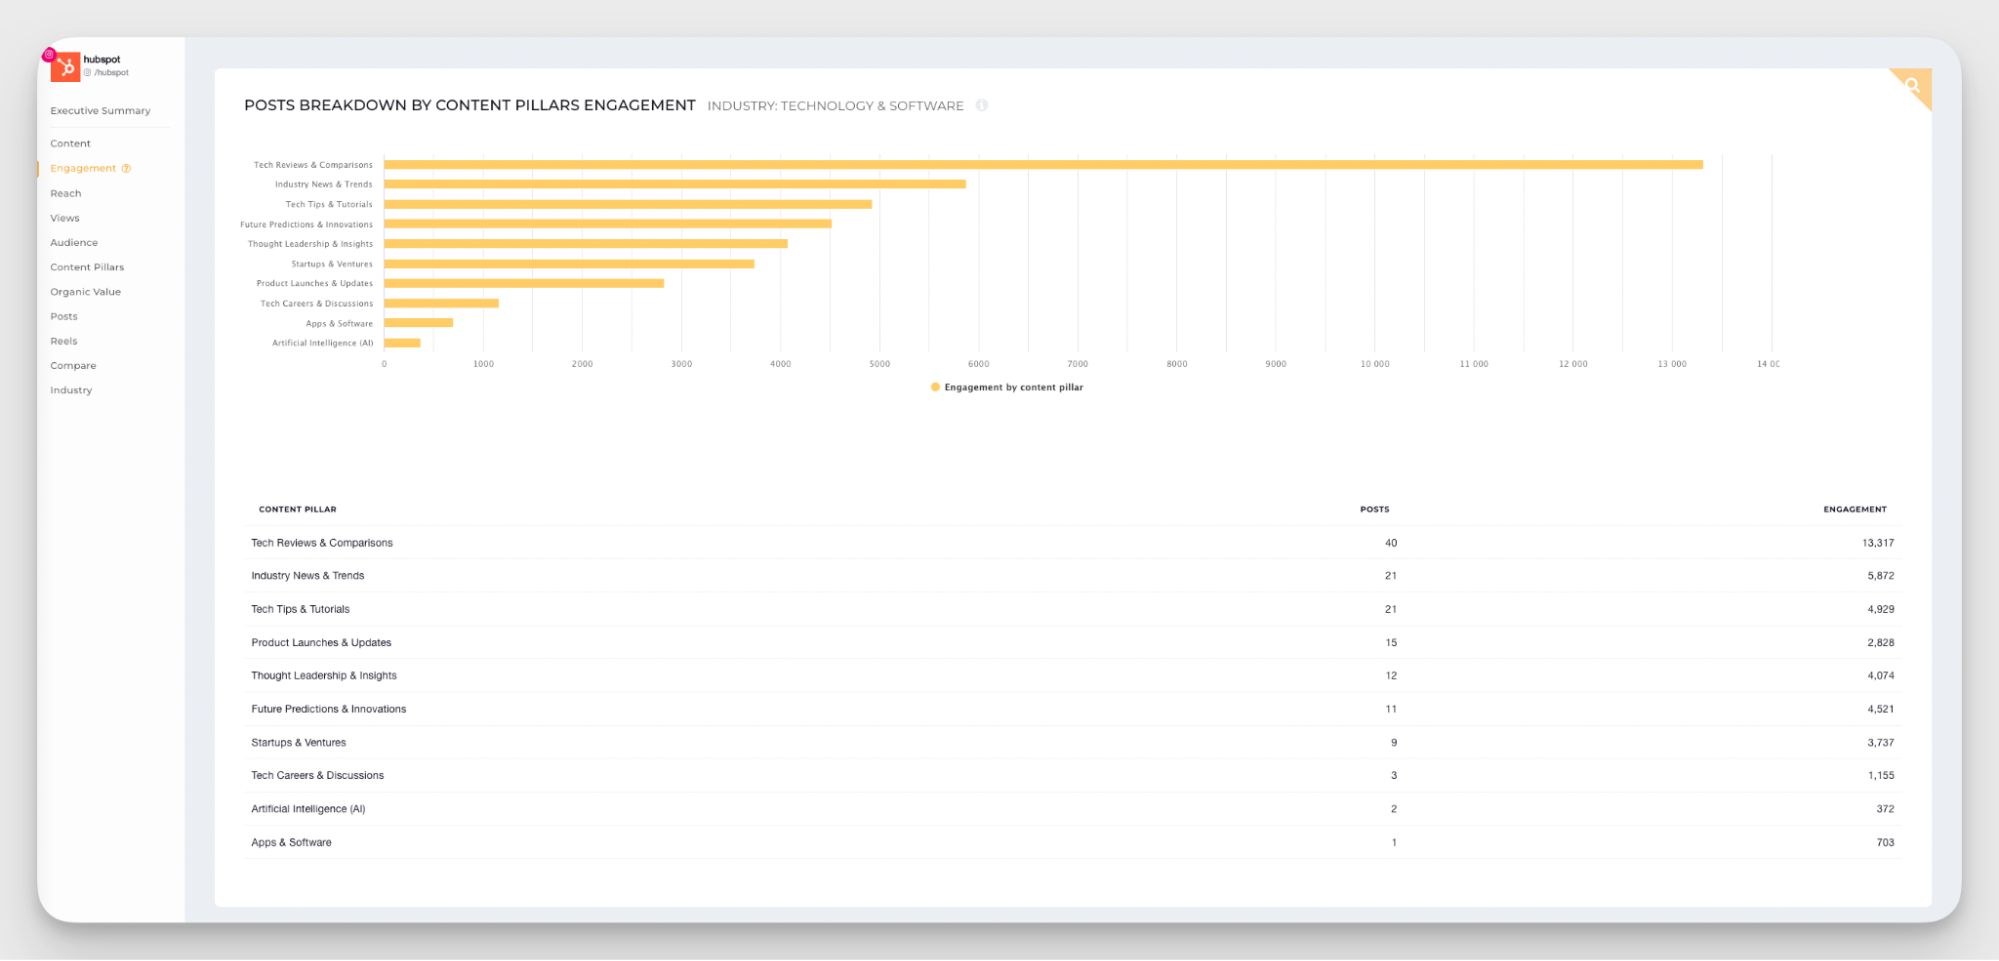
For example, when I looked at HubSpot on Instagram, the top-performing pillars were Tech Reviews & Comparisons, Industry News & Trends, and Tech Tips & Tutorials.
This is very useful for gathering competitor insights in content. Analyzing content pillars helps you spot gaps in your own strategy and fill them in with content that is proven to resonate.
If you want a broader view, the Benchmark section highlights the top 3 content pillars for each brand on a platform, which makes it easy to compare what works across the landscape.
Based on this data, I can say that all but Semrush consistently use Tech Reviews & Comparisons with rather decent engagement. An action point to consider in Q2 content strategy? Perhaps.
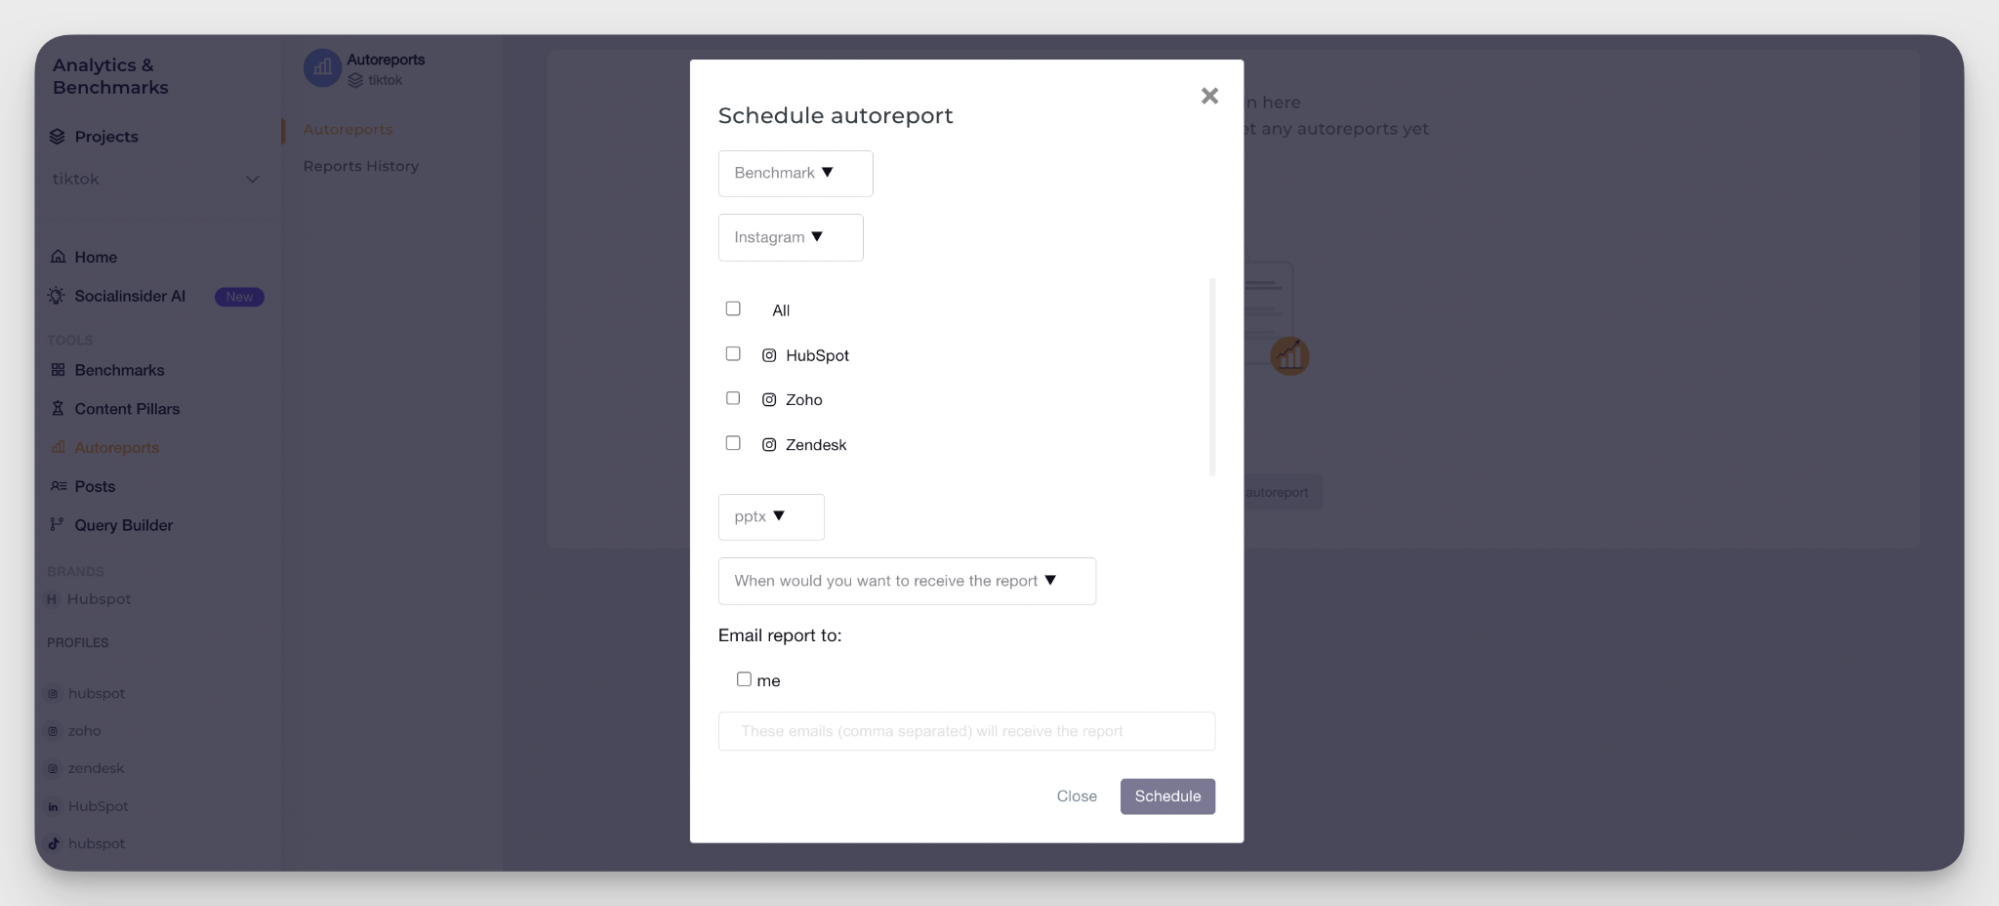
Autoreporting
Socialinsider has flexible autoreporting that you can tailor to your needs. It’s a very practical way to keep everyone aligned.
There are several report types:
- Post reports (post-by-post performance)
- Profile reports (individual account tracking)
- Benchmark reports (side-by-side competitor comparison)
- Brand reports (aggregated cross-platform view)
- Ads reports (paid performance, with Meta integration)
You can schedule reports to be sent automatically to a custom list of recipients every day, week, month, or quarter.
The format is also customizable: choose PDF, PPTX for presentations, or CSV for deeper analysis.
The variety of report types, formats, and time frames is extremely helpful in a data-driven marketing approach. You can always customize the data flow based on your preferences and goals.
Rival IQ’s key social media analytics features
Rival IQ works within something called a landscape — a group of accounts you want to compare. You have your focus company (your brand) and a set of competitors that Rival IQ analyzes alongside it.
You can look at both cross-platform data and channel-specific performance. The data is largely the same.

For this test, I chose Neutrogena as the focus company and added NYX, Rhode Skin, and Rare Beauty as competitors. Here’s what I found.
Overview and leaderboard
When you open the competitive data section, the Overview gives you a quick snapshot of how your brand compares to others in your landscape.
You get:
- A quick look at your performance
- Your top-performing posts
- A comparison across audience, activity, and engagement
In my case, Rival IQ showed that my focus company’s audience growth was below the other three brands.
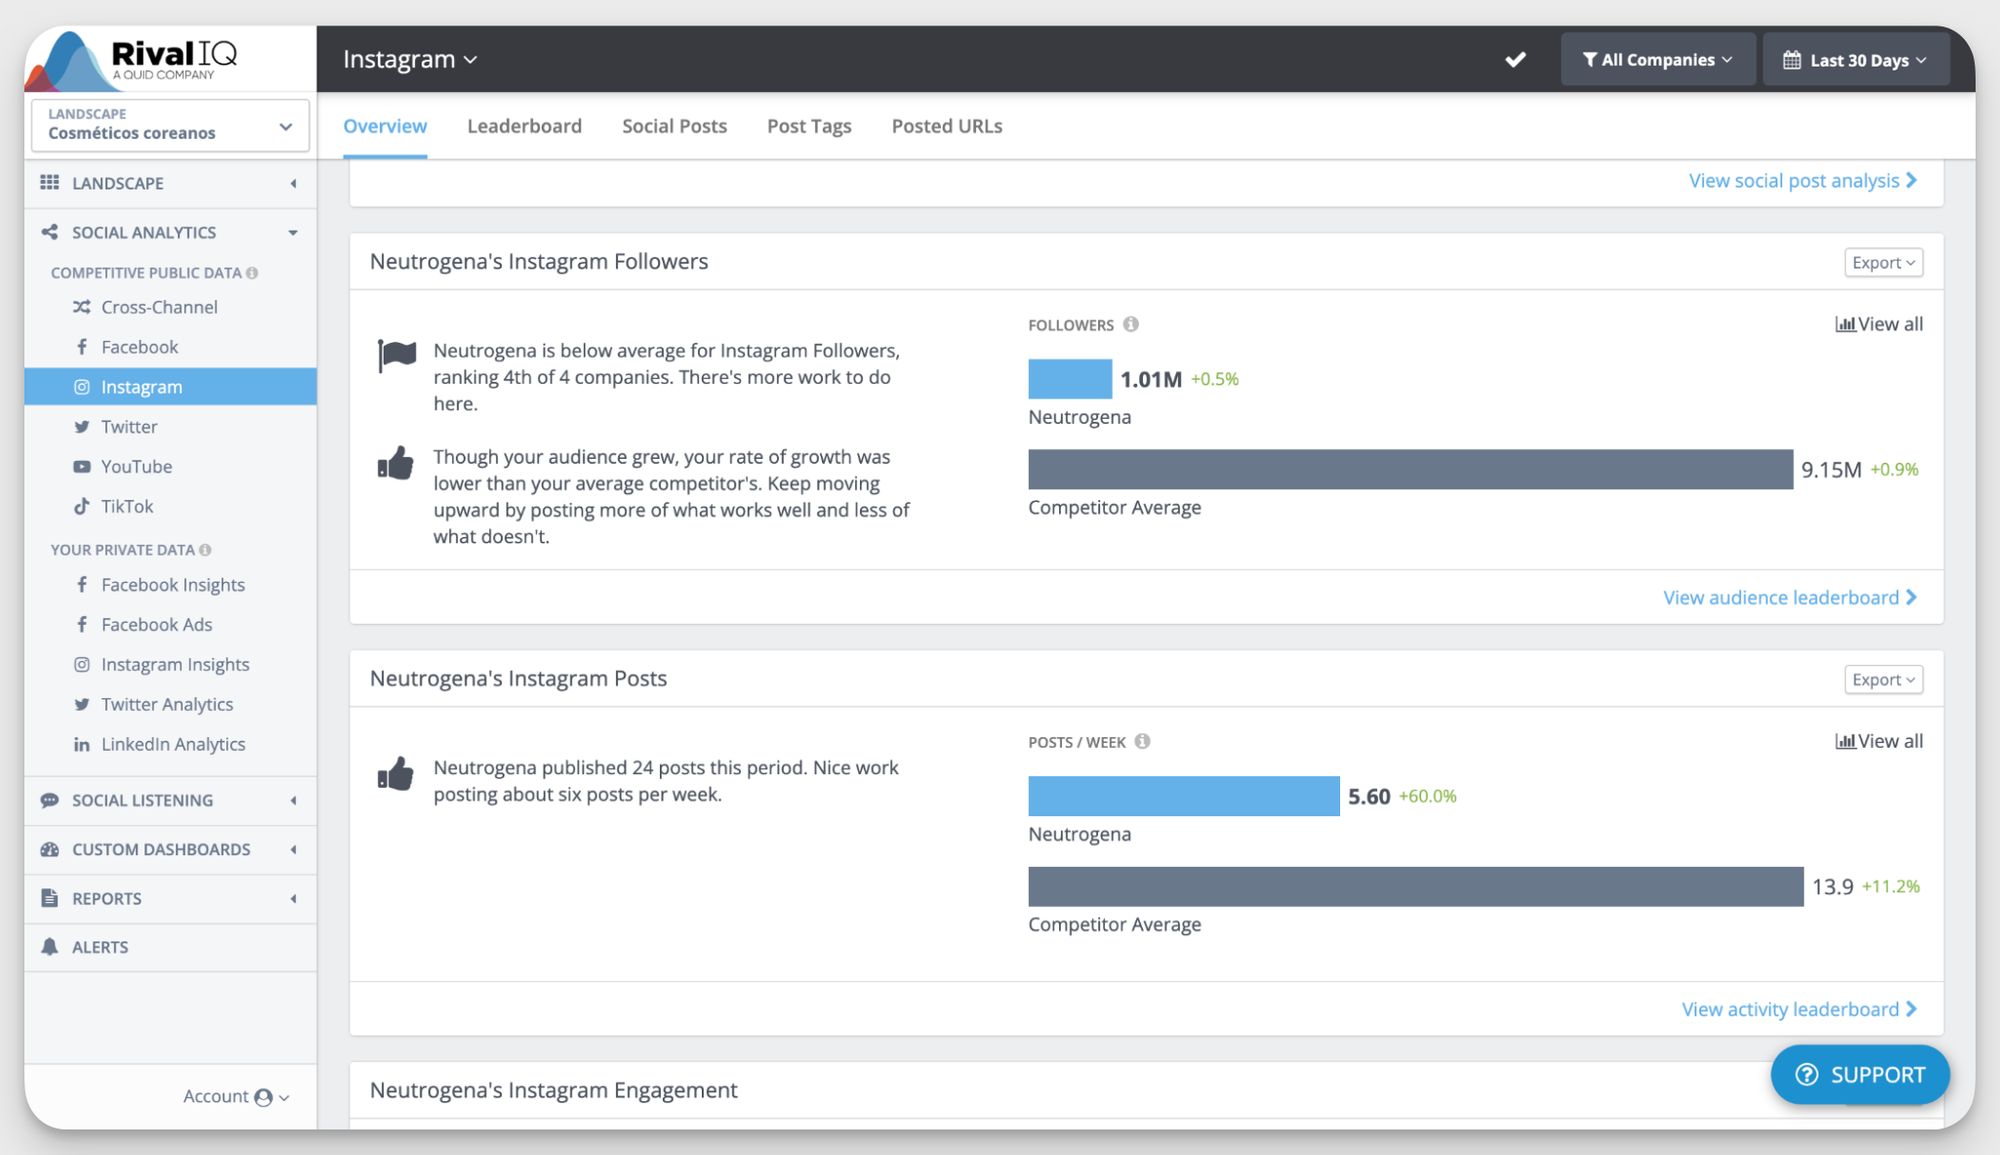
One thing I noticed here: everything is relative to your selected competitors. Personally, I’d prefer to also see industry benchmarks as well, because your competitors might just be outperforming the whole market.
That said, the overview is still rather useful.
If you want more detail, the Leaderboard breaks down metrics like audience growth, activity, and engagement across all brands.
One serious downside I noticed about the competitor analysis in Rival IQ as a whole is the lack of LinkedIn competitor data. For some industries, that’s fine. But for B2B brands, this can be a real limitation.
Content performance analysis
The Social Posts section focuses on post-level performance.
You get a general overview, followed by top posts across your landscape. In my example, Rhode had the strongest results across platforms.
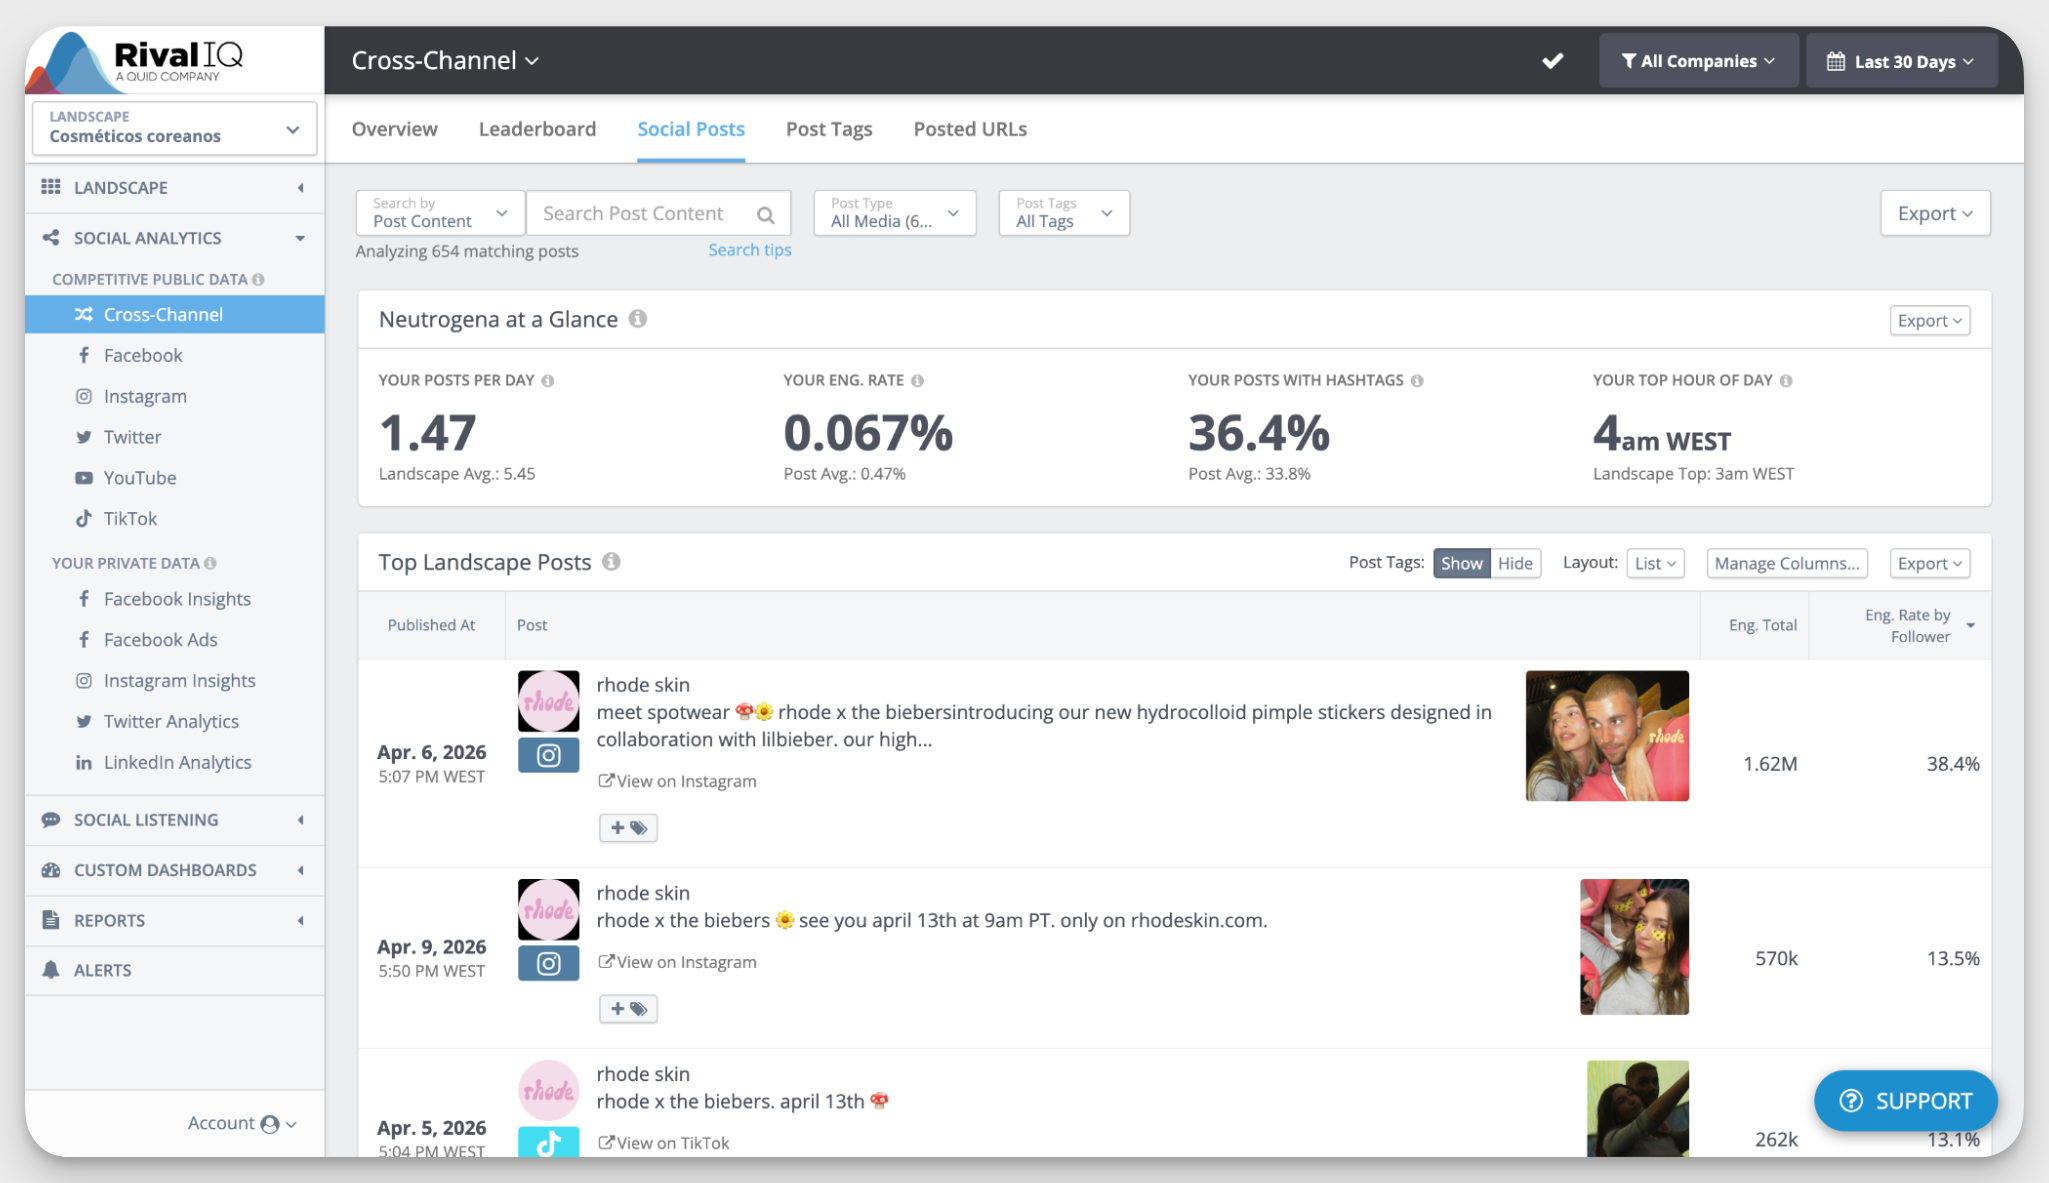
Each post includes total engagements and engagement rate per follower. There’s also a metric called engagement rate lift, which shows how a post performed compared to the average. I found this especially useful for spotting potential rock star posts.
Popular topics
Rival IQ also surfaces hashtags and “popular topics.” These topics are generated using NLP, based on common phrases across posts in your landscape.
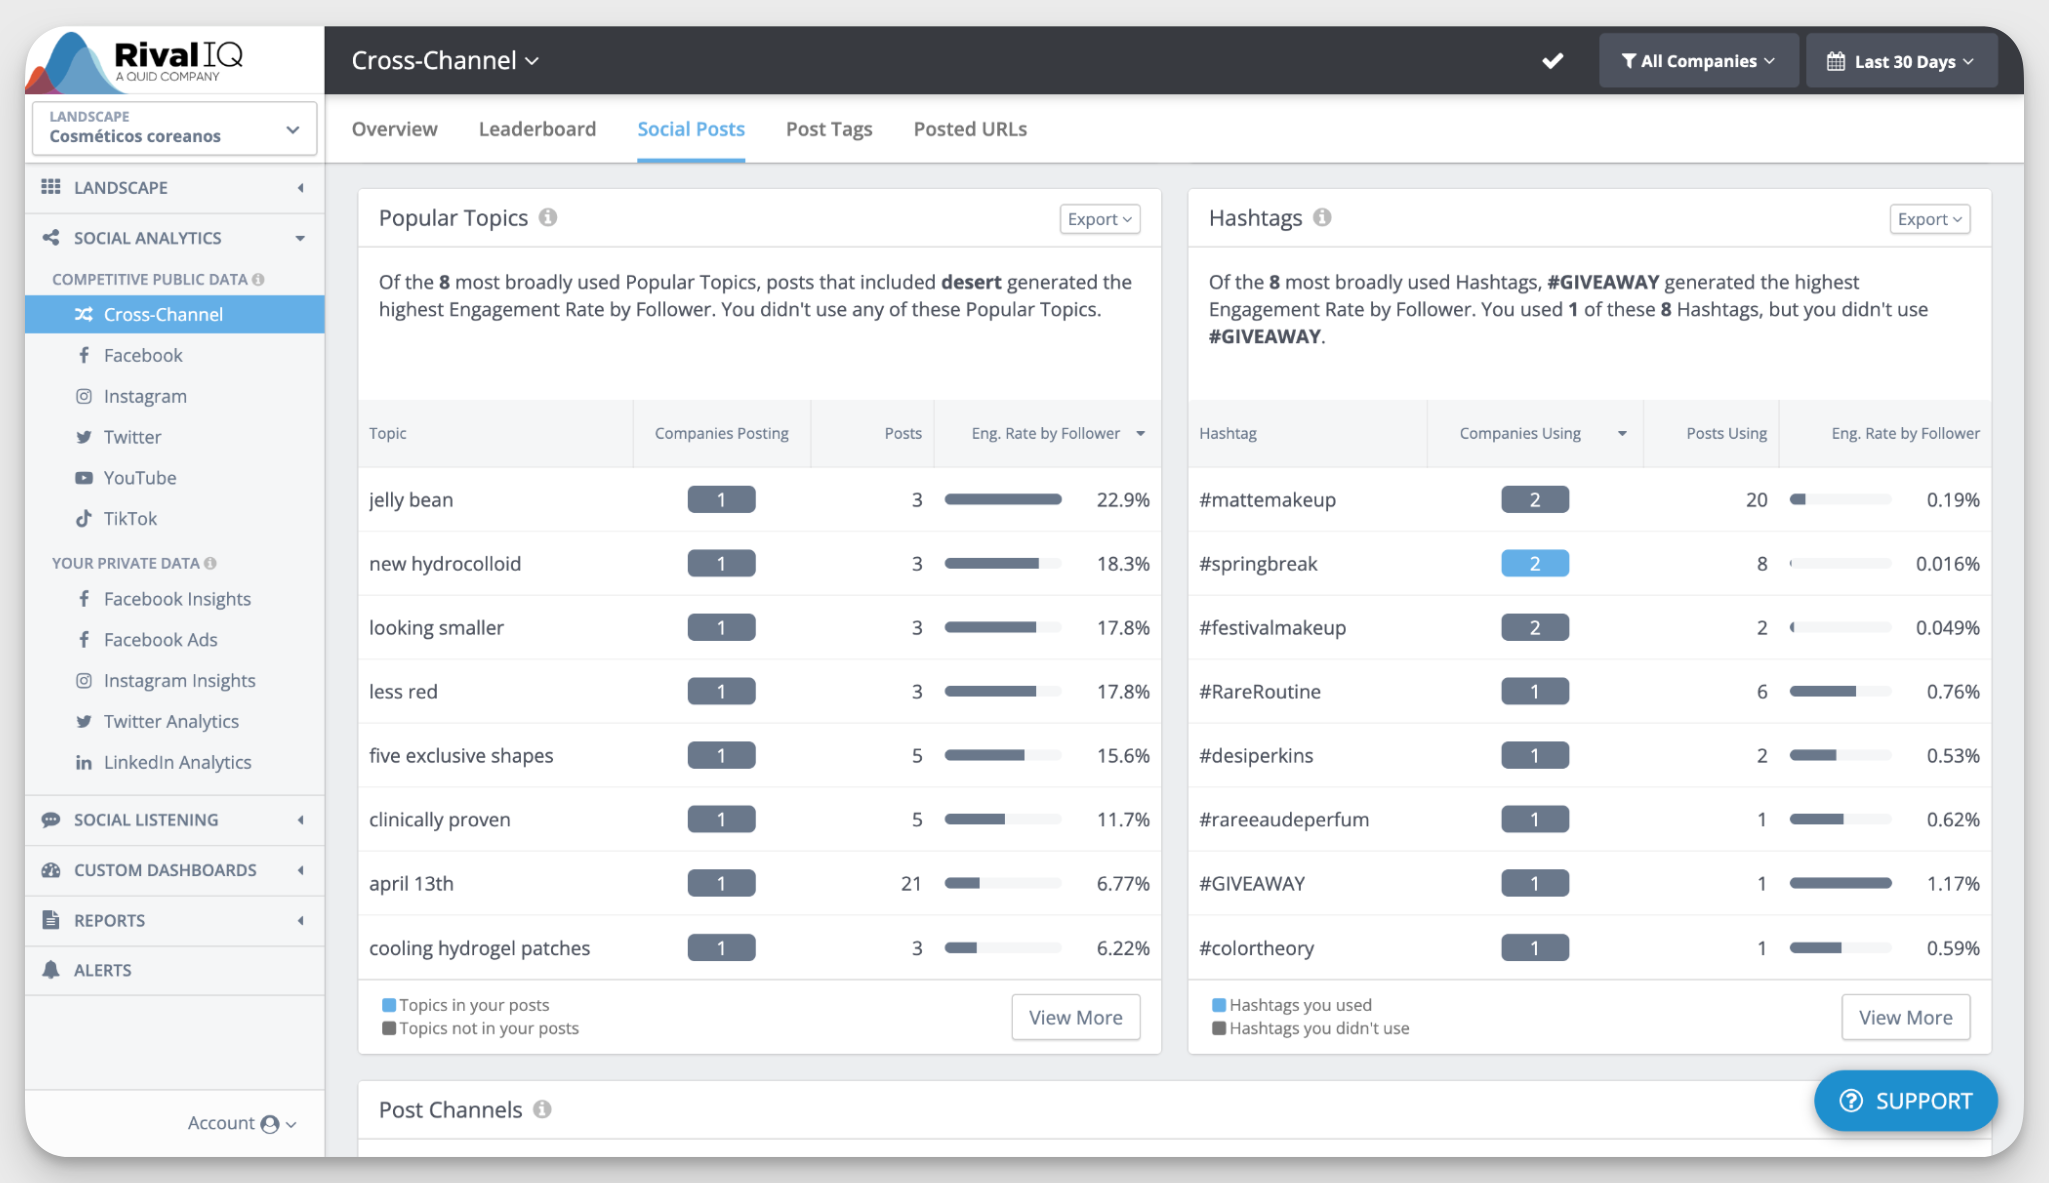
In theory, this helps you spot content gaps. In practice, I found it a bit clunky. The topics often feel too granular or disconnected.
For example, phrases like “jelly bean” or “five exclusive shapes” came up as the most engaging ones, and after checking the posts, I know it’s related to Rhode Skin’s new pimple patches. But it’s hard to figure out what exactly drove interest based on these keywords.
Likely boosted posts
I liked this data point so much that I decided it’s worth a separate paragraph.
In Facebook analysis, Rival IQ flags posts that were likely boosted with paid ads. That gives you context on whether strong performance came from organic reach or paid support.
It’s useful both for understanding your competitors and for setting realistic expectations. The limitation is that this only applies to Facebook.
Post tags
The Post Tags section is meant for content categorization.
Rival IQ automatically assigns tags to posts in your landscape, and you can also create your own tags or set up auto-tagging rules.
But based on my experience, this feature feels a bit wonky. A lot of posts ended up as “all posts” or “untagged,” which doesn’t add much value.
You can improve it by setting up your own tagging system, but that requires manual work. I’d rate this around 2 out of 5 — maybe a 3 if you invest time into configuring it properly.
Reporting
All your data in Rival IQ can be turned into reports.
You can include:
- Competitor analysis (cross-platform or per channel)
- Your own performance (once you connect your accounts)
- Custom dashboards built with selected widgets
Reports can be exported in PDF, PNG, PPT, or CSV formats, and you can schedule them to be sent automatically via email. Pretty neat.
Social listening
I couldn’t fully test this since it’s a paid add-on, but here’s what Rival IQ offers:
- AI-powered instant searches based on keywords related to your tracked brands
- Platform-specific searches (mainly X/Twitter and Instagram) by keyword or hashtag
According to Rival IQ, it’s designed to help you track conversations, spot trends, and monitor brand mentions. But compared to dedicated listening tools, it seems more like a supporting feature than a core strength.
Overall customer experience with Socialinsider vs Rival IQ
I’ve tested both tools, and based on my experience, I’d say the main difference lies in application.
Socialinsider feels more in-depth and tailored to more nitty-gritty data analysis. It gives you more layers to explore, more flexibility in how you analyze data, and more control over how you report it.
Rival IQ, on the other hand, feels lighter. It’s quicker to set up and easier to navigate at first, but the data doesn’t go as deep.
Here’s a quick breakdown of pros and cons:
Now, let’s zoom in on some specific topics.
Ease of onboarding & setup
From my experience, Rival IQ is quicker to get started with. But this simplicity comes with a trade-off. Since Rival IQ is lighter on data, the reports are less detailed. For me, the faster setup didn’t fully make up for the lack of depth.
User feedback reflects a similar mix.
For Socialinsider, users highlight ease of use despite the depth:
- Chris (Axel Springer): “The user interface and just the general UX with it is quite straightforward, which, compared to the complexity of other ones, is much appreciated.”
- Anna (Greentarget): “Socialinsider is really strong on usability. It's super easy to use.”
Rival IQ also gets praise for its interface:
- Cristina M. (Capterra): “One of the main things that I could highlight about this platform is its interface; it is practical, clean, and easy to interpret.”
But not all experiences are smooth:
- Collins K. (Capterra): “For a new user, it is a bit confusing to set up…”
Dashboard customization and accessibility
This is where Socialinsider clearly stands out.
It gives you much more flexibility in how you build dashboards and reports. You can choose exactly which metrics to display and tailor the output to your needs.
I found this especially useful when preparing reports for stakeholders.
Users mention the same:
- Gabriel (Inteligencia Audiencia): “It was easier for me to understand everything. It was very straightforward. The data I really need for the clients is very easy to grab.”
Rival IQ, while easy to use, is more limited here. It works well for standard reporting, but customization options are fairly restricted.
- Grace T. (G2): “The lack of ability to customize it much makes me less excited to use the built-in tables and graphs…”
Customer support & help resources
Support and documentation can make a big difference, especially during setup.
With Socialinsider, users often mention a close relationship with the support team:
- Guilherme (Terra Networks / Telefonica): “We have a very close relationship and talk a lot with Socialinsider’s technical support team.”
It also has a detailed help center with guides, walkthroughs, and screenshots, which makes onboarding smoother.
I didn’t personally test Rival IQ’s support, but user feedback is more mixed. The most recent review mentions slow or inconsistent responses:
- G2 user: “Support is non-existent. Expect to have to reach out multiple times and wait days…”
That said, their help center is quite detailed and can cover most basic needs.
Final thoughts
Both Socialinsider and Rival IQ are solid tools for competitor research and social media analytics. They cover similar ground, but the experience and depth of analysis differ depending on what you need.
At the end of the day, the best way to choose is to test them yourself and see which one fits your workflow. Both have free trials to explore the platforms.
Start with Socialinsider today — free 14 days await!
Elena Cucu
Content & SEO Manager @ Socialinsider with 8 years of experience in marketing. I like to describe myself as a social butterfly with a curious mind, passionate about dancing and psychology.

Know what your competitors do — before your manager asks
Get instant social benchmarks & reports without manual work.