How to Bring Social Media Data into Looker Studio (formerly Google Data Studio)
Learn all about bringing your social media data into Looker Studio with the help of Socialinsider.


If you feel like technology is way ahead of you, then you might not be the only one. You may have some issues with keeping up with everything tech, but there are also so many ways to learn anything you want.
Looker Studio is a good example. Trying to understand how everything works, I started to look for any type of article or tutorial that could introduce me to this world and show me how to create a Looker Studio social media dashboard.
I have gathered all the data needed, all the information from multiple sources, and I put it all together here in order to make the process easier.
The purpose?
To understand how Looker Studio works with social media data, what it does, how to use it, and how Socialinsider can help you with this entire process.
I will walk you through my own journey of learning Looker Studio in hopes that you’ll find some valuable information that could help you out as well.
1. What is Looker Studio?
In a just a few words, it is a data visualization platform.
If you want to have everything in one place, Looker Studio is the answer to your prayers. In other words, it is everything you need to keep up the good work.
This tool that will keep track of everything analytics and more. If you’re familiar with Google Sheets, then you might find this one easy to use. Or, at least, find the workflow to be pretty similar.
2. Benefits of using Looker Studio for social media reporting
As we said before, this tool turns the data you need into easy-to-understand dashboards and reports.
Well, first of all, I shall assume that you work with a lot of data. That would explain your interest in learning more about Looker Studio.
So, dear data geeks, be prepared to have an easier life with this platform. What’s the deal?
There are a few exciting things about Looker Studio that you should know about:
-
Free tool
The first best thing about Looker Studio is that the tool is 100% free, and it is available for anyone.
Just like any other Google feature, you can use it without any cost. You just need internet access, that’s all.
-
Everything is customizable
Looker Studio allows you to create custom reports, and it gives you a variety of designs, styles, and so on. There is actually an entire report gallery where you can find reports created by the community.
And there are many templates that you can choose from.
What can you customize:
- Page layout
- Text
- Graphs
- Metrics
- Style elements
-
Interactive platform
What’s great about Looker Studio is that you don’t have to be very technical about it, and you don’t need to be good at graphic design.
With just a few clicks, you can create a fantastic dashboard that will be appealing and easy to read.
Google thought about the recipient of the report, giving him the ability to play around a bit. The viewer can:
- Control the date range
- Set different filters
- Sort by different metrics
- Select optional metrics
- Dig into data
-
Automated reports
Any type of manual work can be really time-consuming. Google knows that time is everything, so it gives you access to more features.
You can create fully automated reporting dashboards with real-time data. This will definitely save you a lot of time.
-
Shareable dashboards
Looker Studio encourages collaboration among people. This means that you can choose between the viewer or editor access and share your reports with your colleagues.
You can share them via link or email.
-
Filters
The filters will let you adjust your data based on any dimension or metric. Here are some examples:
- Date range
- Account
- Campaign
- Location
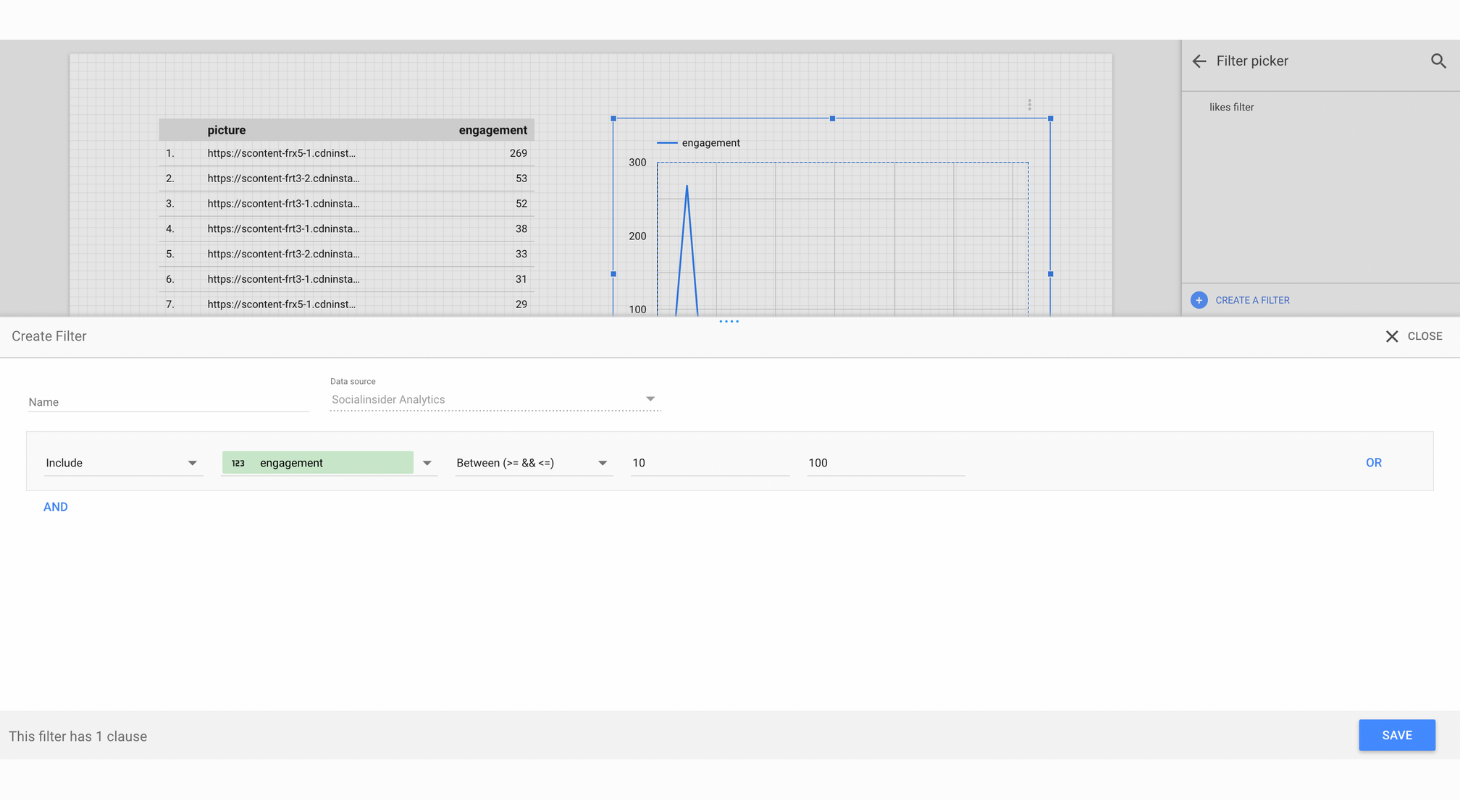
You can apply the filters to your reports, and they can also include conditions such as and/or to go beyond the normal social media data.
-
Exporting options
I personally love the freedom of choosing how to export the report I want.
Looker Studio gives you the following exporting options:
- Excel
- Google Sheets
People have their own preferences, so the more options, the merrier. You can also schedule automated email exports if you want to.
-
Looker Studio connectors
One of the best things about Looker Studio is that you can connect to a variety of data sources: Google Analytics, Google Ads, Google Search Console, Google Sheets, SEO performance, Ads spend, mentions, etc.) all in just one dashboard.
More than that, you can also blend data from different sources to create the dashboard you want.
Accessing all the data you need at once will save you a lot of time and energy. And this is amazing.
3. Build a Looker Studio social media report
So now that we’ve gone through the basics, let’s see how to create Looker Studio social media dashboard from scratch.
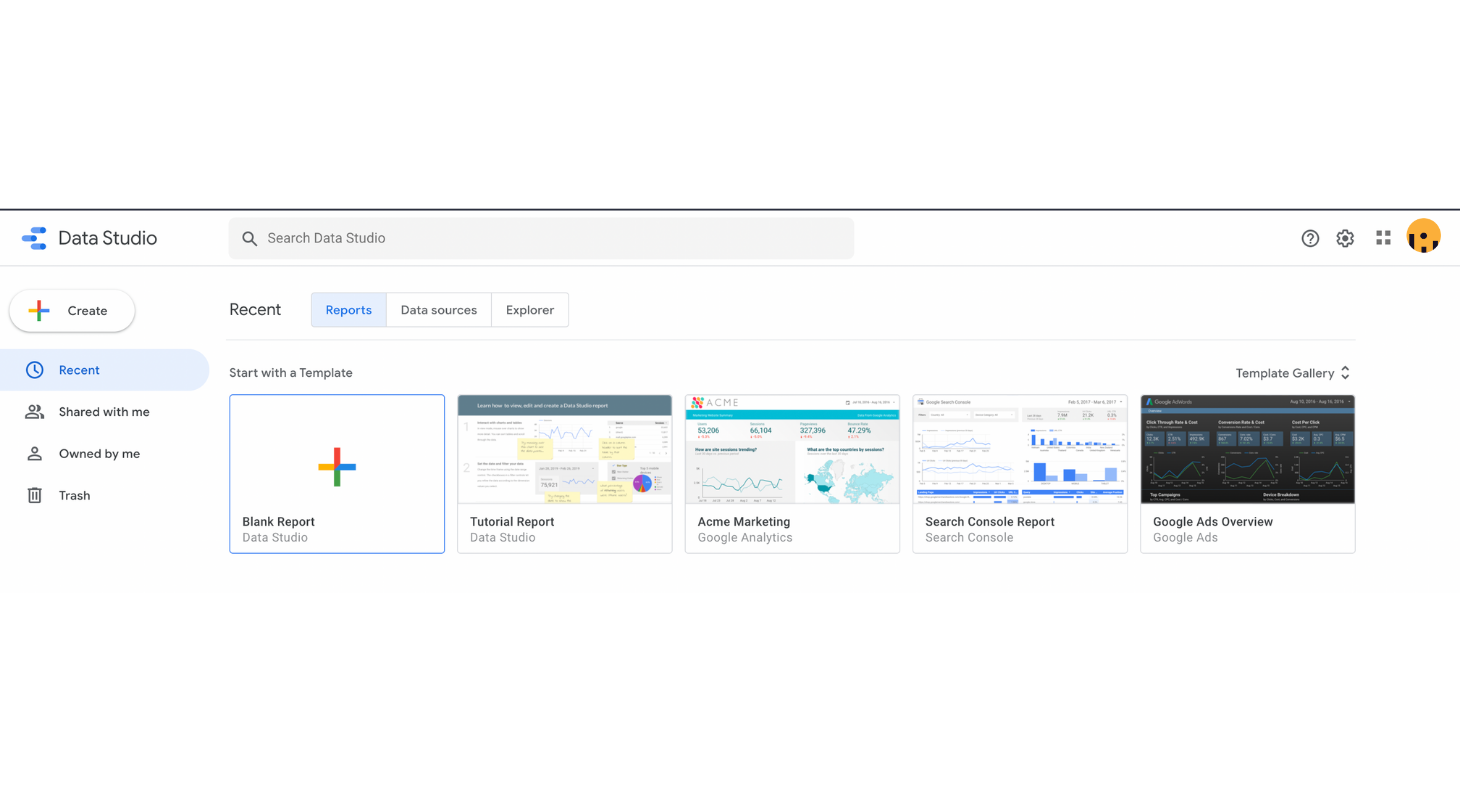
As you saw before, you can use any template you want, but if you want to build it yourself there are a few elements you should be familiar with. Take a look at some of the existing templates to make an idea how it works.
When building a social media report from scratch, I strongly recommend you explore the platform a bit first. Play around with the features and see what you can like and what you don’t.
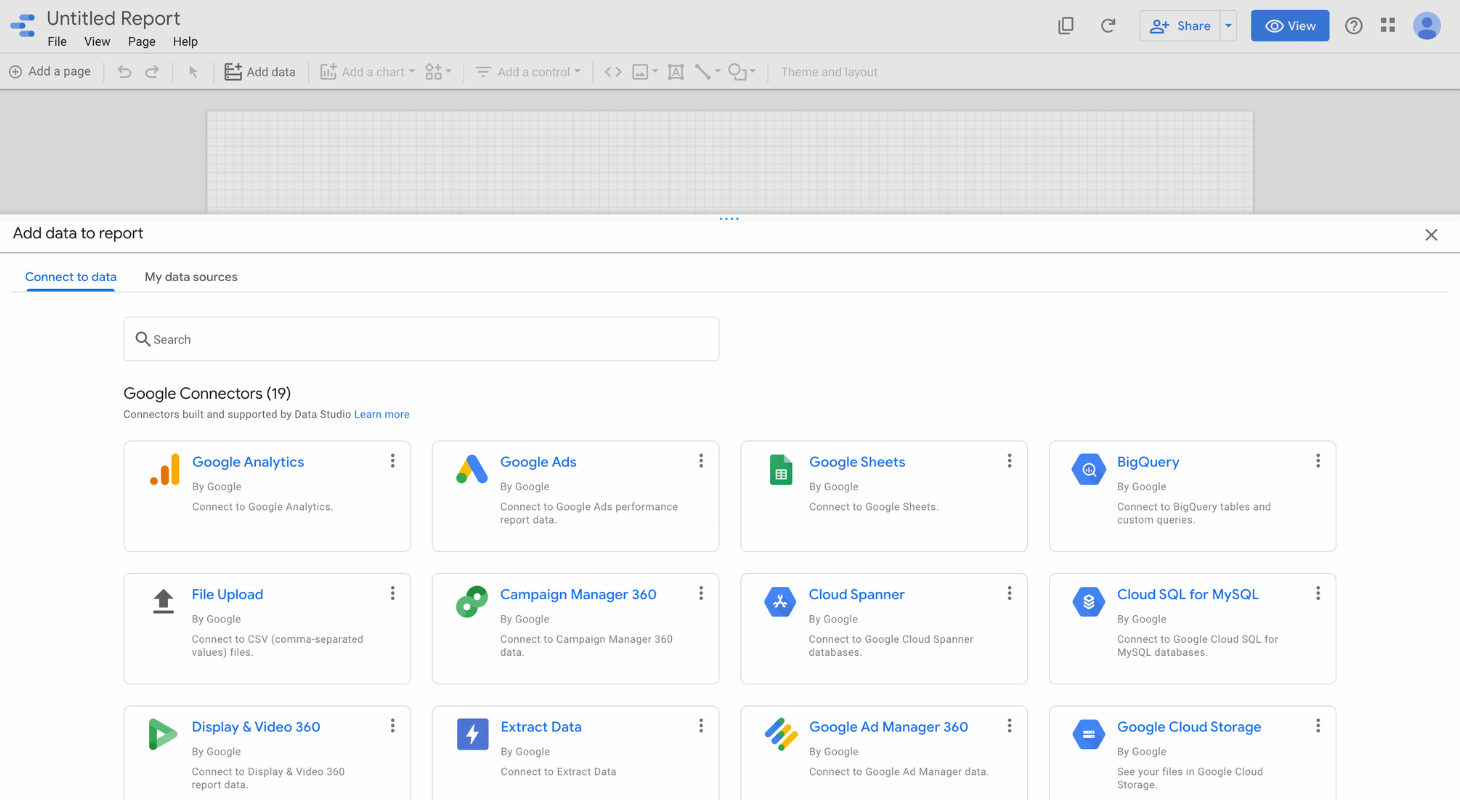
Now, click on Blank Report. Looker Studio then asks you where to get the data from.
I chose Socialinsider Analytics because there is the place where I pull all my social media data from.
Just go to the search bar and look after it.
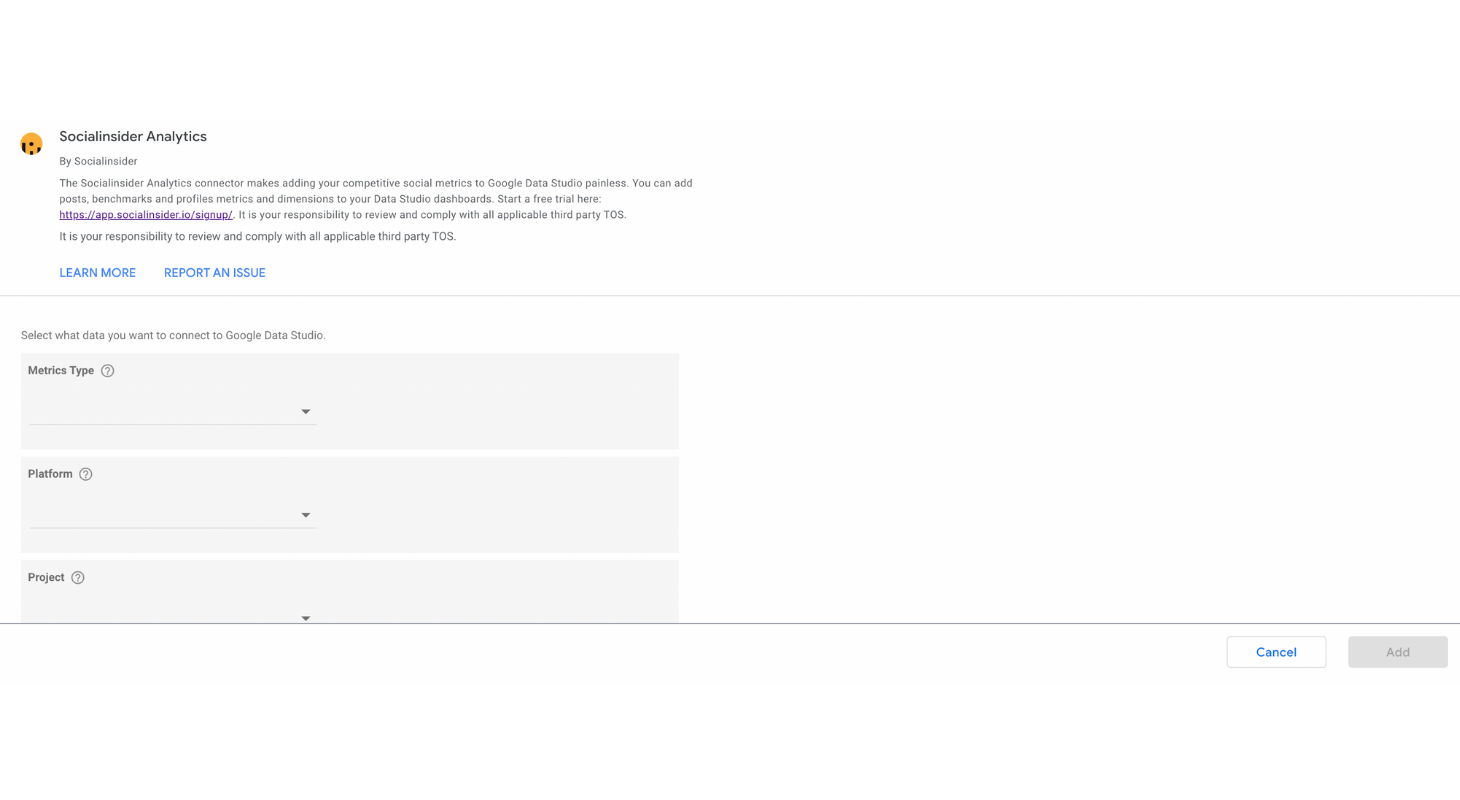
After that, Google asks you to select what data you need to connect to Looker Studio. There are three drop-down buttons: metrics type, platform, and project.
This step gives you the option to add social media data to Looker Studio.
Decide on whatever option you need, and then a new report is created. Give your project a name, and feel free to play around.
You can click on Add Page if you want a report with more than one page. By clicking on Add Data, you can connect your data through different connectors in order to mix things up a bit.
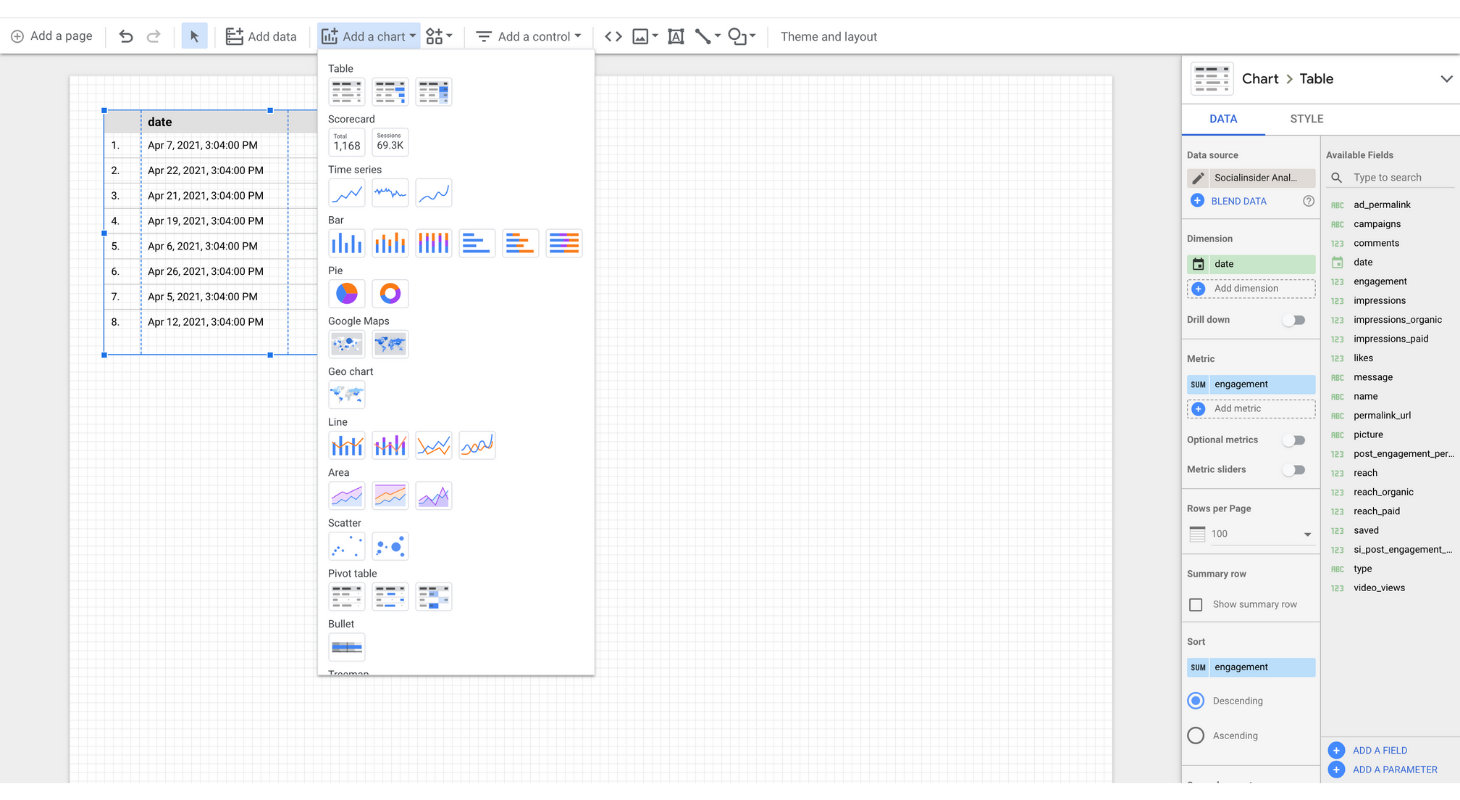
You can also add a new chart. From tables, bars, pie charts to maps and geo charts, you will never get bored.
For example, I added a new chart (time series) that shows me the engagement, impressions, and reach for the last 28 days. What’s really interesting is that you can also compare your social media data with the results from another period of time of your choice.
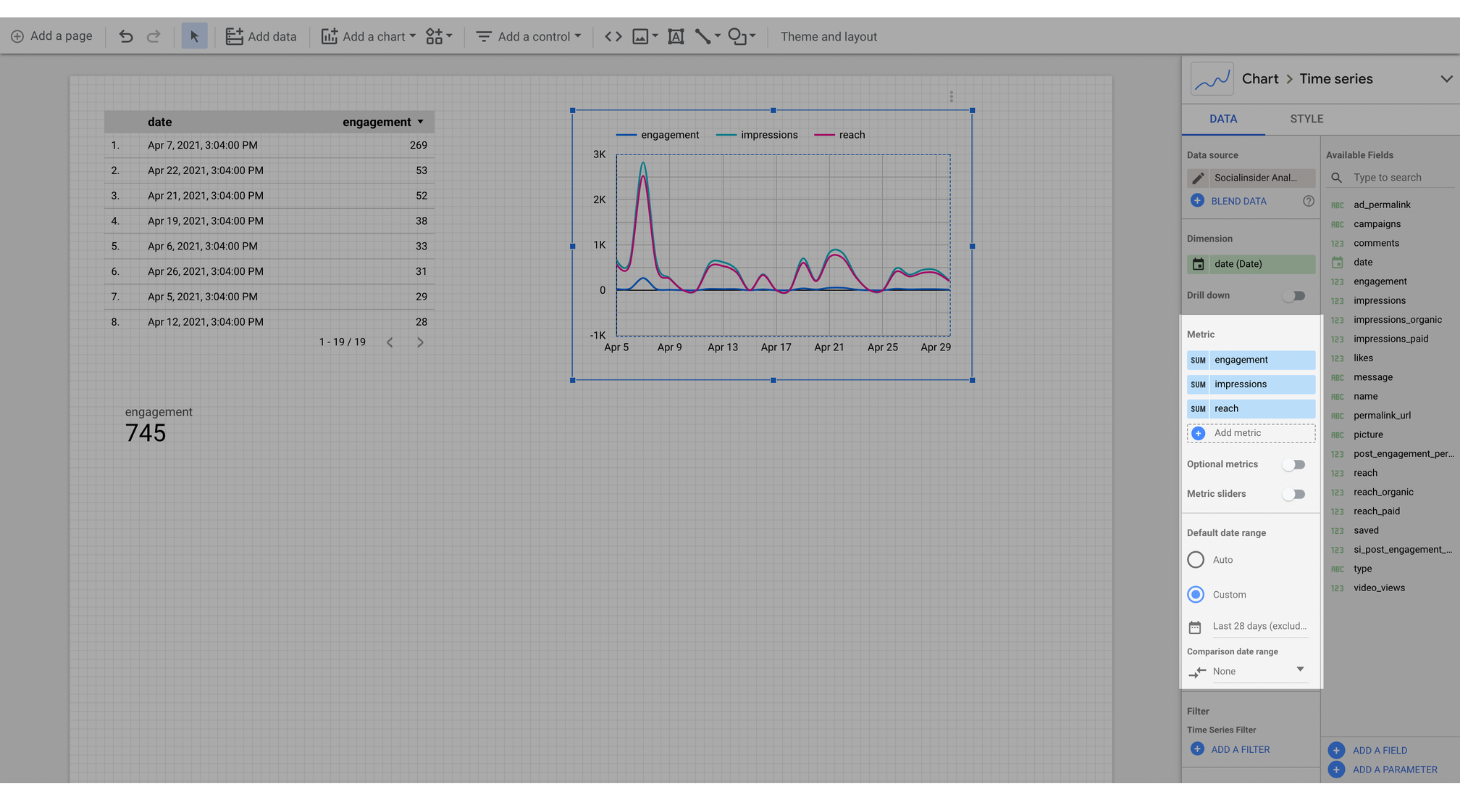
If you want to see data like user counts or numbers, click on one of the Scorecard options.
On the right side, you will see two sections: Data and Style. Data will tell you where the element is getting its data from, while the Style section is the place where you can change the color and edit fonts to make everything look as close as you imagined it.
Let’s take a look at how you can change the style of your charts. Go to Style and explore that section a bit. As you can see, I chose to show you the before and after of the same chart.
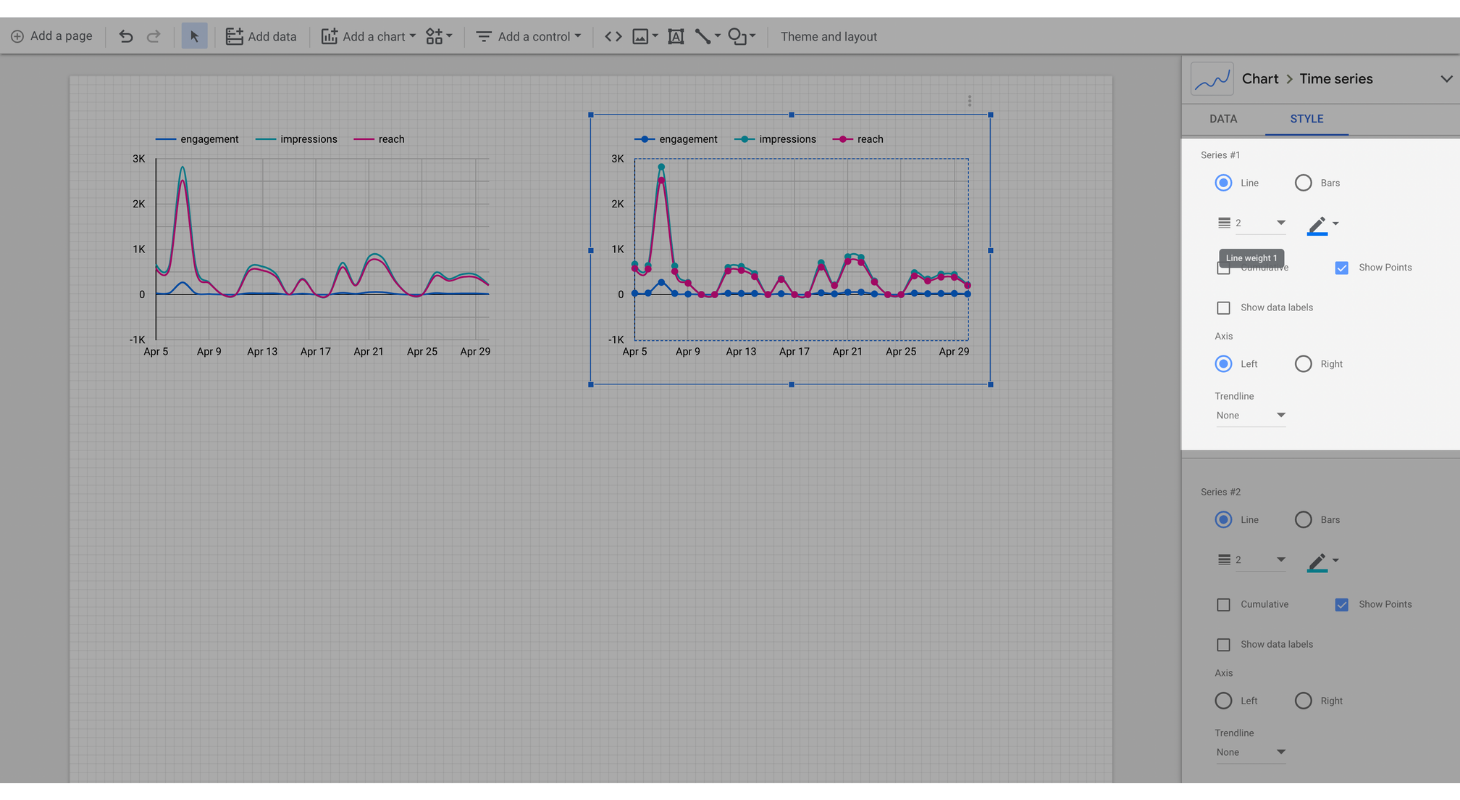
Series #1, Series #2, Series #3 are the equivalent to the social media data: engagement, impressions, reach. These are shown as bars here because that’s what I selected for each of them.
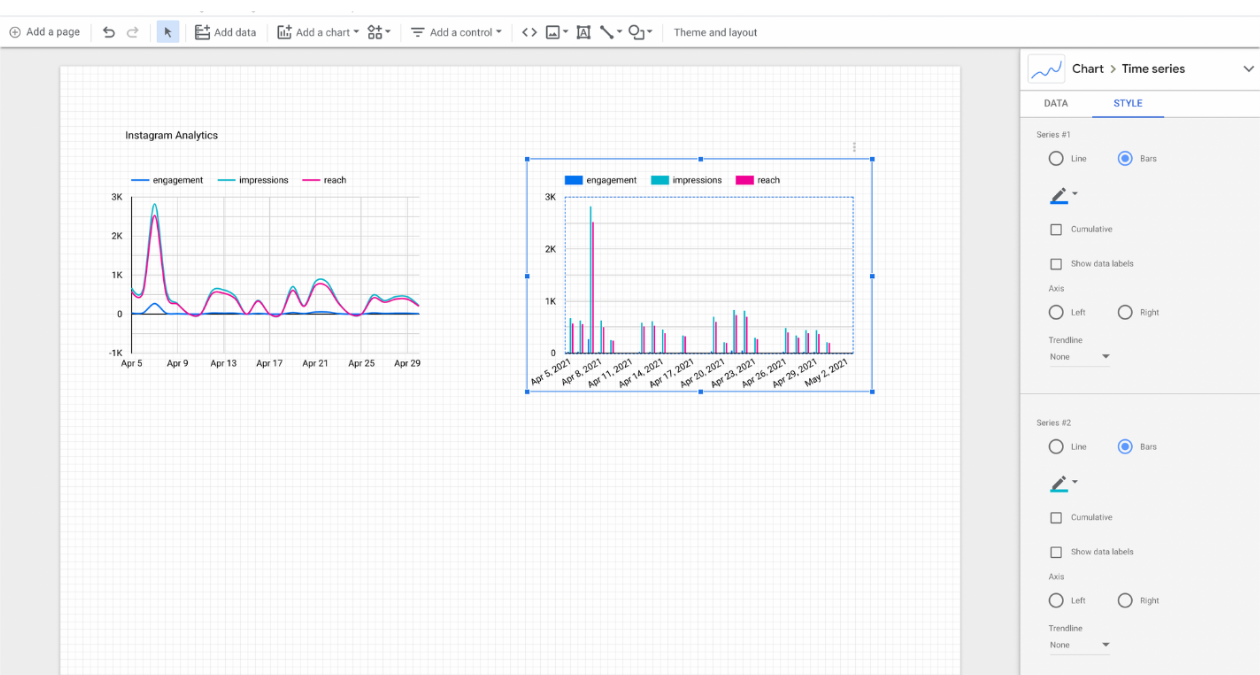
You can also change the line/bars color, while for the line visualization, you can even change the line weight and show points for each peak in the chart.
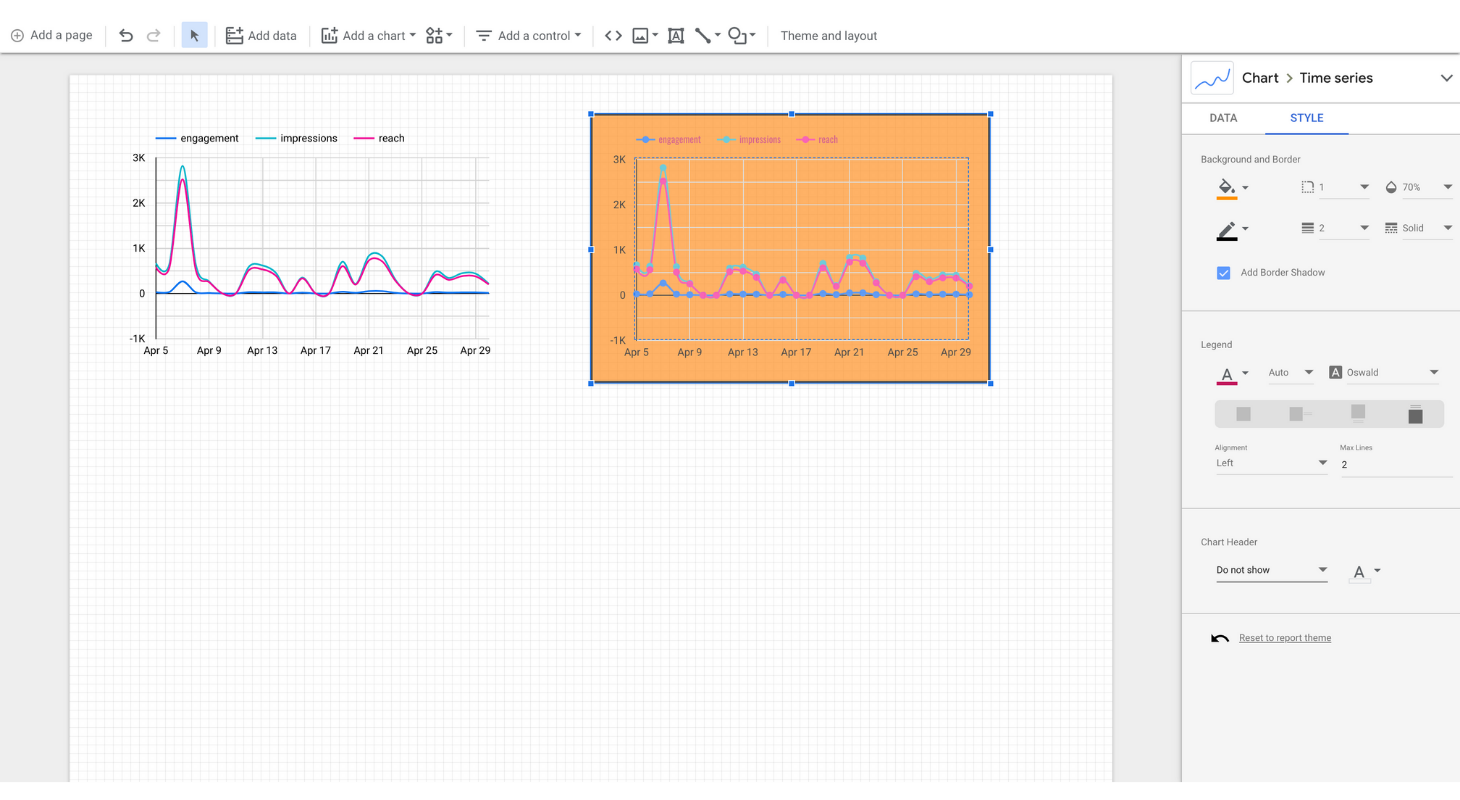
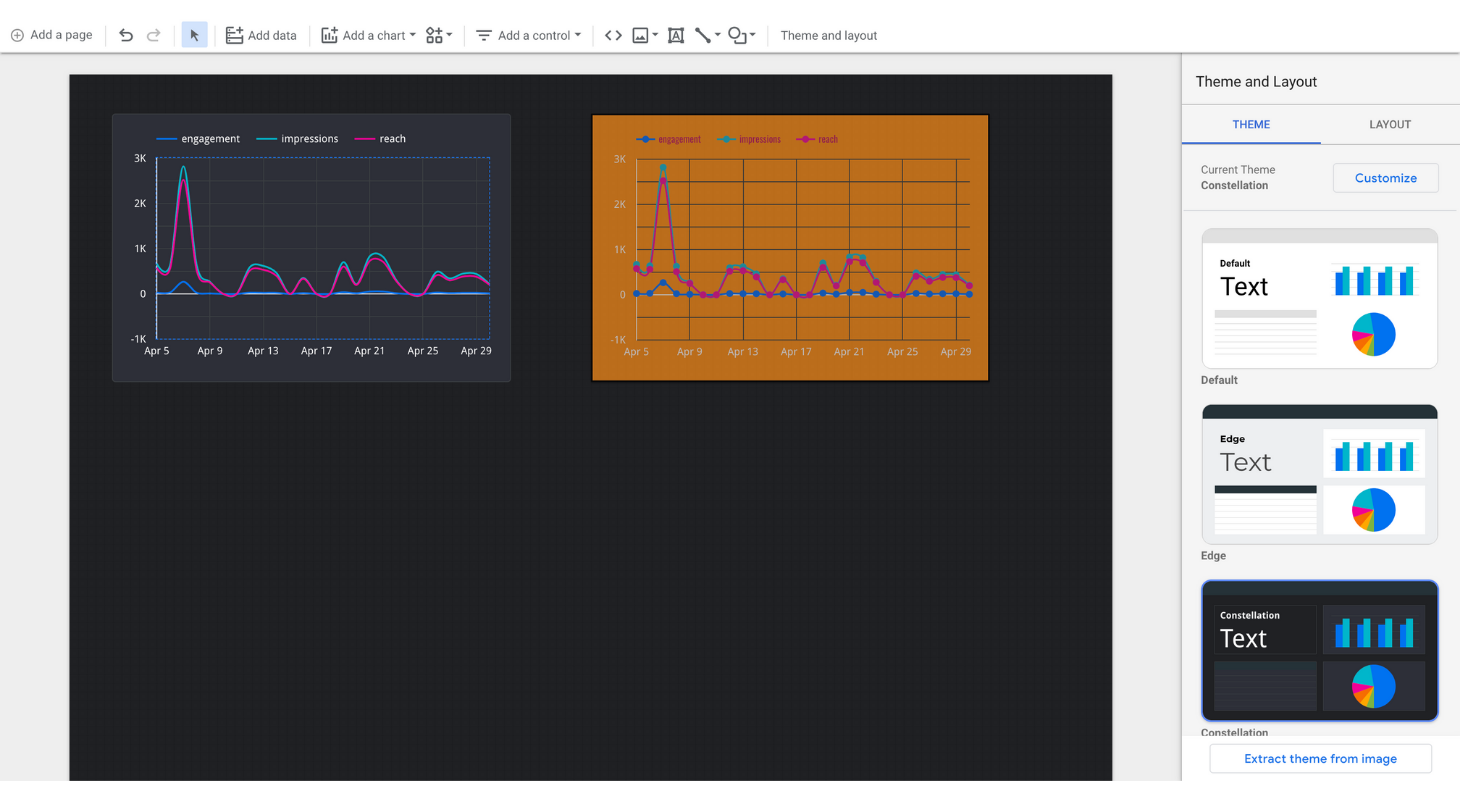
More than that, you can change the theme and layout with just a few clicks for even more customization.
Add a text that you can change whenever you want in order to create a legend for your own dashboard. This way, it will be so much easier to read the data.
You are able to add an image, line, or shape if this will make your dashboard better. It’s your choice. Click on Insert and find everything right there.
4. Create next-level Looker Studio social media dashboards with Socialinsider
We like data just as much as our customers do, so we wanted to make everybody happy. You can now connect your Socialinsider data to Looker Studio and dig into your metrics.
Setting up the integration is very easy. Here’s how.
After following those steps, you will have to select:
- What metrics you want to add
- From what platform
- The project that you need
Previously, I have shown you how to integrate Instagram data into your dashboard through the Socialinsider connector. But this tool can do more than that.
Let’s create a new dashboard to show you what I mean by that.
You can add three types of social media metrics to Looker Studio:
- Post level metrics
- Profile times based metrics
- Benchmarks metrics
All these metrics are available for: Facebook, Instagram, Twitter, LinkedIn.
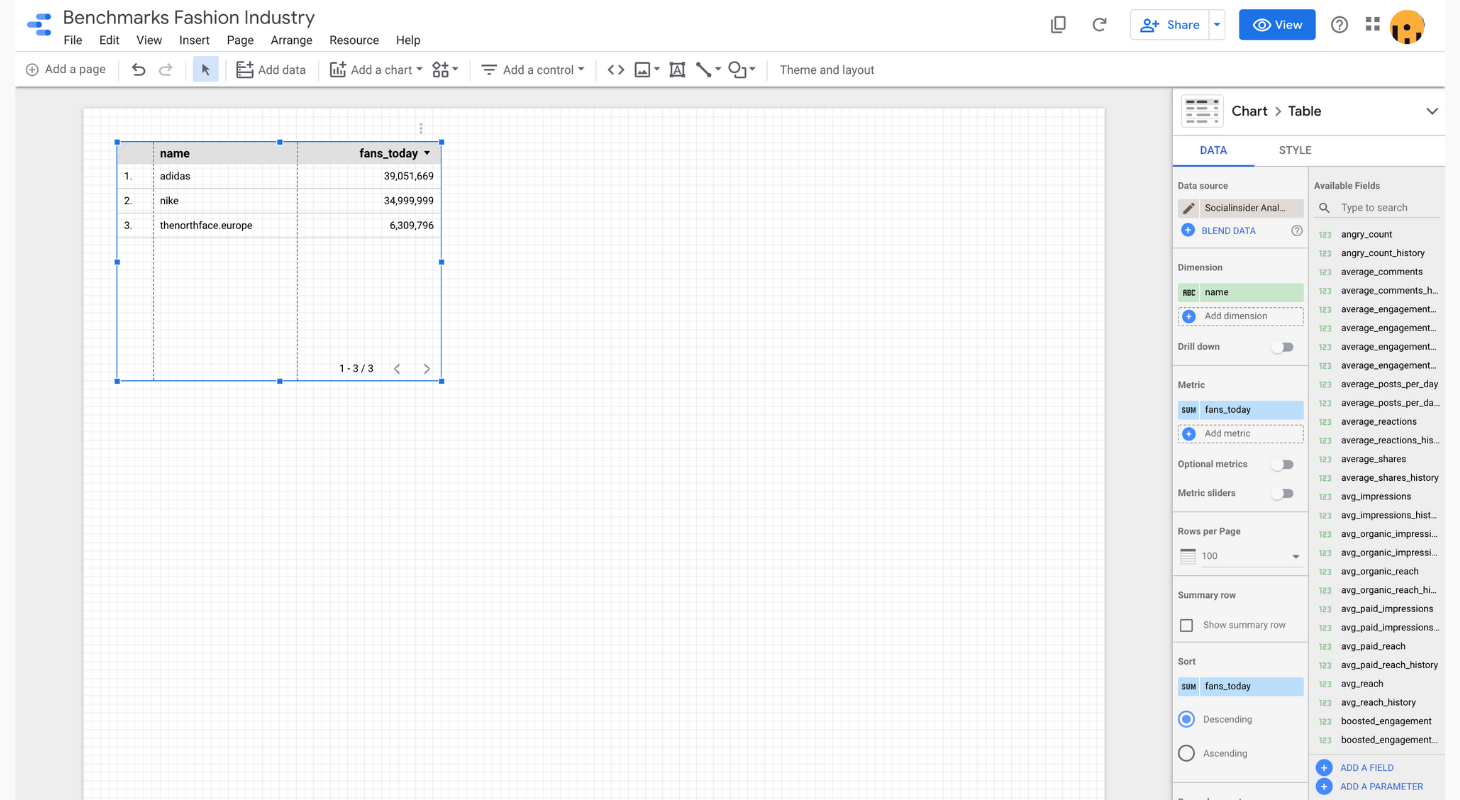
In this example, I have added the benchmarks metrics for Facebook. In the project were included the Facebook pages for Nike, Adidas, and The North Face.
But I wanted more than that.
So I added more charts (Scorecard, Pie Charts) to have a better look at my social media data, and I also wanted to play with the edit options.
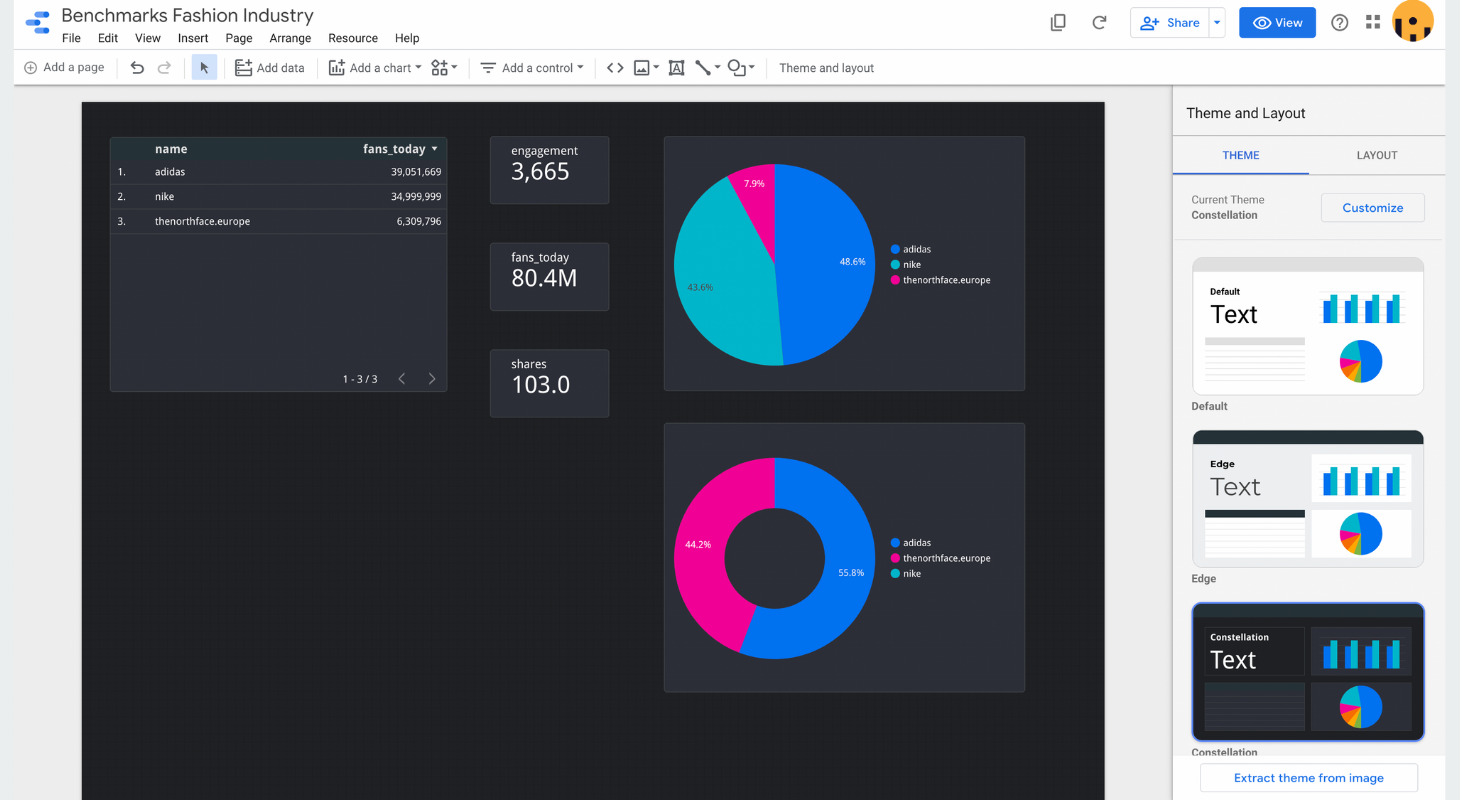
Of course, you can again change the theme, colors, and so on. Create the design that you want.
Here is another example of Socialinsider’s performance on Instagram. I have also added a date range control (go to Add Control - Date Range Control) to have the time range there.
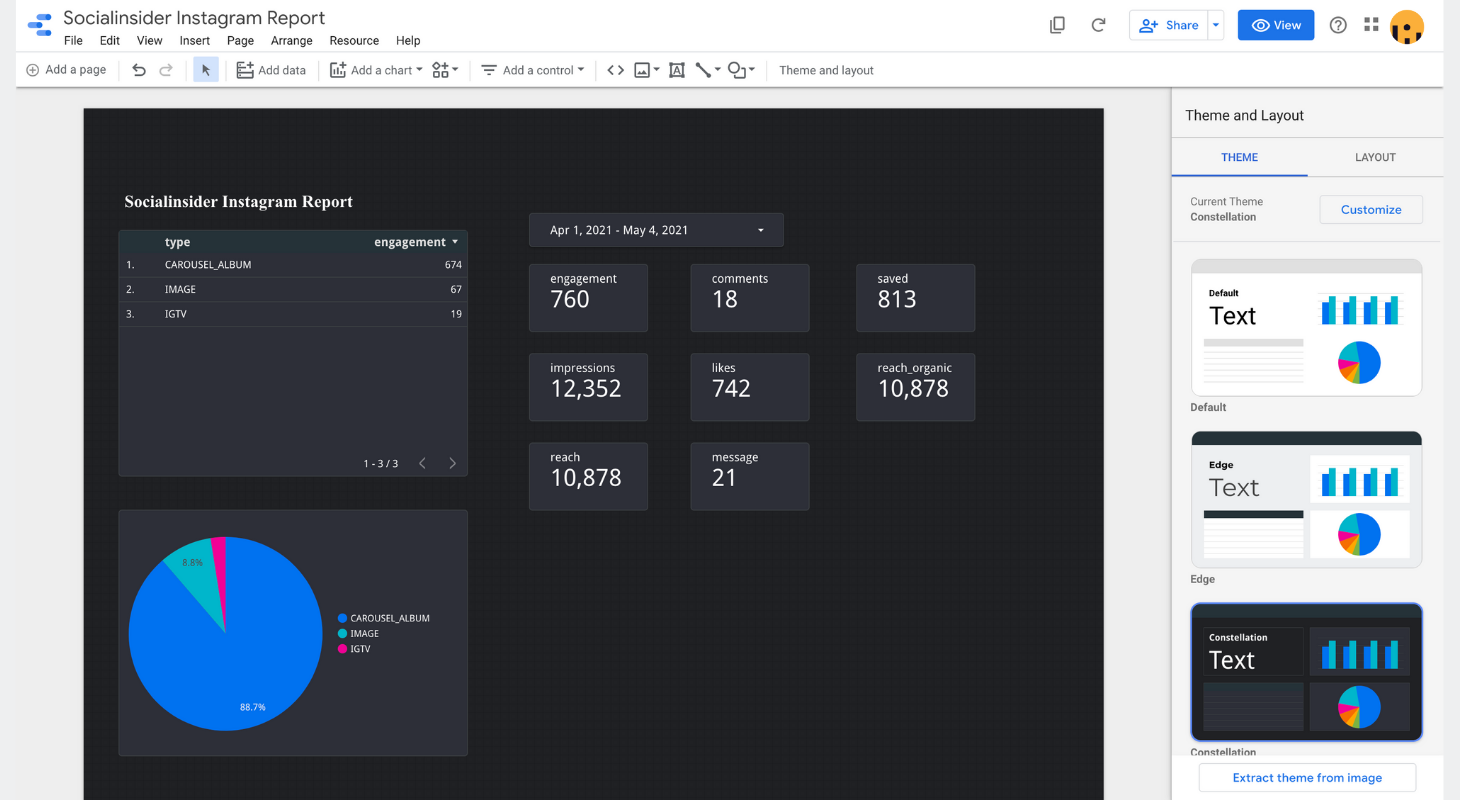
There is a chart with the Instagram engagement by type of post, with another pie chart to make everything more visually pleasing.
The Scorecards show the total metric for each one of them during the selected period of time.
Let’s say that maybe you don’t want the message metric. Just go to Metric, click on message and change it to whatever you need.
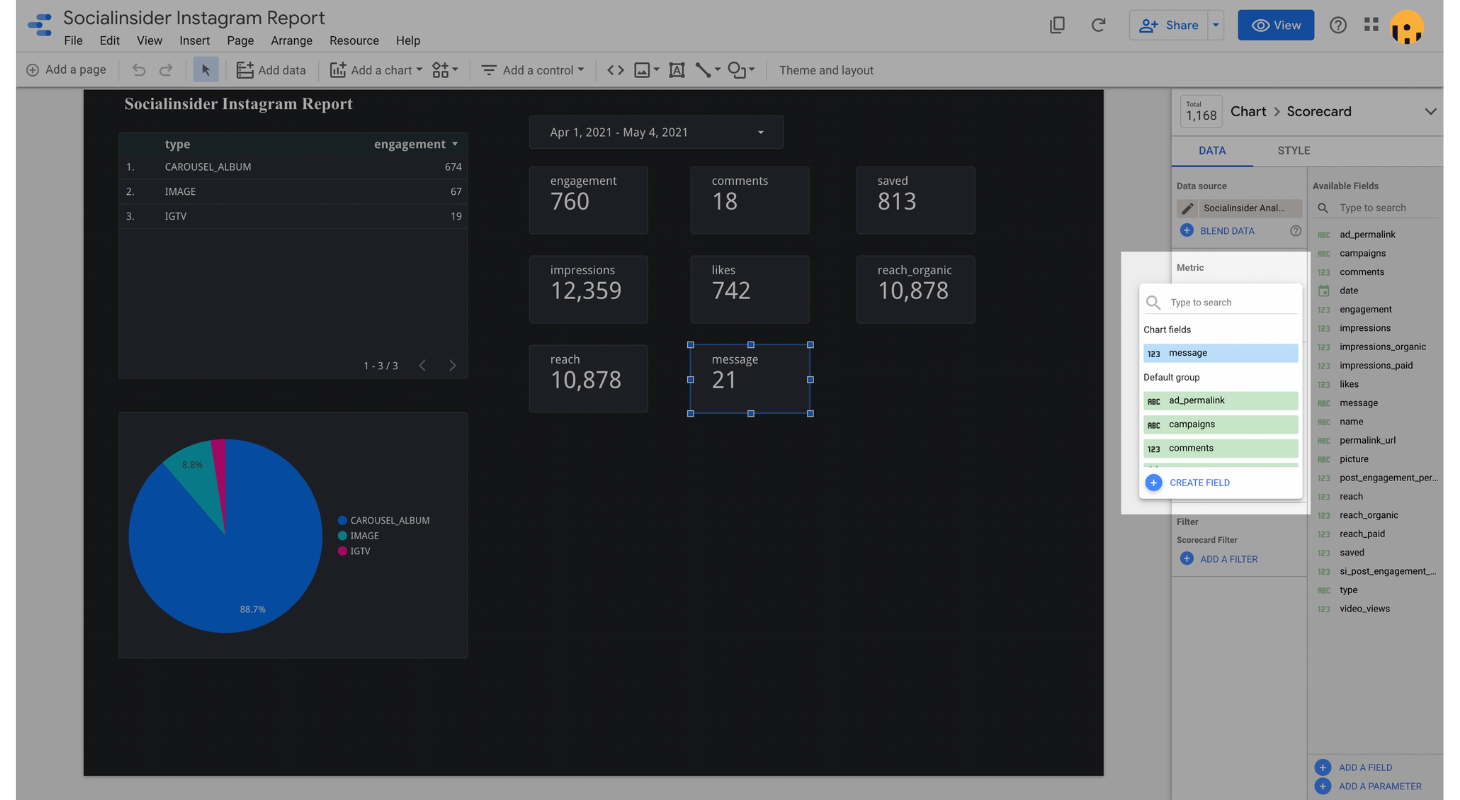
There is a list with the Instagram metrics provided. Change any of them every time you want to.
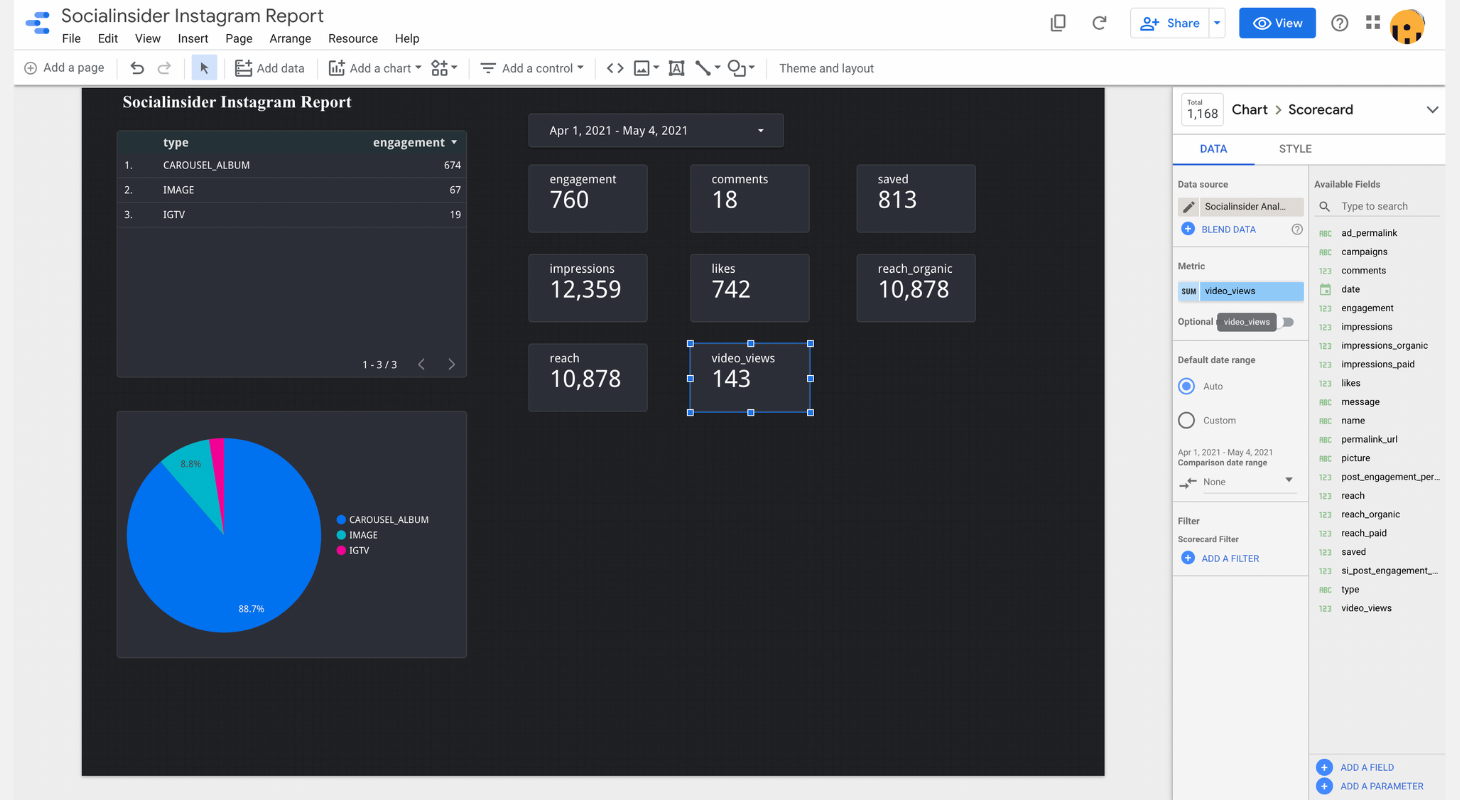
Voilà! There it is - changed it into video_views.
Final thought
Learning to use Looker Studio in order to write this little article seemed a bit intimidating and challenging at first, but it turned out to be easier than I thought.
Of course, there are more things that I haven’t covered here, but there is always room for improvement, and don’t forget: Practice makes perfect!
Bring your social media data into Looker Studio and discover secrets every single day.
Get ready to create in-depth and visually Looker Studio social media reports by leveraging Socialinsider data.
Diana Gogolan
Product Manager @ Socialinsider. Designing, Building, Testing, Releasing - from idea to successful feature. Passionate about telling stories that take different forms and shapes.

Know what your competitors do — before your manager asks
Get instant social benchmarks & reports without manual work.