8 Social Media Analytics Best Practices That Will Help You Become a Pro In Reporting
Discover a list of 8 social media analytics best practices and improve your reporting skills. Become a data pro and impress your managers.

Navigating the fast-paced world of social media requires more than intuition; it demands actionable insights powered by solid data. Social media analytics offer the clarity needed to make informed decisions, measure the true impact of your content, and refine your strategy for maximum engagement.
By embracing best practices in social media analytics, you set the stage for deeper audience understanding, smarter content planning, and measurable business growth—all while staying one step ahead in an ever-evolving digital landscape.
If you’re ready to turn data into your strongest advantage, join me as I dive into the best practices that make social media analytics truly work, according to Kate Meyers Emery, Sr. Digital Manager at Candid.
Key takeaways
-
Leverage cross-platform social media analytics: Cross-platform analytics help you understand how each channel contributes to performance, so decisions are based on your brand’s data, not industry assumptions.
-
Run a content pillars analysis and make strategic content adjustments: Analyzing performance by content pillar reveals which themes truly drive engagement and allows you to tailor your content mix for each platform.
-
Leverage historical data to uncover trends: Historical data uncovers long-term performance patterns, helping you anticipate trends instead of reacting to short-term spikes.
-
Calculate the value of your organic content: Assigning value to organic engagement transforms social performance from vanity metrics into measurable business impact.
-
Bring in qualitative insights: Qualitative insights add context and meaning to metrics by explaining why audiences engage, not just how often they do.
-
Implement proper attribution: Proper attribution connects social media activity to real outcomes, enabling smarter optimization based on what actually drives results.
-
Constantly run a competitive analysis: Ongoing competitive analysis helps you benchmark performance, identify content opportunities, and stay ahead of shifts in your industry.
-
Use AI technologies to get strategy optimization insights: AI-powered insights accelerate analysis and highlight strategic opportunities that would be difficult to identify manually.
Top social media analytics best practices that will help you create effective performance reports
Performance reports shouldn’t feel like something you rush through at the end of the month.
With the right social media analytics best practices and the top social media analytics tools, reporting becomes a way to clearly show impact, spot opportunities, and guide smarter decisions.
When analytics are used intentionally, they support real social media optimization. This helps you turn performance data into insights people actually understand and act on.
So let’s break down the proven methods that will help you create performance reports people actually want to read and use:
1. Leverage cross-platform social media analytics
It’s easy to get stuck thinking in blocks: TikTok here, Instagram there, YouTube somewhere in the background. But social performance doesn’t work in isolation. Your audience doesn’t either.
Cross-platform analytics let you see the full picture: how each channel contributes to engagement, reach, and momentum over time. Not what’s popular in general, but what actually works for your brand.
And this is where Socialinsider earns its place in your workflow.
Instead of jumping between native platforms or exporting endless spreadsheets, you get one clear view of how all your social channels perform side by side. Engagement trends, posting volume, average engagement per post: all comparable, all in context.
That context matters more than most people think.
TikTok is currently the most engaging platform overall, according to industry social media benchmarks. But high global engagement doesn’t guarantee high brand-specific results. What performs best across the industry isn’t always what performs best for you.
And the data proves it.

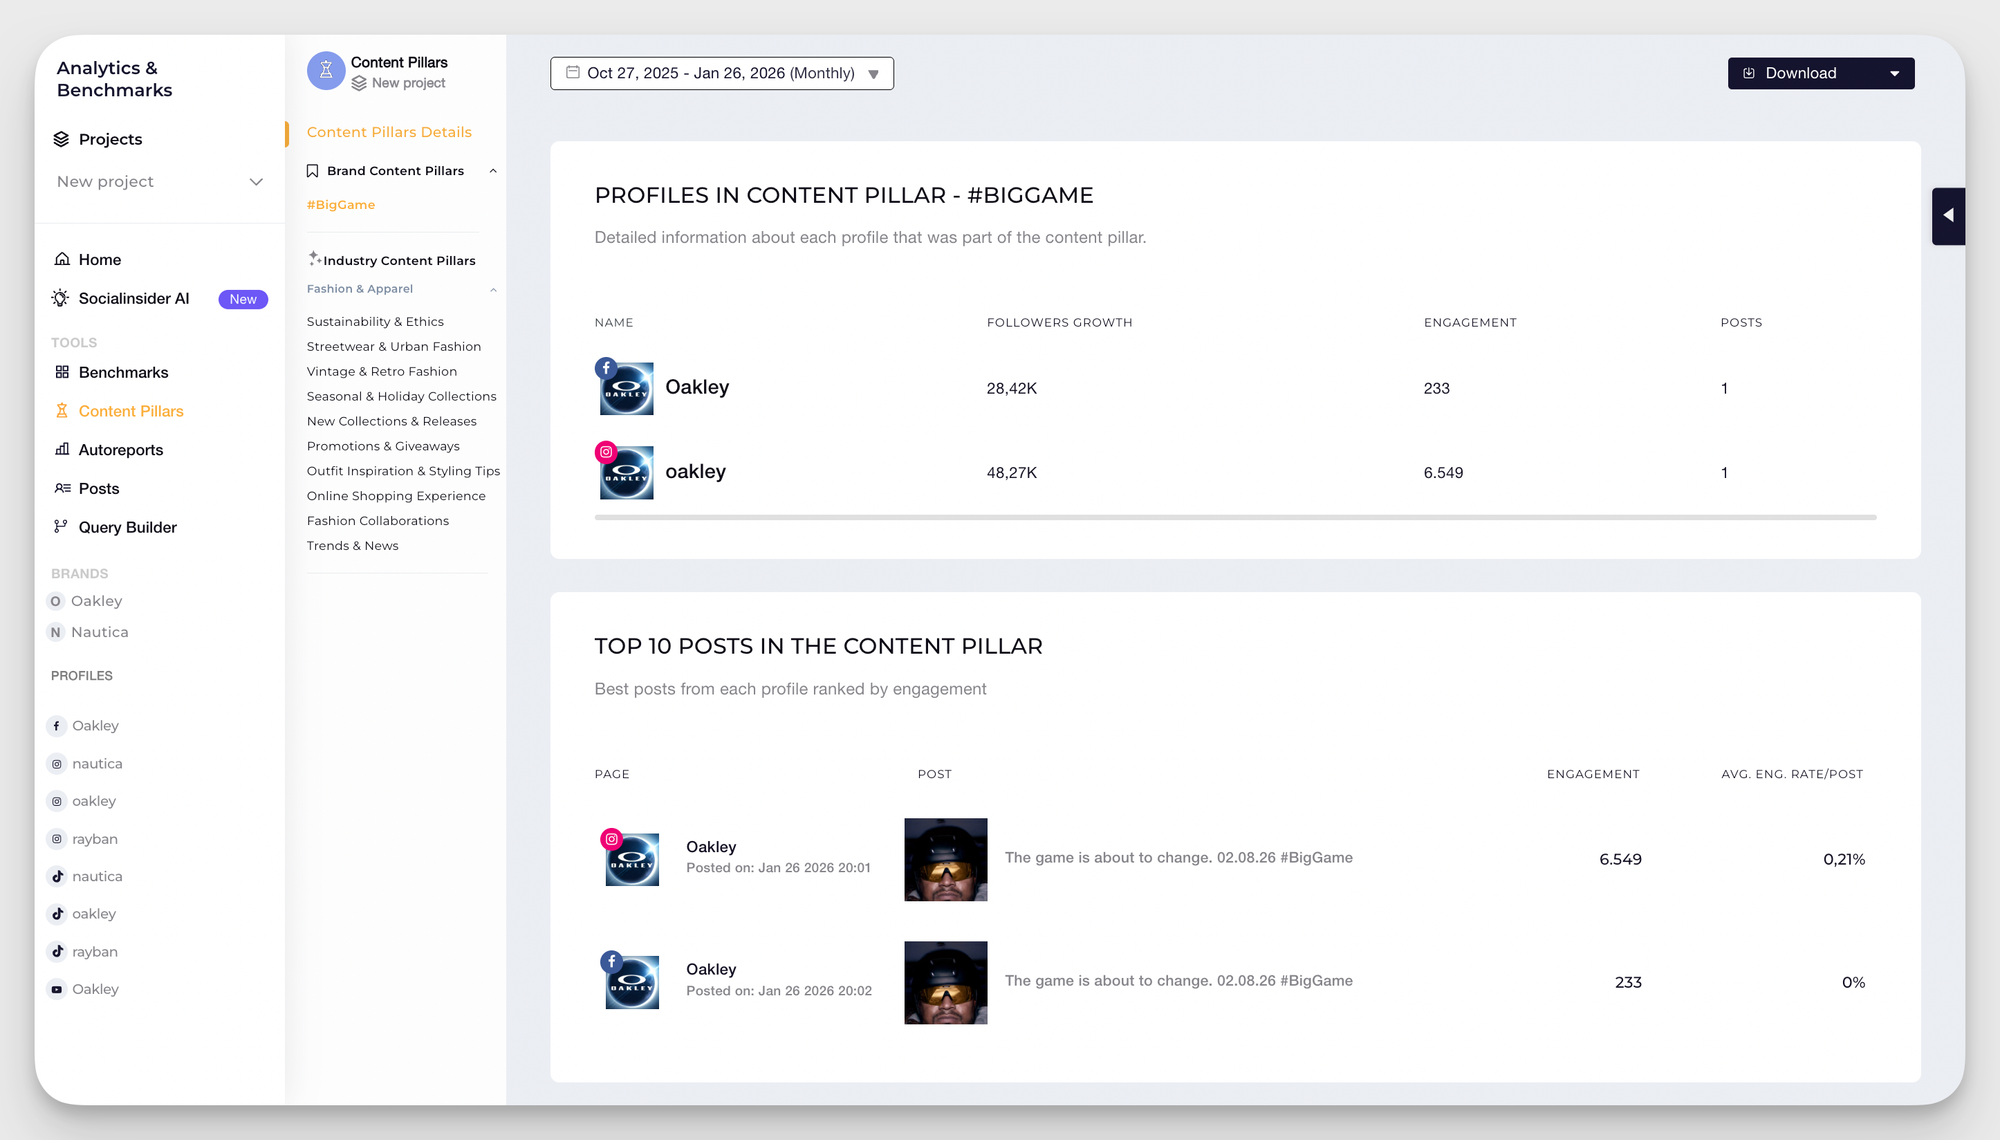
Take Oakley as an example. When you look at their performance inside Socialinsider, Instagram clearly drives more engagement than TikTok, even though TikTok is widely seen as the engagement leader.

Essentially, for an in-depth understanding of how each channel contributes to different business goals, cross-platform analytics turn assumptions into decisions. And Socialinsider makes that process clear, visual, and refreshingly honest.
2. Run a content pillars analysis and make strategic content adjustments
Knowing where you perform best is useful. Knowing what content drives that performance is where strategy lives.
A social media content pillar analysis helps you break engagement down by theme and see which topics actually resonate. This is the foundation of a social media analytics-backed strategy.
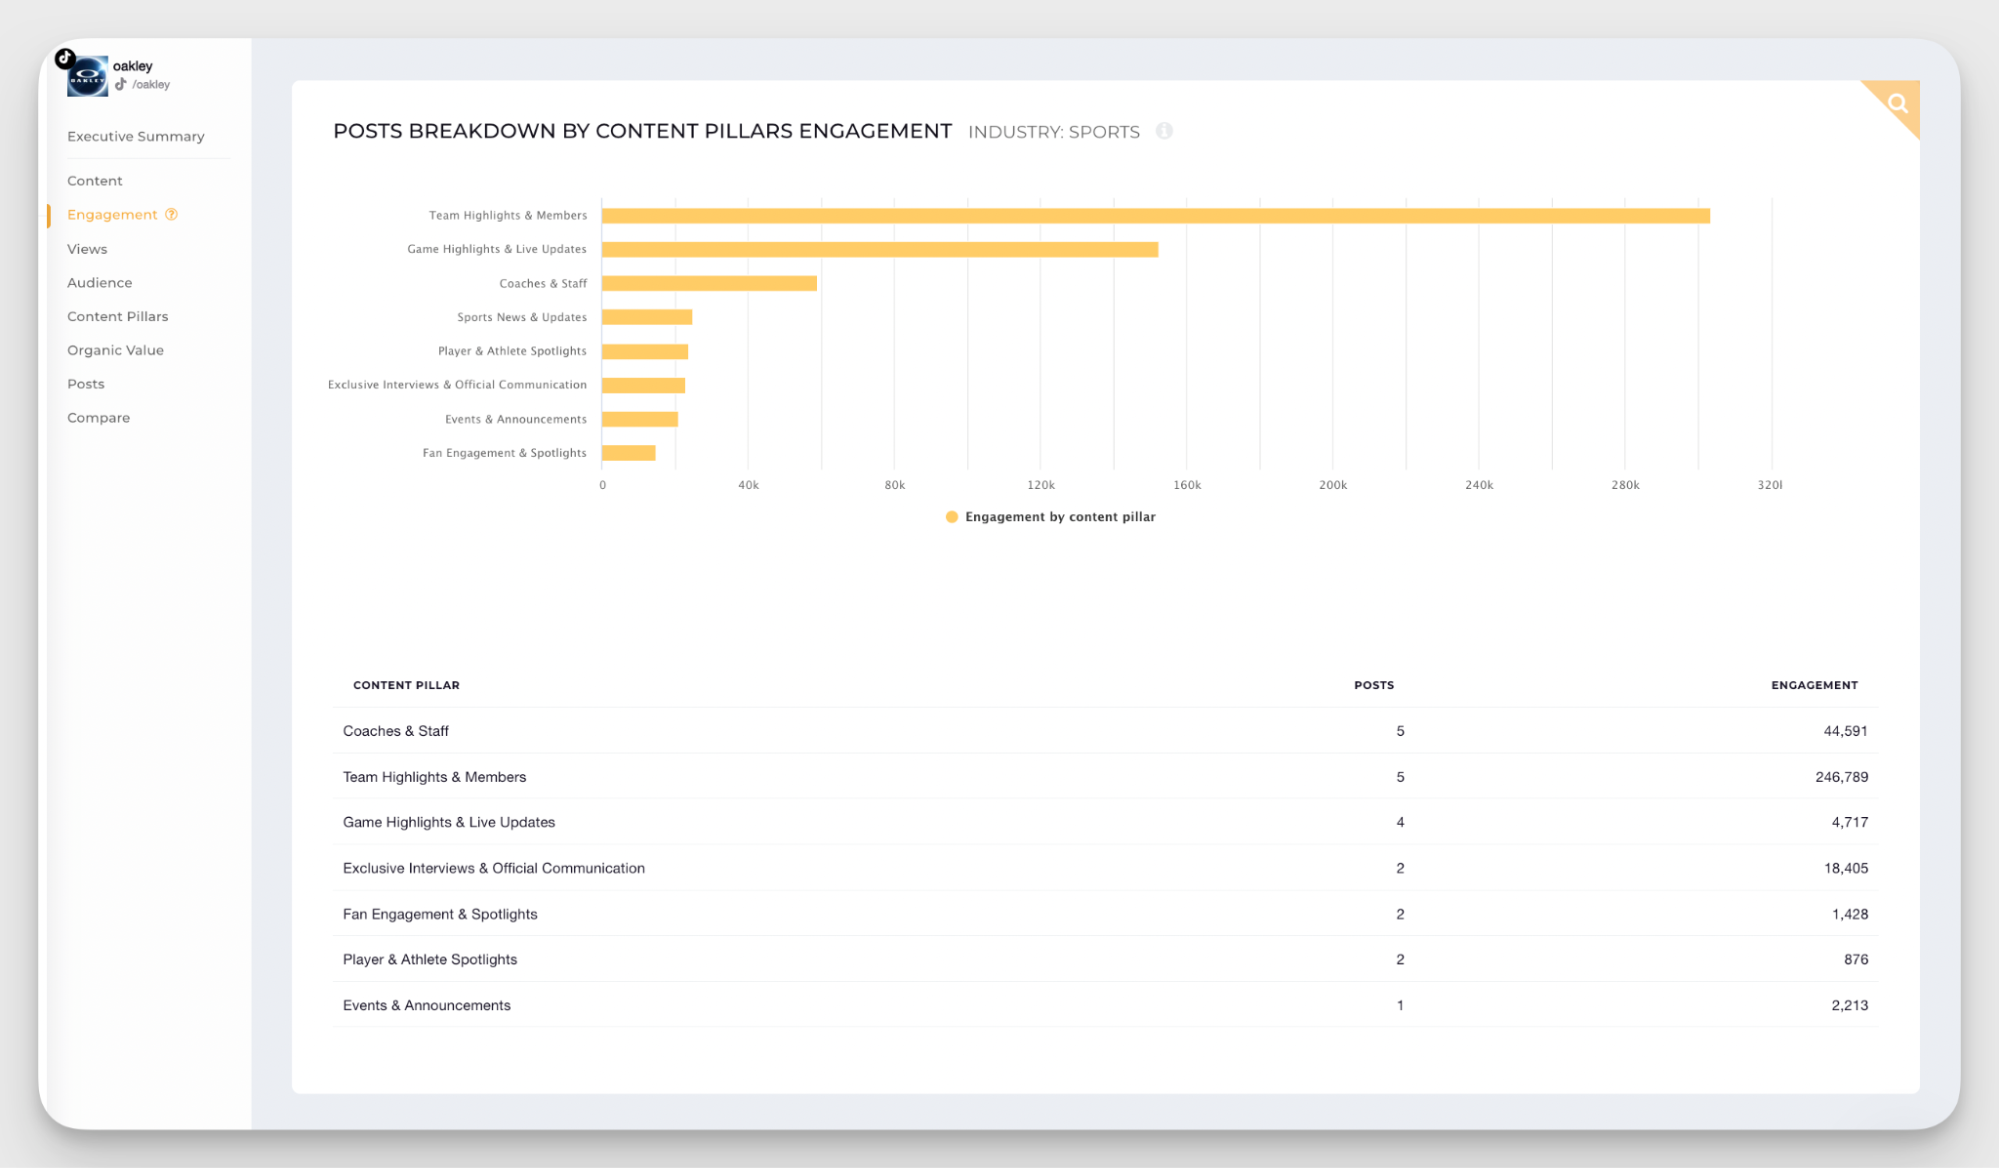
Looking at Oakley’s TikTok data from Socialinsider once more, one thing stood out to me: team highlights and members perform significantly better than other content pillars.
So, the insight I could draw from the data was that people-led and behind-the-scenes content clearly drives stronger engagement on TikTok than generic updates or announcements.
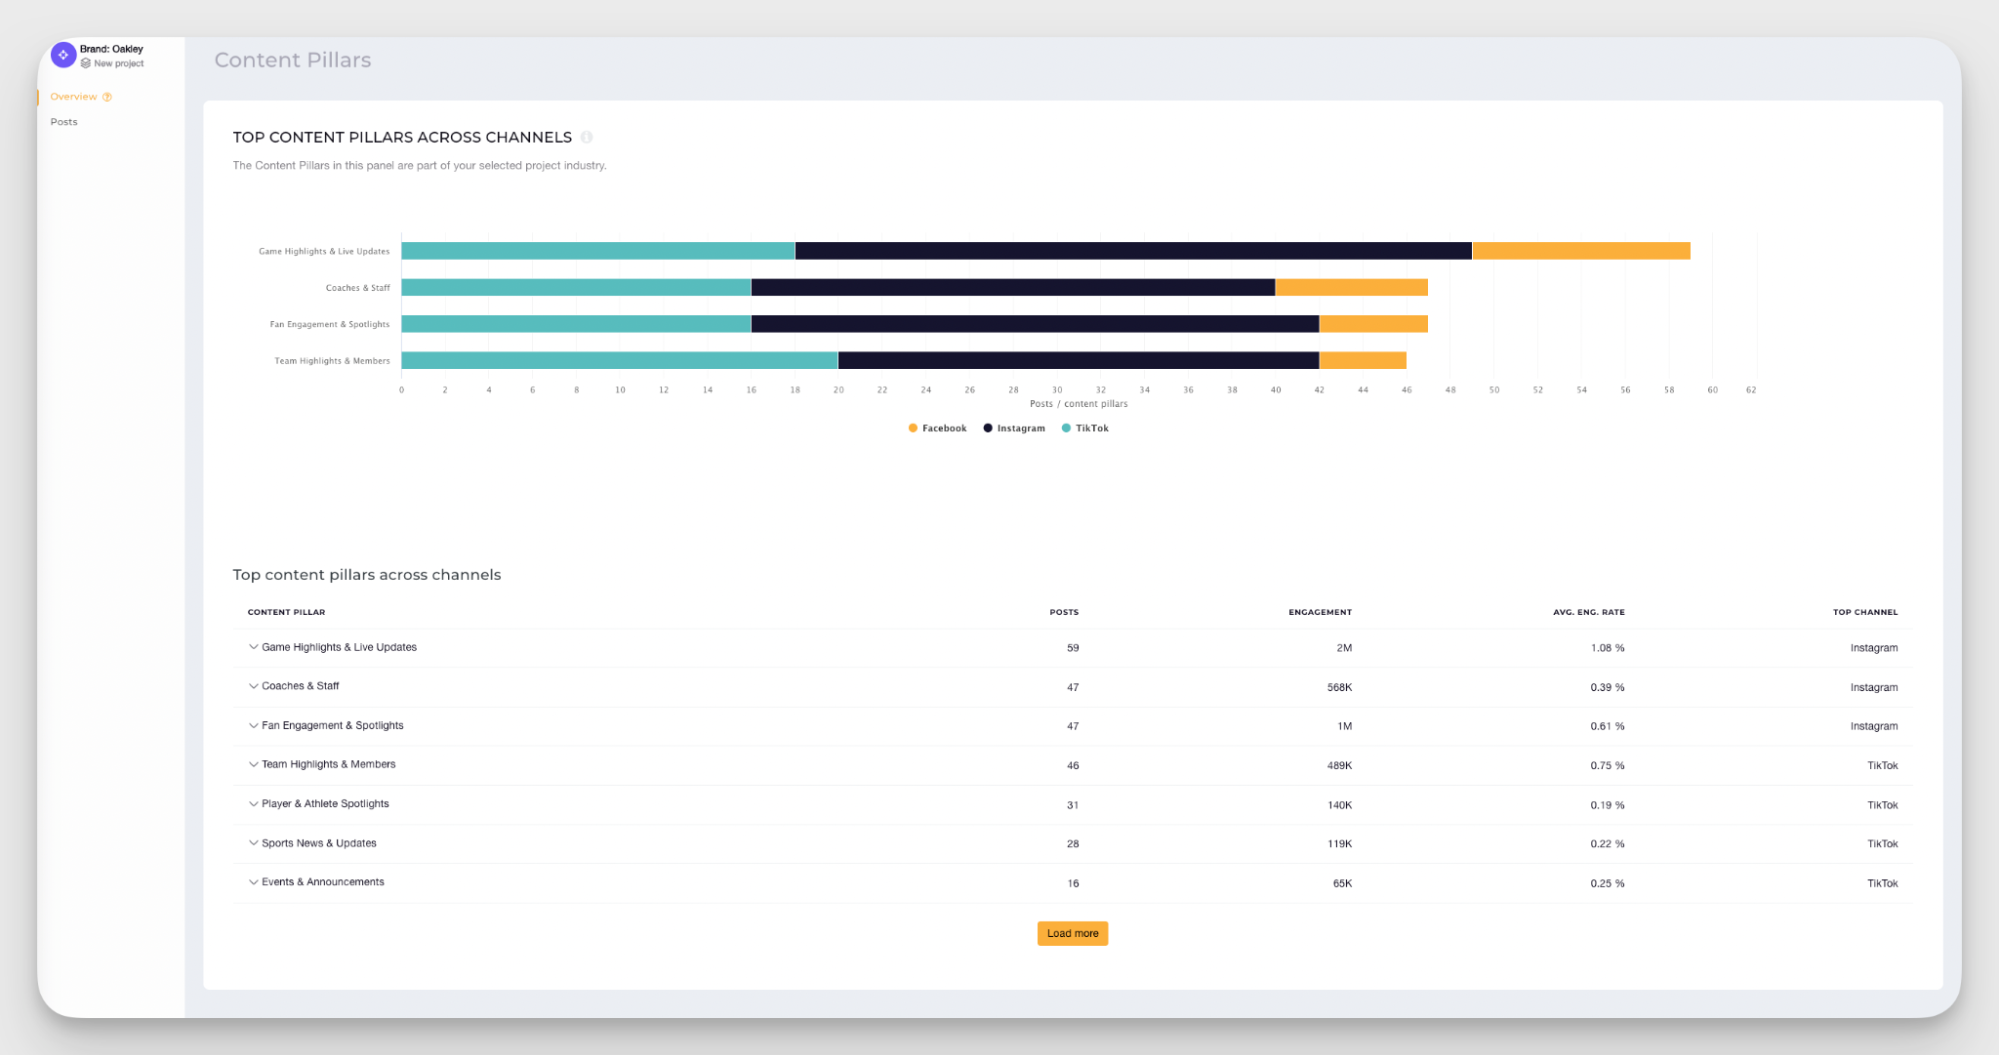
And when you expand the view across multiple platforms, the picture becomes more nuanced.
Some content pillars perform consistently well, while others peak on specific channels. Instagram and TikTok reward different themes, and treating them the same leaves performance on the table.
An important thing for you to know is that while the above-provided data is extracted through Socialinsider’s AI industry- based content pillar feature, within the Socialinsider dashboard you also have the possibility to create your own, branded content pillars, thorugh the Query Builder.
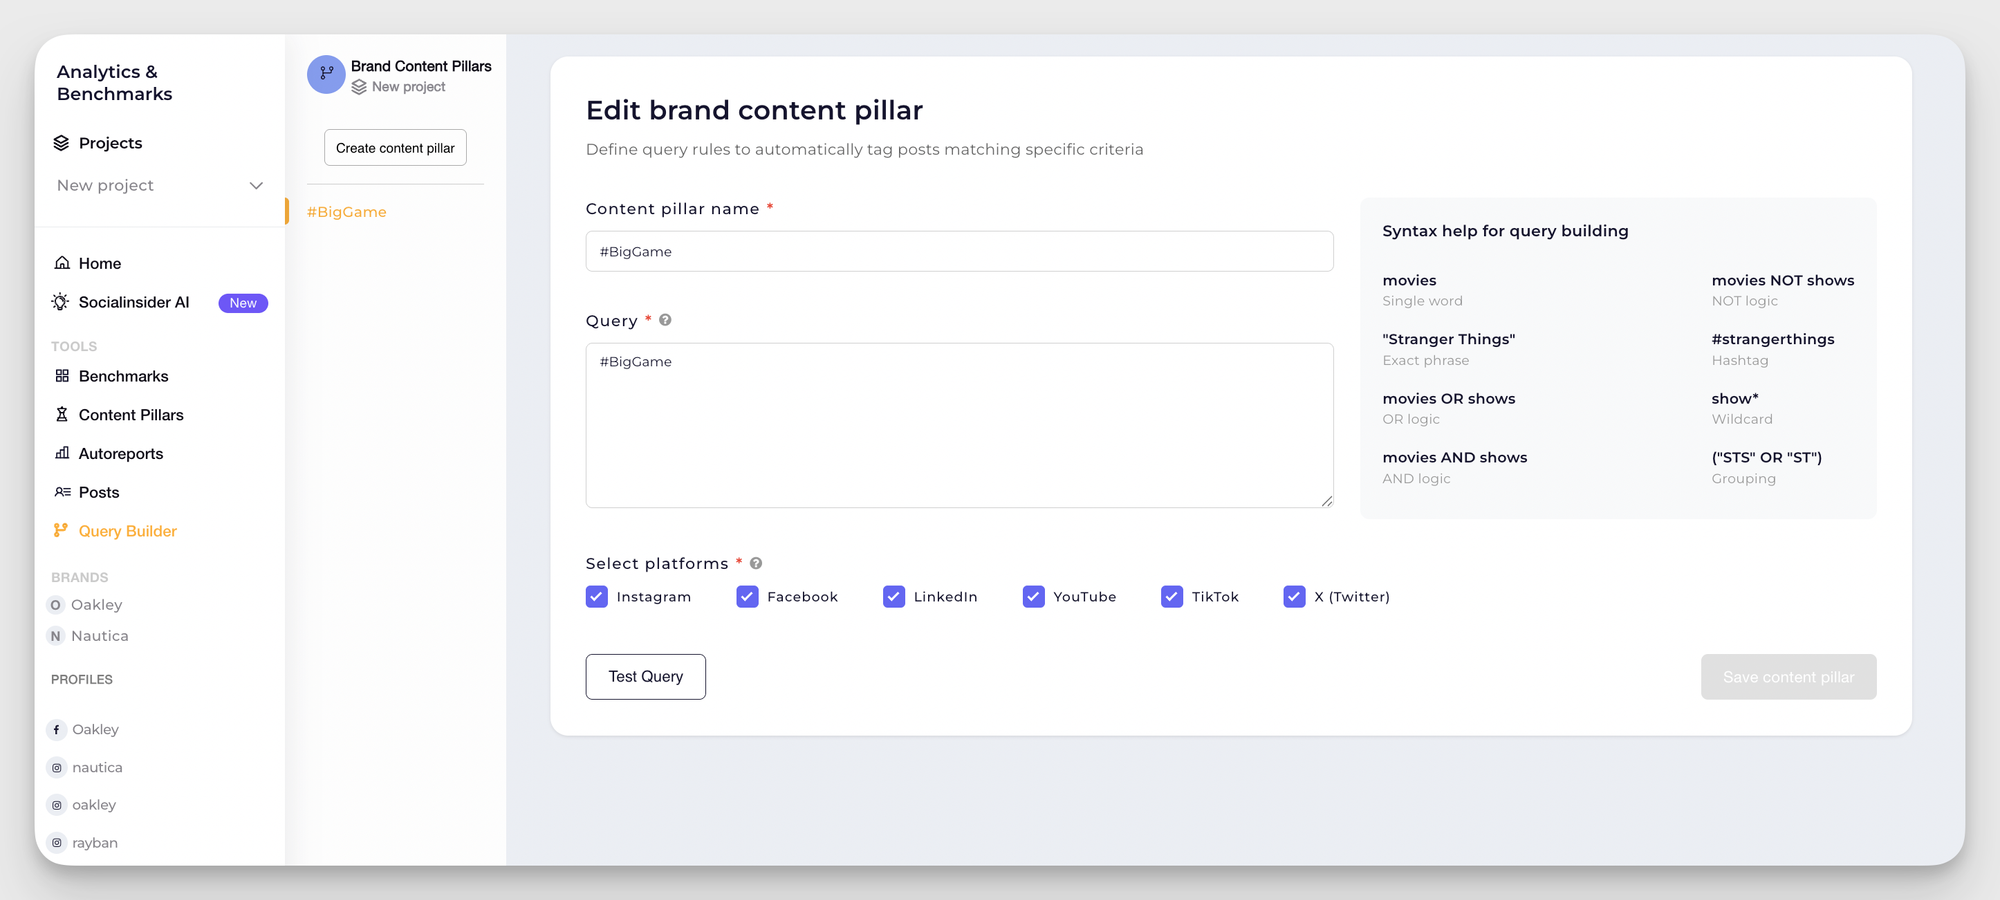
With this, you can oversee performance for a specific, branded content pillar.
3. Leverage historical data to uncover trends
If you’re serious about using social media analytics to sharpen your strategy, start by digging into your past performance.
Historical data acts as a roadmap, showing you which content and campaigns have resonated with your audience over time. Rather than relying on instinct alone, social media data analytics empowers you to spot emerging trends, compare different periods, and see how shifts in your approach affect results.
By tapping into these insights, you’re able to make proactive decisions instead of playing catch-up.
4. Calculate the value of your organic content
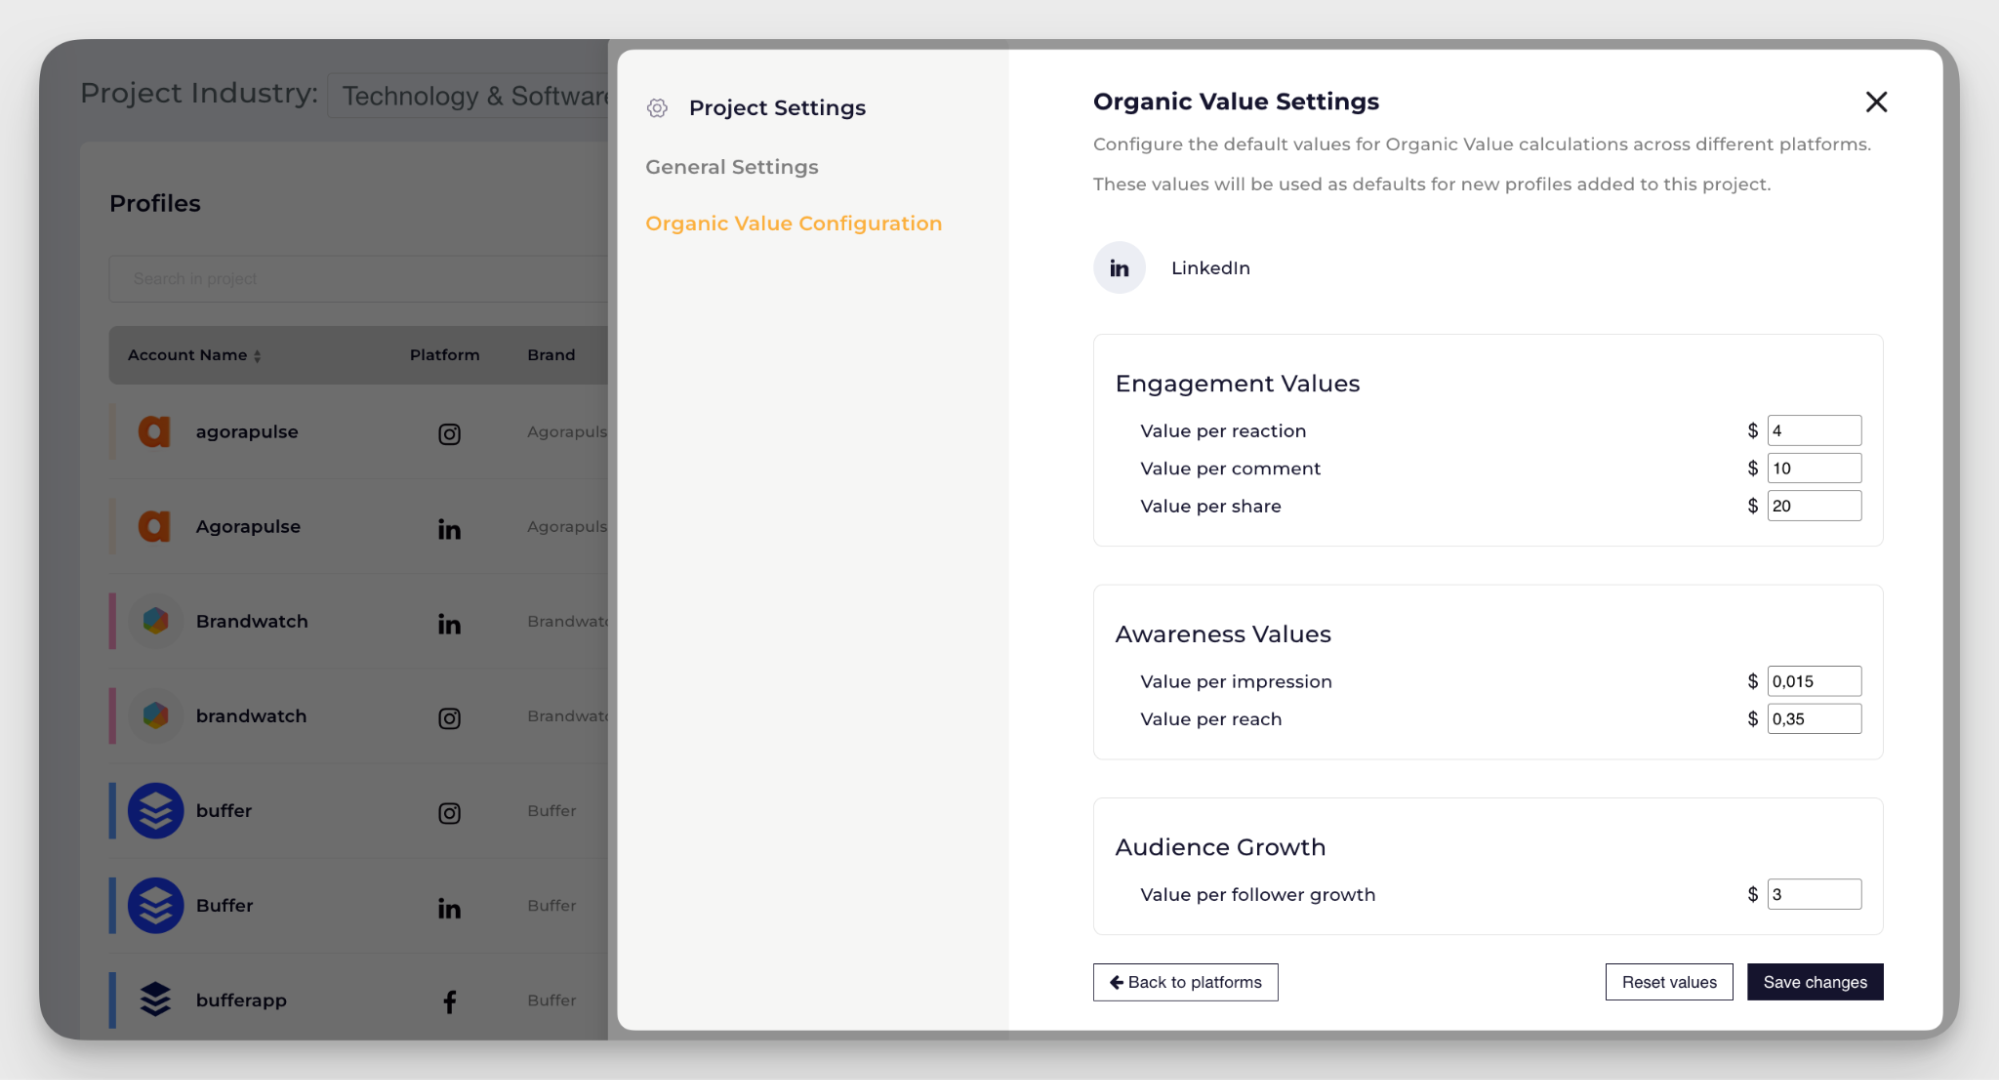
Knowing how to analyze social media effectively means measuring not just the reach of your paid campaigns, but also truly understanding the performance of your organic posts. This is where Socialinsider’s Organic Value feature becomes a game-changer.
Organic Value is a dedicated metric within Socialinsider that puts an actual dollar amount on the impact of your unpaid (organic) social posts. Think of it as an estimate of how much you would have had to spend on ads to achieve the same results.
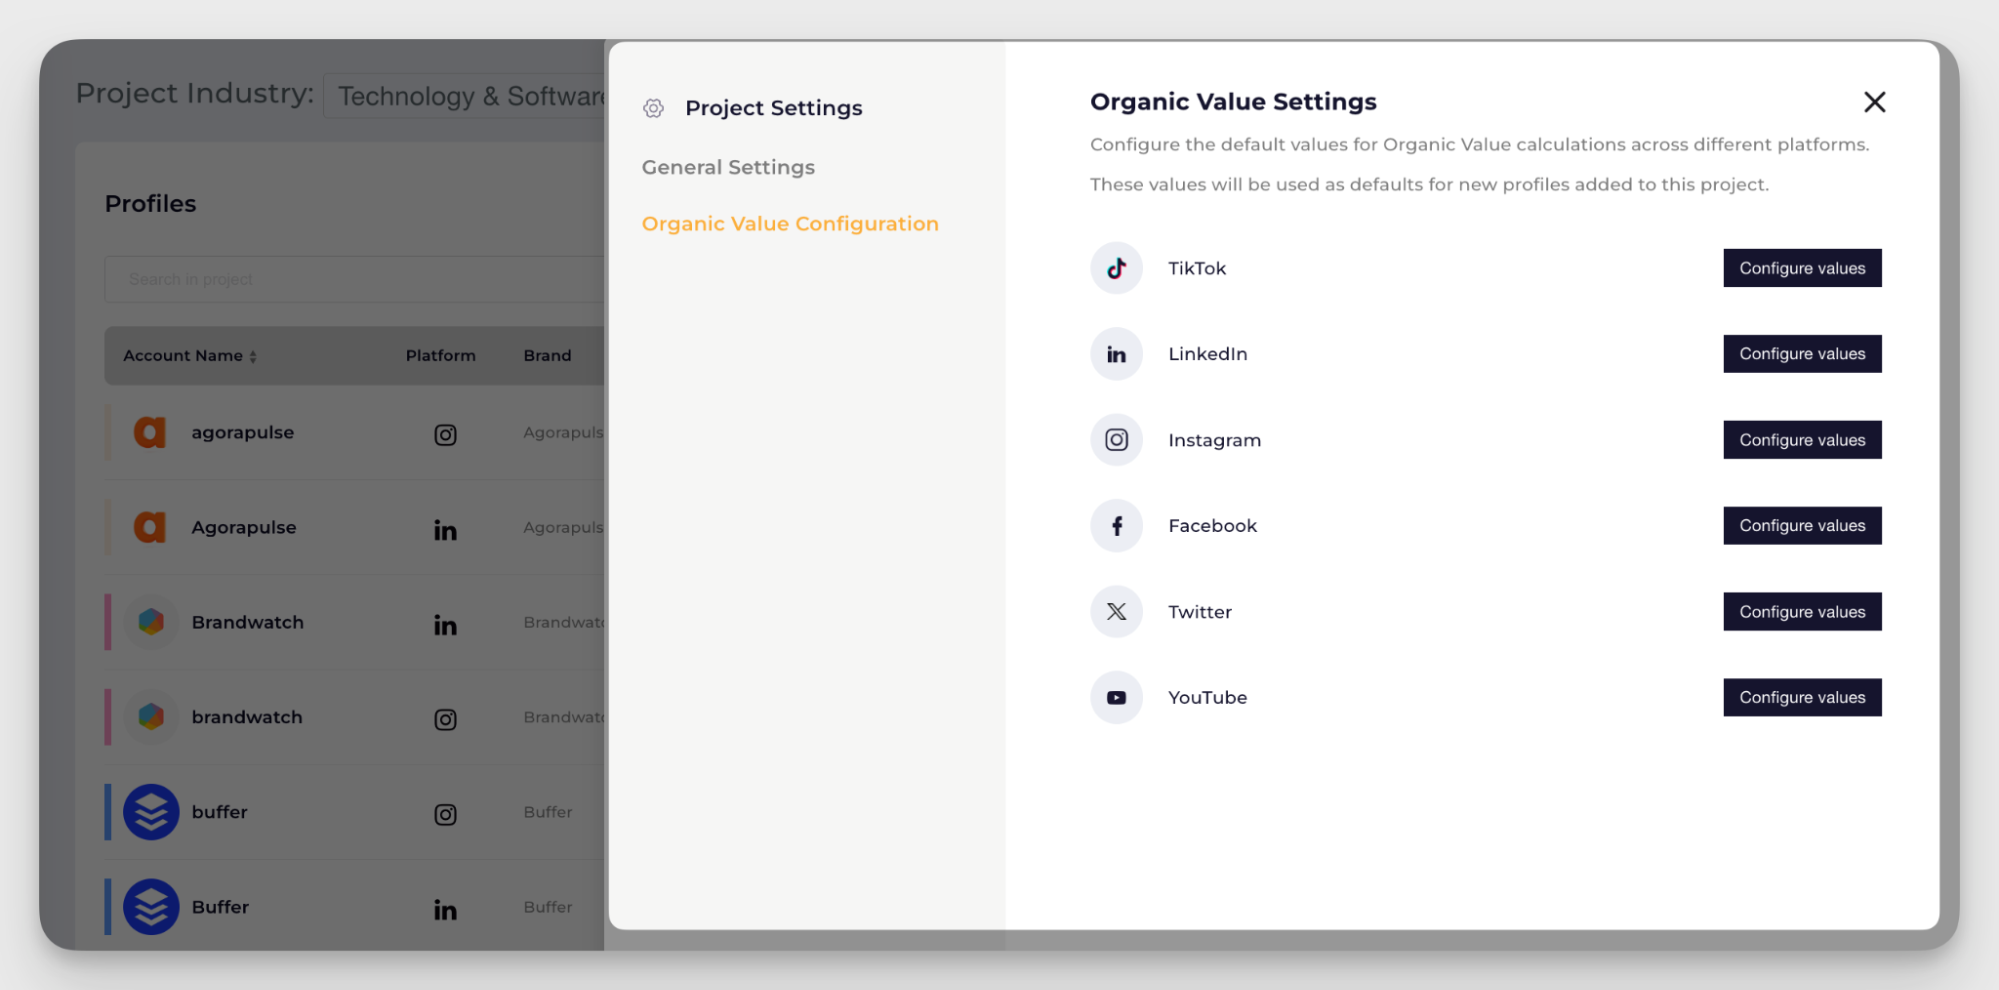
By using social media analytics to compare the performance of your organic content with industry-standard ad costs, the platform translates engagement—likes, comments, shares, reach—into a tangible value.
5. Bring in qualitative insights
Data gives you the big picture, but conversations give you the soul of your brand’s story. If you really want to master using social media analytics effectively, don’t just focus on the charts—listen to the voices behind the numbers.
Sure, social media data analytics can tell you which posts got the most likes, but only your followers can tell you why they loved that content. That’s why combining sentiment analysis with standard performance metrics and even those quirky poll replies is so powerful. Think of this as the difference between looking at a map and actually exploring the landscape.
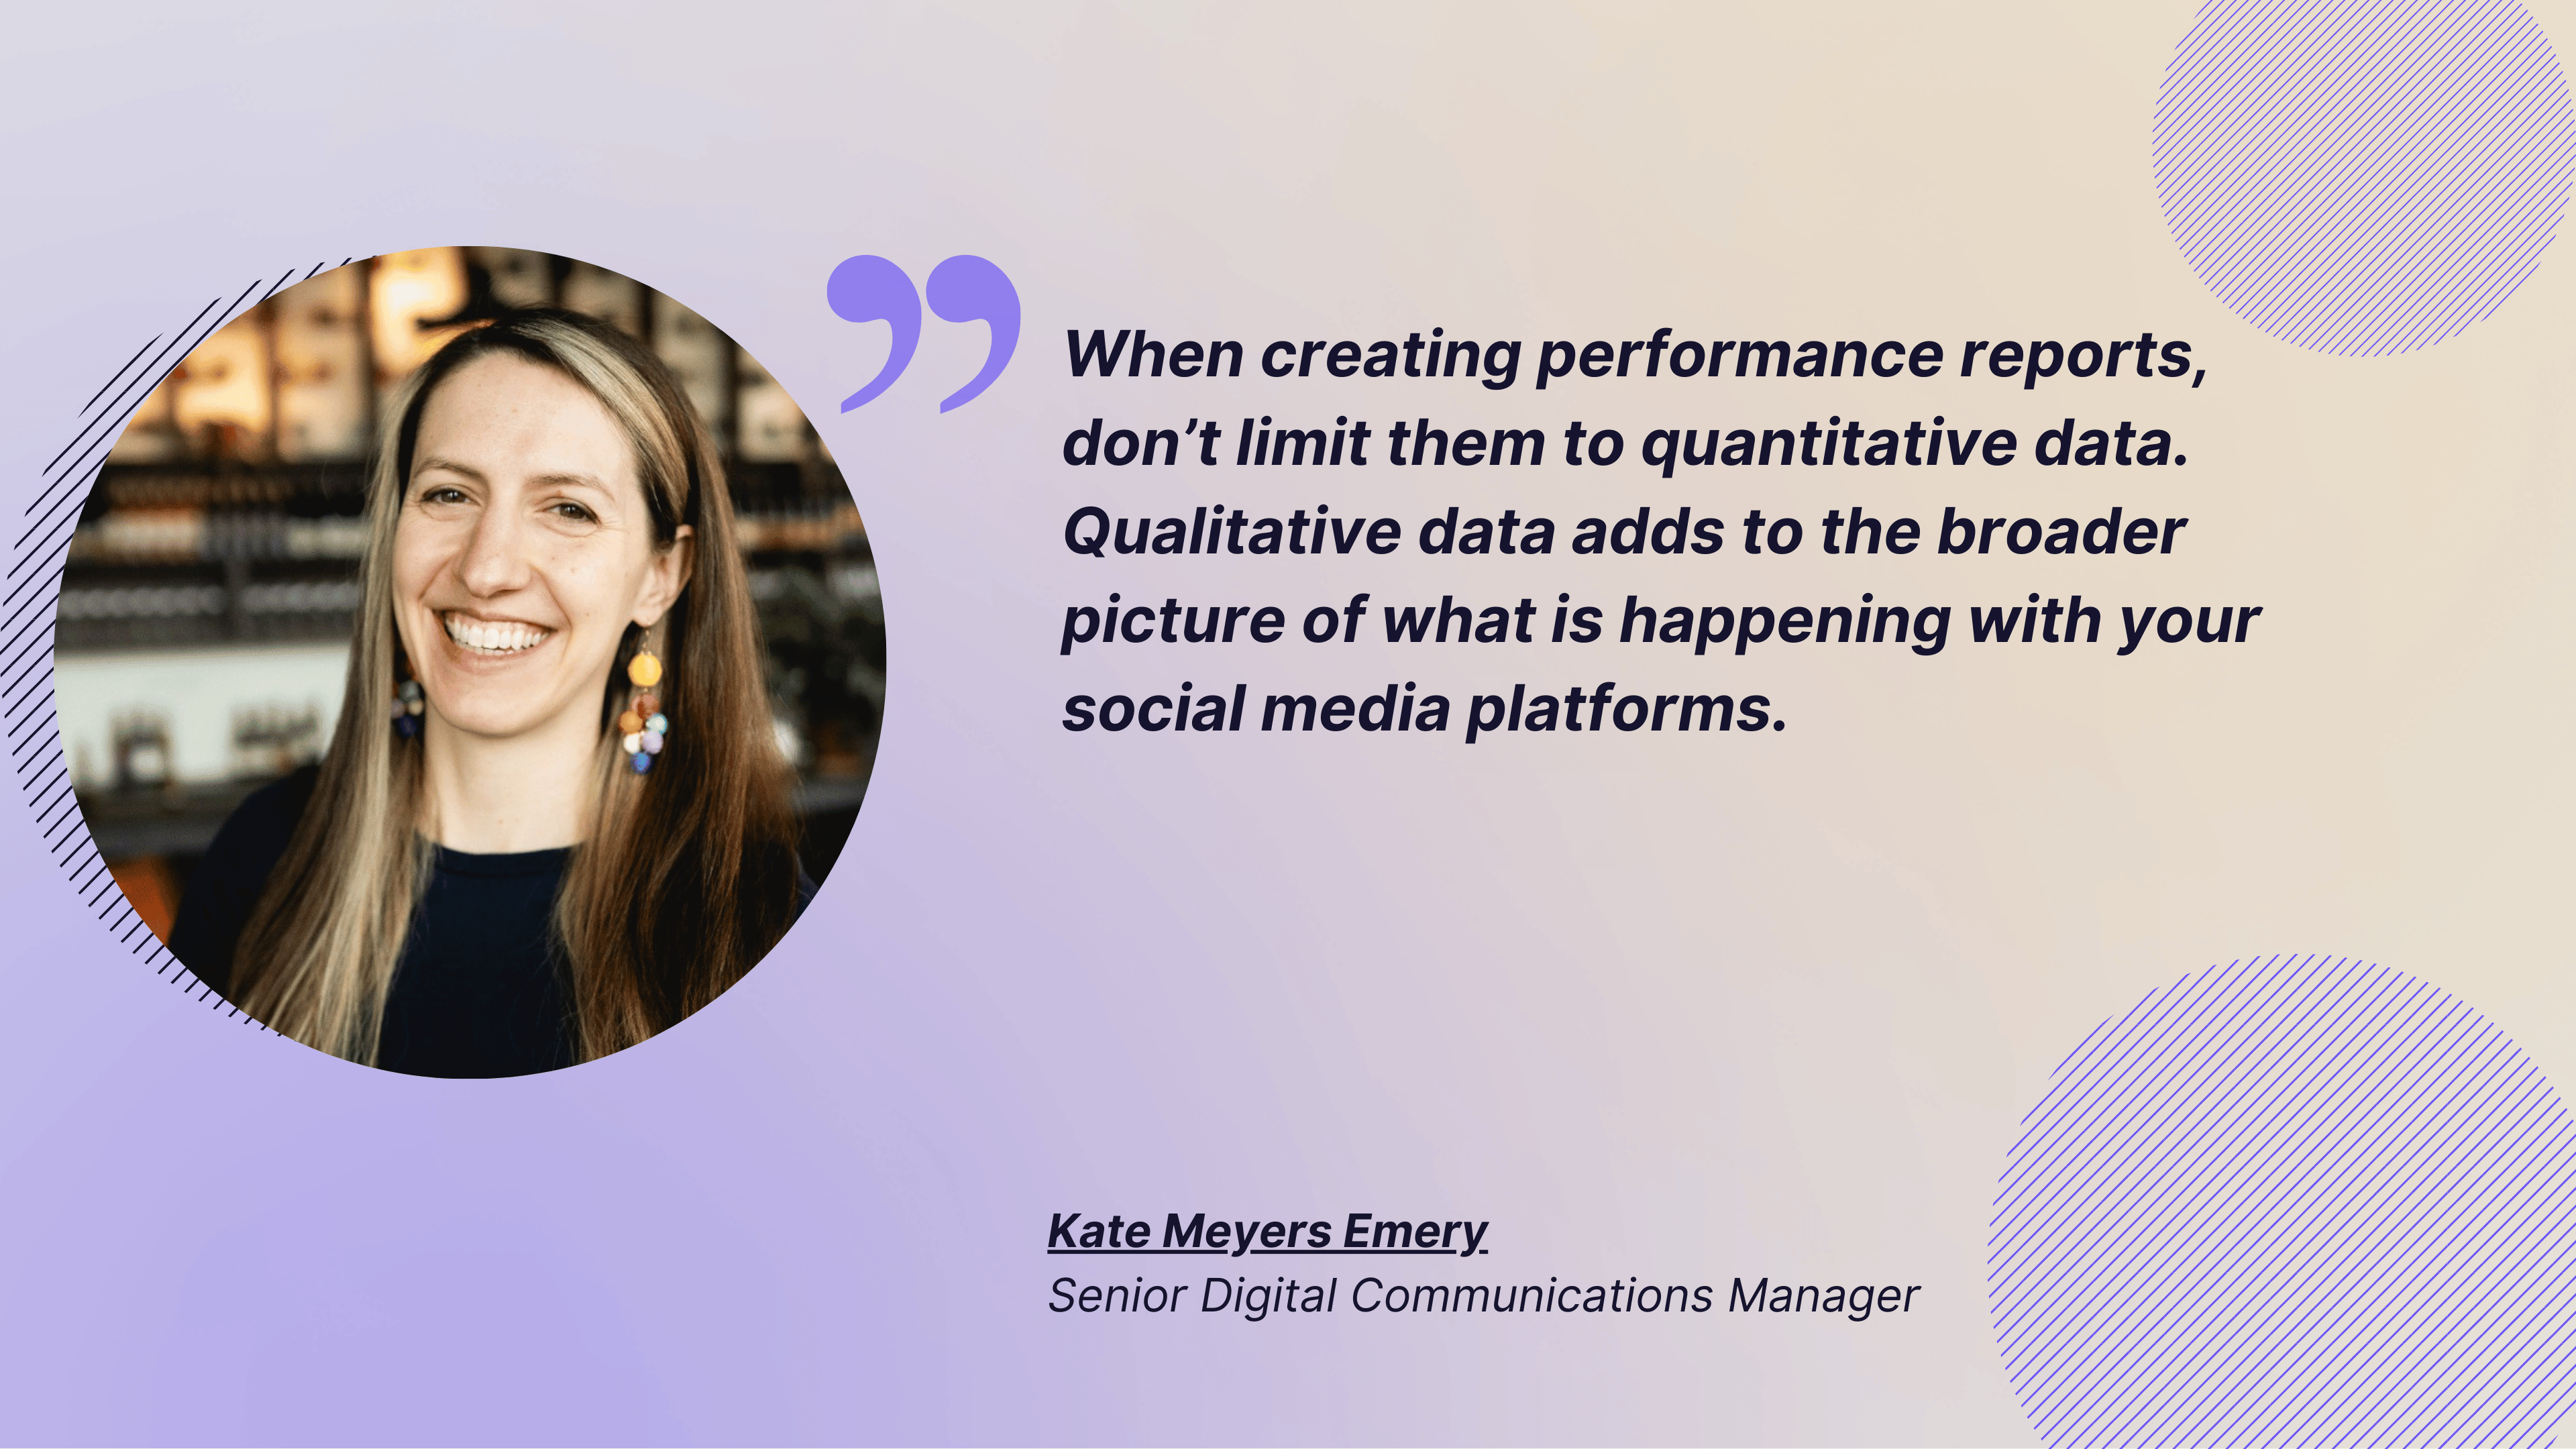
And here's a piece of advice Kate shared with me during our chat:
When creating performance reports, don’t limit them to quantitative data. Qualitative data adds to the broader picture of what is happening with your social media platforms. Include comments and reposts to show how folks are reacting to your content. Also consider adding information about what is happening in your industry, shifts to the algorithm, or the broader social/political world. Not only does it help explain why content analytics may be higher or lower, it also demonstrates your expertise.
6. Implement proper attribution
Attribution simply means knowing what actions on social media actually led to results.
Without it, data analytics in social media can be misleading. You might see traffic or conversions go up, but have no clear idea which platform, post, or format made it happen.
Proper attribution helps you connect social activity to real outcomes, like sign-ups, purchases, or downloads.
This usually means tracking links, using UTM parameters, and aligning social metrics with website or conversion data. When everything is connected, you can see which channels drive impact and which ones just create noise.
Most importantly, attribution changes how you optimize.
Instead of doubling down on content that looks good on the surface, you invest in what truly supports your goals.
7. Constantly run a competitive analysis
Competitive analysis works best when it’s ongoing, not occasional.
Social performance shifts fast, and without regular competitive monitoring, it’s easy to fall behind without noticing.
By using competitive analysis tools like Socialinsider, you can track competitors across platforms, content types, and KPIs. And most importantly, turn that data into a clear competitive analysis report you can actually use.
Below are the three ways I approach it.
Approach key KPIs benchmarking
I start by benchmarking core metrics: engagement rate, views, average engagement, and posting volume.
Competitive benchmarking helps me understand whether performance differences come from better content, higher frequency, or stronger audience response.
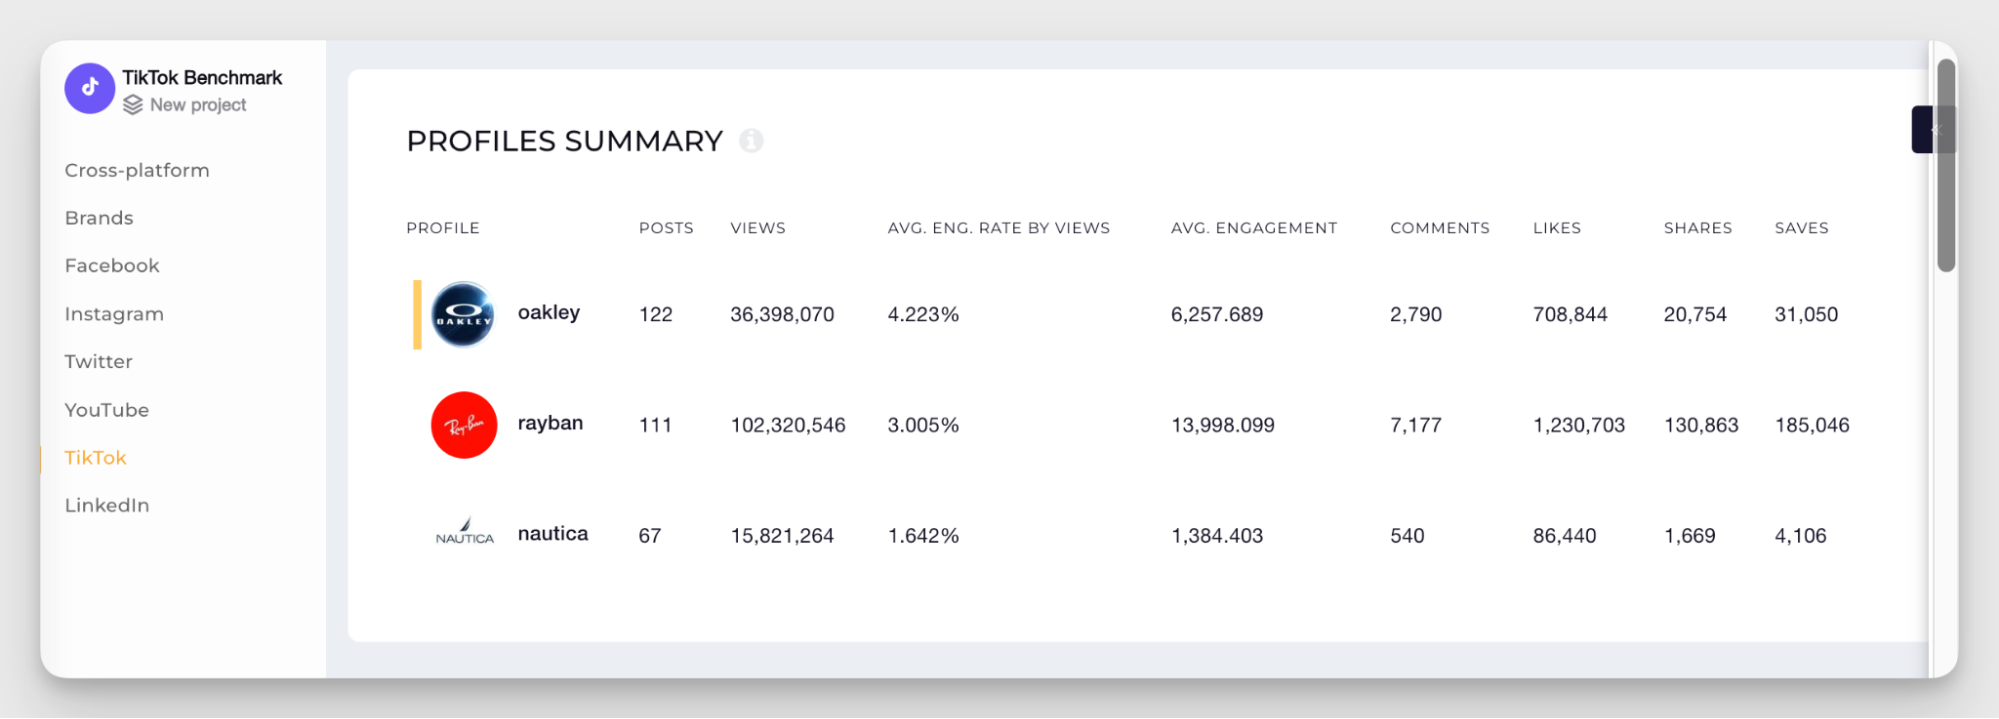
For me, this step sets a realistic performance baseline and highlights where efficiency (and not volume) makes the difference.
Best-performing content pillars comparison
Next, I compare content pillars across competitors to see which themes consistently drive engagement within my category.
From what I've seen, some pillars perform well across all brands, while others are clearly platform- or brand-specific.
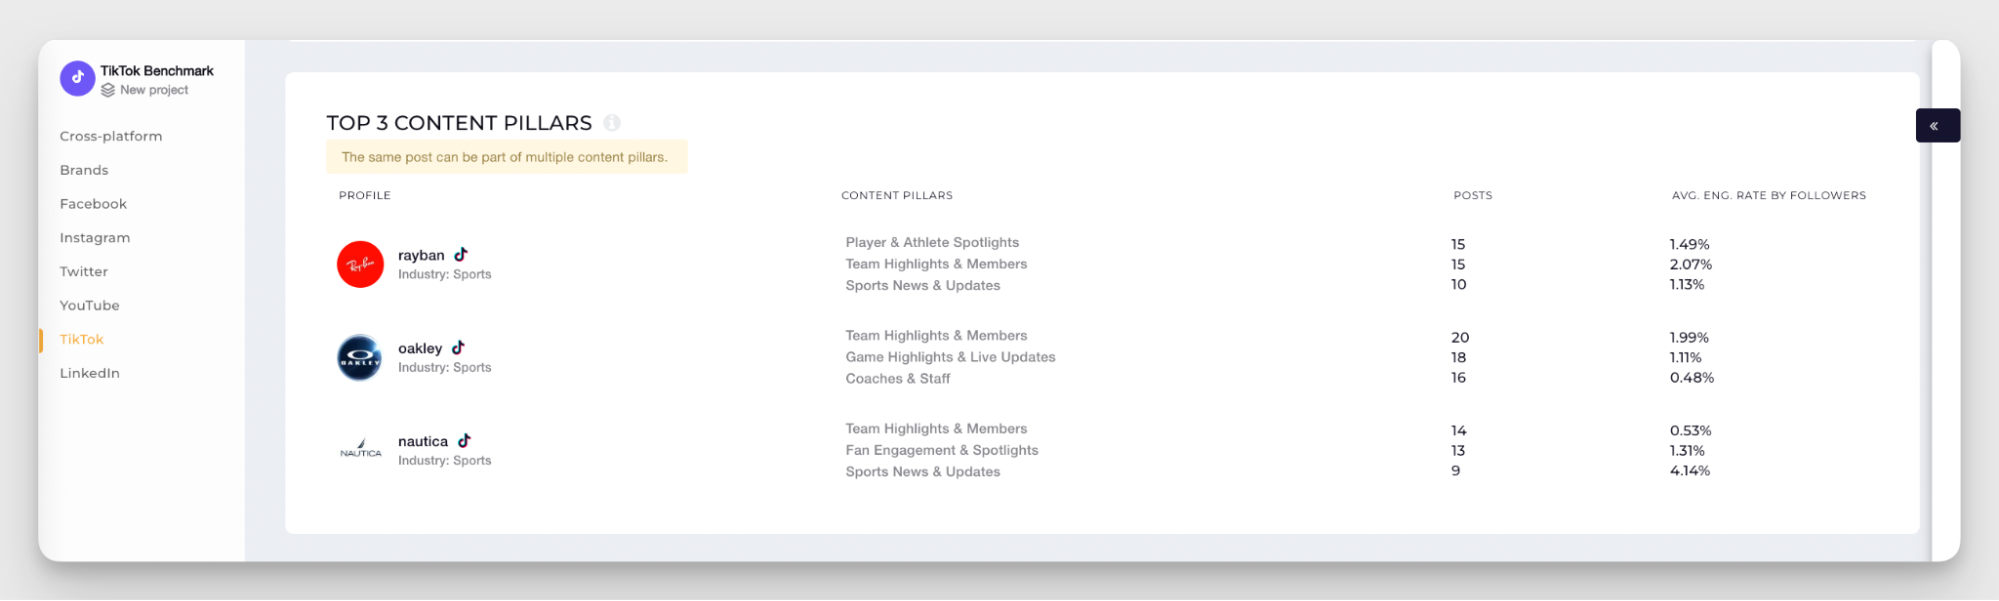
Now, this view helps me refine content pillars for social media without relying on assumptions or trends.
Most engaging post patterns
Finally, I analyze top-performing posts to identify recurring patterns: formats, storytelling styles, or recurring content structures.
This reveals what audiences repeatedly respond to—not just once, but over time.
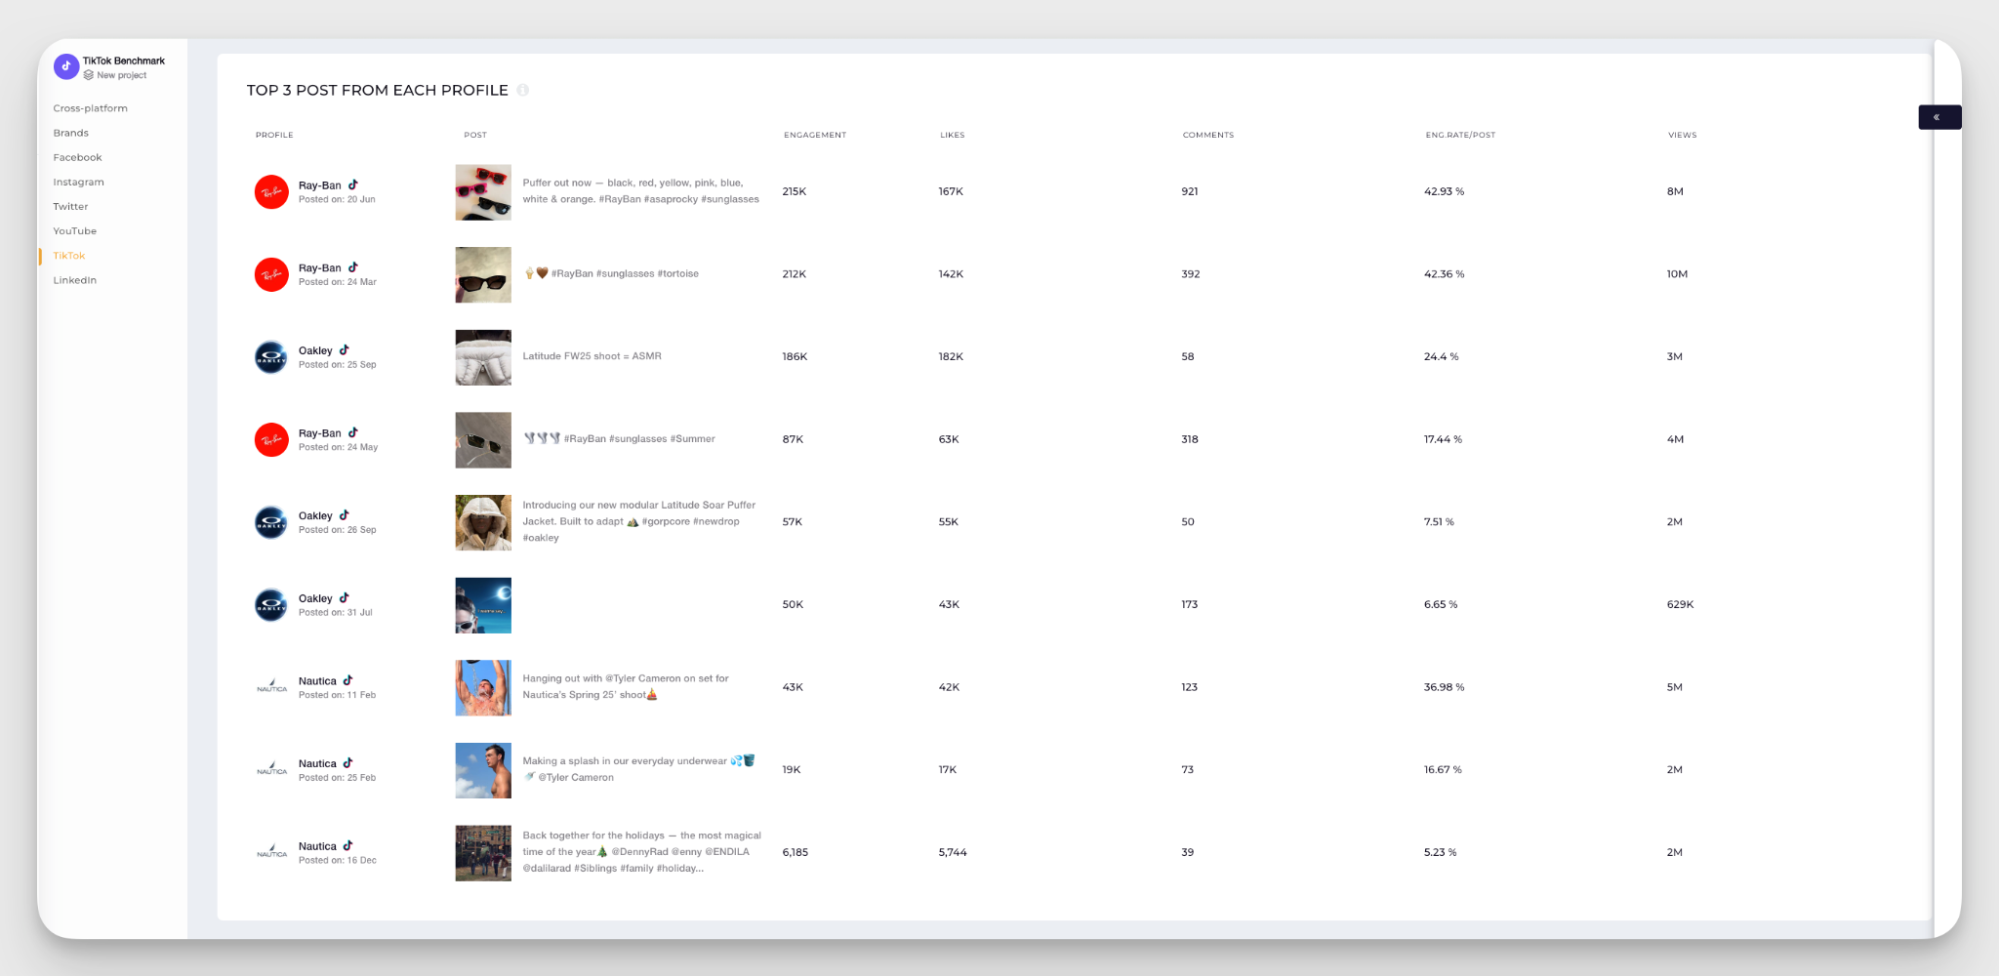
Together, this makes up for a social media competitor analysis that turns competitive data into a clear, actionable direction.
8. Use AI technologies to get strategy optimization insights
If you’ve ever wished you had a crystal ball for your social campaigns, today’s AI-powered tools are as close as it gets.
Artificial intelligence in social media analytics is changing the game—no more endless spreadsheets or manual number crunching. Instead, AI helps you spot patterns, predict trends, and uncover hidden opportunities straight from your social media data analytics.
Picture this: You’re analyzing last quarter’s content, and an AI-driven platform highlights a post that quietly sparked long-term engagement. This is data analytics in social media at its most dynamic—constantly learning, adapting, and transforming your workflow.
Embracing AI doesn’t just save you time—it turns mountains of data into clear, focused insights that keep your brand ahead of the curve
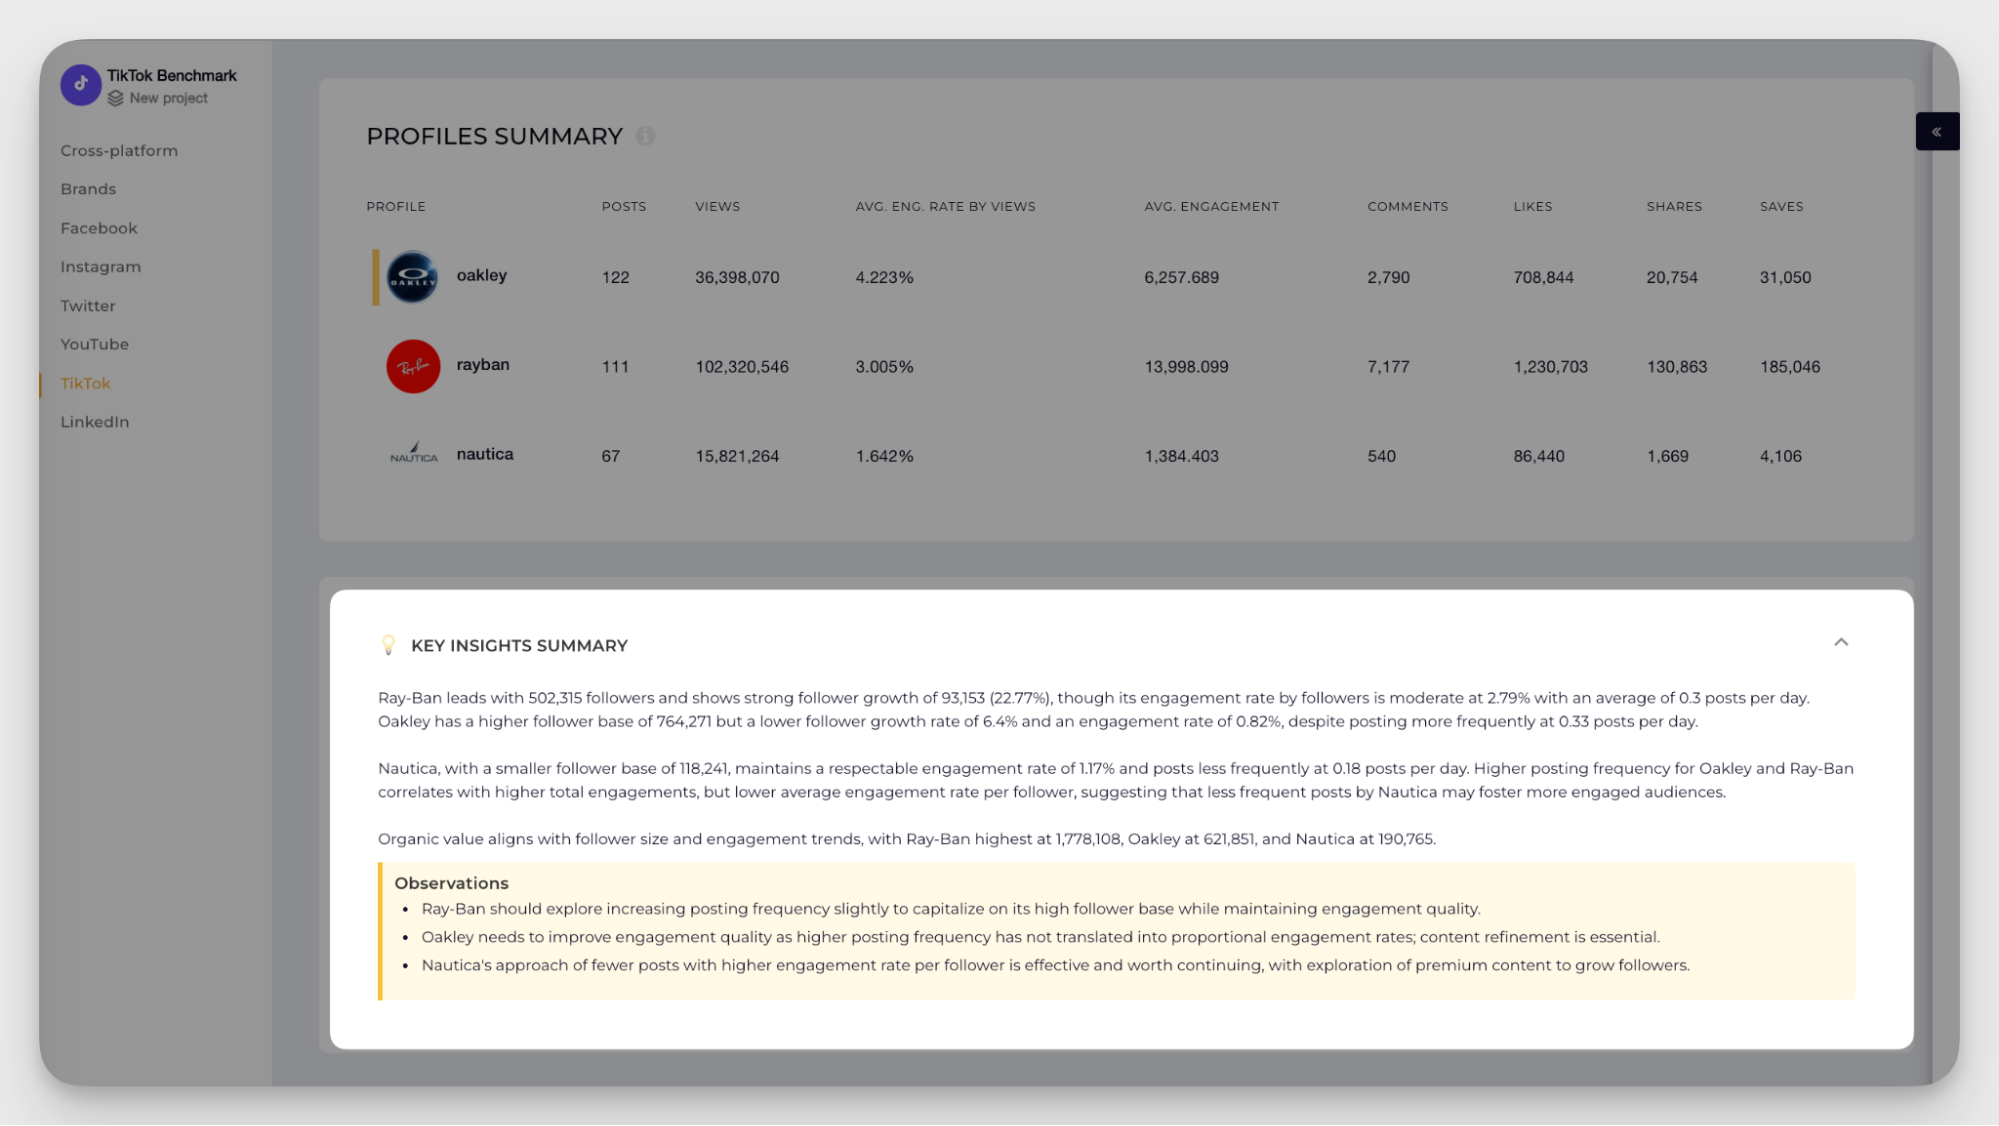
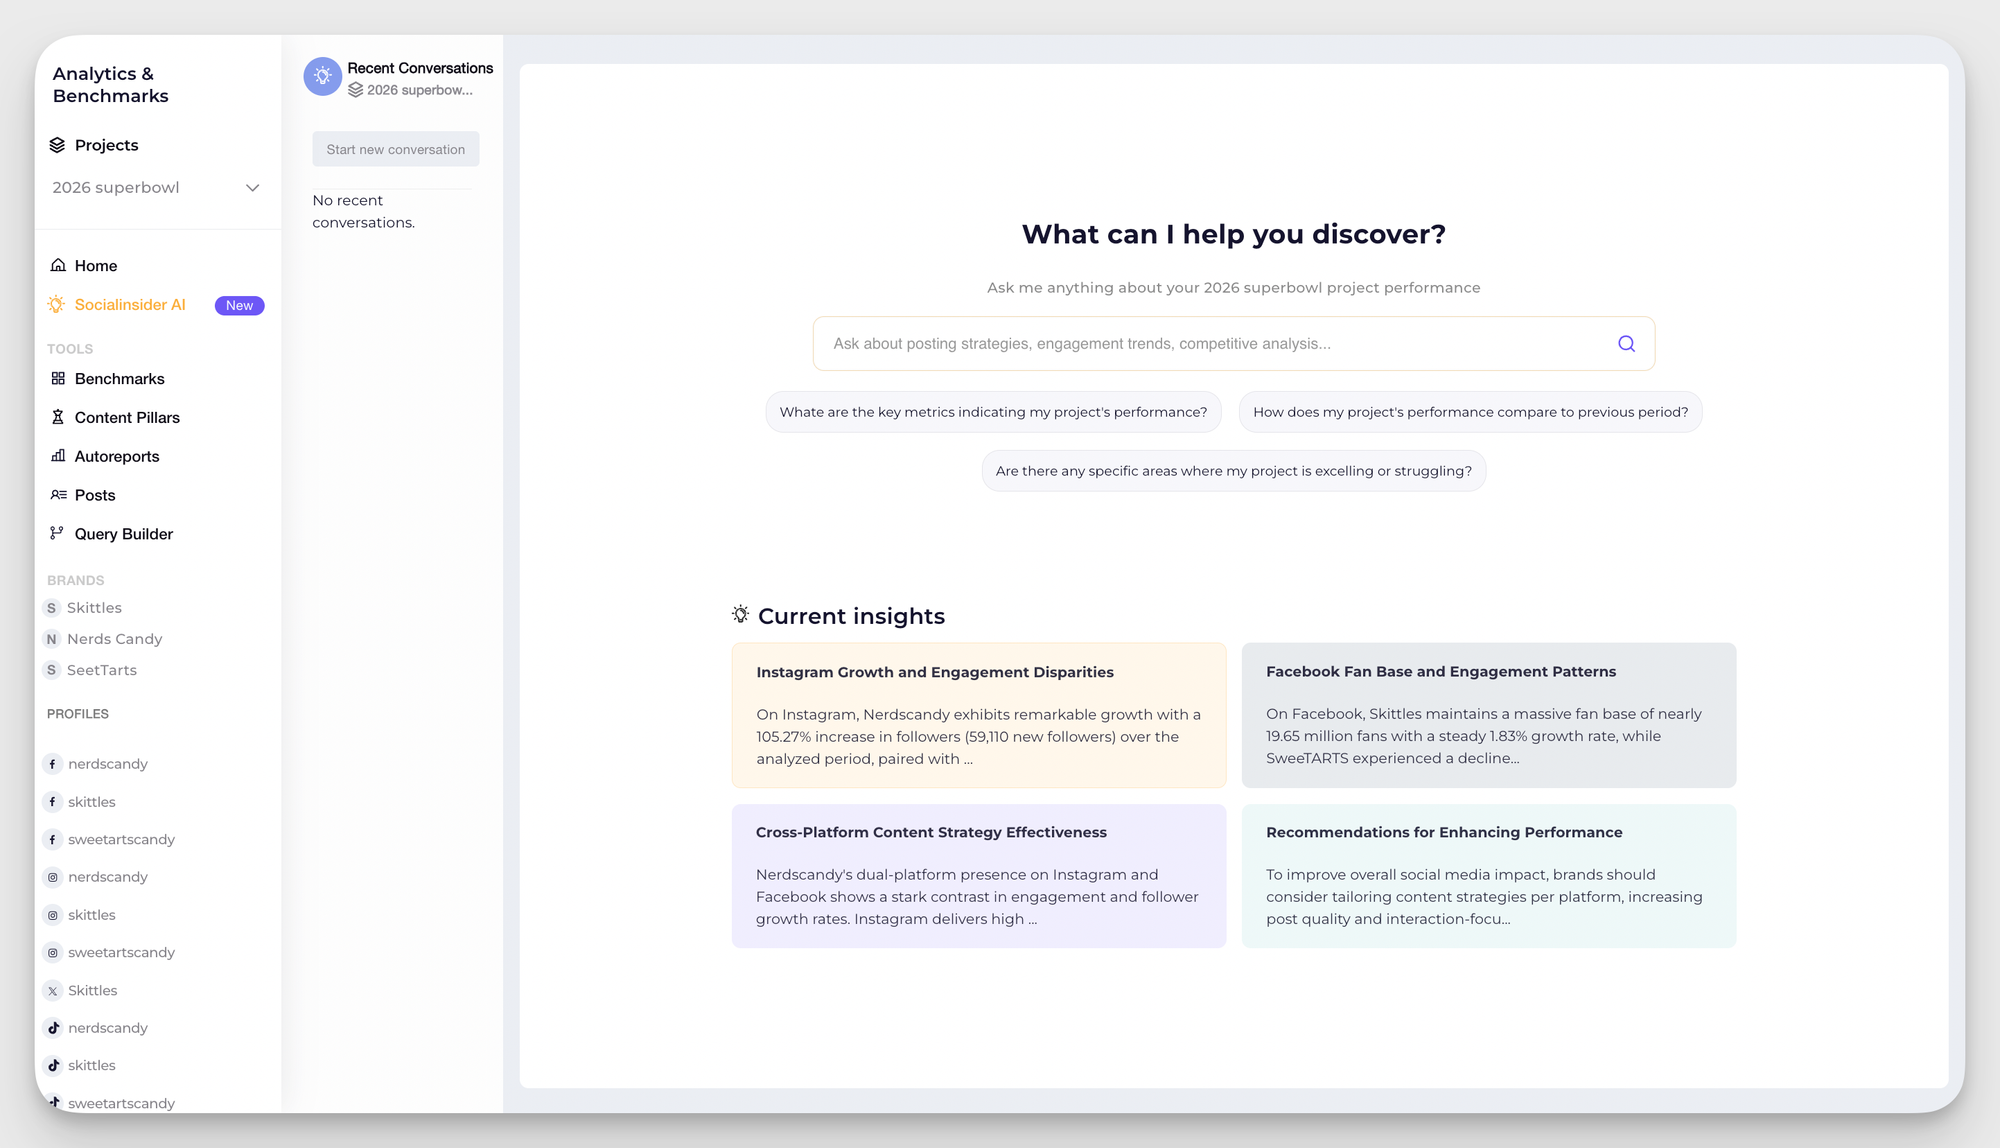
And luckily, Socialinsider includes an AI-based Key Insights Summary in every analysis. It automatically translates performance data into clear observations and recommendations, making it easier to move from reporting to action.
And this is just the beginning. Socialinsider also launched an AI social media assistant, designed to help teams ask questions, explore insights, and optimize strategy even faster without needing to be a data expert.
How to map different social media analytics data points to business goals?
As you’ve probably noticed already, the power of social media analytics lies in its ability to inform and optimize business strategy—if you know what to look for.
That’s why, to extract maximum value from social media analytics, it's essential to align your data collection efforts with clear, measurable business objectives.
Here’s how to effectively map analytics to your social media goals:
- Define clear social media objectives: Start by aligning your social media goals with broader business objectives. Whether your focus is increasing brand awareness, generating leads, driving conversions, or improving customer retention, clarity is essential. Clearly defined objectives help you determine what data to collect and prevent you from tracking metrics that don’t support meaningful outcomes.
- Identify the right metrics: Once your objectives are set, choose the metrics that directly reflect progress toward those goals. For example, lead generation efforts should prioritize conversion rates, cost per lead, and engagement quality, while brand awareness initiatives should focus on reach, share of voice, and audience sentiment. The key is selecting metrics that measure impact—not just activity.
- Leverage advanced segmentation: Use analytics tools to segment your audience based on demographics, behaviors, interests, or engagement patterns. Segmentation allows you to understand how different audience groups interact with your content and which segments drive the most valuable business outcomes. This deeper insight supports more precise targeting and content optimization.
- Optimize the customer journey: Social media analytics can reveal how users move from initial interaction to final conversion—and beyond. Track the full journey, from content engagement to post-purchase behavior, to identify friction points and optimization opportunities. Measuring the entire path ensures you understand how social media influences both immediate and long-term decisions.
- Refine strategy based on insights: Social media performance is constantly evolving. Use data insights to continuously test, adjust, and improve your strategy. Whether it’s refining targeting, experimenting with new content formats, or adjusting posting schedules, a responsive, data-driven approach ensures your efforts remain effective over time.
- Focus on long-term impact: While short-term metrics help guide tactical improvements, it’s crucial to evaluate social media’s contribution to long-term business value. Assess its impact on customer retention, lifetime value, and brand equity to ensure your strategy supports sustainable growth—not just temporary spikes in performance.
Here's Kate's perspective as well:
It's all about finding the link between what the goals are and what you can actually show on social media. This stage should be a conversation between the folks setting the goal and the folks who are doing social media. They way there's a realistic tie.
What are the top analytics metrics you should track on each social platform?
Not all metrics mean the same thing across platforms.
If your social media content strategy is driven by surface-level numbers only, you’ll miss the signals that actually show why content works (or doesn’t).
This is where smart social media data analytics comes in: focusing on the metrics that reflect real attention, intent, and conversation.
Here’s what to track on each major platform:
Instagram: saves & shares (not just likes)
Likes are easy. Saves and shares take intent.
If people are saving your post, it means your content is valuable enough to come back to. If they’re sharing it, it resonated so strongly they wanted someone else to see it too.
TikTok: average watch time & completion rate
On TikTok, attention is everything.
Average watch time shows whether your hook is working and if people stay past the first few seconds. Completion rate tells you if your content is strong enough to keep viewers until the end.
High numbers here signal to the algorithm—and to you—that your content is worth pushing further.
LinkedIn: engagement rate & comments
Forget quick reactions. LinkedIn is about thoughtful interaction.
Comments matter more than likes because they show your content sparked a conversation. Pair that with engagement rate to understand how well your posts perform relative to reach.
These metrics help you refine a more intentional, value-driven content strategy.
Facebook: meaningful interactions & video retention
Facebook prioritizes depth over volume.
Meaningful interactions (comments, shares, longer reactions) indicate real interest, while video retention shows where people stay engaged or drop off.
Together, these metrics help you shape content that keeps people watching and participating, not just scrolling.
Twitter/X: link clicks & replies
Twitter/X thrives on action and dialogue.
Link clicks show whether your content drives curiosity beyond the platform, while replies reveal how often your posts invite conversation. If people are responding, you’re doing more than broadcasting, you’re actually connecting.
And here's Kate's input for that matter:
It all goes back to the goals for each platform! For example, at Candid, we're trying to increase brand awareness and build community on LinkedIn; so I'm looking at follower count, engagement, engagement rate, and meaningful comments. However, on Instagram, we're looking to be useful and helpful, so we focus more on comments, saves, and shares.
Final thoughts
Here’s the honest truth: the brands pulling ahead are paying closer attention.
They look at what worked last week, not last quarter. They spot patterns early. They adjust before performance drops, not after. That’s what social media analytics is really for.
So don’t wait for the perfect report. Pick one insight. Act on it. Then check again. That loop is the strategy.
Start there.
FAQs on social media analytics best practices
How often to analyze competitors? (monthly deep dives vs. weekly monitoring)
Check competitors weekly for ongoing monitoring, and run a full competitive analysis every 6 months (or at least once a year) to guide strategy and planning.
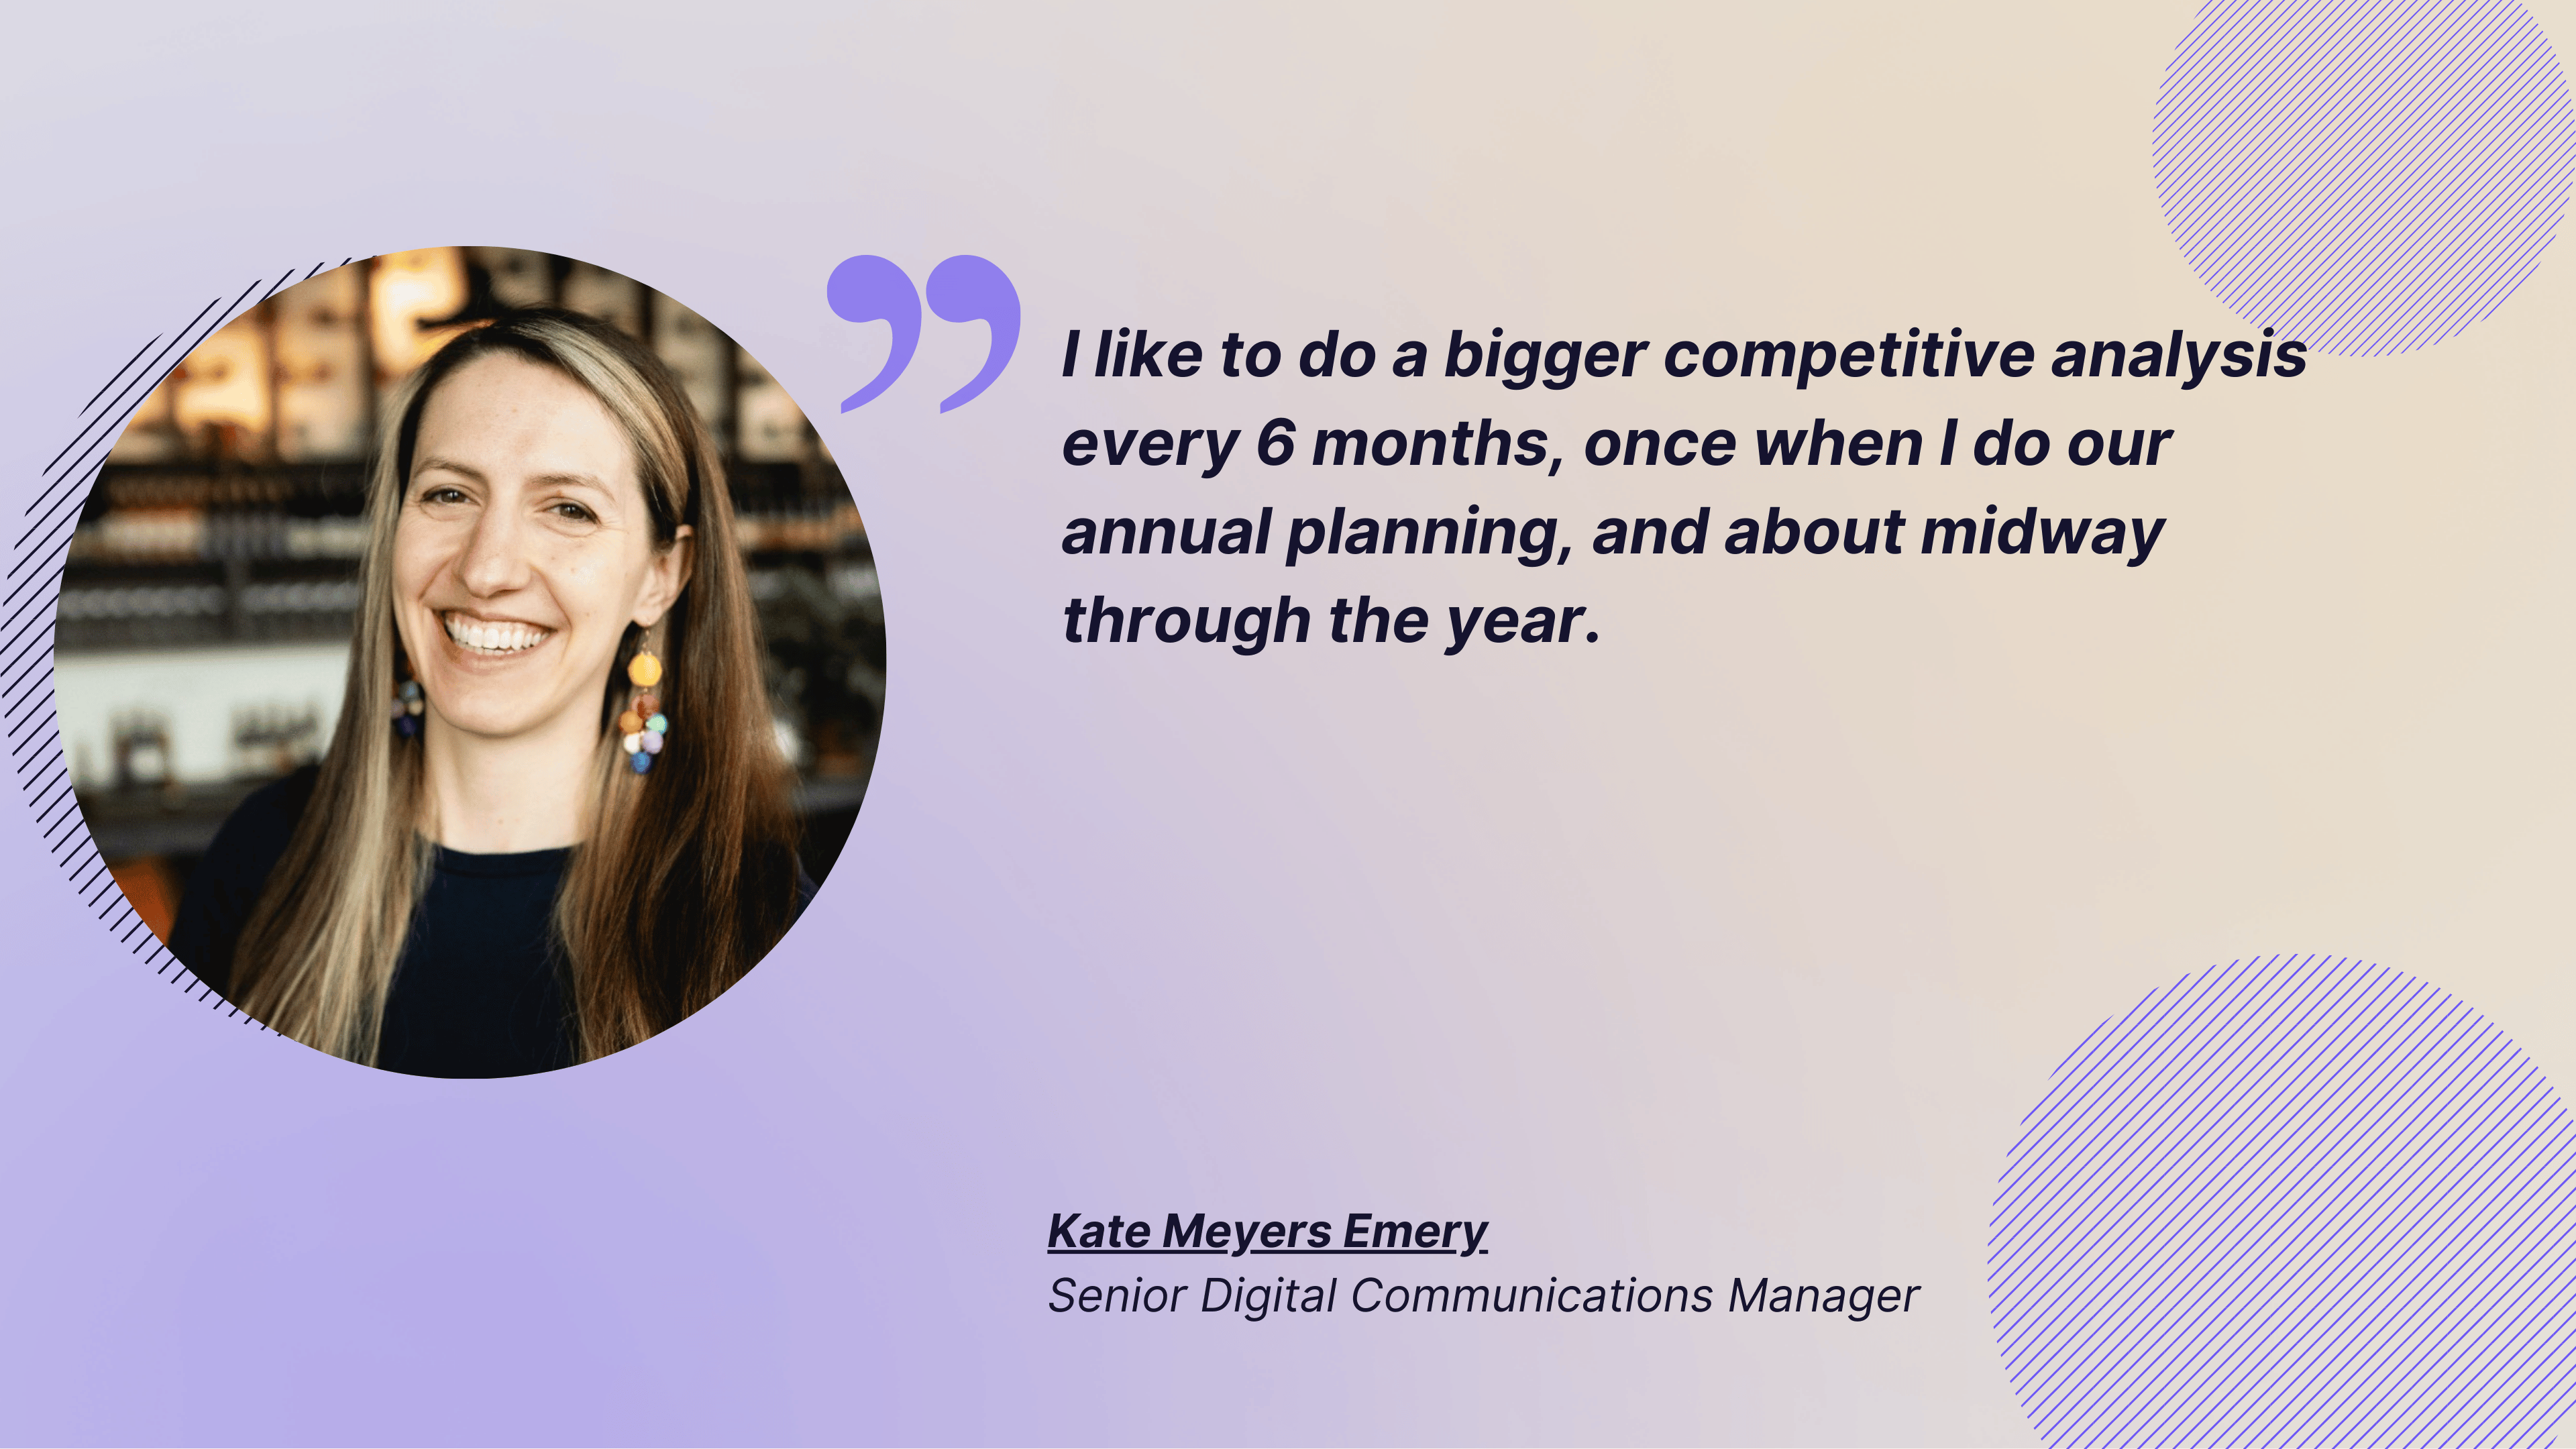
My advice? Follow Kate's strategy:
I like to do a bigger competitive analysis every 6 months, once when I do our annual planning, and about midway through the year. However, I’ll check in regularly to see what they are doing and how their audience is reacting. I may check more frequently if something happens in our industry and I want to see how they are responding.
How to use analytics for content ideation?
Use analytics to spot patterns in top-performing posts (formats, topics, hooks, and timing). Then turn those patterns into repeatable content ideas. Focus on what consistently drives engagement, not one-off viral wins.
Here's how Kate approaches it, for example:
At Candid, we routinely look at what content is at the top and which is at the bottom. When we notice content has been at the bottom for a bit, that’s a sign that we need to reimagine or experiment with it in a new way. If a content type is doing really well, we may double down on it and try producing more.
How to link social analytics to website traffic and conversions?
Connect social analytics to website results by using UTM links, tracking social referral traffic in analytics tools, and measuring conversions tied to those visits. This lets you see which posts and platforms actually drive clicks, sign-ups, or sales.
Anda Radulescu
Content writer & copywriter with a 5-year track record in digital marketing. Equal parts keen observer & committed go-getter. A proud cat mom with a passion for music & exploring the world.

Know what your competitors do — before your manager asks
Get instant social benchmarks & reports without manual work.
You might also like


Improve your social media strategy with Socialinsider!
Use in-depth data to measure your social accounts’ performance, analyze competitors, and gain insights to improve your strategy.