Cross-Platform Analytics: 5 Tested Tools And Measurement Insights
Ace cross-platform analytics measurement with the best tools and get insights into how to turn data into action for generating better results.

Do you open five different dashboards to see how your brand is performing across platforms?
Not anymore. Enters the picture: powerful cross-platform analytics tools.
In this guide, we’ll explore how to approach cross-platform analytics in a way that feels structured, actionable, and genuinely useful.
From choosing the right tools to building workflows that connect data across channels, you’ll learn how to turn fragmented cross-platform social media marketing data into insights you can confidently act on.
Key takeaways
-
How can a cross-platform social media analysis shape a brand’s social strategy? Cross-platform analysis helps brands identify audience behaviors, content patterns, and channel roles across the entire ecosystem, enabling more intentional and effective social strategies.
-
Why are single-platform metrics misleading in a reporting context?
Single-platform metrics can create a distorted view of success because they lack the broader context needed to understand how different channels contribute to overall business outcomes. -
How can you successfully set a cross-platform analytics measurement system? A successful cross-platform measurement system starts with clear business goals, platform-specific benchmarks, the right analytics tools, and a consistent reporting process.
How can a cross-platform social media analysis shape a brand’s social strategy?
I’ve seen brands spend weeks optimizing content for one platform, only to realize the real momentum was happening somewhere else entirely.
That’s the value of cross-platform social media analytics. It changes the way you look at performance.
Instead of asking, “How did this Instagram post do?” you start asking bigger, smarter questions:
- Which content themes travel well across channels?
- Where does engagement turn into actual action?
- Which platform starts the conversation, and which one finishes it?
These answers shape social media strategy in a completely different way.
Cross-platform social media analysis also helps teams spot patterns faster. You notice creative fatigue earlier. You identify which formats deserve more budget. You understand where your audience wants education, entertainment, or community.
Over time, your strategy becomes intentional instead of reactive to individual platform spikes.
Why single-platform metrics are misleading in a reporting context?
Single-platform reporting can make almost anything look successful.
A spike in engagement. A jump in followers. A viral post everyone screenshots for the monthly report.
Then you zoom out.
Traffic stayed flat. Conversions came from another channel. Video retention dropped. Audience growth slowed everywhere else.
That’s the danger of isolated metrics. They tell partial stories with full confidence.
Every platform rewards different behaviors. Instagram loves saves and shares while TikTok rewards watch time and replays. Looking at one platform alone can easily distort how content is actually performing across your wider social ecosystem.
I think this is where cross-platform social media performance insights becomes incredibly valuable. It adds context.
With social media analytics tools like Socialinsider, you can view aggregated performance data across channels while still keeping platform-specific metrics separate and clear.
Challenges of unifying metrics across social platforms
Cross-platform analytics sounds simple until you start comparing metrics. That’s when things get messy.
Every social platform defines success differently. Even the same metric can mean completely different things depending on where you’re measuring it.
Take engagement rate. On Instagram, engagement rate is often calculated using followers or reach. On TikTok, it’s commonly calculated using views. Suddenly, two posts with identical engagement numbers can tell completely different performance stories.
And that’s just one metric. Views, impressions, watch time, reach, clicks — every platform has its own logic, formulas, and priorities. A ‘view’ on one platform may count after a few seconds. Another platform counts it almost instantly.
I’ve found that the real challenge isn’t gathering the data anymore. Most tools can do that. The difficult part is interpreting the data fairly.
Cross-platform data works best when marketers stop chasing perfectly identical benchmarks and start focusing on patterns, behaviors, and directional insights. Remember, the goal is clarity and not forcing every platform into the same measurement framework.
Best cross-platform social media analytics tools on the market
Cross-platform analytics can be difficult to measure and analyze, especially if you don’t have the right tech stack in place. Here are some of the best cross-platform social media analytics tools in the market in 2026.
1. Socialinsider
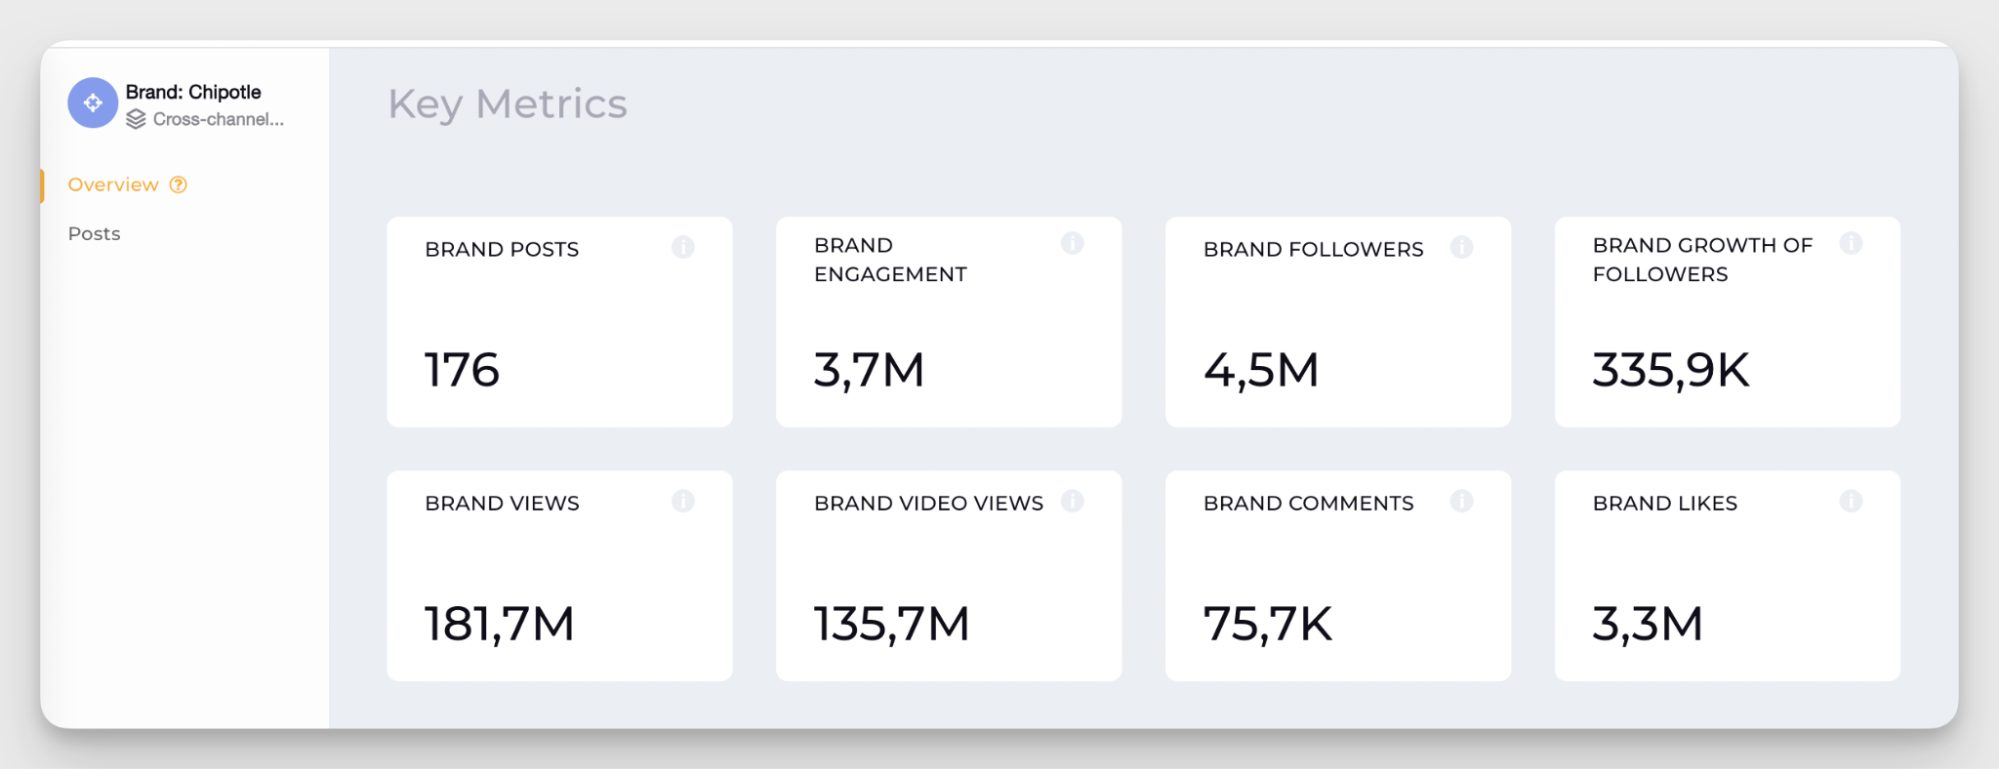
Socialinsider is a social media analytics platform built for cross-platform analytics — aggregating performance data from Instagram, TikTok, Facebook, LinkedIn, YouTube, and X into a single dashboard without requiring manual exports from each native platform.
Social media leaders use Socialinsider to measure cross-platform engagement rate, follower growth, reach, video views, content pillar performance, and organic value in a unified view. The Brands feature aggregates all of a brand's social profiles across platforms, and the competitive benchmarking layer adds context by showing how cross-platform performance compares to competitors and industry averages.
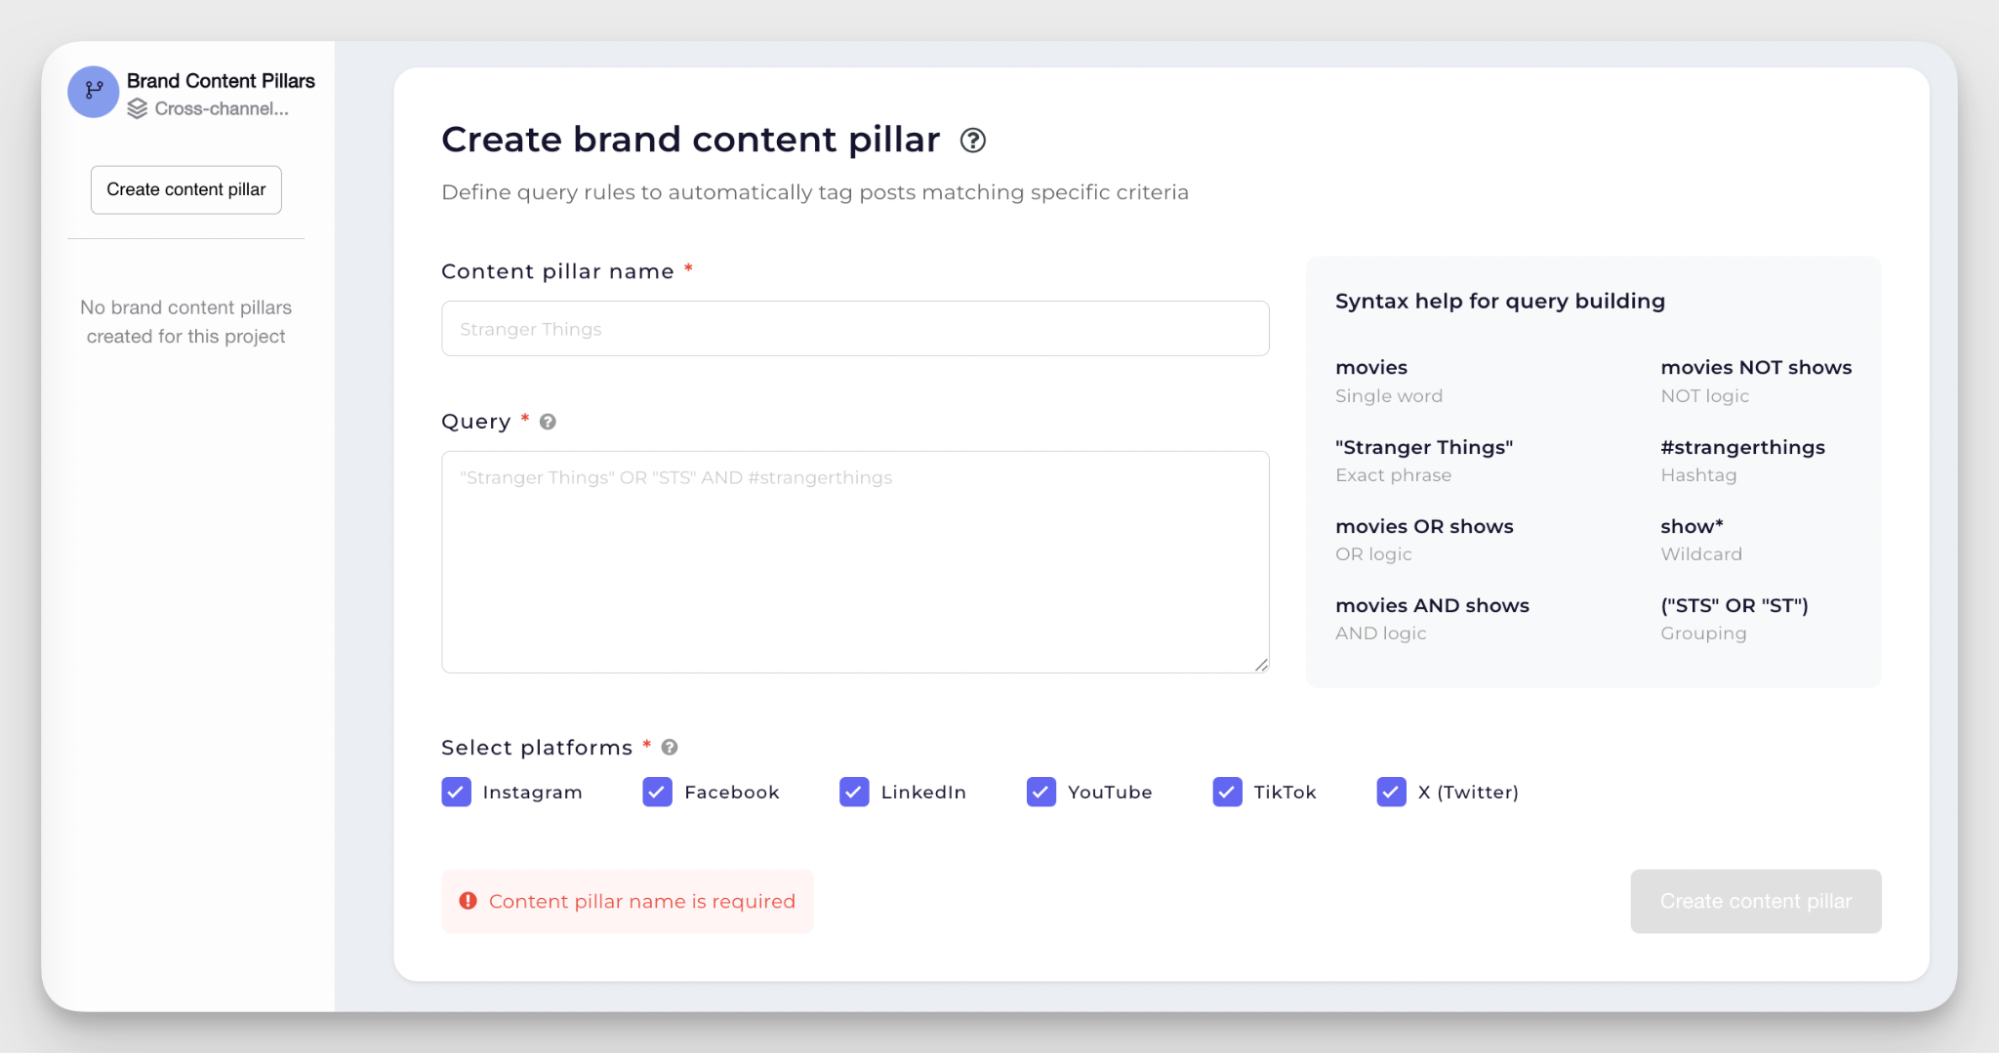
One capability that stands out to me is the Query Builder. It allows teams to track specific campaigns, keywords, hashtags, or content groups across multiple social channels. That creates a much cleaner way to measure campaign impact without manually sorting through platform-native analytics.
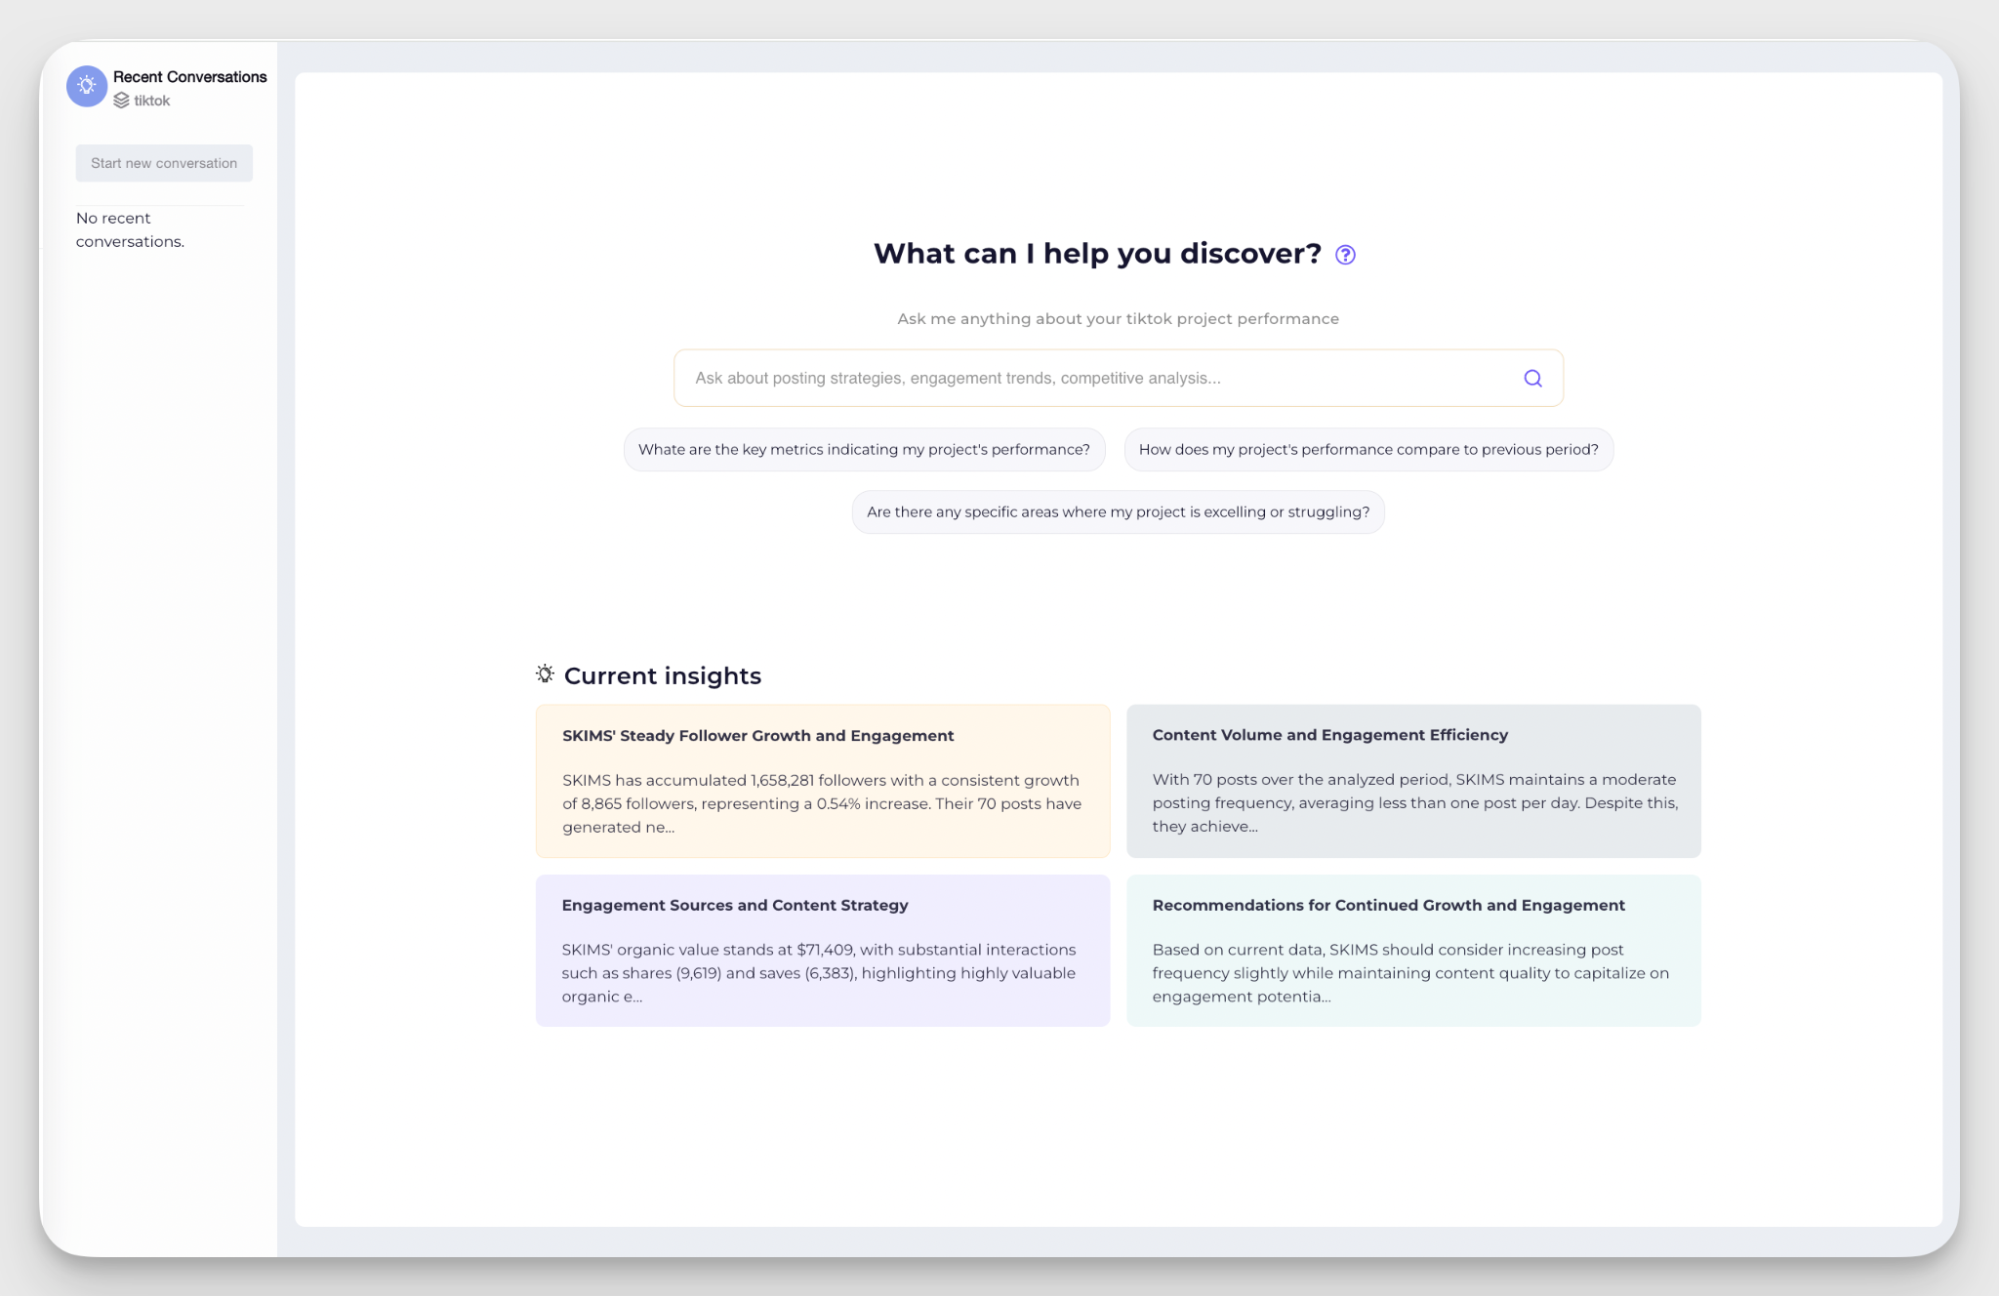
Socialinsider also offers an AI-powered assistant that helps interpret cross-platform data patterns and surface strategic recommendations.
Instead of simply showing dashboards, it helps marketers understand why performance changed and what actions may improve future results.
Available metrics:
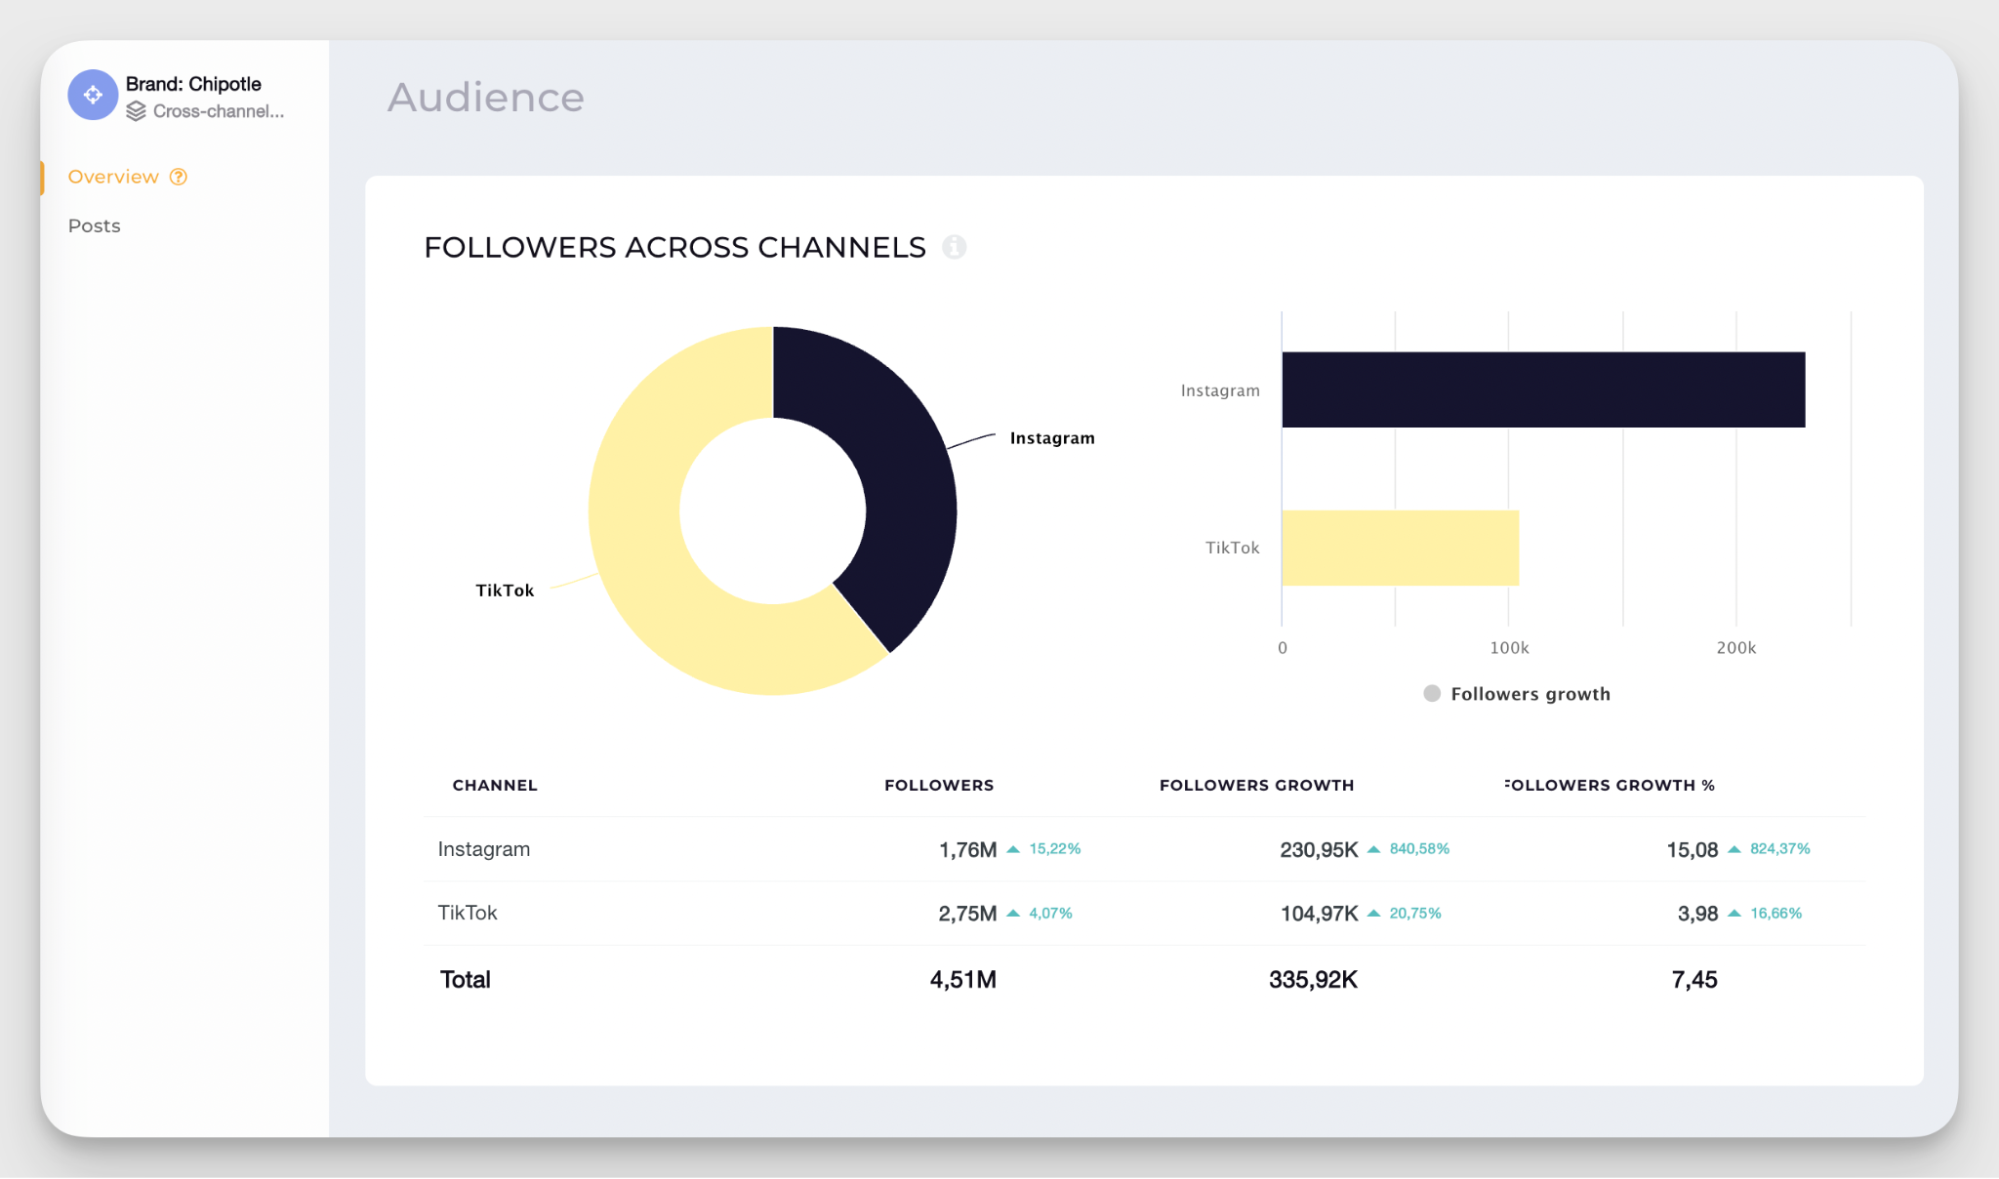
- Audience analytics: Track follower growth, audience evolution, and community trends across platforms.
- Engagement metrics: Analyze engagement rates, interactions, shares, comments, and platform-specific engagement behaviors.
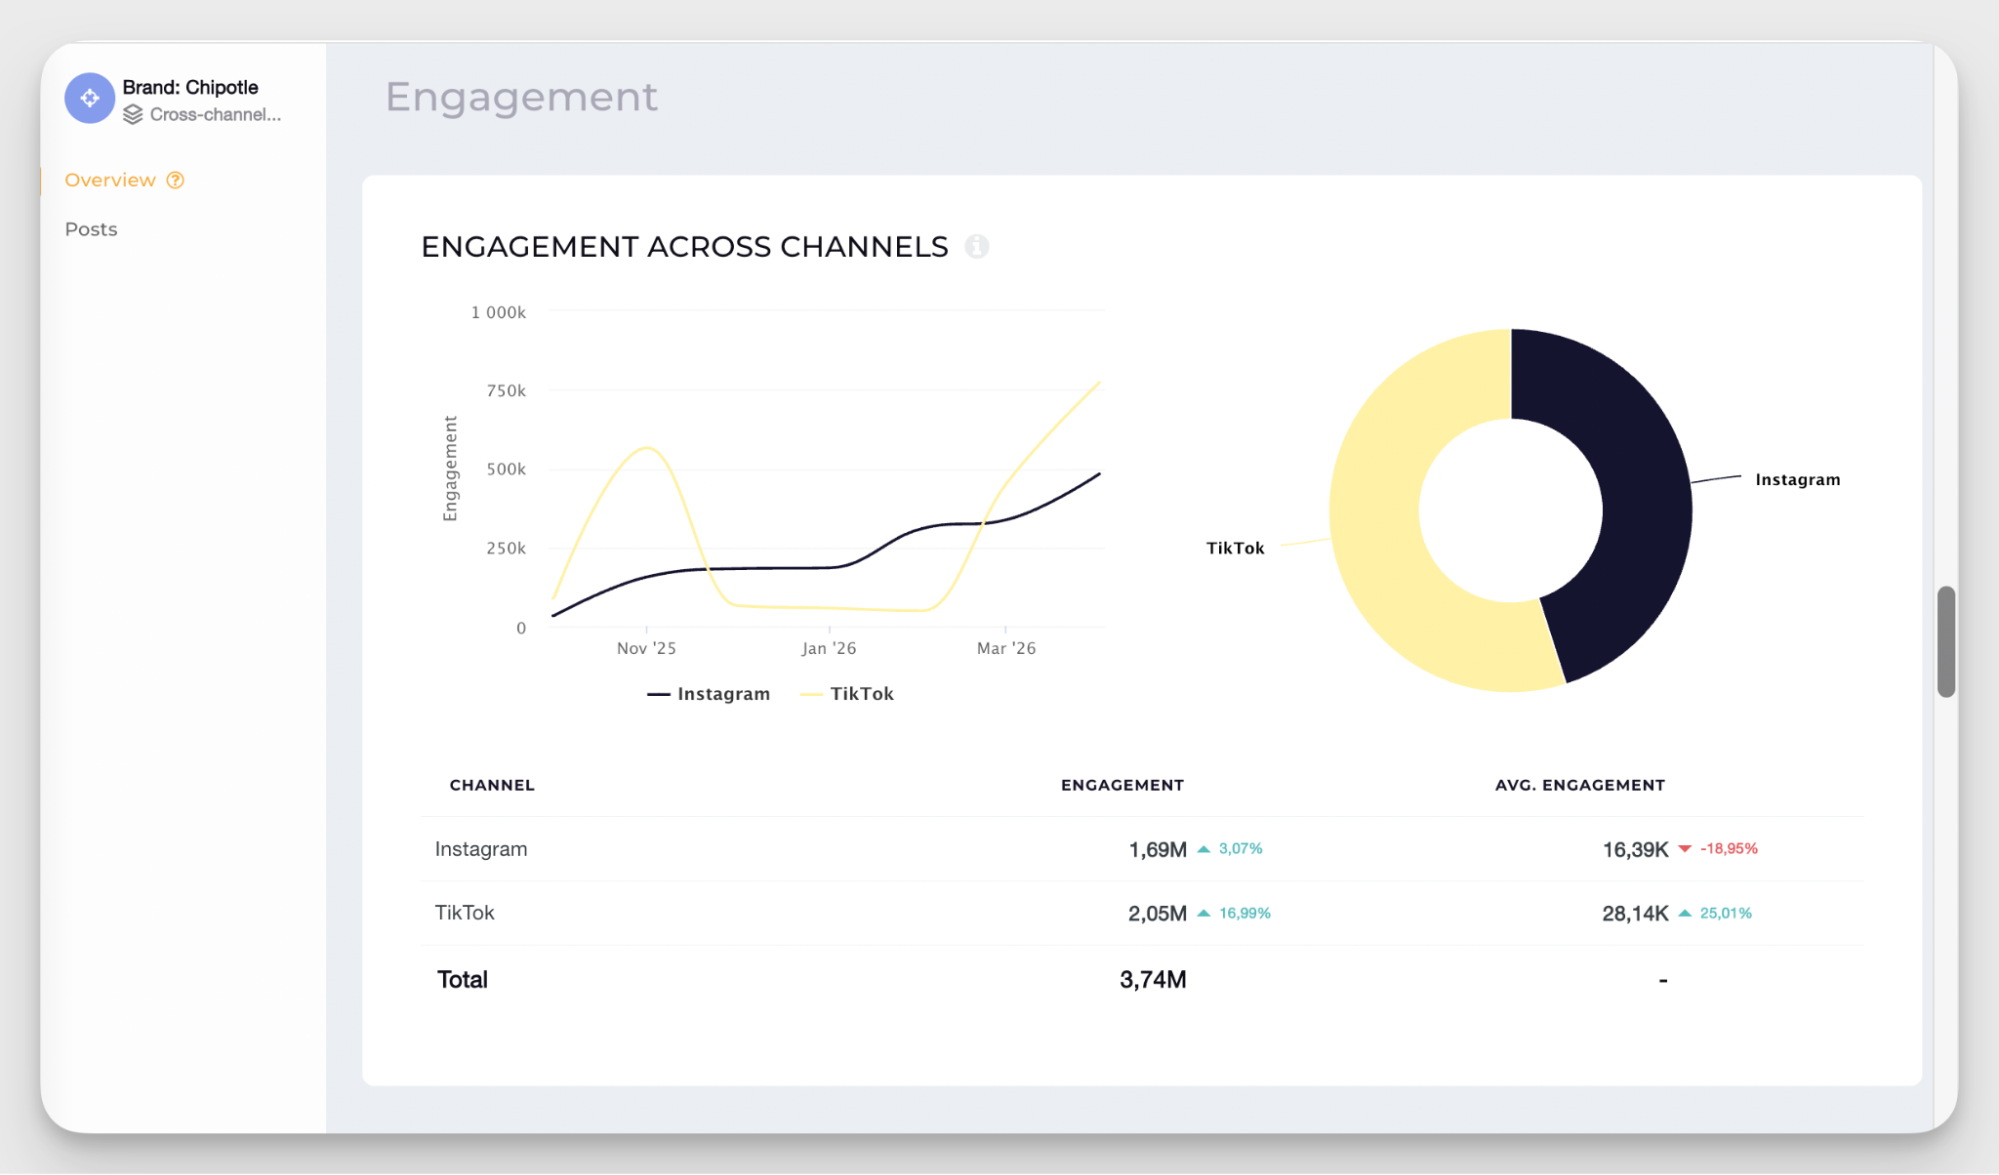
- Video views: Understand how video content performs across channels and compare engagement patterns.
- Top-performing posts: Quickly identify which posts generated the strongest results across platforms.
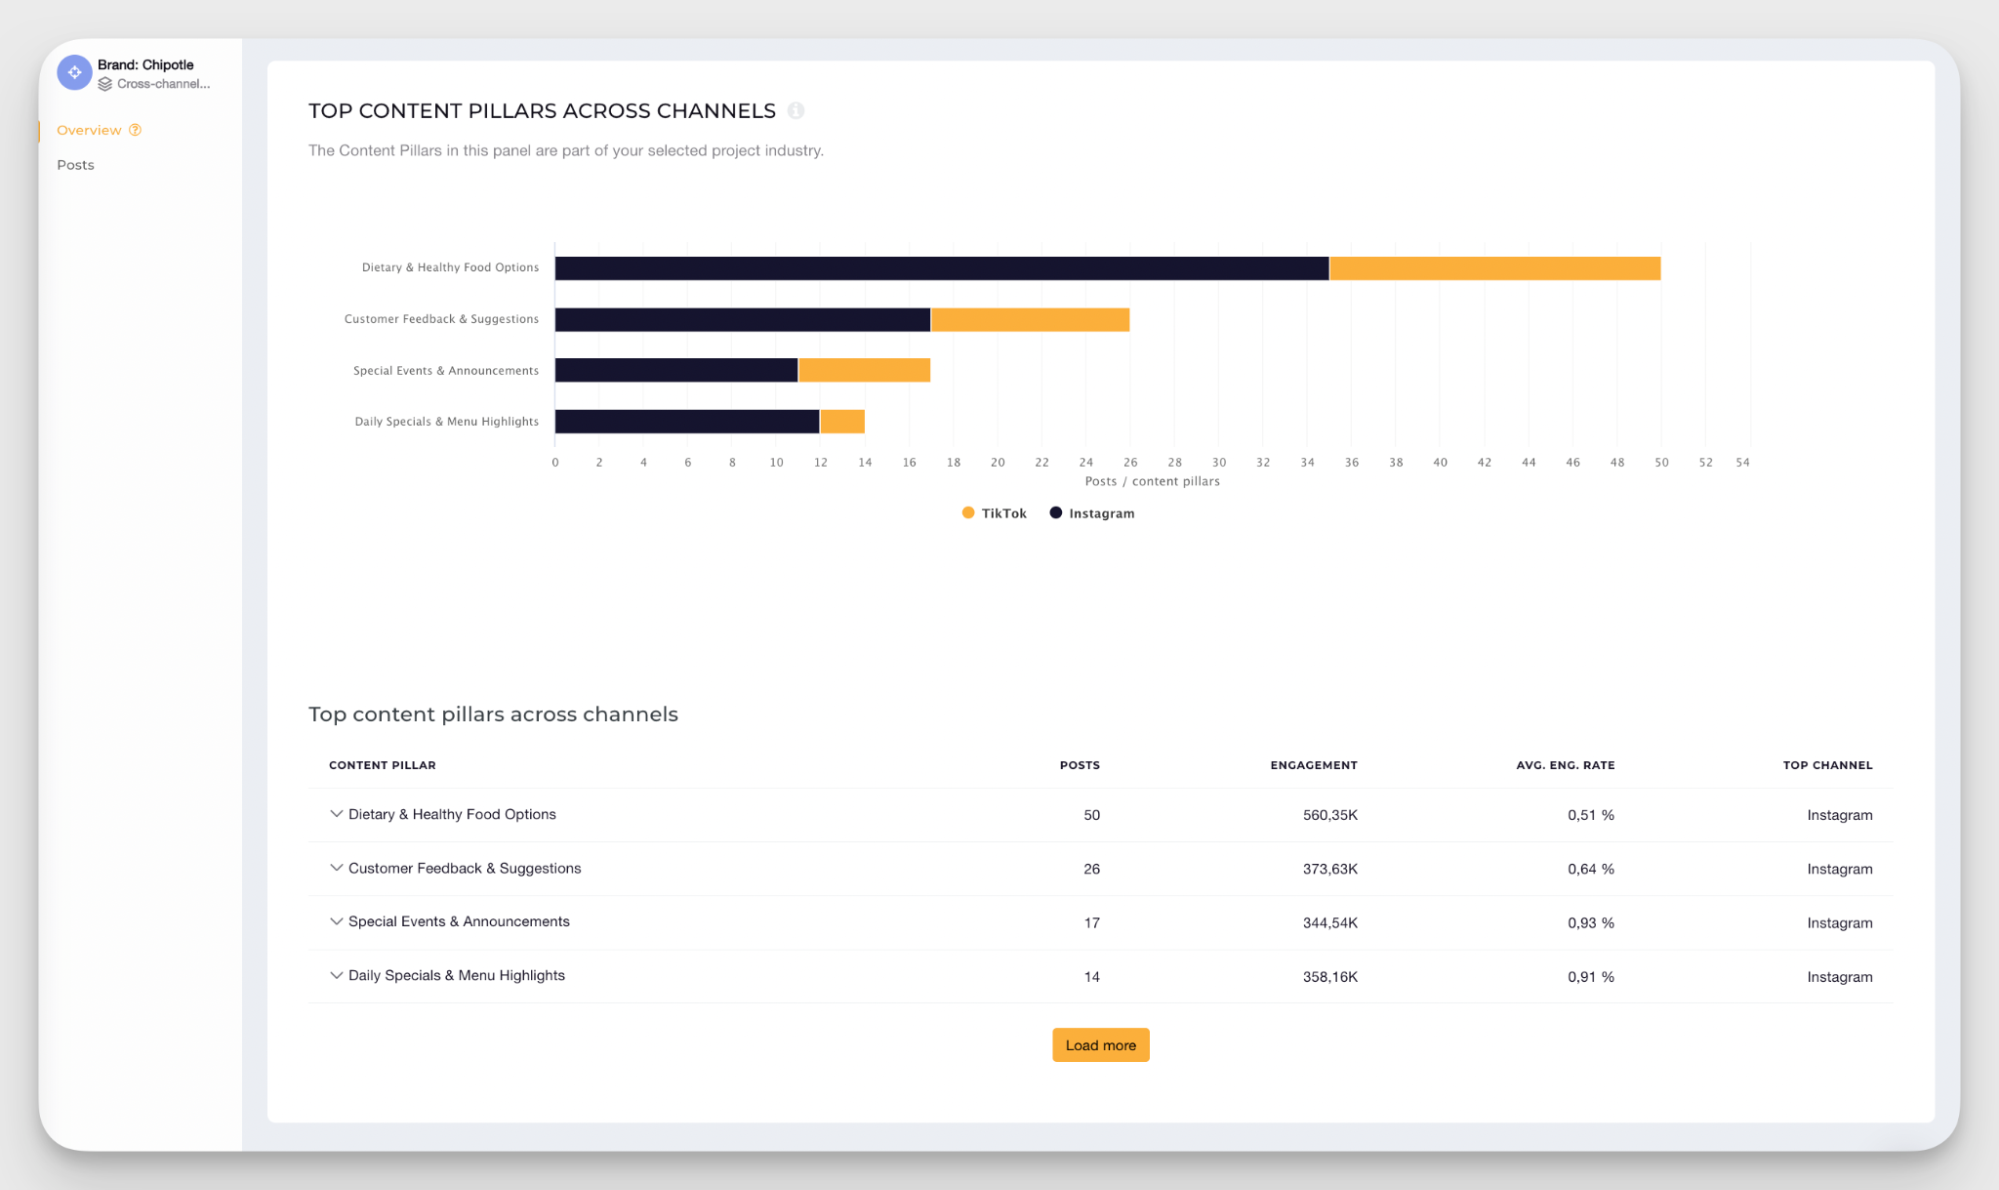
- Most engaging content pillars: Discover recurring themes, topics, and content categories driving consistent engagement.
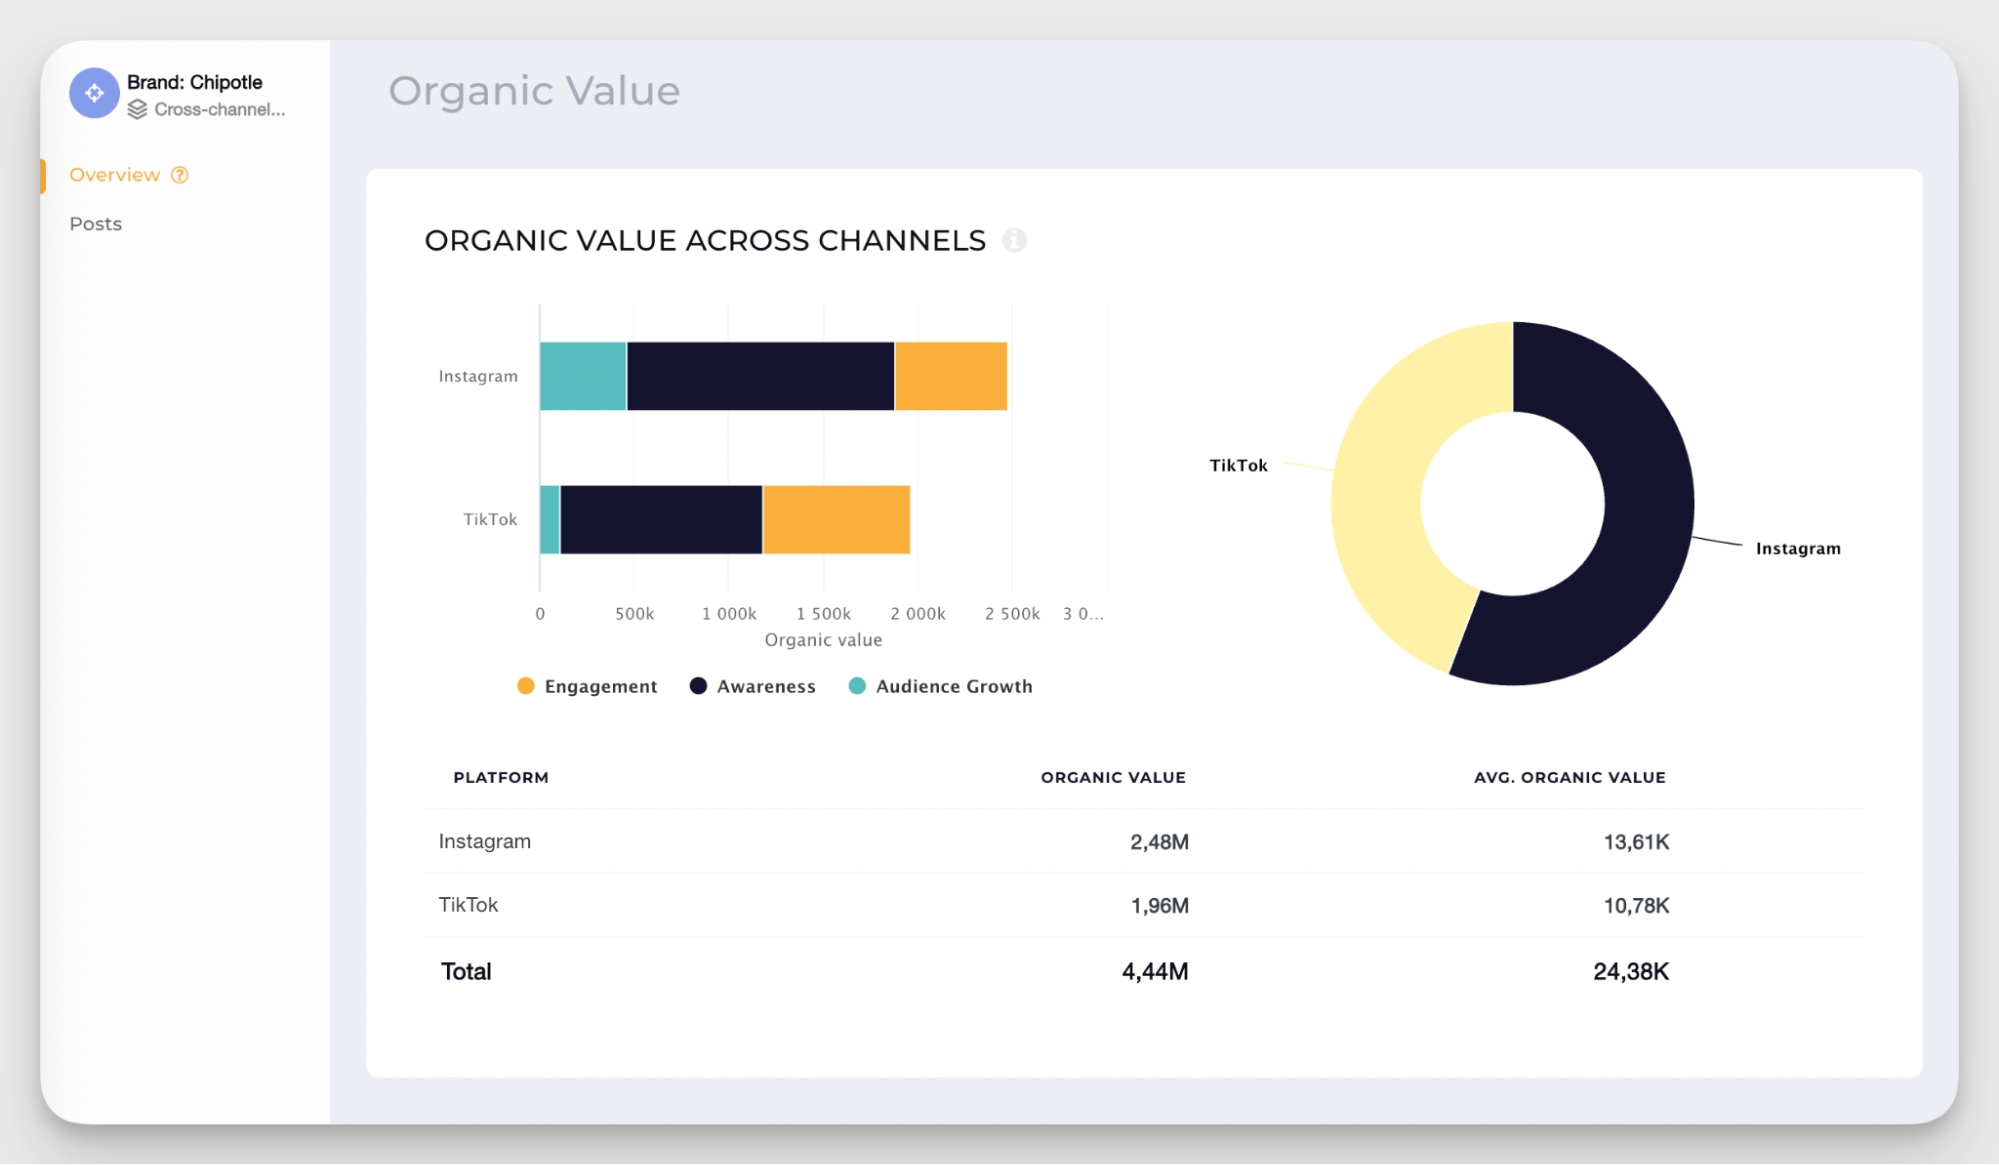
- Organic value: Estimate the earned media value generated through organic social performance.
Pros
- Strong cross-platform competitive analysis
- Useful benchmarking features for industry comparisons
- Query Builder simplifies campaign-level tracking
- AI assistant adds strategic interpretation beyond raw data
- Good balance between high-level reporting and detailed metrics
Cons
- Advanced analytics can feel overwhelming for smaller teams initially
- Some metrics still depend on platform API limitations
Reviews
“For me, the most useful aspect of the platform is the detailed analysis of profile performance. It allows you to evaluate essential metrics such as engagement rate, follower growth, posting frequency and type, among many other things. I believe the greatest advantage of the platform (which I didn't find in other platforms) is its ability to perform deep and comparative analyses of social profiles over extended periods of time, in addition to having an intuitive and visually clear interface.” — Alexandra D., G2 Reviewer
Pricing
2. Shortimize
After testing Shortimize, I’d describe it as a highly focused analytics tool for short-form video performance across platforms like TikTok, Instagram Reels, and YouTube Shorts.
The platform feels specifically built for teams producing high volumes of vertical video content.
What stood out to me immediately was how easy it made cross-platform short-form analysis. Instead of jumping between native analytics dashboards, I could quickly compare how the same content format behaved across multiple channels.
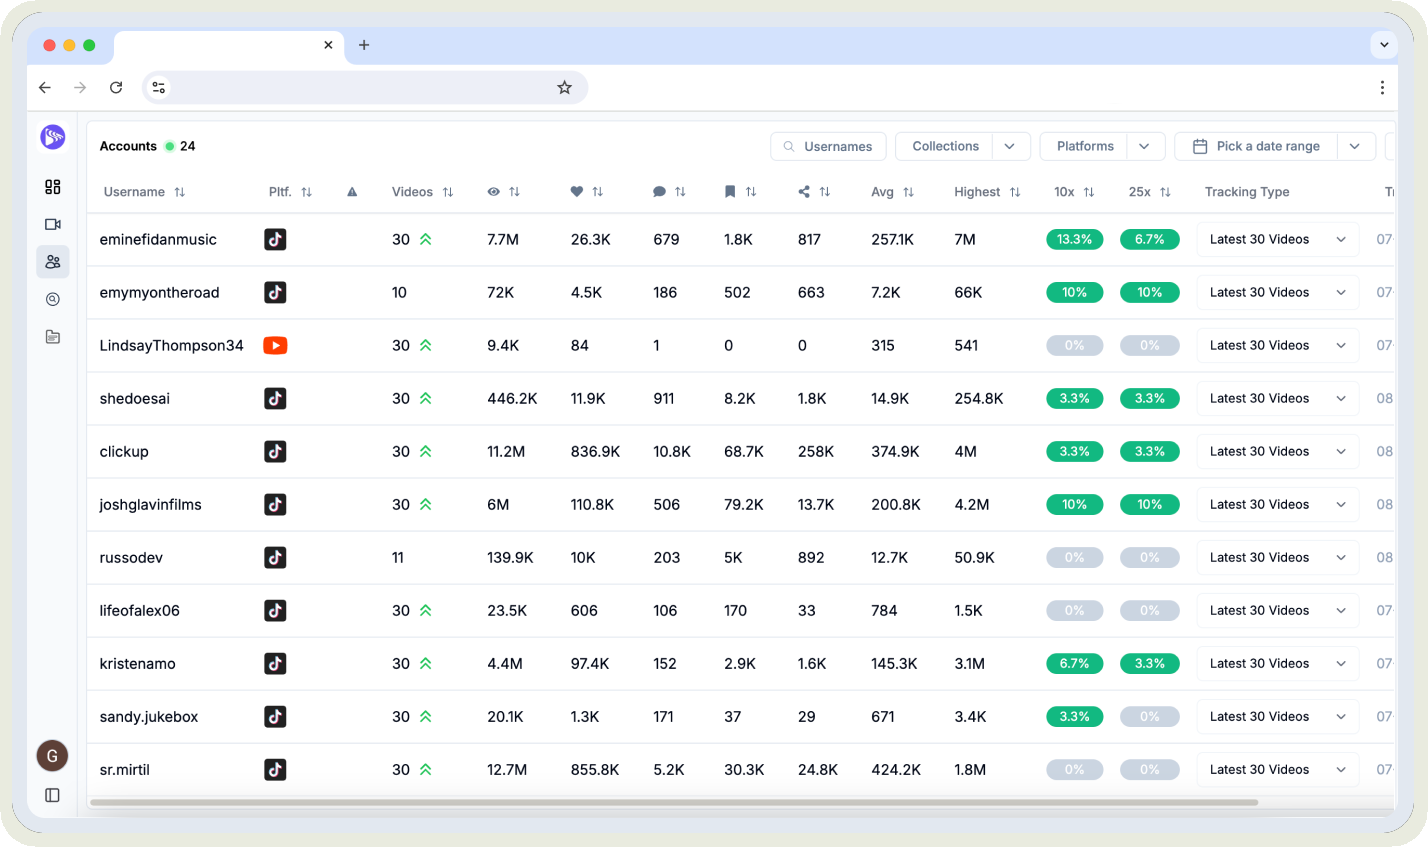
That’s incredibly useful when trying to understand whether a hook, editing style, creator format, or content pillar actually works universally or is platform-dependent.
Available metrics
- Views and watch time: Analyze how audiences consume video content across different platforms and identify stronger-performing formats.
- Engagement metrics: Monitor likes, comments, shares, saves, and engagement patterns across short-form channels.
- Audience growth: Measure follower growth trends connected to specific videos, creators, or campaigns.
- Retention analysis: Identify where viewers drop off and which hooks keep audiences watching longer.
- Top-performing videos: Quickly surface the videos generating the highest reach, engagement, and watch time across platforms.
- Hook performance insights: Understand which video openings consistently improve retention and engagement across channels.
Pros
- Very intuitive and modern interface
- Strong retention and hook analysis capabilities
- Useful for agencies, creators, and brands managing large video volumes
Cons
- Primarily focused on short-form video analytics rather than full social media reporting
- Less useful for teams prioritizing static content or community management
Reviews
“I use Shortimize to quickly check how my short videos are performing by adding the links and seeing all the important numbers in one place, which saves me a lot of time switching between TikTok, Instagram, and YouTube. I appreciate that it tracks all my accounts and videos in one place and allows real-time overview through an easy-to-read graph on the overview page. I also really like the responsiveness of the Shortimize team; they answer my questions well and are open to feedback, which makes it feel easy to suggest improvements.” — I A., G2 Reviewer
Pricing
3. Audiense
Instead of focusing primarily on post-performance, Audiense is a cross-platform analytics tool that is deeply centered around audience intelligence.
The platform helps connect audience behavior, interests, affinities, demographics, and online communities across channels. That changes the way you think about social strategy. You stop looking only at what content performed well and start understanding who engaged with it, why they engaged, and where similar audiences exist across platforms.
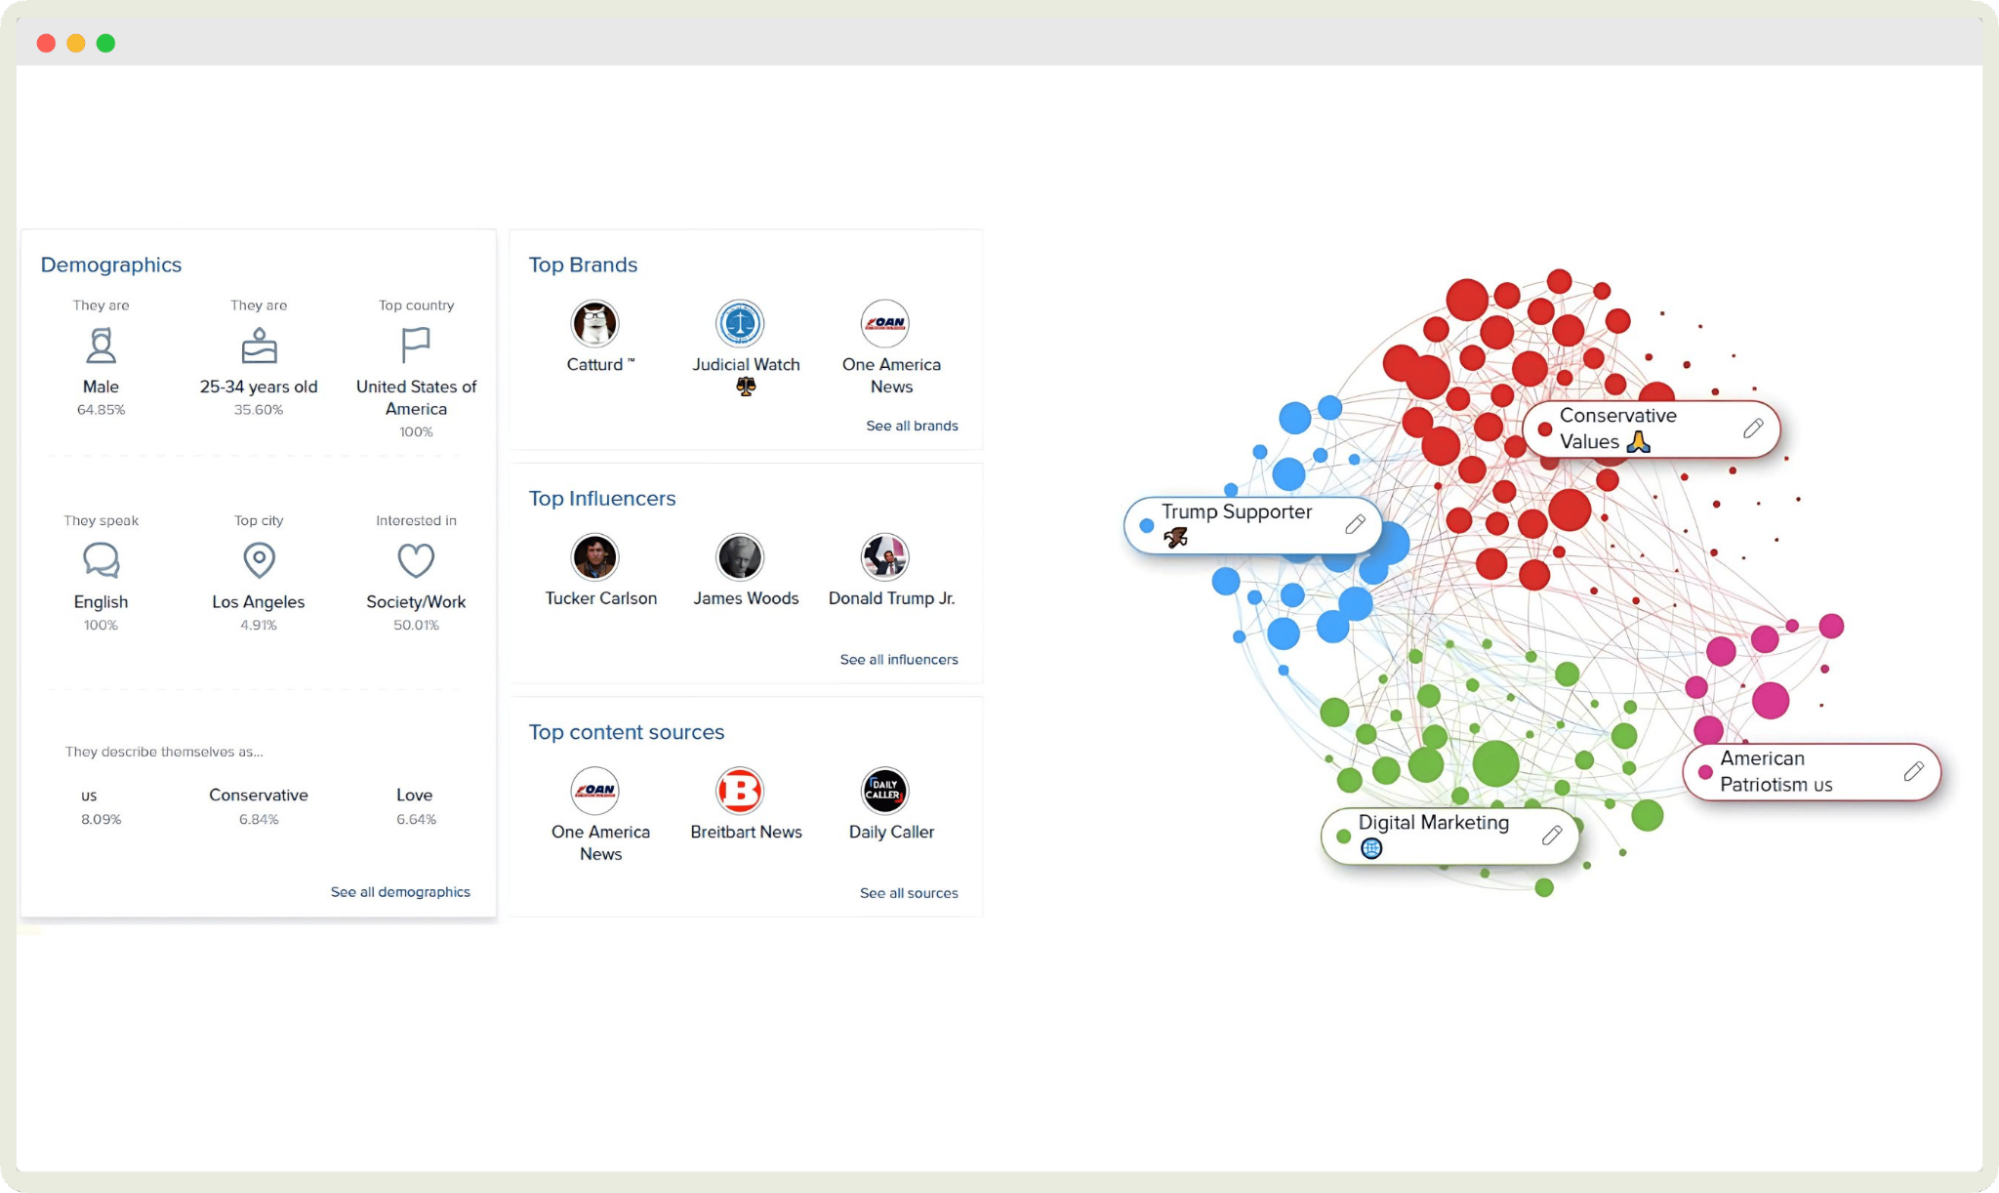
I found it particularly useful for audience segmentation. The insights go far beyond surface-level engagement metrics and into behavioral patterns, creator affinities, media consumption habits, and community overlaps.
Available metrics
- Audience demographics: Analyze audience age, gender, location, language, and occupation across social communities.
- Interest and affinity insights: Discover the topics, creators, brands, and industries your audience interacts with most.
- Community segmentation: Group audiences into highly specific segments based on shared behaviors, interests, and online activity.
- Audience overlap analysis: Identify shared audiences between competitors, influencers, brands, and niche communities.
- Consumer behavior insights: Understand purchasing behaviors, lifestyle interests, and digital consumption patterns.
- Influencer and creator affinities: Track which creators and public figures resonate most strongly with your target audience.
- Platform usage patterns: Analyze how audiences behave across different social platforms and communities.
- Conversation analysis: Monitor trending discussions, audience sentiment, and emerging themes within specific communities.
Pros
- Extremely strong audience intelligence capabilities
- Excellent for audience segmentation and persona building
- Valuable competitive audience benchmarking
- Deep psychographic and behavioral insights
Cons
- Less focused on post-level content analytics
- Requires some strategic experience to fully interpret insights
Reviews
“Before Audiense, I would conduct online audience research by search for a topic on a regular social listening tool, going through the mentions, and looking through the profiles of people joining in on the conversation by hand. This would take hours, even for the most basic of tasks. Audiense does the same work and more for me in a fraction of the time. Reports are quick and easy to set up, and they rarely take longer than 10 minutes to run.” — Verified G2 Reviewer
Pricing
Audiense pricing is custom-based on your choice of plans. You need to contact the team to get details.
4. Brand24
Some tools tell you how your content performed. Brand24 is a cross-platform social media analytics tool that tells you what people are saying when you’re not in the room.
After using the platform, I found Brand24 especially helpful for understanding cross-platform brand visibility and online conversations in real time. It pulls mentions from social media, news sites, blogs, forums, podcasts, videos, and other online sources into one place, which makes it much easier to understand how conversations evolve across channels. To continuously monitor these non-social platforms, media tracking tools rely on automated web crawlers to index public discussions
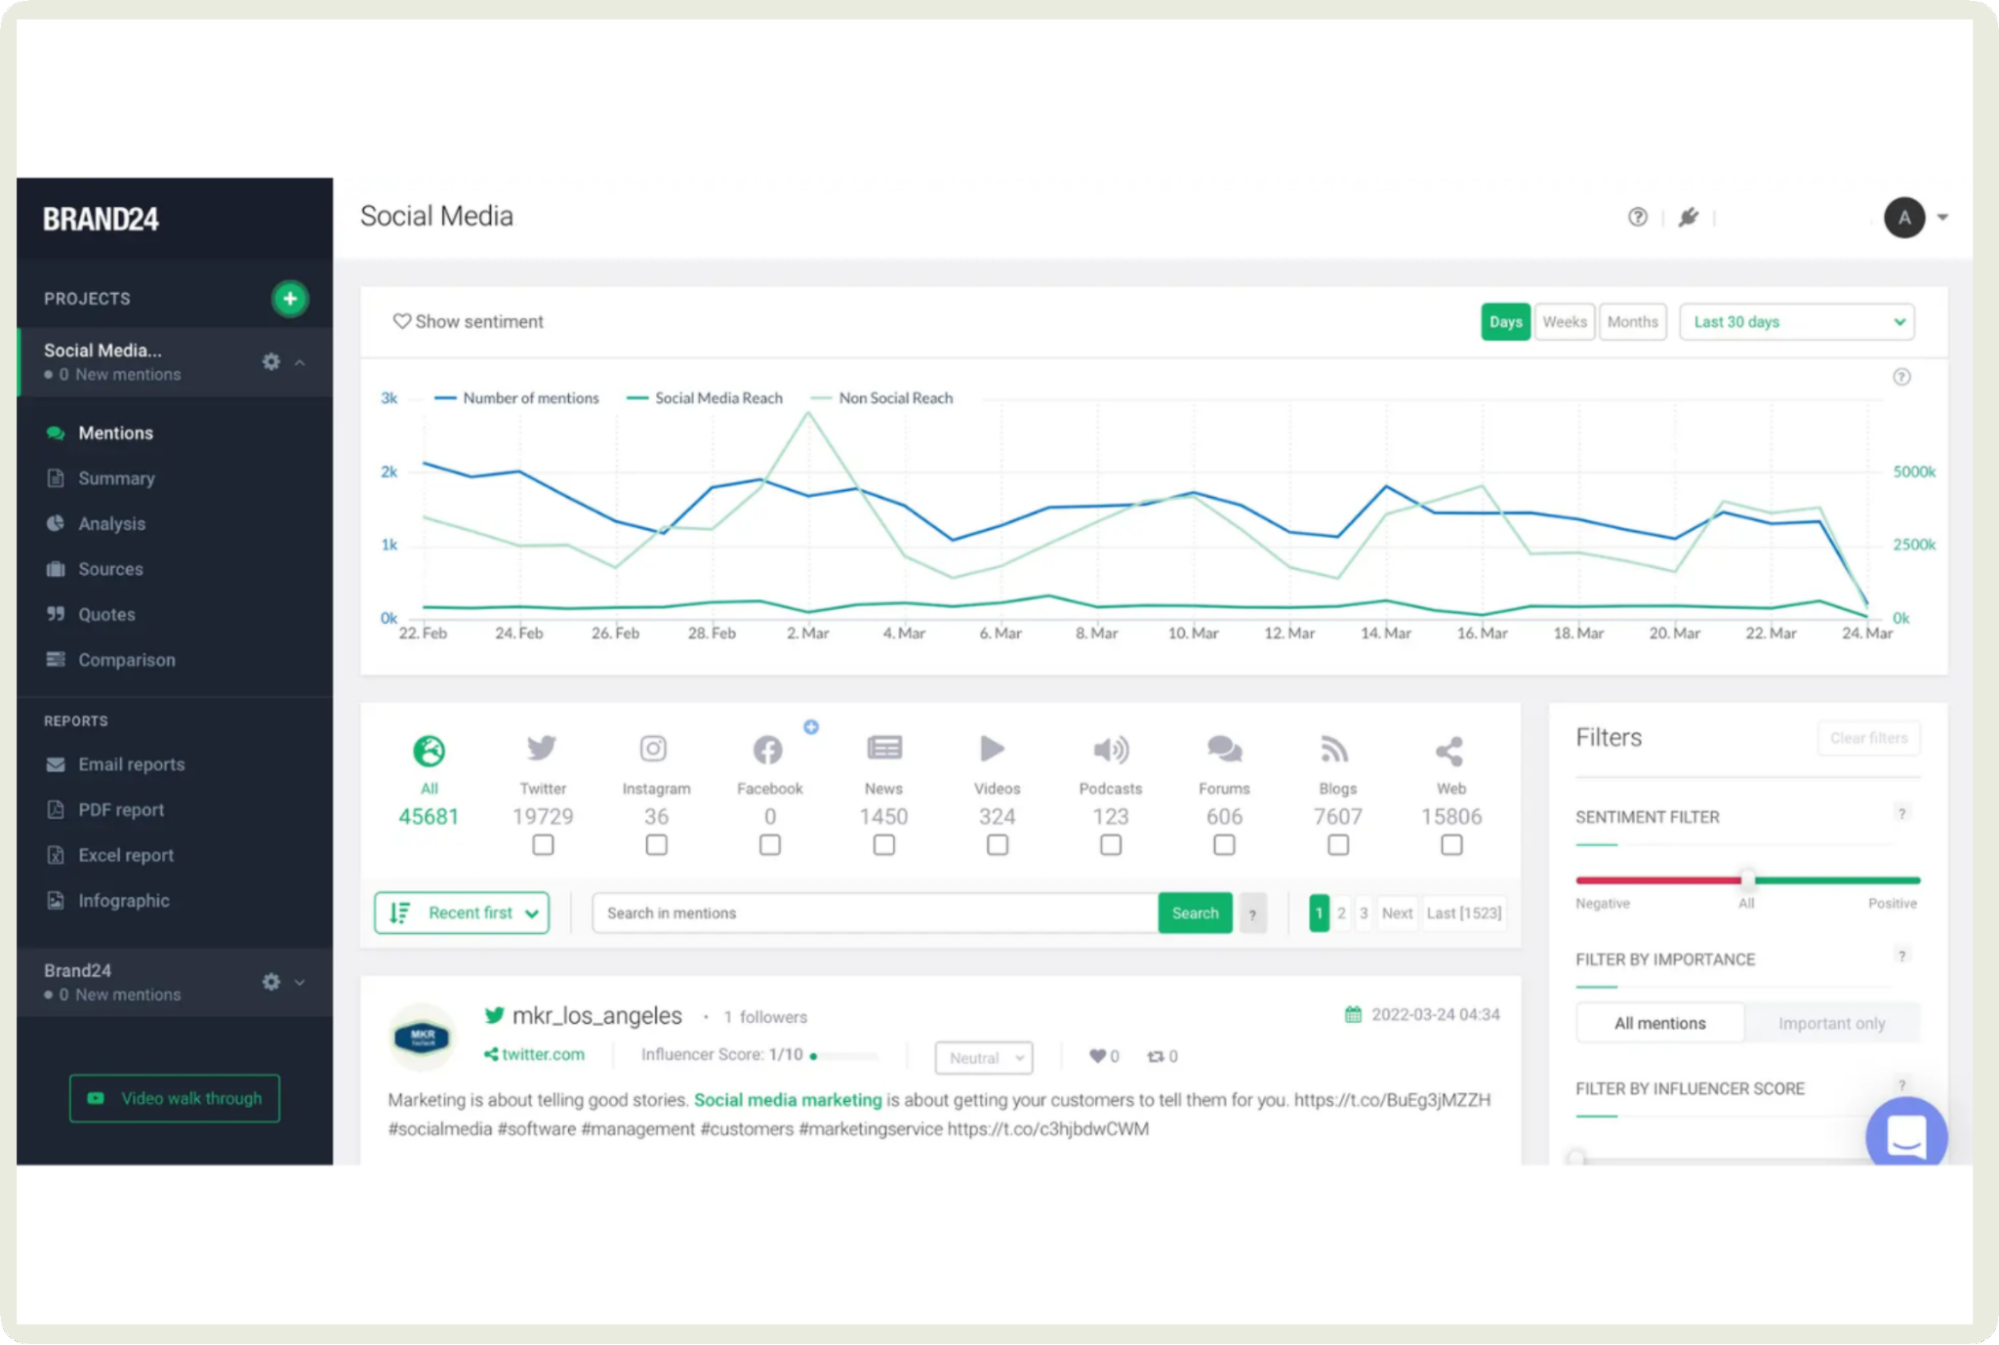
What I liked most was the way it connected social listening with broader competitive and brand analysis. Instead of just tracking engagement metrics, you’re tracking attention, sentiment, reputation, and share of voice across the internet.
That becomes incredibly valuable in a cross-platform context because audience perception rarely lives on one platform alone.
Available metrics
- Brand mentions: Track brand, competitor, campaign, or keyword mentions across social media, blogs, forums, news sites, podcasts, and video platforms.
- Sentiment analysis: Analyze whether online conversations are positive, negative, or neutral across channels.
- Reach and visibility: Measure how far conversations spread and estimate the visibility generated by mentions.
- Share of voice: Compare how often your brand is mentioned relative to competitors across platforms.
- Hashtag tracking: Monitor branded, campaign, or industry hashtags across social channels and online communities.
- Trending discussion analysis: Surface emerging topics, viral discussions, and conversation spikes across platforms.
- Engagement insights: Track likes, shares, comments, reposts, and interactions connected to brand mentions.
Pros
- Strong real-time social listening capabilities
- Excellent cross-platform mention tracking
- Useful competitive share-of-voice analysis
Cons
- Less focused on deep post-level analytics
- Advanced reporting may require higher-tier plans
- Best insights emerge with larger brand mention volumes
Reviews
“What I like most about Brand24 is that it shows brand mentions from places I would never think to check manually. After using it for some time, I realized our product was being discussed on forums and small websites that were completely off our radar. It pulls everything into one dashboard, which saves a lot of time compared to searching manually. The sentiment insights and alerts are actually helpful because they highlight how people are talking about the product in real conversations.” — Renish N., G2 Reviewer
Pricing
5. Whatagraph
The first thing I noticed while testing Whatagraph was how much time it saves on reporting.
Most cross-platform tools help you collect data. Whatagraph is designed to help you organize it, visualize it, and present it in a way that actually makes sense to clients, stakeholders, or internal teams.
It pulls performance data from multiple marketing platforms into one reporting environment, which makes it particularly useful for agencies and teams managing fragmented marketing ecosystems.
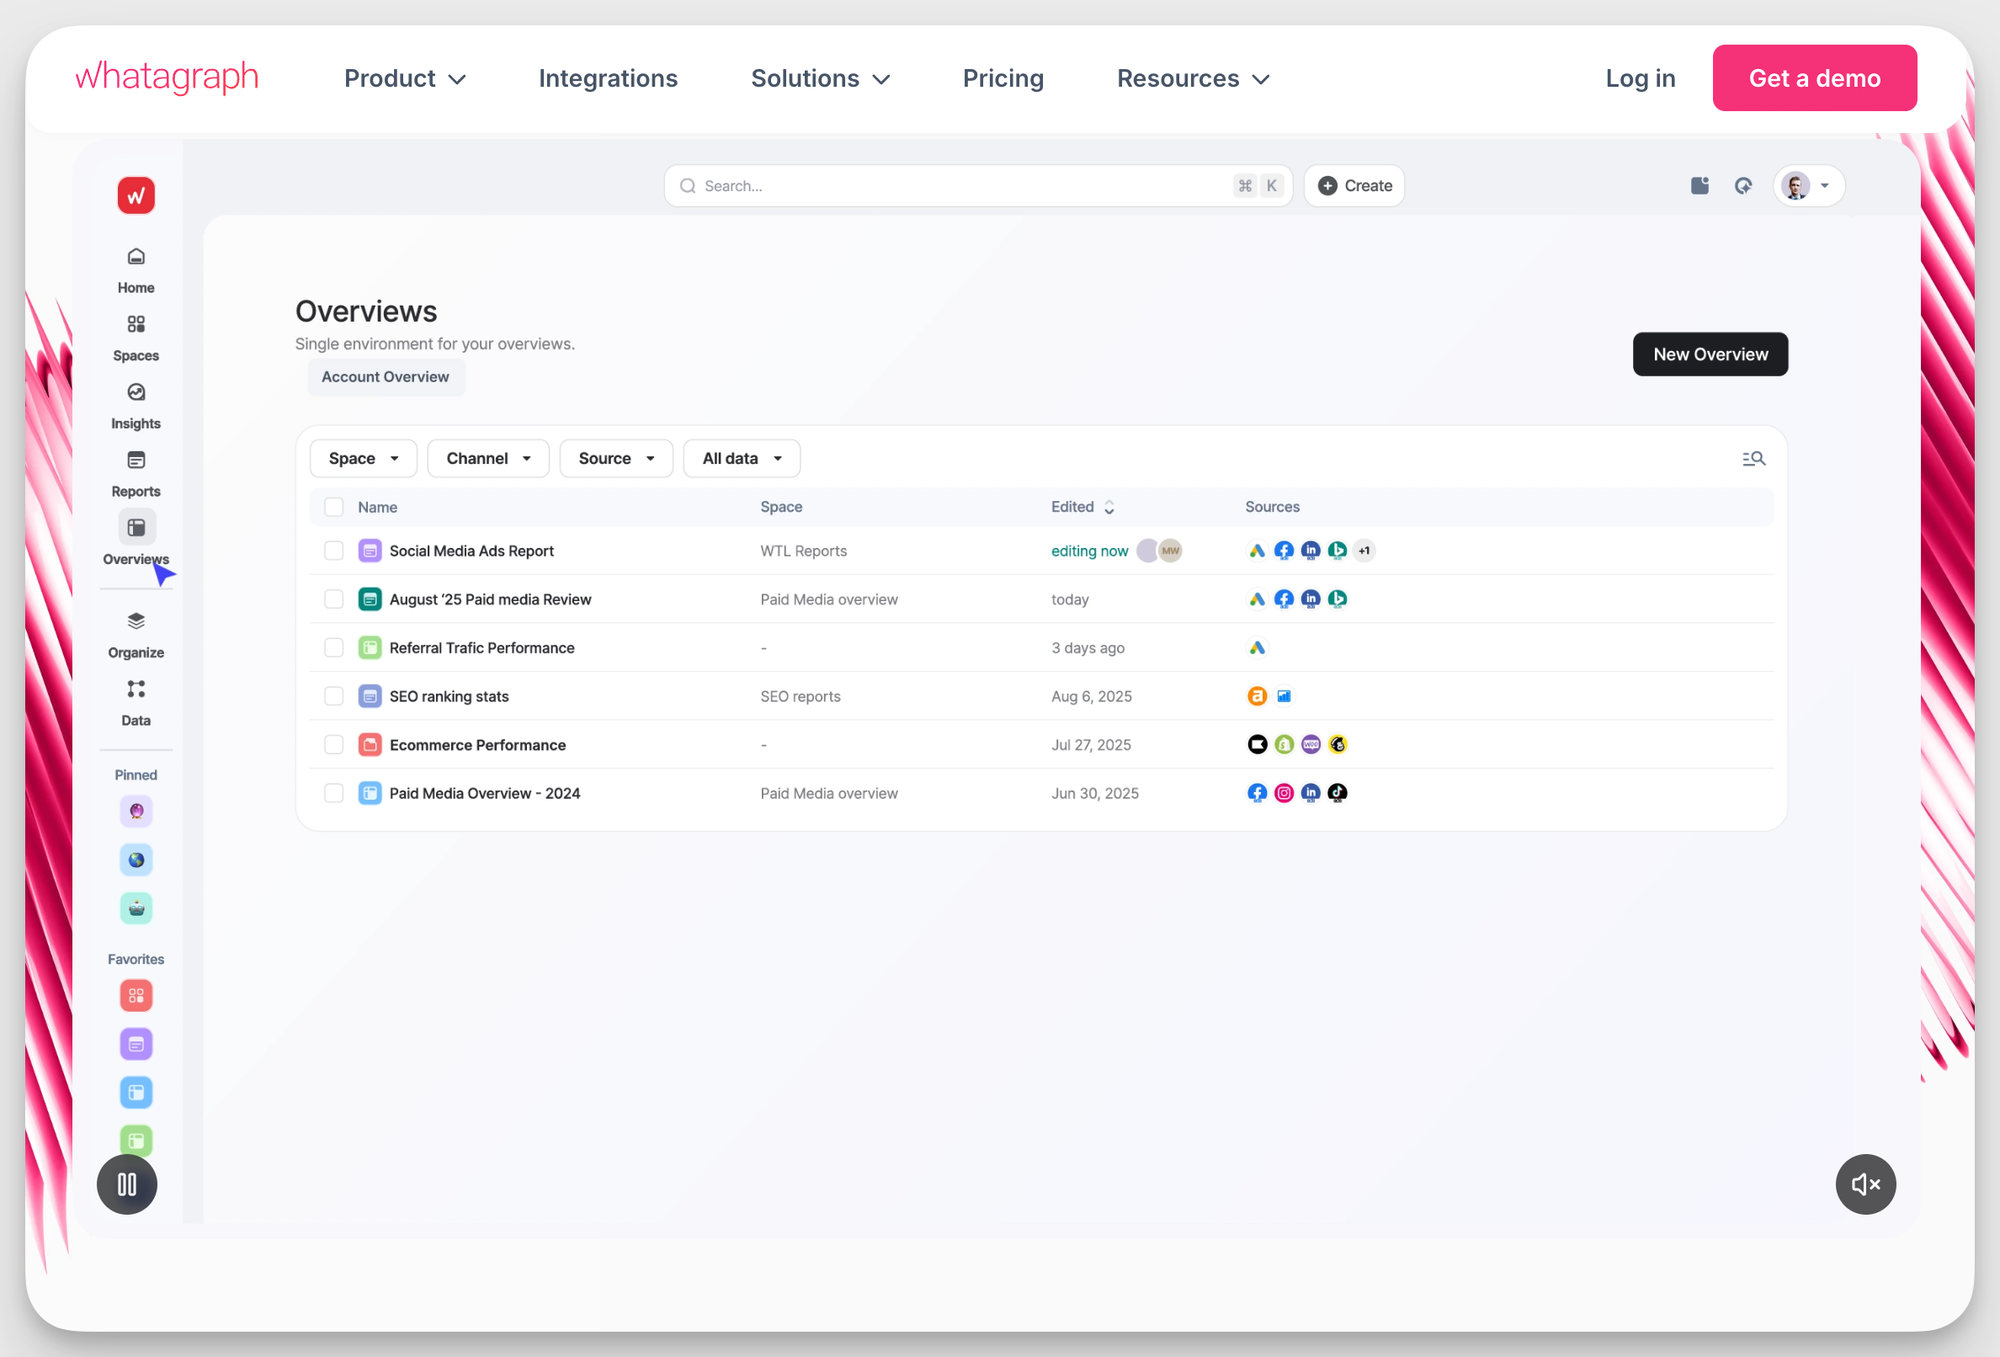
I loved the flexibility that the tool offers. Social media metrics sit alongside paid ads, SEO, website analytics, email performance, and ecommerce data. That creates a much clearer picture of how channels influence each other instead of reporting every platform separately.
Available metrics
- Cross-platform marketing dashboards: Combine social media, paid ads, web analytics, SEO, and ecommerce performance into unified reports.
- Social media analytics: Track engagement, reach, impressions, audience growth, and post performance across multiple social platforms.
- Paid campaign reporting: Monitor ad spend, ROAS, CPC, CTR, conversions, and paid campaign performance across channels.
- Website analytics: Integrate website traffic, sessions, bounce rates, and conversion data into cross-channel reports.
- Custom KPI tracking: Build personalized dashboards around the metrics most relevant to specific campaigns or stakeholders.
- Performance comparison dashboards: Compare campaign, platform, or time-period performance across channels.
Pros
- Very strong dashboard customization options
- Integrates with a large number of marketing platforms
- Saves significant reporting time for agencies
- Useful for combining marketing data into one reporting layer
Cons
- More focused on reporting than strategic analytics interpretation
- Advanced custom dashboards may take time to configure
- Less content-focused compared to dedicated social media analytics tools
Reviews
“The dashboards are clean, easy to build, and perfect for client reporting. It pulls in data from Google Ads, Meta, LinkedIn, and even TikTok without any hassle. I love how I can set up automated reports that look great and are client-ready. No more fiddling with spreadsheets or wasting time building slides.” — Bruhith I., G2 Reviewer
Pricing
How to successfully set a cross-platform analytics measurement system?
Even with the right tools, you can spend hours studying cross-platform analytics if you don’t have a proper system in place. Here’s a step-by-step process to set up that system.
Define your measurement goals and needs
Before choosing tools or building dashboards, define what you actually want your social media analytics system to answer.
A brand focused on awareness will measure social media success very differently from a performance-driven e-commerce company. Creator-led brands care heavily about reach, watch time, and engagement patterns. B2B teams may prioritize traffic quality, lead generation, and community conversations.
I usually find it helpful to start with these questions:
- What does success actually look like for this brand?
- Which platforms influence conversions versus discovery?
- Which content formats deserve more investment?
- What do stakeholders expect from reporting?
Once those answers become clear, choosing metrics becomes much easier.
Set baseline benchmarks for each channel you will track
One of the biggest mistakes in cross-platform reporting is evaluating every platform using the exact same expectations.
Social platforms behave differently and the audiences behave differently too. Even ‘good performance’ looks different depending on the channel.
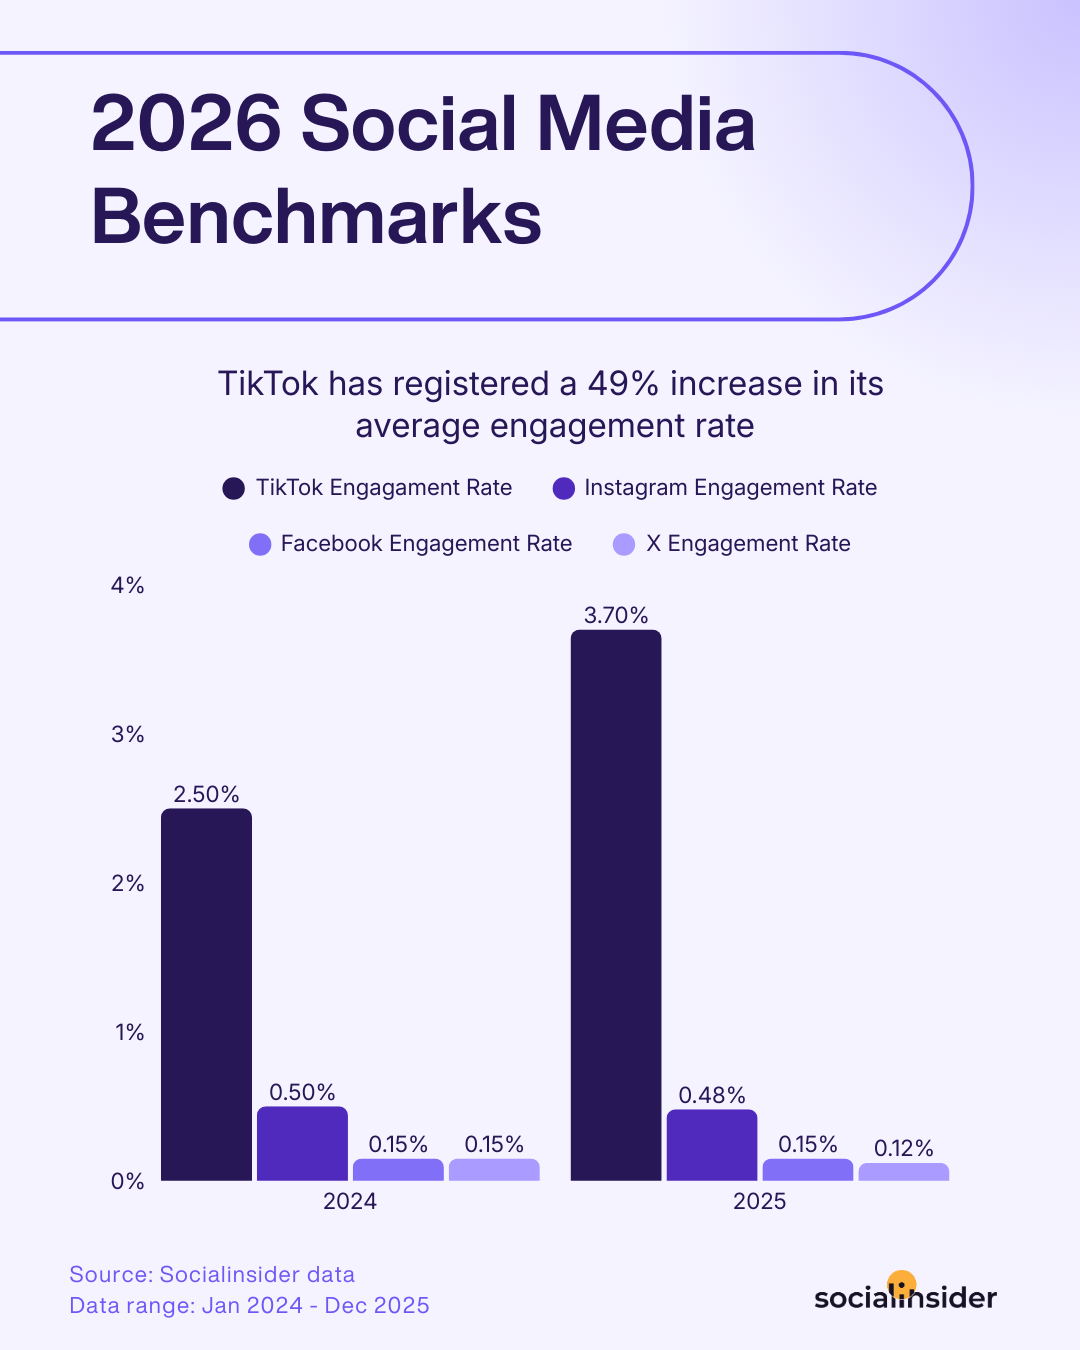
That’s why baseline benchmarks matter. Benchmarks give context to performance. They help you understand whether your engagement rate, reach, video views, or audience growth are actually competitive within your industry and platform category.
One way to get these baseline benchmarks is by referring to studies. For example, Socialinsider’s Social Media Benchmarks Report is particularly useful for understanding average engagement rates, posting frequency, reach trends, and content performance across major social platforms.
It can give you data like this -
Choose the tool matching your needs and connect your accounts
As seen earlier, not every analytics tool solves the same problem.
Some tools specialize in competitive benchmarking. Others focus on reporting automation, audience intelligence, social listening, or short-form video analytics.
The best tool for you usually depends on the complexity of your marketing ecosystem and the kind of insights your team needs most often.
Once you have that figured out, choosing the right tool becomes much easier.
Next, connect your accounts. And keep your tracking structure organized from the beginning. Naming conventions, campaign tagging, and content categorization become incredibly important later when analyzing trends across multiple platforms.
These small setup decisions will save a lot of time when you report cross-platform analytics.
Set a reporting cadence and automate reporting
Cross-platform analytics only becomes valuable when reporting is consistent.
Weekly reporting helps monitor short-term performance shifts and campaign activity. Monthly reporting works better for trend analysis, strategic decisions, and stakeholder reviews. Quarterly reporting usually reveals larger platform and audience behavior patterns.
The important part is consistency.
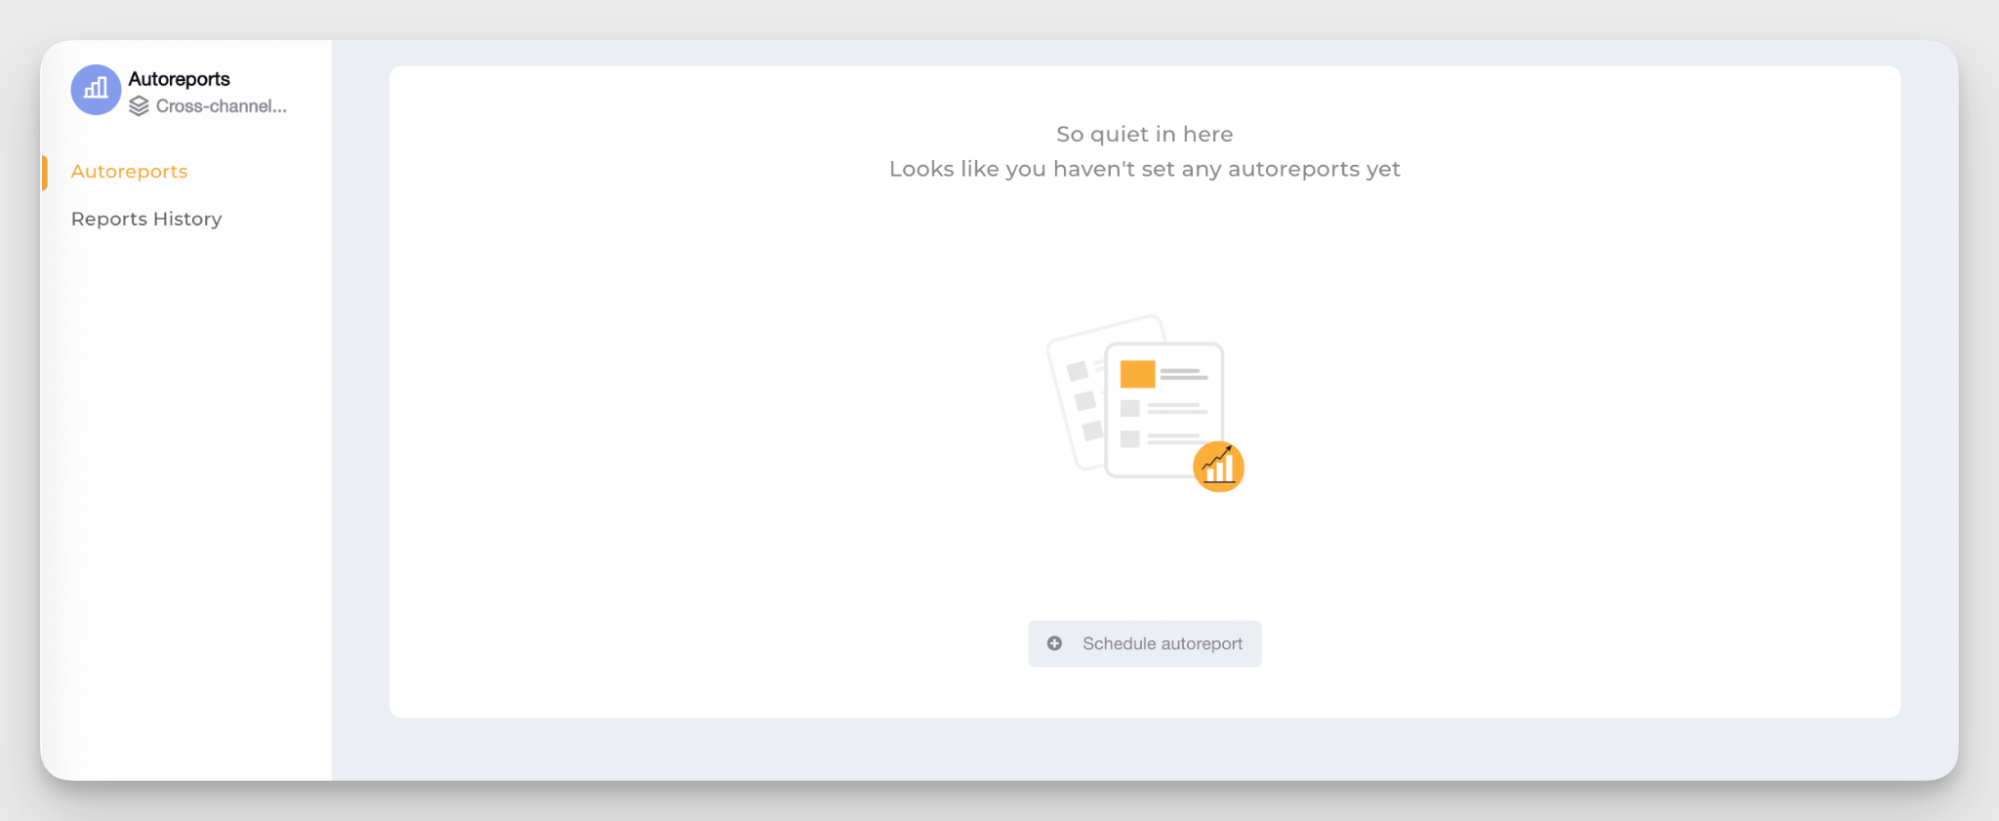
Automation helps a lot here. Instead of manually exporting data from multiple platforms every reporting cycle, tools like Socialinsider allow teams to automate reports. You can get a report delivered to your inbox every day, week, month, or quarter.
Final thoughts
Cross-platform analytics works best when it becomes part of your decision-making process and not just your reporting workflow. Start small. Define the metrics that actually matter to your goals, benchmark performance realistically, and focus on patterns instead of isolated wins.
The real value comes from connecting insights across channels and understanding how platforms influence each other over time. I’d also recommend investing in tools that reduce manual reporting and make interpretation easier, especially as your social presence grows.
If you want to try a tool that is focused on making cross-platform analysis easier, subscribe to a free 14-day trial of Socialinsider.

Nidhi Parikh
Having worked with several brands in the social media space, Nidhi writes about all things social. With 13K followers on LinkedIn, she's always up for a chat about books or her next travel plan

Know what your competitors do — before your manager asks
Get instant social benchmarks & reports without manual work.