How to Run a Campaign Performance Analysis for Powerful Insights?
Discover how to run an effective campaign performance analysis to get powerful strategic insights and optimize your strategy according to an expert.


Running a campaign without analyzing it properly is like driving without a rearview mirror — you're moving forward, but you're missing everything that could help you course-correct.
Most social media campaigns generate plenty of data. Reach goes up, engagement looks decent, reports get sent. But when it's time to optimize performance or justify results to stakeholders, things get blurry — not because of a lack of effort, but because the right metrics weren't being tracked in the first place.
In this guide, together with Matt Churchill, global social media director at Aveva, I'll walk you through how to measure campaign performance in a way that goes beyond surface-level reporting — so every campaign you run leaves you with clearer answers and a stronger strategy for the next one. Let's dive in!
Key takeaways
- How to set a campaign measurement system? Define your campaign objective upfront and select a small set of KPIs that directly map to decisions you’ll make based on performance.
- How to track and analyze competitors' campaign performance? Monitor competitors’ campaign messaging, content, and engagement patterns to identify what drives their results and translate those insights into specific improvements for your own campaigns.
- Best practices for effective campaign analysis: Focus only on metrics tied to business outcomes, benchmark them properly, and use insights quickly to guide optimization decisions.
How does campaign analysis help you make better decisions?
Most campaign reports answer “what happened.” The problem is that’s the least valuable question in the room. A good campaign analysis tells you why it happened AND what to do next. Research from Aragile showed that 70% of marketers cannot prove social media ROI to leadership, which means campaign analysis is a common problem.
Running a social media campaign without a structured analysis is just running blind. You're pushing content, watching likes tick up in real time, and hoping 'the numbers look good.' Sometimes they do. But without a proper framework, you often can't tell the difference between a campaign that genuinely worked and one that got lucky, and you definitely can't explain it to your CFO. Campaign analytics transforms that guesswork into strategy.
Here's what structured campaign analysis actually gives you:
- Confidence to cut underperforming campaigns before they drain budget
- Evidence to double down on what works which means data-driven marketing rather than gut feel
- Cross-platform visibility so you're not making channel decisions in isolation
- The language to report to leadership in terms they care about: outcomes, not output
- A foundation to build playbooks that make future launches faster and smarter
In my experience running campaigns across industries, the teams that invest in the proper analytics tool consistently outperform those relying on native platform dashboards alone; not just marginally, but in ways that increase over time. That gap is the difference between a team that iterates and one that keeps starting from scratch.
How to set a campaign measurement system?
A campaign measurement system isn't just a dashboard. It's a commitment made before the campaign launches about what success looks like and how you'll prove it. Too many teams define their KPIs after the fact, when they already know which metrics looked good. That's not measurement, it’s narrative selection. Learning how to properly collect social media data from the outset changes everything downstream.
Matt Churchill, a senior social media strategist who has built measurement frameworks for campaigns across industries, puts the sequencing clearly (and it’s worth reading twice):
We try and lean into the elements we can control first, depending on the objective of the campaign. We'll take that objective — say it's to launch a campaign introducing new messaging — and plot appropriate social metrics against it, so in this example, reach, video views and impressions. Then we'll break those down by platform. We'll know whether we're only publishing organic or also including paid; we then apply those layers. Then we try to map those back to different social output points: corporate content, social advocates or leadership. Finally, we look at benchmarks for similar campaigns to give us an idea of what to anticipate performance-wise.
#1. Define measurable campaign objectives
Every campaign should sit within one of four objective categories. These labels will determine which metrics are relevant and which are noise. Set the objective first. Everything else follows.
The most important discipline: agree on these objectives with stakeholders before the campaign launches. A campaign designed for awareness that gets measured on cost-per-acquisition will always 'fail' not because it underperformed, but because it was evaluated against the wrong standard.
#2. Select KPIs that match your campaign goals
Not all social media KPIs deserve equal space in your campaign dashboard. The best KPI selection is restrictive by design, which is why I recommend using three to five metrics that connect directly to your objective, and nothing else. The temptation to track everything is real and should be resisted.
Reach & awareness metrics
When visibility is your goal, focus on:
- Reach: The number of unique accounts that saw your content. Not impressions, which count repeated views by the same person.
- Share of voice: Your brand's mention volume relative to competitors in the same category. A social media analysis tool that tracks competitors is essential here.
- Brand mention volume across earned, owned, and paid channels combined.
One of the most persistent mistakes in awareness campaigns is reporting impressions as if they were reach. Impressions count every display, including five views of the same post by the same user. Reach counts unique viewers. For a campaign trying to expand your audience, reach is the number that matters, and the two are not interchangeable.
How to measure campaign visibility across platforms?
When evaluating campaign visibility, many marketers start by looking at each social platform individually. While this approach highlights performance within each silo, it comes with major limitations: every platform tracks and defines metrics like reach, impressions, and engagement differently. As a result, analyzing channels in isolation makes it almost impossible to see the true, unified impact of your campaigns.
And with Socialinsider’s Query Builder, which allows posts tagging by different content pillars or campaigns, your cross-platform measurement suddenly doesn't feel that hard.
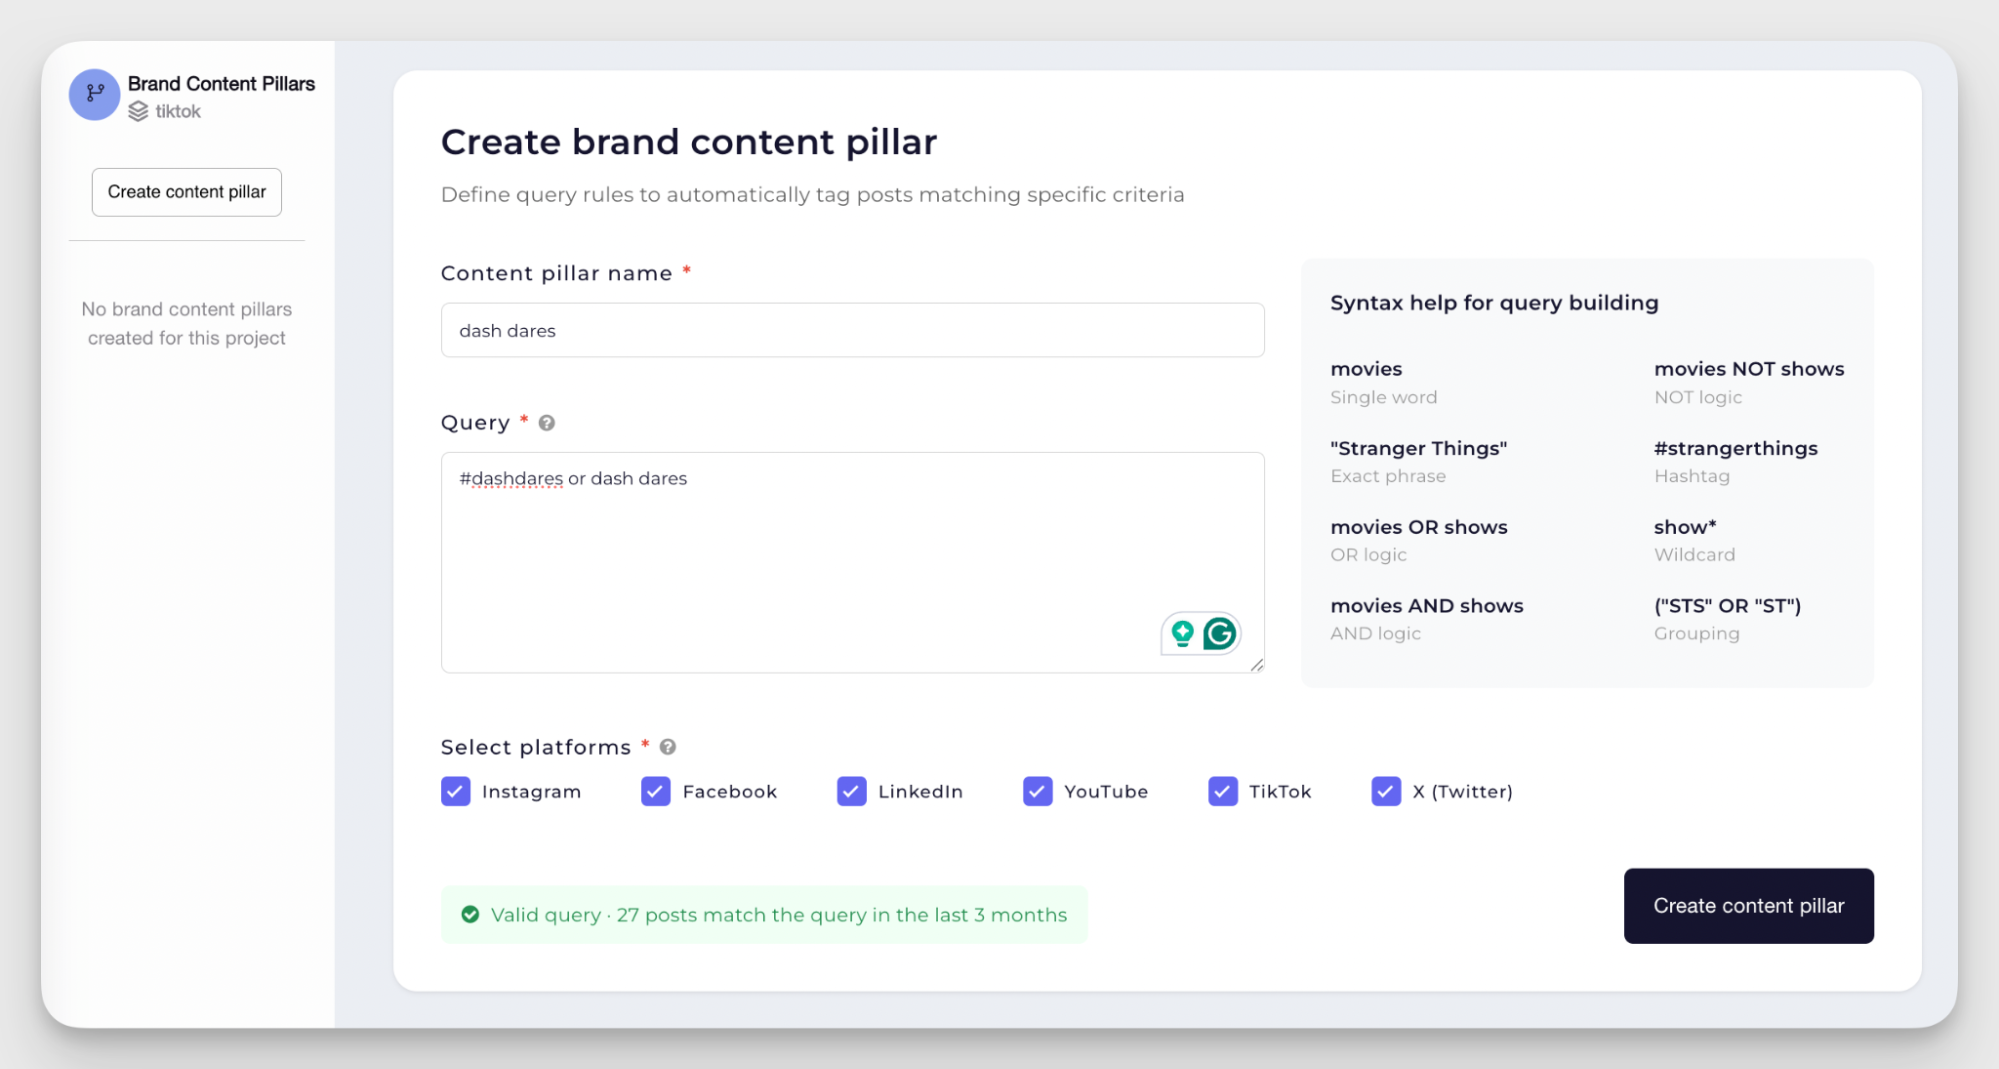
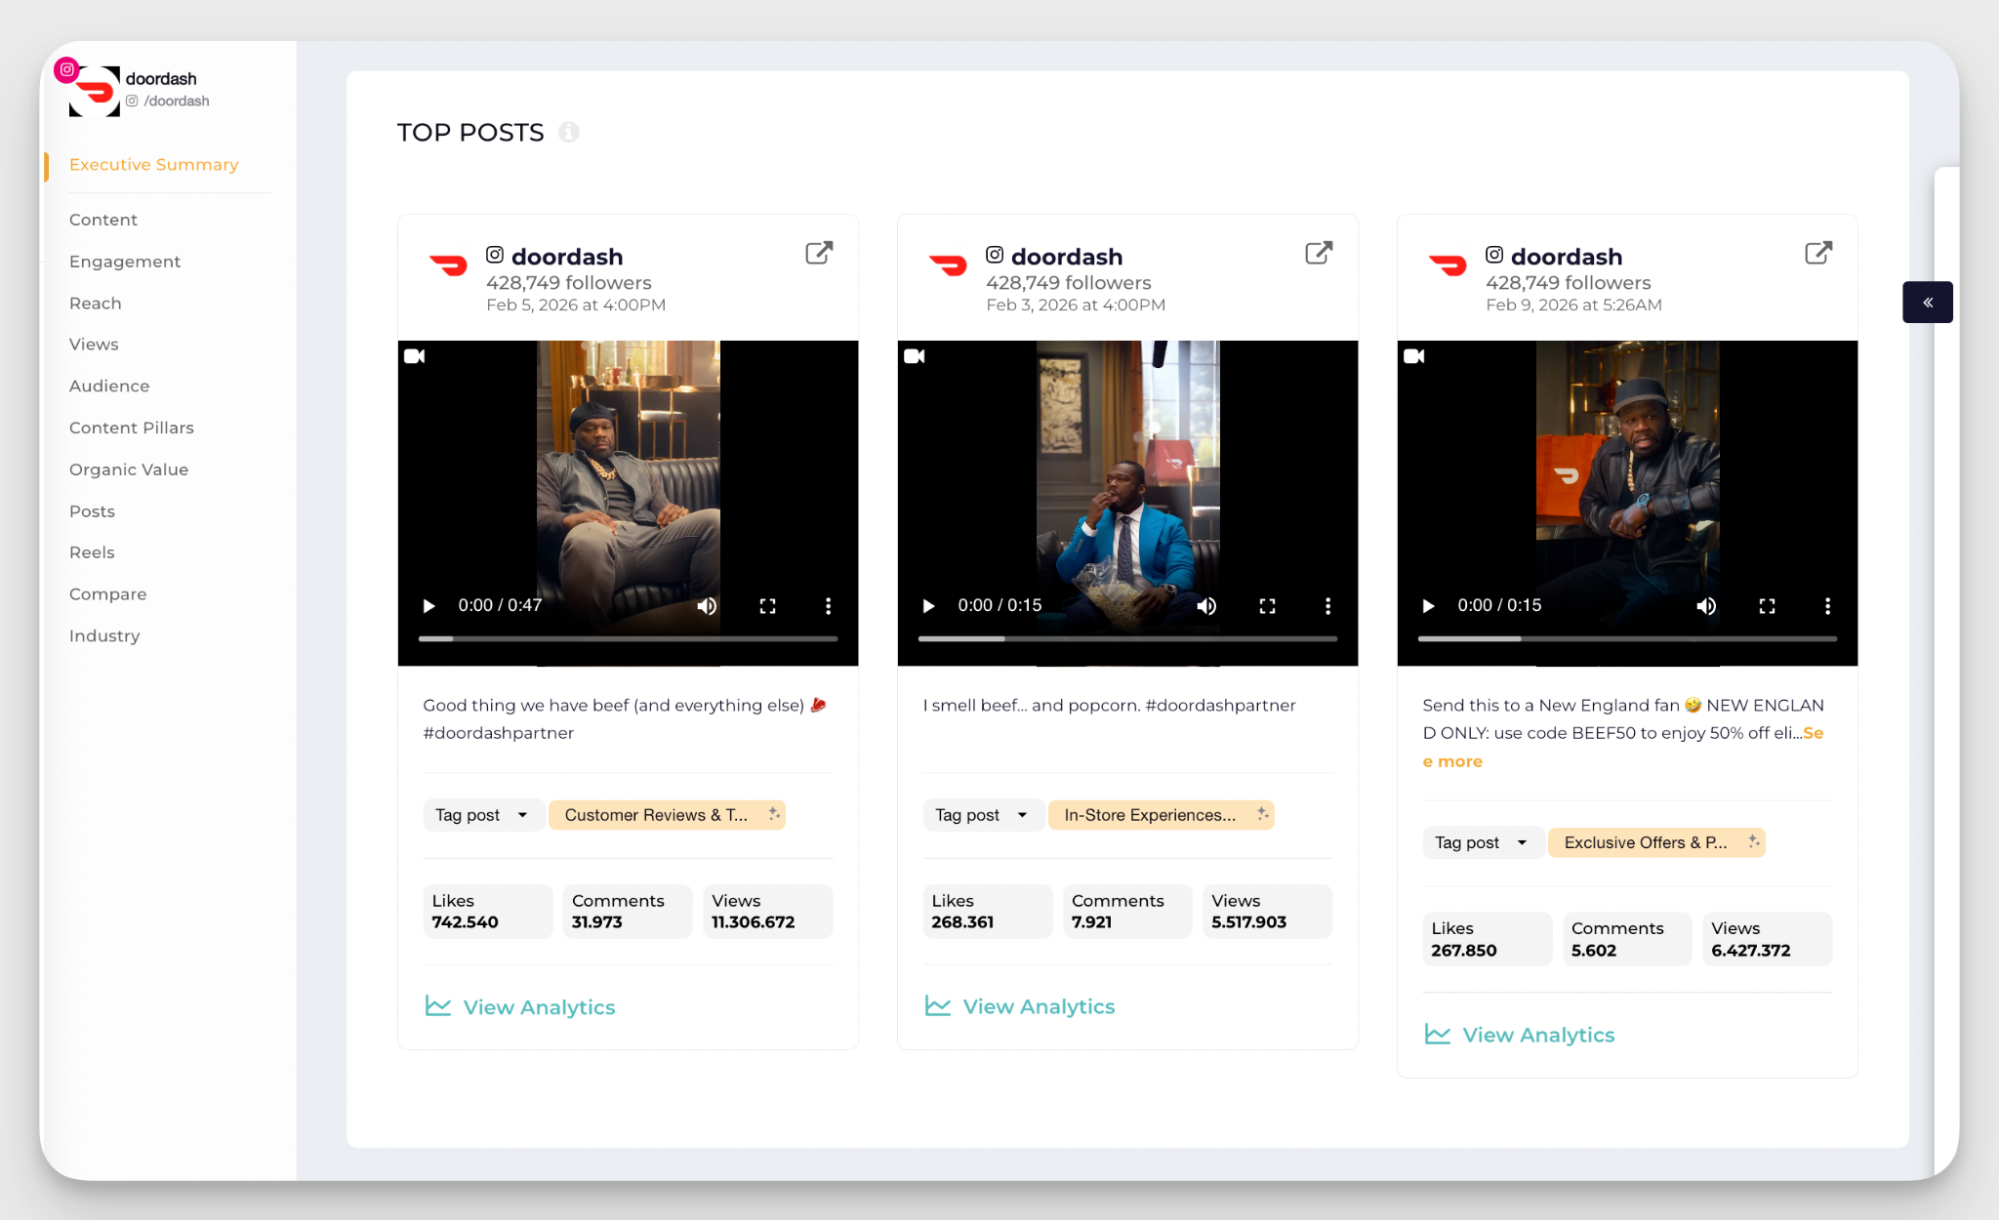
With our social media analytics tool, you can get one source of truth, while integrating data across platforms, such as total campaign reach, most effective platforms and top-performing posts all in context as seen below.
Engagement metrics
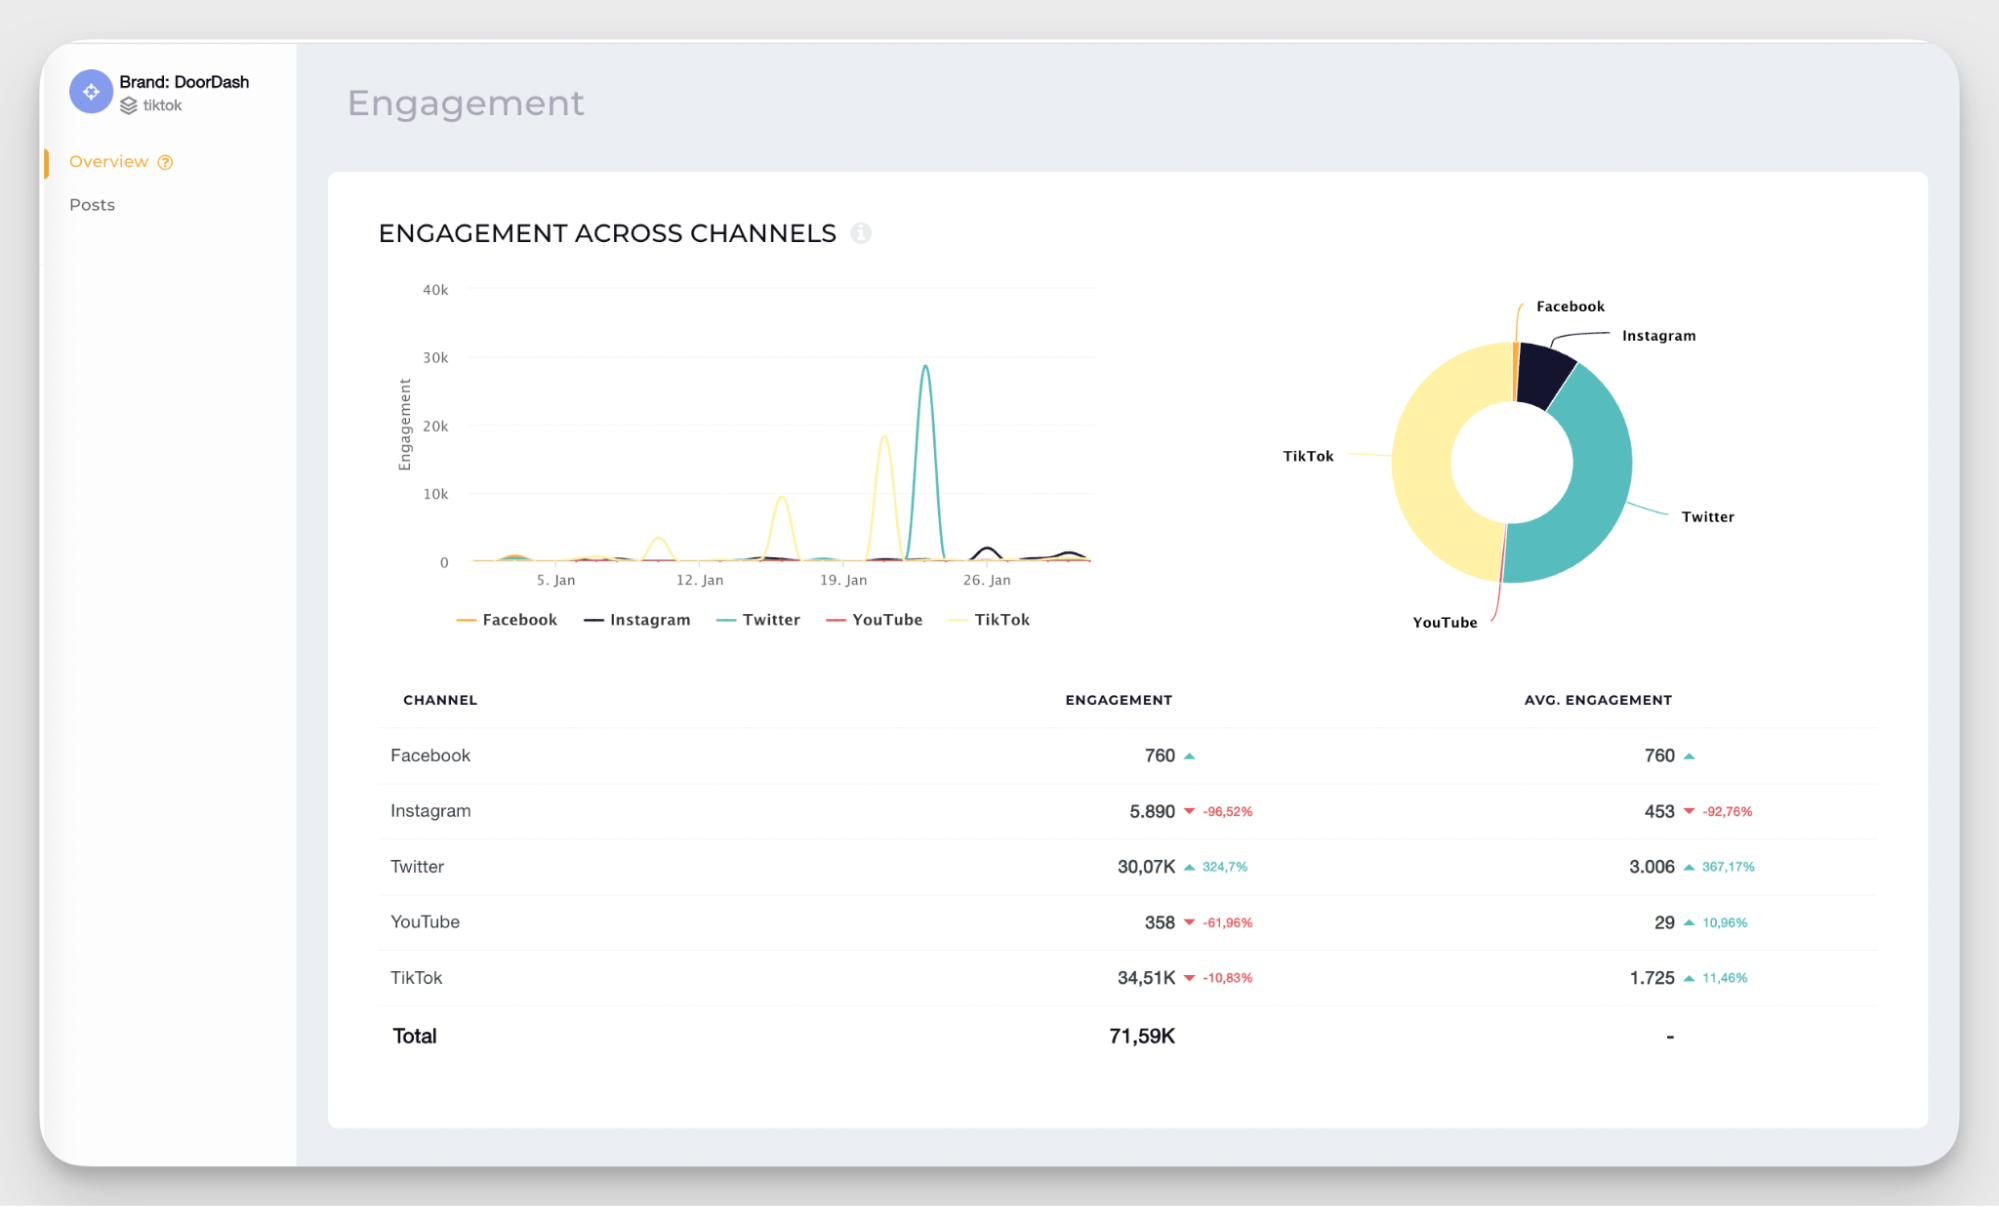
While engagement rate is a valuable benchmark because it normalizes for audience size, it’s just the starting point for real insight. To fully understand how audiences interact with your campaigns, it’s important to look both at the big picture—comparing engagement rates across all channels—and to drill down into specific engagement actions, such as comments, shares, and likes.
We have all seen how social media engagement has become more passive recently, right? That’s exactly why it’s worth keeping an eye on those more active forms of engagement, such as comments and shares. These actions give you a much clearer sense of what really resonates and inspires people to get involved.
If you're ever unsure which metrics belong in your campaign dashboard, Matt’s rule of thumb cuts through the noise faster than any framework:
The most important KPIs to track are always the metrics that tie back to the objective of the activation. Do you want people to visit a website? Look at CTR and form-fill rate. Do you want to tell an incredible story? Focus on engagements, dwell time and returning views. Are you looking to introduce people to a new concept? Prioritise reach.
Conversion metrics
Conversion metrics are where your CFO starts paying attention. They connect social activity to business outcomes, and they're where most social media reporting falls short. Clicks are easy. Outcomes are what matter.
- Click-through rate (CTR) and what drives it: CTR without conversion context is incomplete. A 5% CTR to a broken landing page is a 5% CTR that generated zero results.
- Conversion rate by campaign stage: What percentage of click-throughs completed the desired action? This varies dramatically by objective because a lead gen campaign might target 2–5%, while retargeting should expect considerably higher.
- Cost per acquisition (CPA) and cost per click (CPC): Your true efficiency metrics. They tell you not just whether a campaign worked, but whether it was worth running.
Audience metrics
Audience metrics answer a question most campaign reports skip: did you reach the right people? You can hit your reach target, nail your engagement rate, and still miss your audience entirely if demographic data doesn't match your intended targeting. This is especially critical when running social media campaigns designed for specific segments.
- Demographics reached vs. intended targeting: Are the people engaging with your campaign in your target segment? Age, location, and device breakdown tell you whether your targeting logic is working.
- Audience sentiment and brand perception shifts: Comment analysis and sentiment tracking reveal whether your campaign is changing how people feel about your brand, not just how many people saw it. This is where social media data collection moves beyond vanity metrics into genuine insight.
Content performance indicators
Content performance analysis is where you turn campaign data into a creative brief for next time. Your best post is either a signal or an accident, and understanding social media content performance to the letter separates reactive content teams from strategic ones.
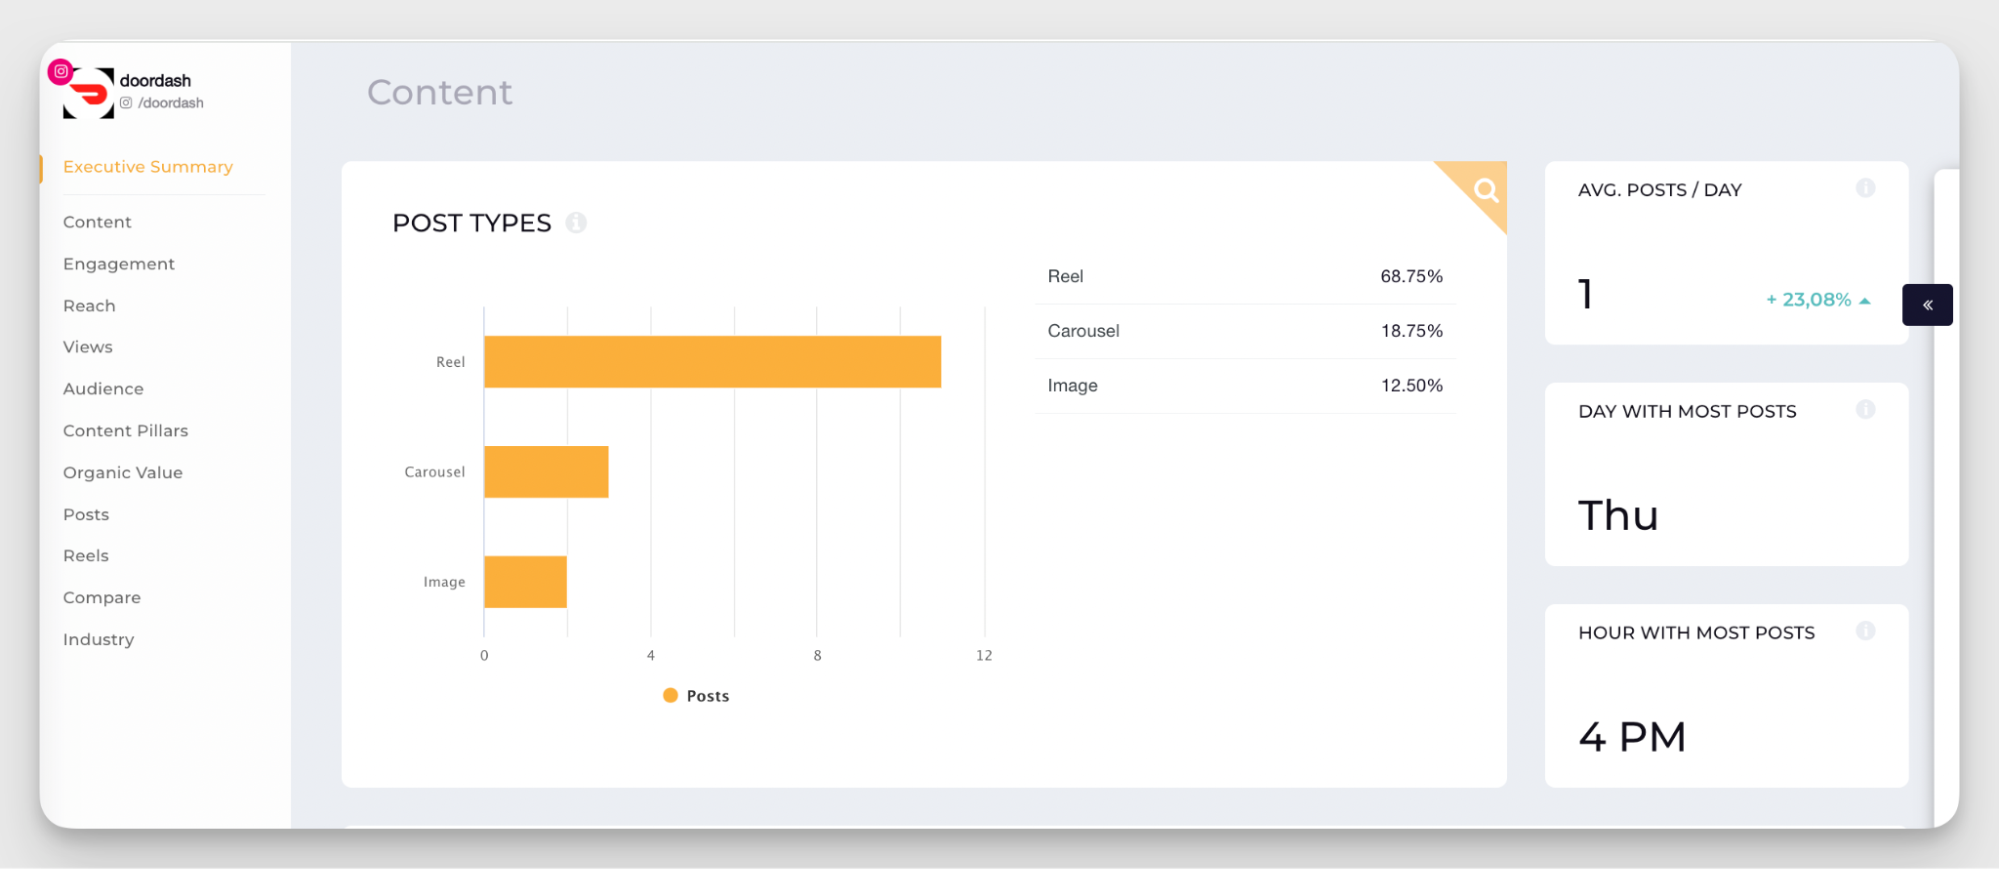
- Top-performing content formats: For DoorDash on Instagram, Reels accounted for 68.75% of posts which is an instructive signal about where audience engagement lives. Your content mix should be format-data-driven, not intuition-driven.
- Creative element analysis: Which messages landed? Which calls-to-action converted? Which visuals stopped the scroll?
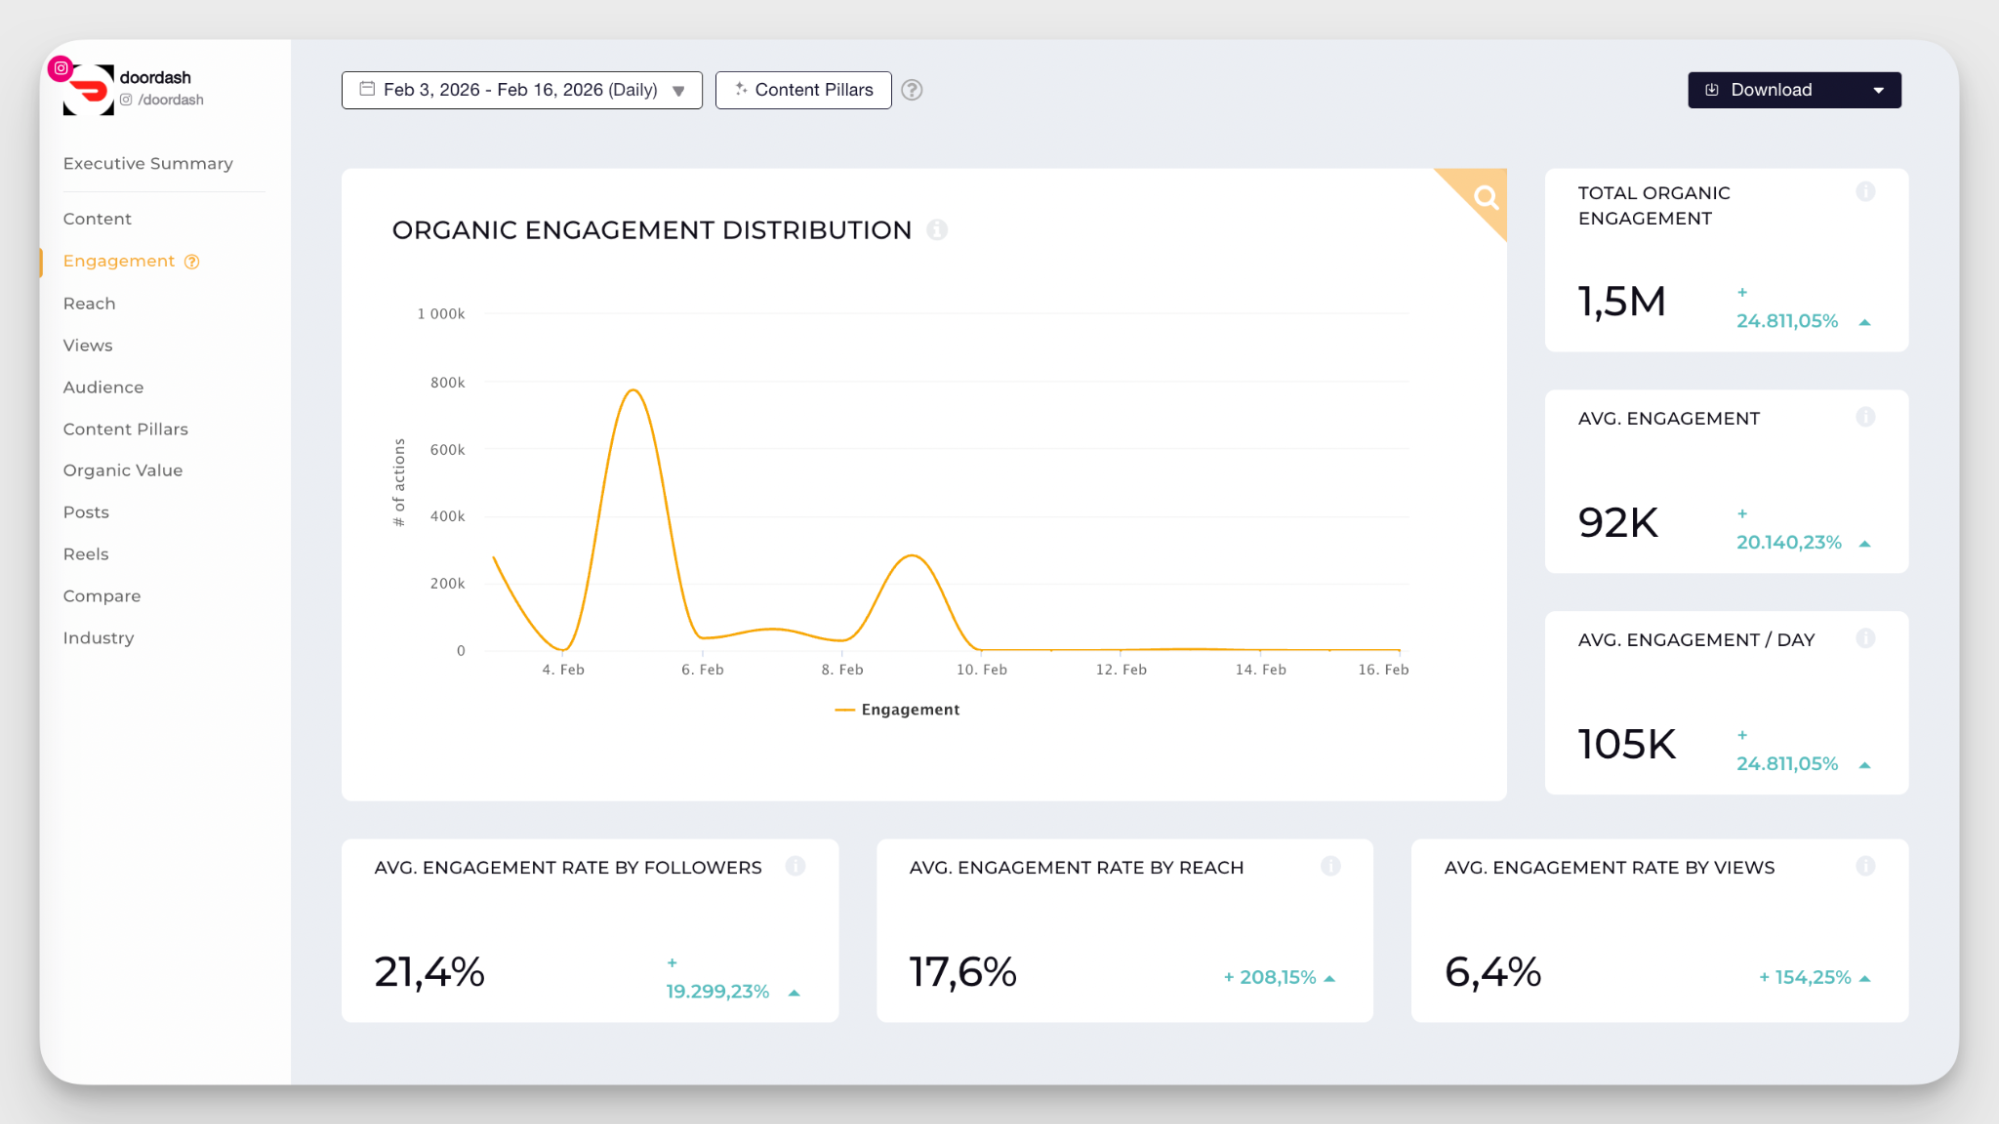
- Content engagement patterns over time: A campaign that spikes on day one and falls off sharply tells a fundamentally different story than one that builds steadily over two weeks. With Socialinsider, you can run an engagement analysis over different timeframes to identify changes and patterns, and in the case of spikes or drops, you can even identify the specific posts that led to those changes.
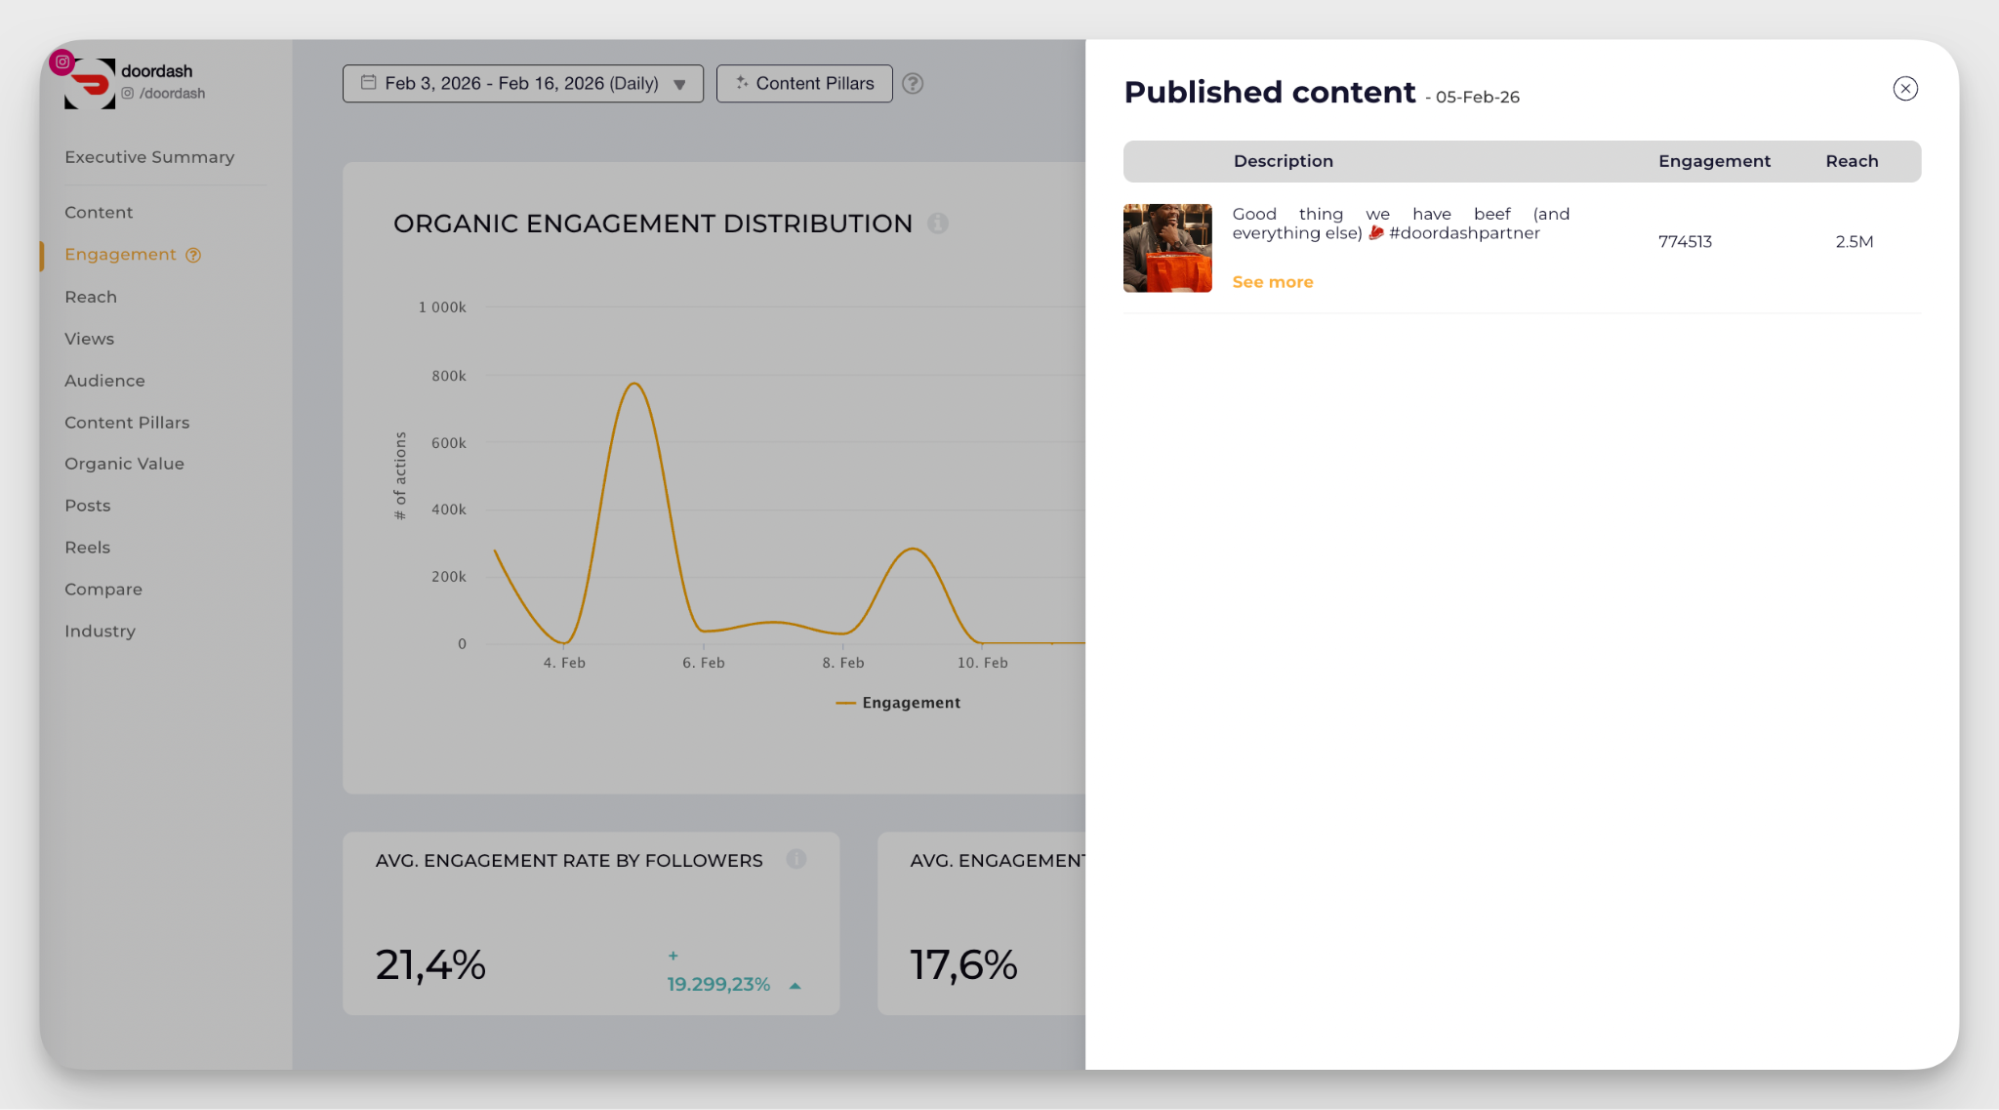
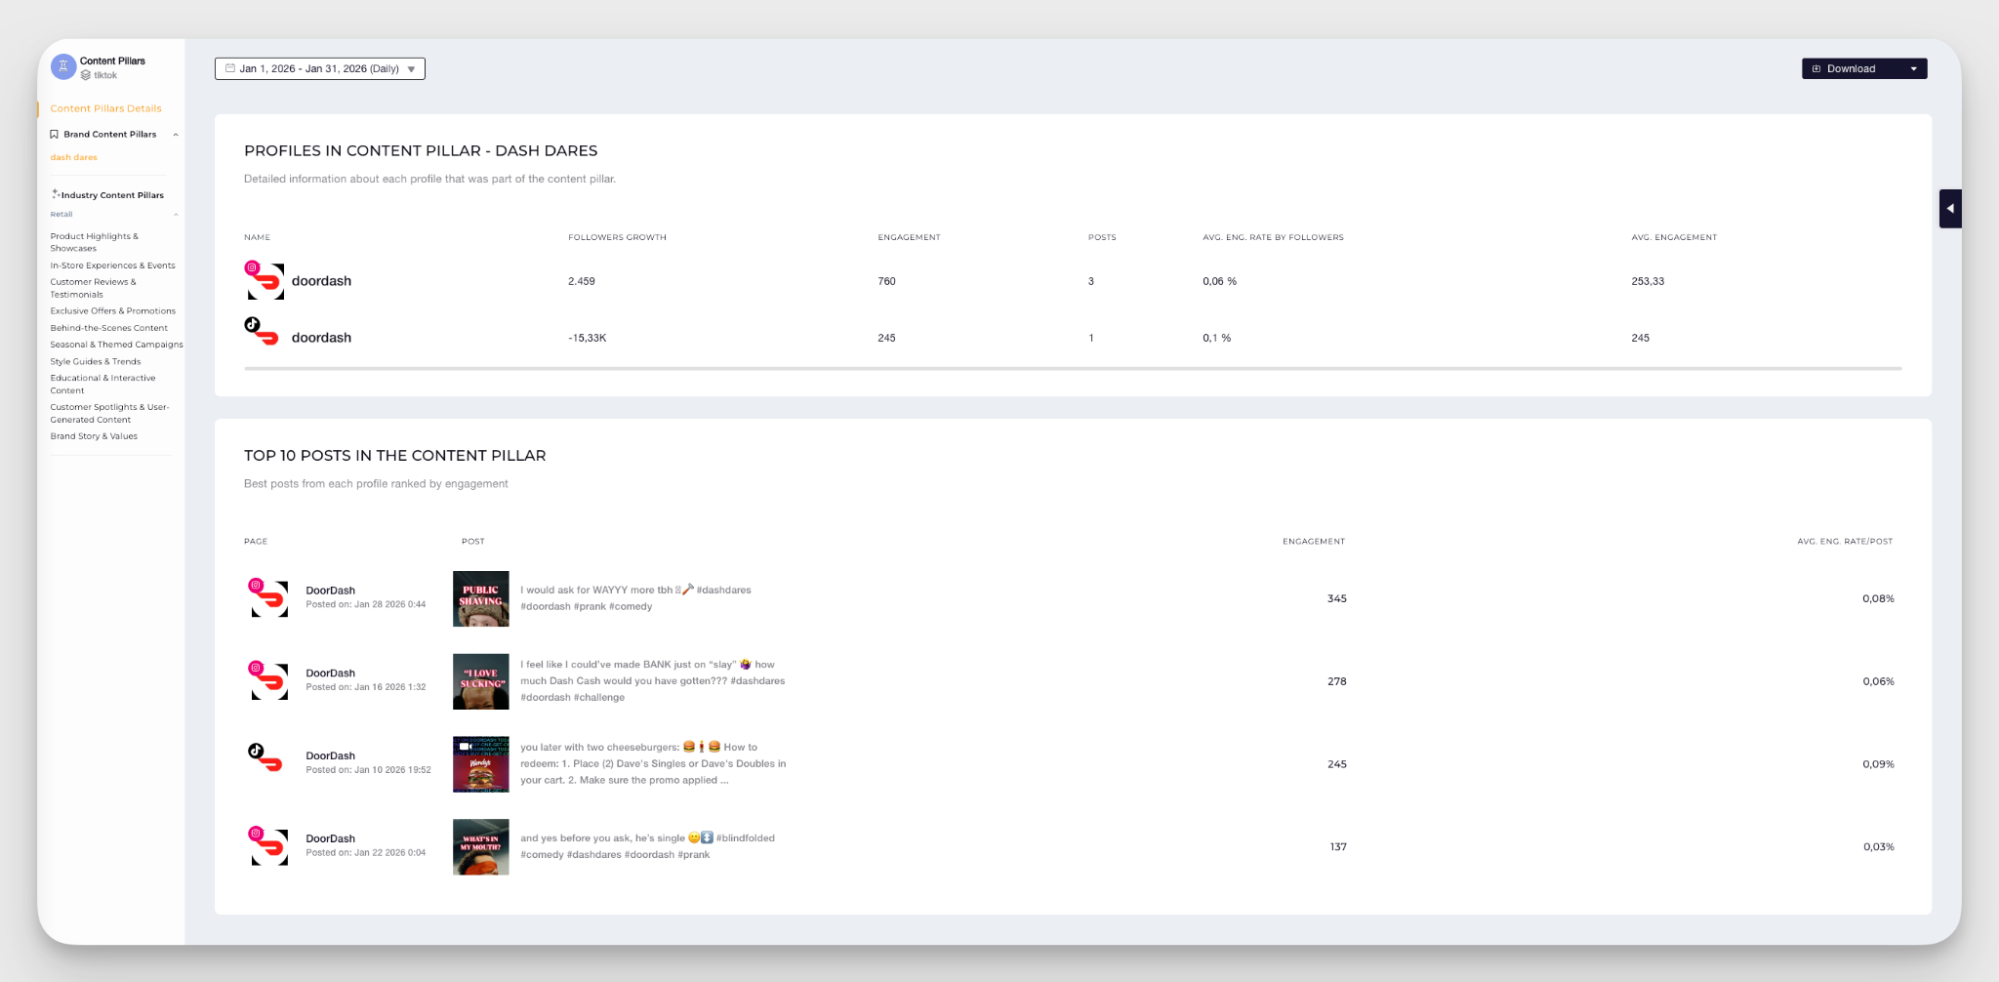
- Which campaign messages resonate most: Knowing your organic engagement rate gives you a clear baseline for what “good” actually looks like without paid amplification. When you break that down by content pillars, it becomes much easier to see which themes consistently drive engagement and which ones fall flat. That’s how you move from guessing what works to knowing exactly what to double down on.
#3. Evaluate the effectiveness of your campaigns
Campaign evaluation is the step most teams either rush. Metrics are pulled, a summary slide is built, and the team moves on to the next launch. This is expensive, and every campaign that isn't properly evaluated is a missed opportunity to compress the learning curve on the next one. This is what I advise:
Compare results against original objectives and benchmarks
Evaluation only means something if you have a baseline to evaluate against. Your three comparison points should be: (1) your own campaign objectives set at the outset, (2) your historical campaign performance, and (3) industry and competitor benchmarks. This is the core of interpreting social media analytics meaningfully rather than in isolation.
Historical benchmarking is where native analytics tools typically fall short. Many cap data retention at 90 days or less, meaning trending your own performance over 12 months requires either an external tool or a painful export-and-stitch process. Socialinsider's historical data analysis addresses this directly, allowing trend data across extended periods without manual reconstruction.
Identify replicable success factors
When a campaign overperforms, the instinct is to reverse-engineer it and repeat it exactly. Be careful here. Viral moments, algorithm windfalls, and timing-dependent wins are notoriously difficult to replicate. The more useful question: which elements were controllable and which were lucky?
Look for success factors you actually own: the content format, the message angle, the posting cadence, the call-to-action structure. Those are levers you can pull again. The rest is variance, and confusing variance for strategy is how post-mortems become ghost stories.
Create playbooks from successful campaigns
The most underused output of campaign analysis is the campaign template or playbook. Not a post-mortem deck that gets filed and forgotten, but a living document capturing: what worked, what didn't, which metrics mattered for this type of campaign, and what the team would do differently next time.
Brands with formalized campaign playbooks move faster on subsequent launches, maintain more consistent performance, and onboard new team members more effectively. The playbook is where individual campaign intelligence becomes institutional intelligence.
How to get competitive campaign intelligence?
Your campaign doesn't exist in a vacuum. It exists in the same feed, the same algorithm, and the same audience attention economy as your competitors' campaigns. Analyzing your own performance without tracking theirs is like training for a race without knowing how fast anyone else is running.
Why analyzing competitors' campaigns is a must?
Competitive campaign intelligence gives you two things your own data can't: context and gaps.
Context — is a 2% engagement rate good or bad for this category right now?
Gaps — what are competitors doing that's working, and what white space are they leaving open? This is why competitive monitoring should be a built-in component of every campaign framework, not an afterthought.
A real example from Socialinsider's own data: DoorDash, Uber Eats, and Instacart all use 'Product Highlights & Showcases' as a core content pillar on Instagram. The content category is identical across three direct competitors. But Instacart's engagement rate on that pillar is 0.82% compared to DoorDash's 0.26%. Same platform. Same content category. Different results.
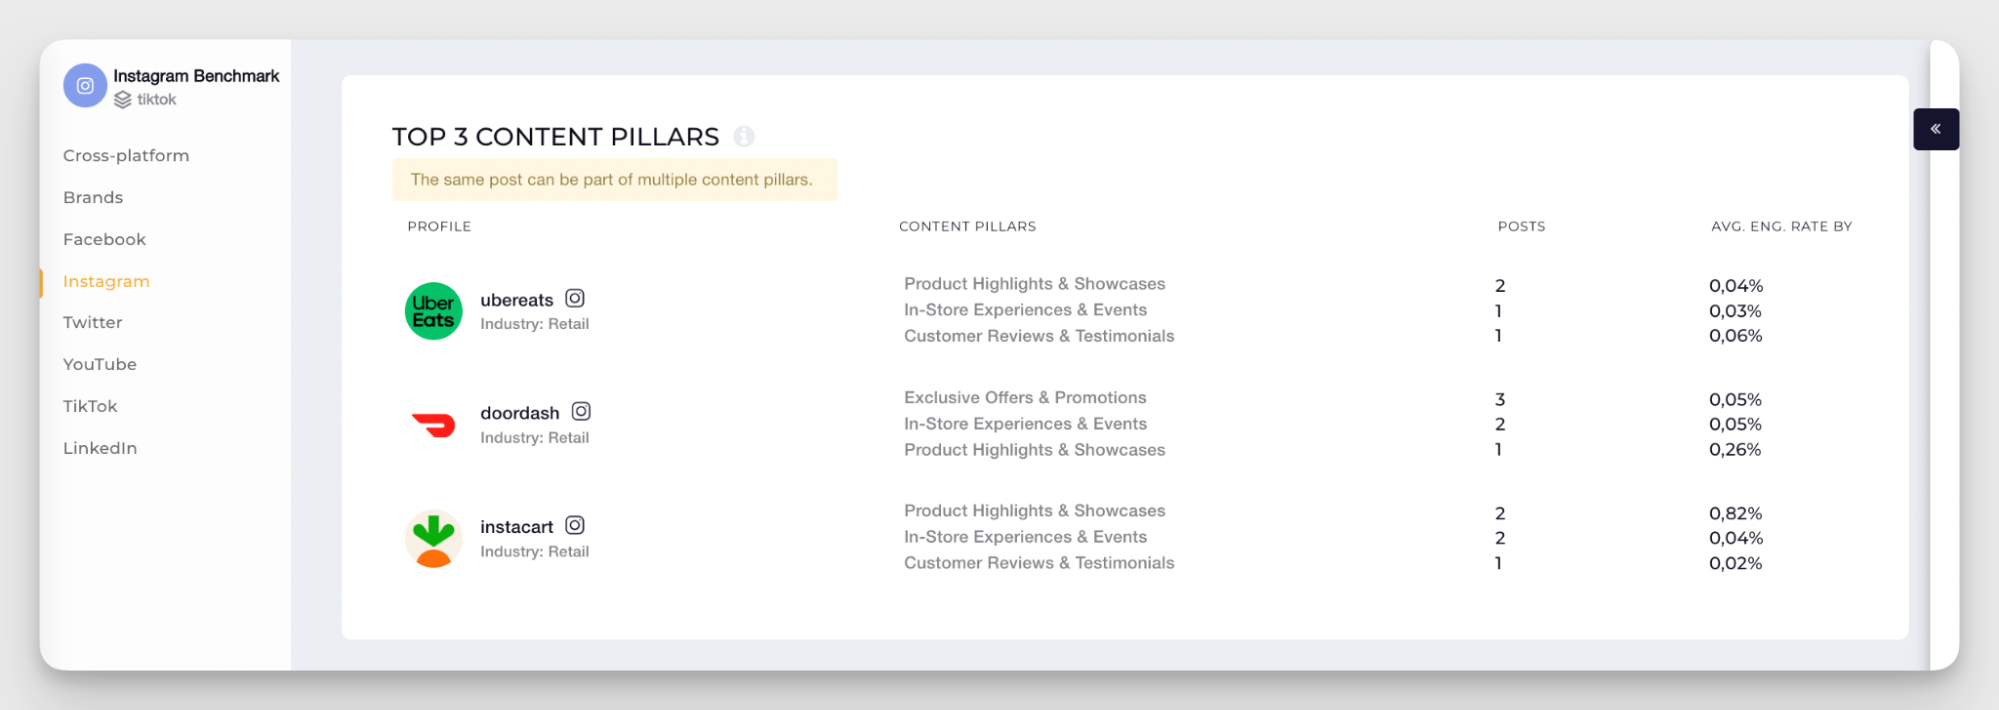
For DoorDash and Uber Eats, that single data point is an action item, not just information. It tells them exactly where to look: Instacart is executing within a shared strategy and generating 3x their engagement. What's different? The visual treatment? Caption structure? Posting cadence? Those are answerable questions if you're tracking the right competitive signals.
How to track and analyze competitors' campaign performance?
Effective competitive campaign analysis doesn't require access to competitors' internal dashboards. It requires consistent, structured monitoring of their public activity, and a tool that aggregates and benchmarks it meaningfully.
- Monitor competitor campaign launches and messaging: When a competitor drops a new campaign, the first thing to analyze is the creative angle. What problem are they positioning around? What audience signal triggered this timing?
- Track competitor engagement rates and audience response: Not just whether engagement is high, but what type of content is driving it and how the audience is responding in comments because that's qualitative signal hidden in quantitative data. Competitive insights at this level reveal execution gaps, not just performance gaps.
Best practices for effective campaign analysis
You can have all the data in the world and still lose the game, just ask any team that's ever drowned in a spreadsheet while their competitor was out making decisions. Knowing your numbers is table stakes. Knowing which numbers actually matter (and acting on them fast), is the whole game. This is what that looks like in practice.
Prioritize the metrics that actually matter
The average analytics platform tracks over 50 metrics. Most teams regularly use fewer than 10. The space between those two numbers is where dashboard fatigue lives and where the wrong metrics end up driving decisions.
To this, Matt also added:
Know what you're trying to achieve and determine what metrics best demonstrate the impact of the activation or content. Look at the broader context and world events too, seasonality and the news agenda can have an impact on how your campaign performs. Have benchmarks and previous experience up your sleeve for comparison. Ultimately, just because you can measure almost anything in social, doesn't mean you should. It's critical to prioritise what you're measuring according to your objectives, otherwise you can find yourself lost in an incredible volume of data. There's no point in having a data lake if you don't know what you're fishing for.
The Campaign Signal Stack offers a useful filter for what goes in your dashboard and what gets cut:
Most campaign reports live in Layers 1 and 2. Real social media analytics connects all four layers, and clearly shows where the chain breaks between a strong engagement rate and a weak conversion rate. That break is where you will find the path to campaign optimization.
Establish baselines and benchmarks
A metric without a benchmark is just a number. Before you can say whether a 2.1% engagement rate is a win or a loss, you need three baselines: your historical average for this campaign type, your industry benchmark for the relevant platform, and a competitive benchmark for your top two to three direct competitors. These three points transform post-campaign evaluation from opinion into evidence. This is the core of what social media analytics best practices consistently recommend.
One underrated benchmarking move I like to recommend: track your own campaign performance over rolling 90-day windows, not just at the end. This is how you spot engagement decay early before the campaign closes and the window for creative adjustment has already passed.
Leverage AI for strategic recommendations
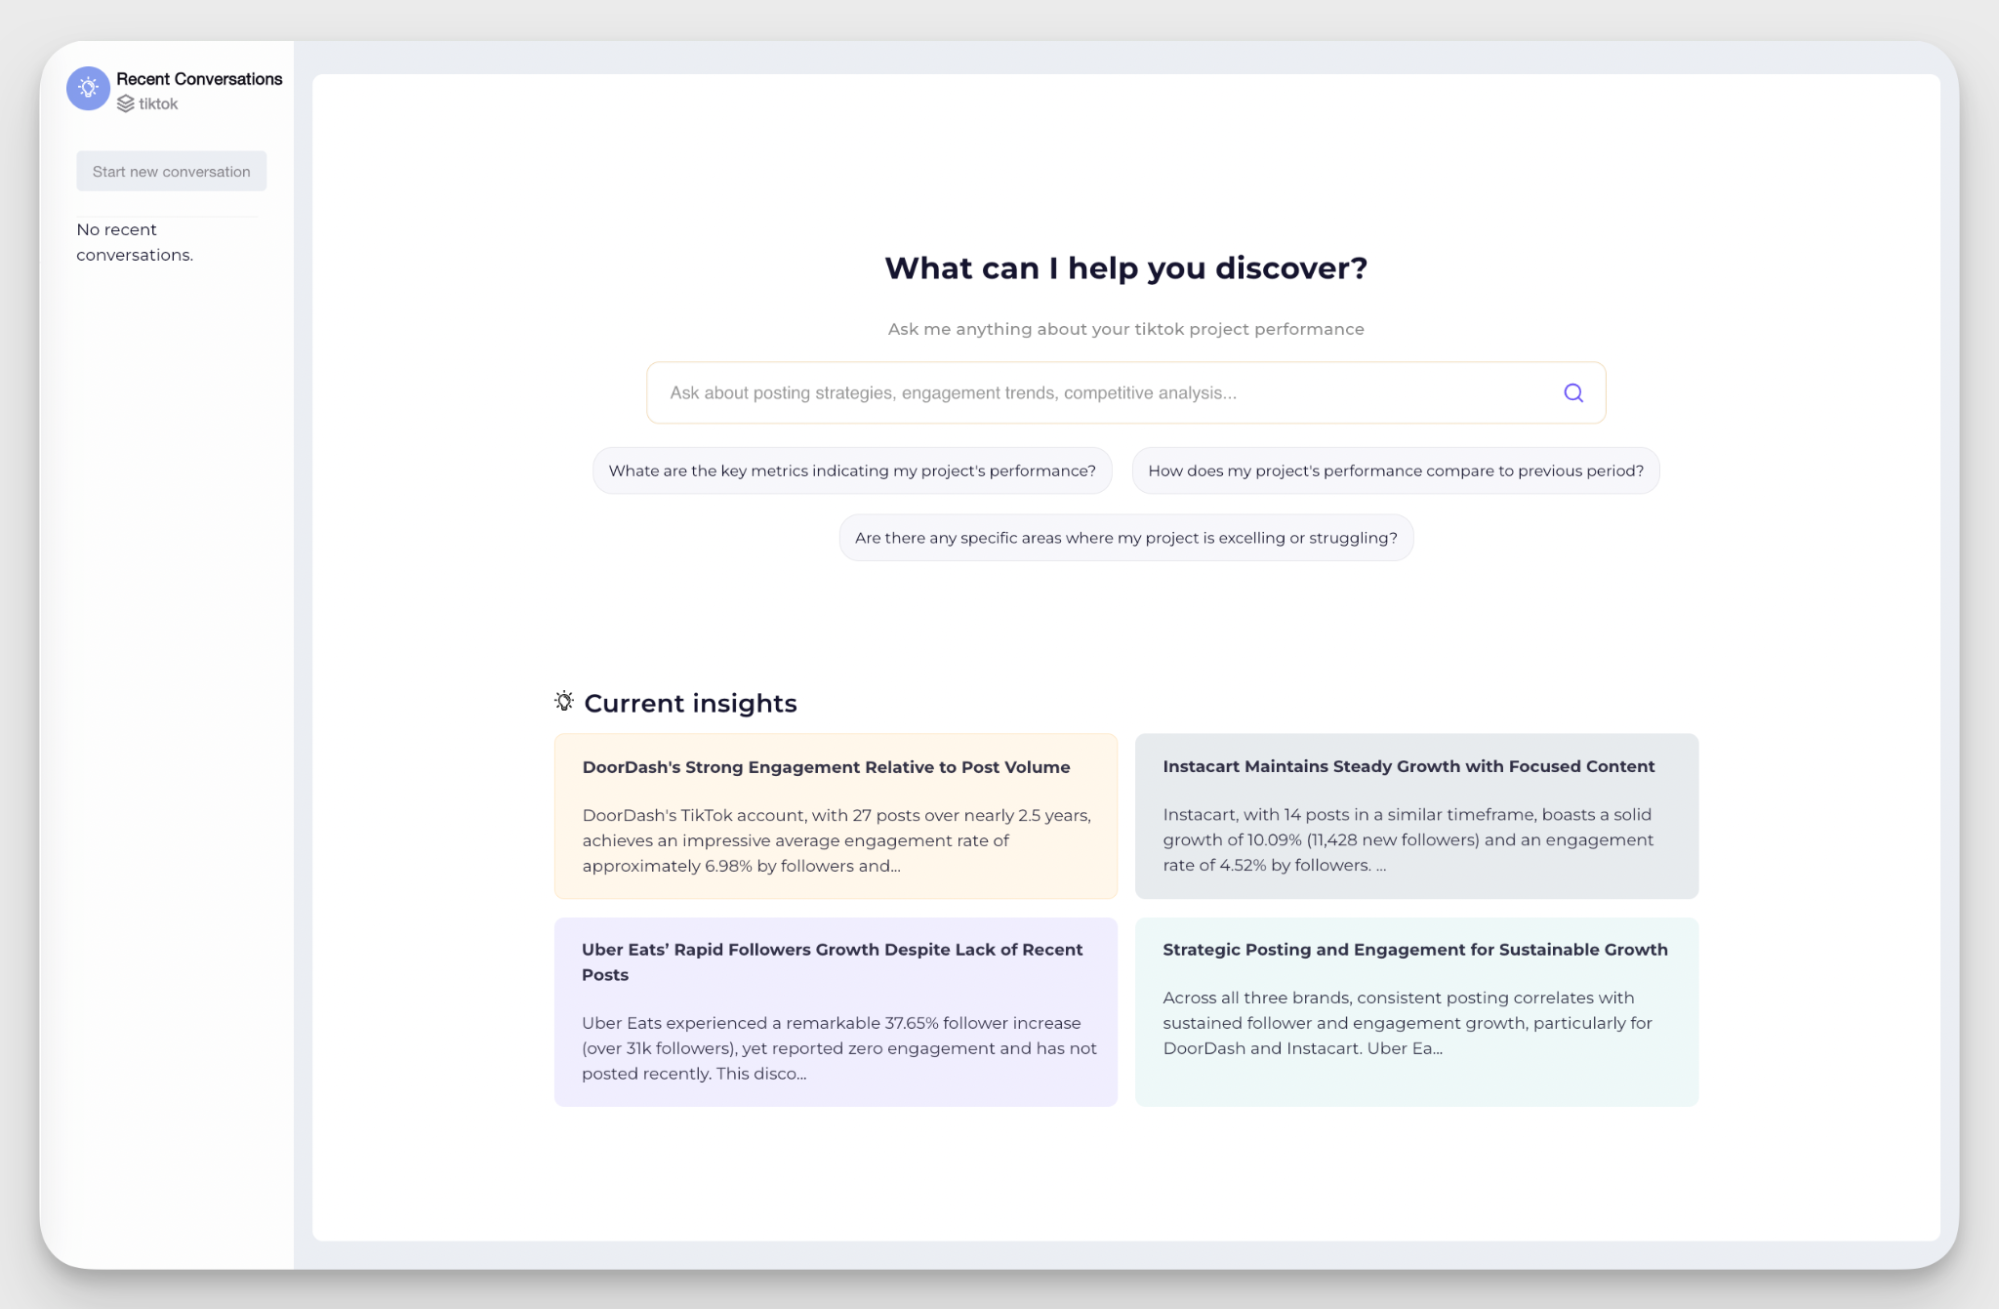
AI in campaign analytics isn't about replacing judgment, it's about reducing the time between data and decision. Automated pattern recognition, anomaly detection, and natural-language insight summaries mean AI-driven insights give teams the ability to act on signals that would previously have required a full analyst deep-dive.
Socialinsider's integrated AI social media assistant gives you insights directly within your campaign data: flagging performance anomalies, identifying which content pillars are driving growth, and generating strategic questions based on what the data shows. It makes the jump from 'I see these numbers' to 'here's what they mean and what I should do next' significantly shorter. For a deeper view of how this works in practice, see how to use AI in social media analysis.
Final Thoughts
If you’ve ever looked at a campaign report and thought, “This looks good… but I’m not sure what to do with it,” you’re not alone.
This marketer who reported inflated LinkedIn metrics for eighteen months isn't a cautionary tale about incompetence. They're a cautionary tale about what happens when measurement systems aren't built intentionally, when we assume our tools are giving us what we think they're giving us, and when nobody questions the numbers because they look good.
Campaign performance analysis done right isn't glamorous. It's disciplined. Define before you launch. Select KPIs that connect to decisions. Evaluate with context. Build the playbook. Repeat faster and smarter each time.
With the right structure in place, you’ll walk into your next report not just with numbers, but with answers.
FAQs on campaign performance analysis
How do I build a campaign playbook from analytics?
Document your measurement system (objectives, KPIs, benchmarks) before you launch. After the campaign, record what worked, what didn't, and why while referencing specific data points rather than impressions. Store it where the next team member will find it. See content tagging system for how to structure the tagging infrastructure that makes this analysis possible at scale, and brand performance for the long-term tracking layer that turns individual campaign learnings into strategic intelligence.
How can Socialinsider help with social media campaign measurement?
Socialinsider provides:
- Cross-platform campaign tracking in one dashboard, with customizable content pillars that aggregate data across Instagram, Facebook, LinkedIn, TikTok, YouTube, and X
- Competitive campaign benchmarking without requiring access to competitor accounts
- Historical trend analysis for meaningful period-over-period comparison and long-term pattern identification
- AI-powered insights that surface strategic recommendations directly from your campaign data
- Social media content analysis at the post and pillar level, so you can identify exactly which creative elements drove performance shifts
Nsikak Tim
B2B content marketer with 9 years in marketing and 6 years in content writing. I focus on sharp, insight-driven content that doesn’t sound like it was approved by five stakeholders and a legal team.
Know what your competitors do — before your manager asks
Get instant social benchmarks & reports without manual work.
You might also like


Improve your social media strategy with Socialinsider!
Use in-depth data to measure your social accounts’ performance, analyze competitors, and gain insights to improve your strategy.