Social Media Automated Reporting: How to Simplify Performance Measurement
Learn how to ace performance tracking through social media automated reporting. Discover tools and features that can quickly simplify your work.


At some point, be it weekly or monthly, every social media expert gets asked the same question: How did we perform on social media?
Answering that question should be simple. But in reality, some social media teams still spend hours pulling data from different platforms, cleaning spreadsheets, and double-checking numbers before they can even start analyzing.
Automating your social media reports saves time, reduces errors, and helps you focus on what really matters: understanding performance and improving your strategy.
In this guide, I’ll walk you through why automated social media reporting makes sense, what to look for in a reporting tool, and how to set up automated reports with Socialinsider.
Key takeaways
-
Why should you switch from manual to automated social media reporting? Automated social media reporting saves hours of manual work, keeps your data consistent, and makes it easier to analyze performance across platforms without spreadsheet errors.
-
What to look for in an automated social media reporting tool? The right reporting tool should combine multi-platform data integration, flexible exports, scheduled delivery, and competitive benchmarking without adding unnecessary complexity or cost.
-
What metrics should you track? A useful social media report focuses only on the metrics that match your goals, combining engagement, growth, content performance, and competitor data to give real strategic insights instead of just numbers.
Why should you switch from manual to automated social media reporting?
I once worked on a project where I had to pull analytics manually from several platforms into one reporting sheet. The data was very handcrafted and as close to native as possible.
But doing it manually took forever.
Analytics matter a great deal. But every hour spent gathering numbers steals time from actual social media analysis, content creation, testing new formats, and building a better strategy.
So when you switch from manual to automated social media reporting, you:
- Save time on data collection. Instead of opening every platform one by one and pasting numbers into a spreadsheet, automation gathers the data for you in one place. Less tab switching, fewer spreadsheets, and a lot less time wasted.
- Keep your data consistent. When reports follow the same structure every time, it becomes much easier to track performance over time. Automated tools apply the same metrics and timeframes across reports, so you don’t end up comparing apples to oranges.
- Eliminate human errors in data compilation. Manual reporting invites small mistakes: copying the wrong number, forgetting to change the time range, or breaking a spreadsheet formula. Automated reporting pulls the metrics directly from the platforms.
- Simplify benchmarking. Consistent data makes benchmarking much easier. When your reports follow the same structure each cycle, you can quickly compare results across months, campaigns, or platforms and track how your performance changes.
- Get clearer cross-platform insights. Social media strategies rarely live on just one platform. Automated reporting pulls analytics from multiple channels into one dashboard, making it easier to compare results and understand what’s really driving performance.
What to look for in an automated social media reporting tool?
There’s no shortage of social media analytics tools on the market. Some focus on reporting, others on publishing, listening, or a bit of everything.
But if you want stakeholders to approve adding a new tool to the stack, it usually comes down to three things: features, budget, and how well the two balance out. Your goal is to find the tool that supports your reporting workflow without blowing the budget.
Feature-wise, there are a few capabilities I would call nearly non-negotiable:
- Multi-platform data integration. It defeats the purpose of automation if you still need to collect data manually from some platforms. Make sure the tool pulls analytics from all the social networks you manage.
- Flexible export options. Reports should be available in several formats, like PDF, PowerPoint, CSV, or PNG, depending on how the data will be presented.
- Scheduled or recurring report delivery. Automation should also cover distribution. A good reporting tool can generate and send reports automatically on a weekly, monthly, or quarterly schedule.
- White-label and branded reports. This is especially useful if you’re working with multiple projects. Being able to add your branding makes reports client-ready without extra editing.
- Competitive benchmarking capabilities. Social media metrics rarely make sense in isolation. The right tool should also give you context by showing how your competitors perform and where you stand in the market.
Advanced capabilities that set tools apart
Once the essentials are covered, some additional capabilities can make reporting much more powerful. These are especially useful for teams that are going full data-driven in their marketing and rely heavily on performance data to guide their strategy.
- Cross-platform competitive analysis. Instead of comparing competitors platform by platform, advanced tools allow you to analyze competitive performance across multiple channels at once.
- Custom metrics and KPI tracking. Not every team measures success the same way. The ability to define custom KPIs helps you align reports with your specific business goals or stay consistent in how you measure some of your metrics.
- Historical data access (12–24 months). Long-term data helps you spot seasonal trends, measure long-term growth, and put recent performance changes into perspective.
Integrations
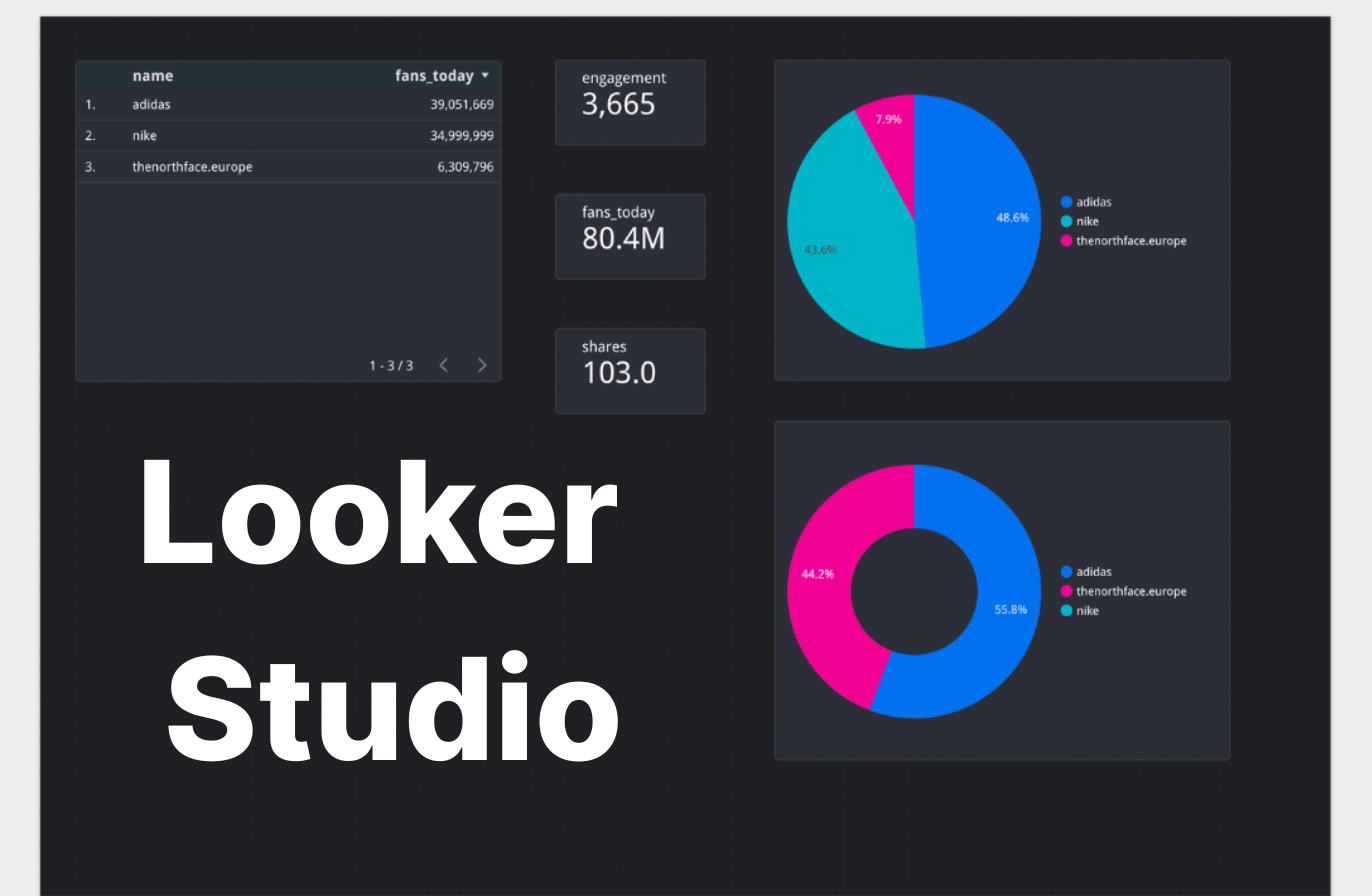
If you work with business intelligence tools like Looker Studio or Tableau, make sure the social media reporting tool can integrate with them. In this case, you’ll be able to include social media data into broader marketing or business dashboards, alongside data from ads, CRM systems, or website analytics.
Another useful capability is API access for custom workflows. An API allows teams to pull social media analytics into internal tools, build custom dashboards, or connect reporting data with other systems in their analytics stack.
How to set up automated social media reports with Socialinsider?
There are plenty of analytics tools out there, and some offer more than others.
Socialinsider combines social media performance analytics with competitive benchmarking and automated reporting in one place. That means you can track your own results, compare them with competitors, and send regular reports without manually compiling the data.
Here’s how to set up automated social media reports in Socialinsider.
Define your reporting goals and the needed reporting frequency
Before setting up any report, clarify what question the report should answer. Reporting only becomes useful when it helps guide your strategy, and different reports usually serve different purposes.
For example, you might create reports for:
- Ongoing performance analysis. Regular reports that track how your social media channels perform over time.
- Campaign analytics. Reports focused on a specific campaign to understand its impact on metrics like reach, engagement, or click-through rate.
- Social media audits. A broader performance overview used to evaluate your current strategy and identify gaps.
- Competitor research. Reports that analyze how your brand performs compared with competitors in your space.
Once you define the goal, decide how often the report should run.
There’s no universal rule here. The right reporting cadence depends on your team, stakeholders, and how closely you monitor your social media performance.
I personally like to track my ongoing performance weekly and monthly, with more top-level quarterly reports I share with leadership or stakeholders. Weekly reports help me react quickly to changes, while monthly and quarterly reports give a broader view of trends.
Identify the relevant metrics for you
Tools like Socialinsider help you track tons of metrics, but not all of them need to make it into your reports. The art of social media reporting is in choosing the numbers that help you evaluate your strategy and understand what resonates with your audience.
Here are a few key metric groups most social media reports should include.
Engagement metrics
Engagement metrics show how people interact with your content. They are often the fastest way to understand whether your posts resonate with your audience.
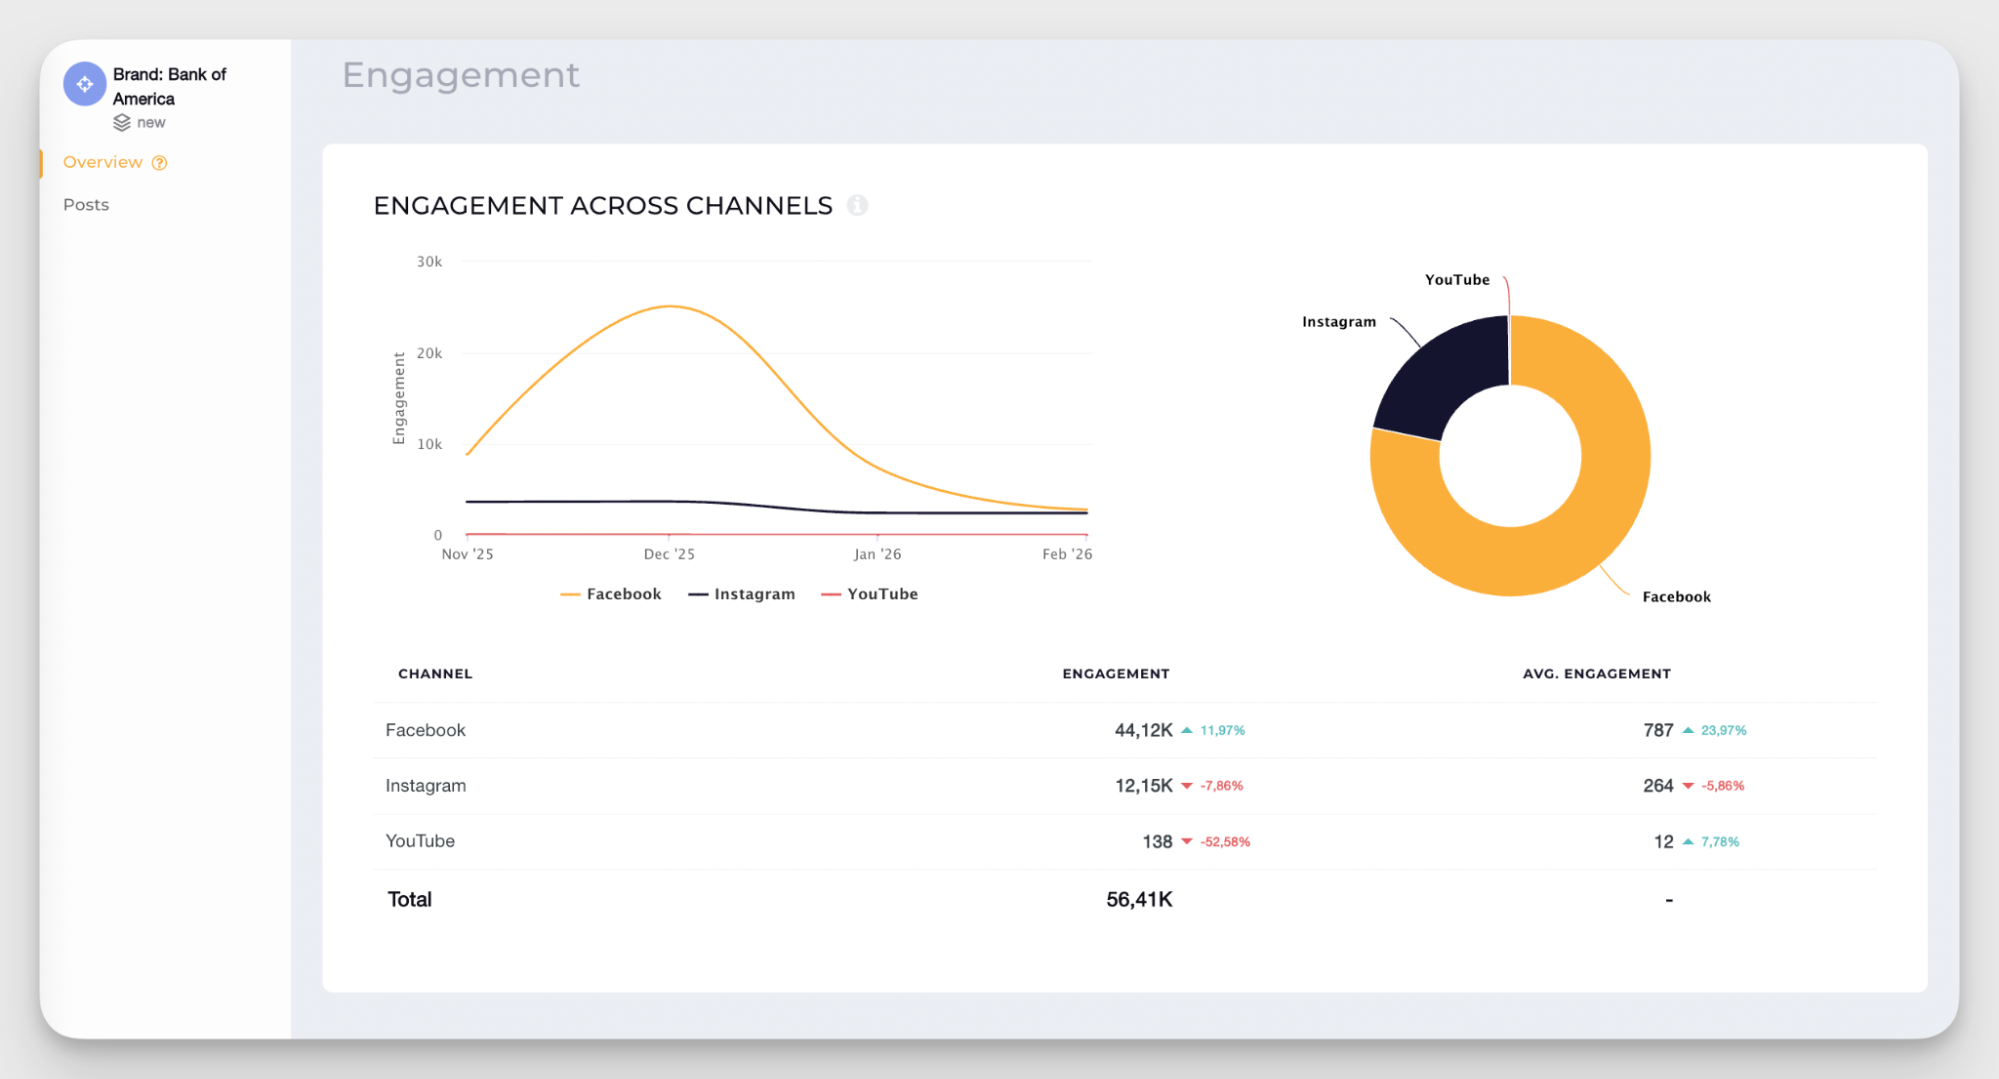
- Engagement across all platforms. This gives you a high-level overview of how much interaction your content generates overall. Tracking engagement across channels helps you quickly see whether your strategy is gaining traction or losing momentum.
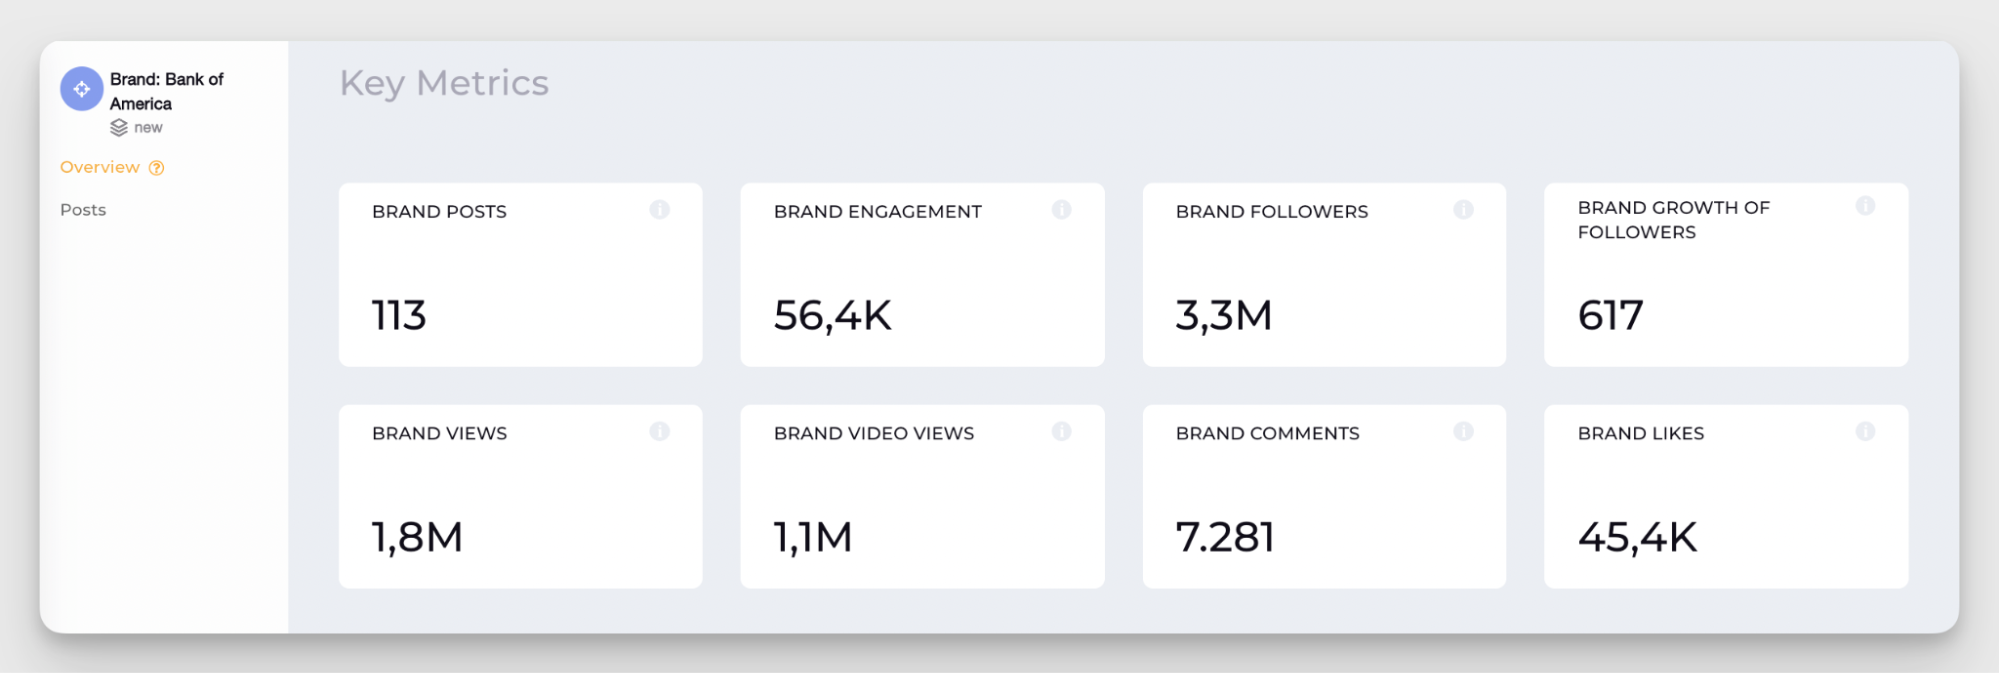
- Platform-by-platform breakdown. Each platform behaves differently, so it’s important to analyze engagement individually. This helps you understand where your content performs best and where you may need to adjust your approach.
Growth metrics
Growth metrics show whether your social media presence is expanding and how far your content travels.
Even if you don’t prioritize growth, it’s still a very important indicator that can show you whether you’re stalling or moving forward.
- Follower growth. This metric shows whether your strategy attracts new audiences over time. Consistent growth usually signals that your content resonates and your brand visibility is increasing.
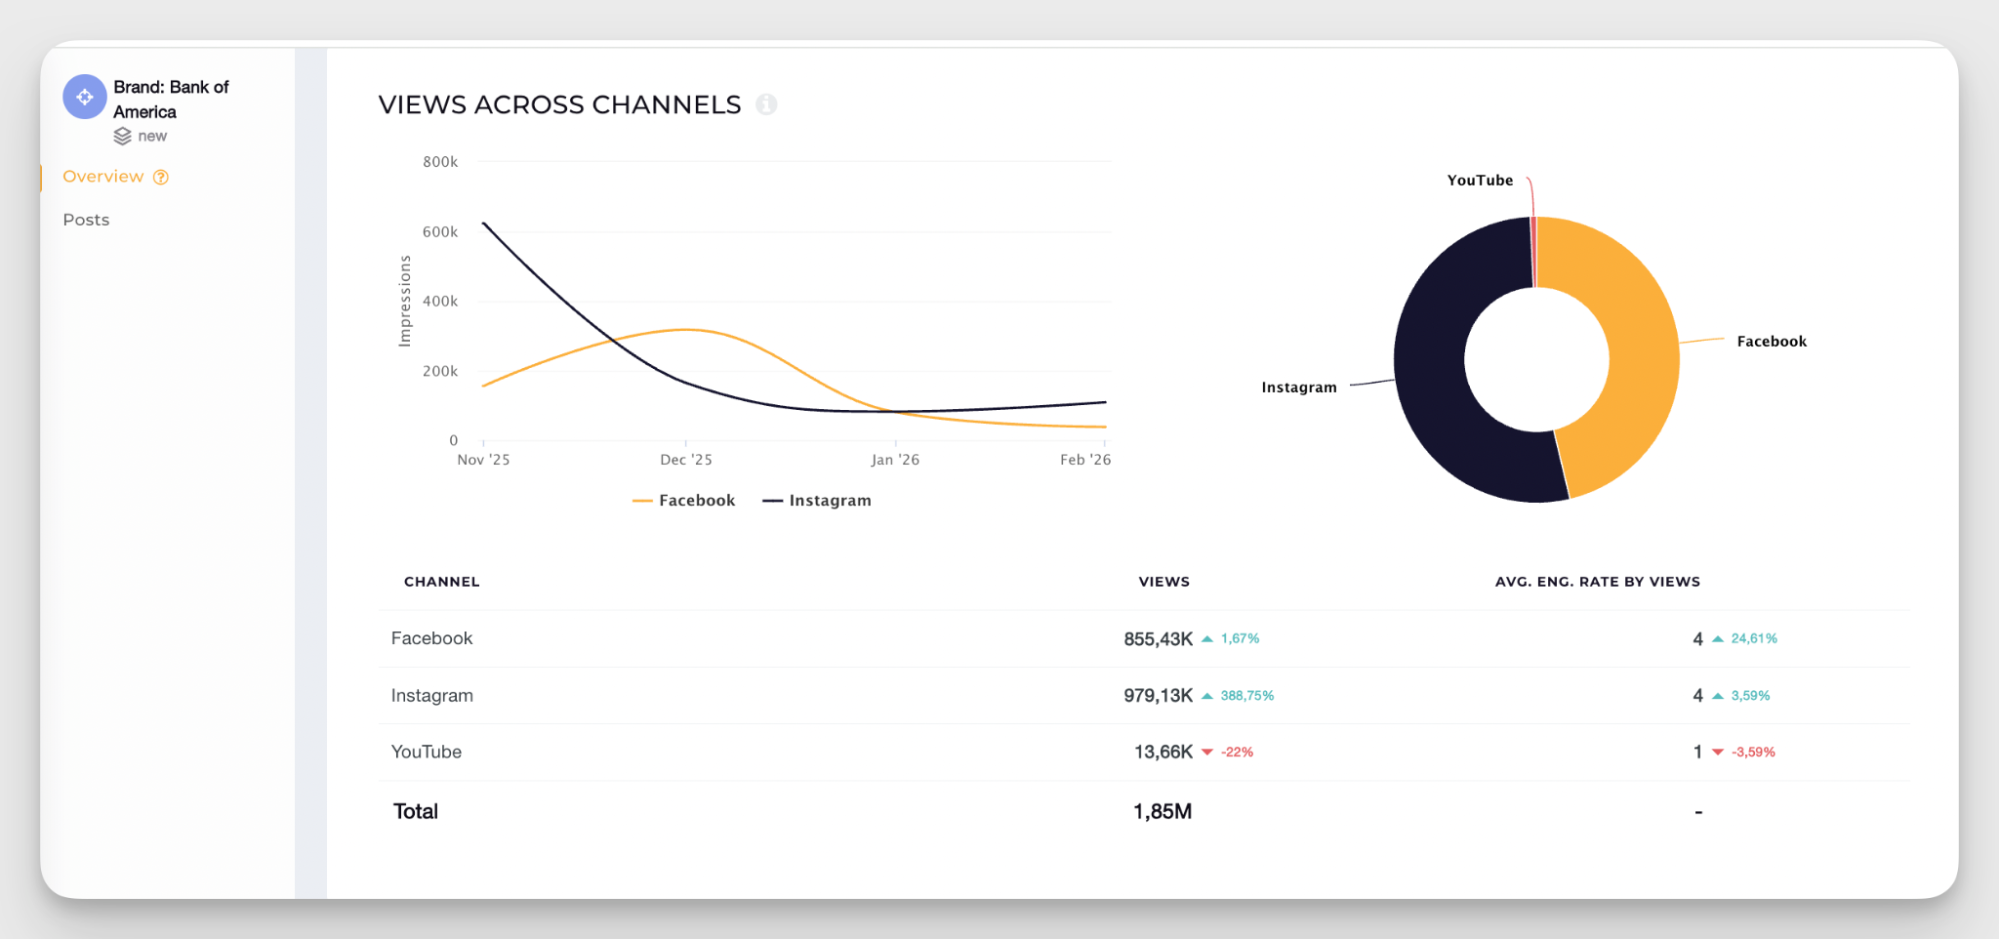
- Reach. Reach measures the number of unique users who saw your content. It’s a good indicator of whether your posts are reaching new audiences outside your current follower base.
- Impressions or views. These help you understand the overall visibility your posts generate.
Content performance
Content-related data is immensely helpful when you’re refining your social media strategy. Tracking your best-performing posts and resonating topics might not be as direct as the growth number, but they give context to all the numerical metrics you track.
My personal tip is to analyze your content performance in a monthly window, not weekly. The life span of social media content is pretty short, but sometimes, content blows up in a couple of days or even in a week after you post. A month-long window is a relatively balanced time frame for grounded analysis.
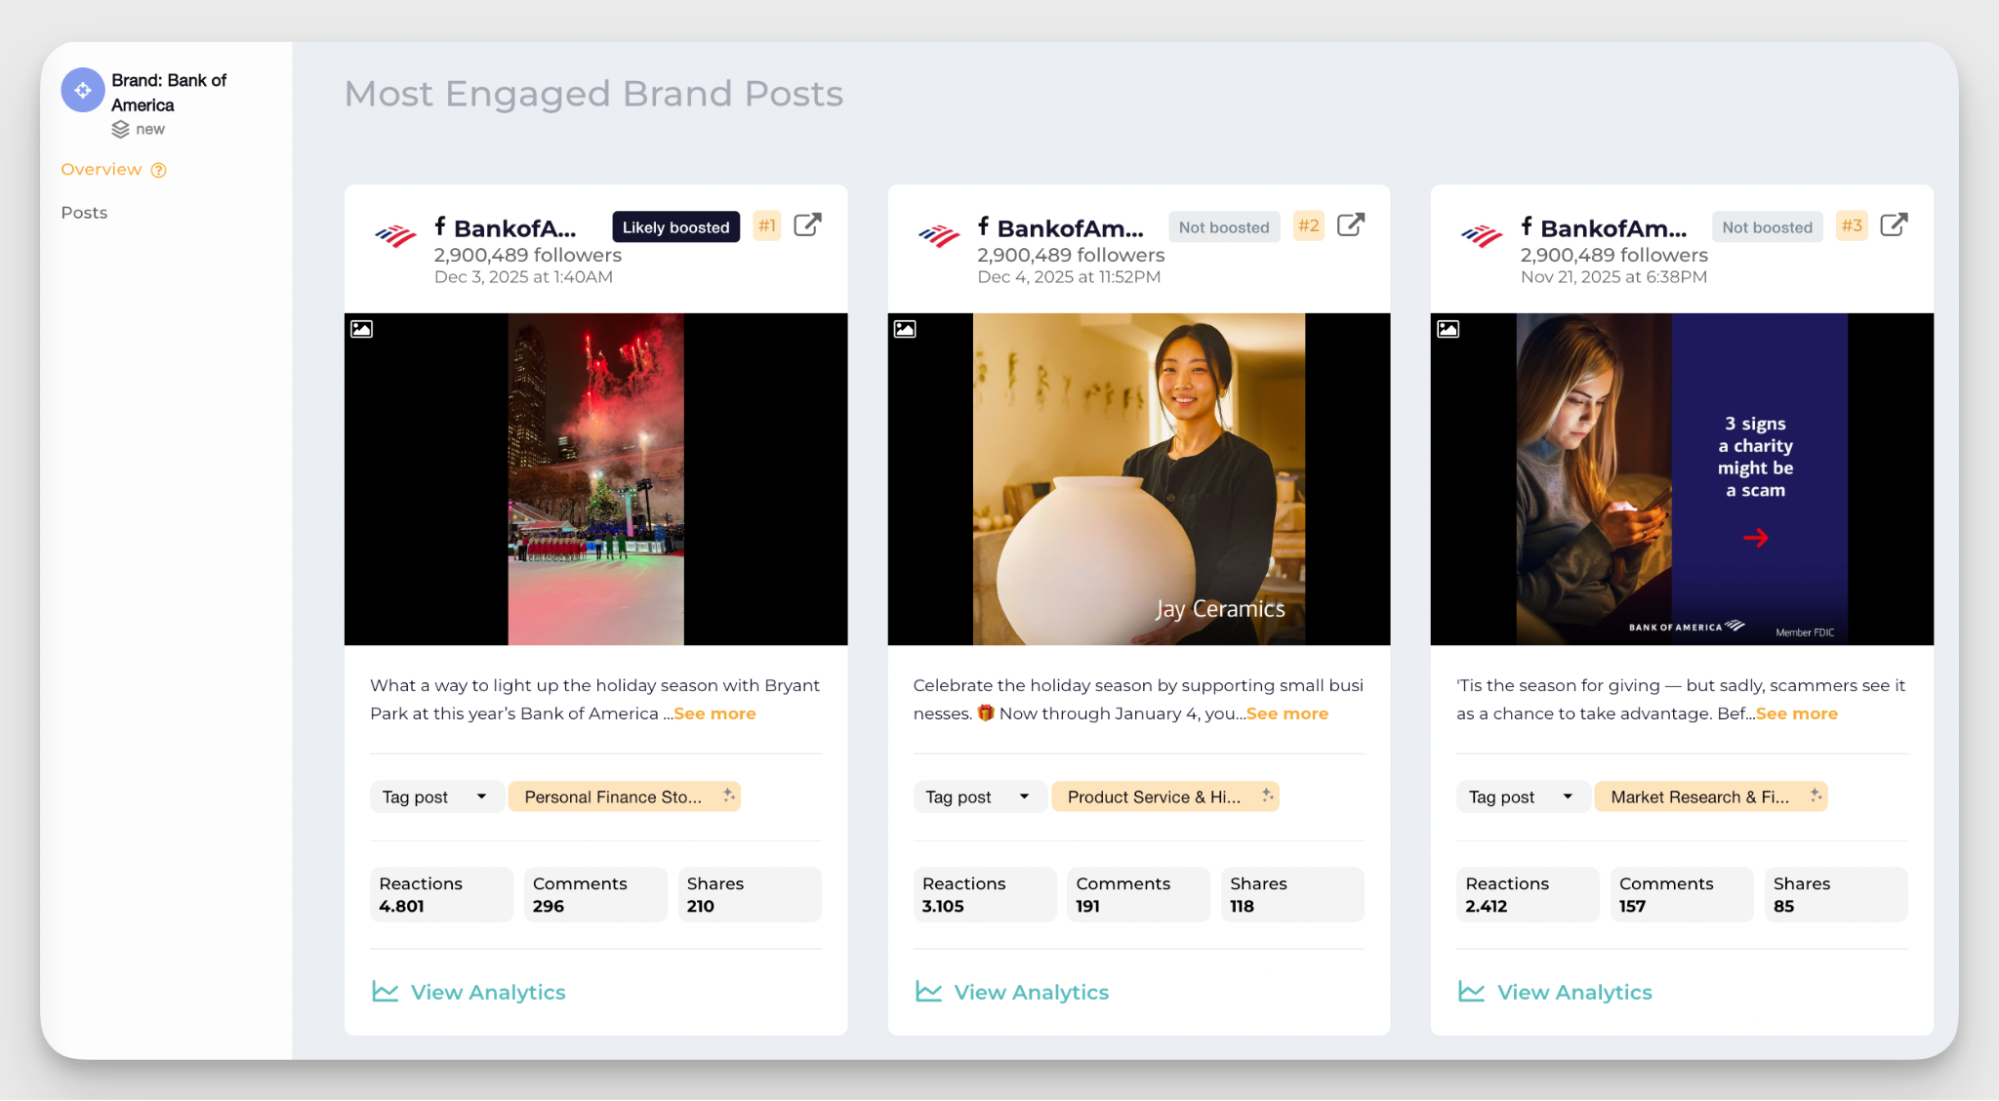
- Top posts by engagement. Identifying the posts that generated the most interaction helps you see what topics, formats, or hooks resonated the most with your audience.
- Best-performing content formats by platform. This metric highlights which format is working the best for you on each platform. This helps you adjust how you repurpose and distribute your content.
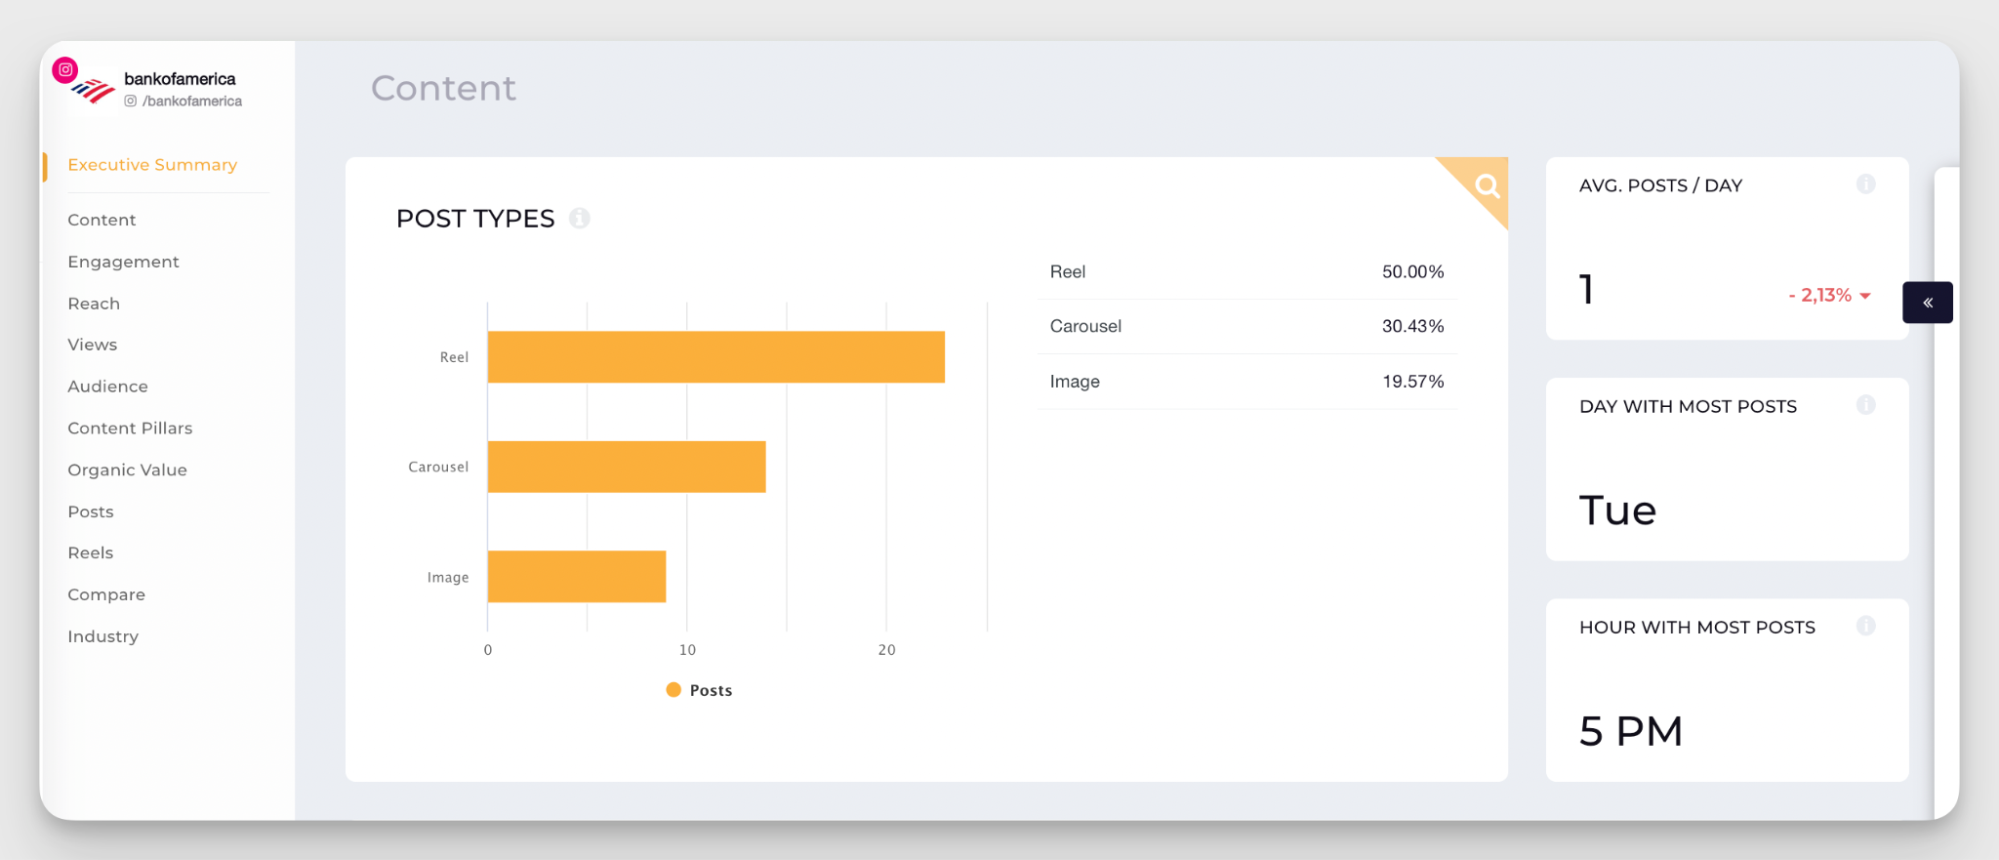
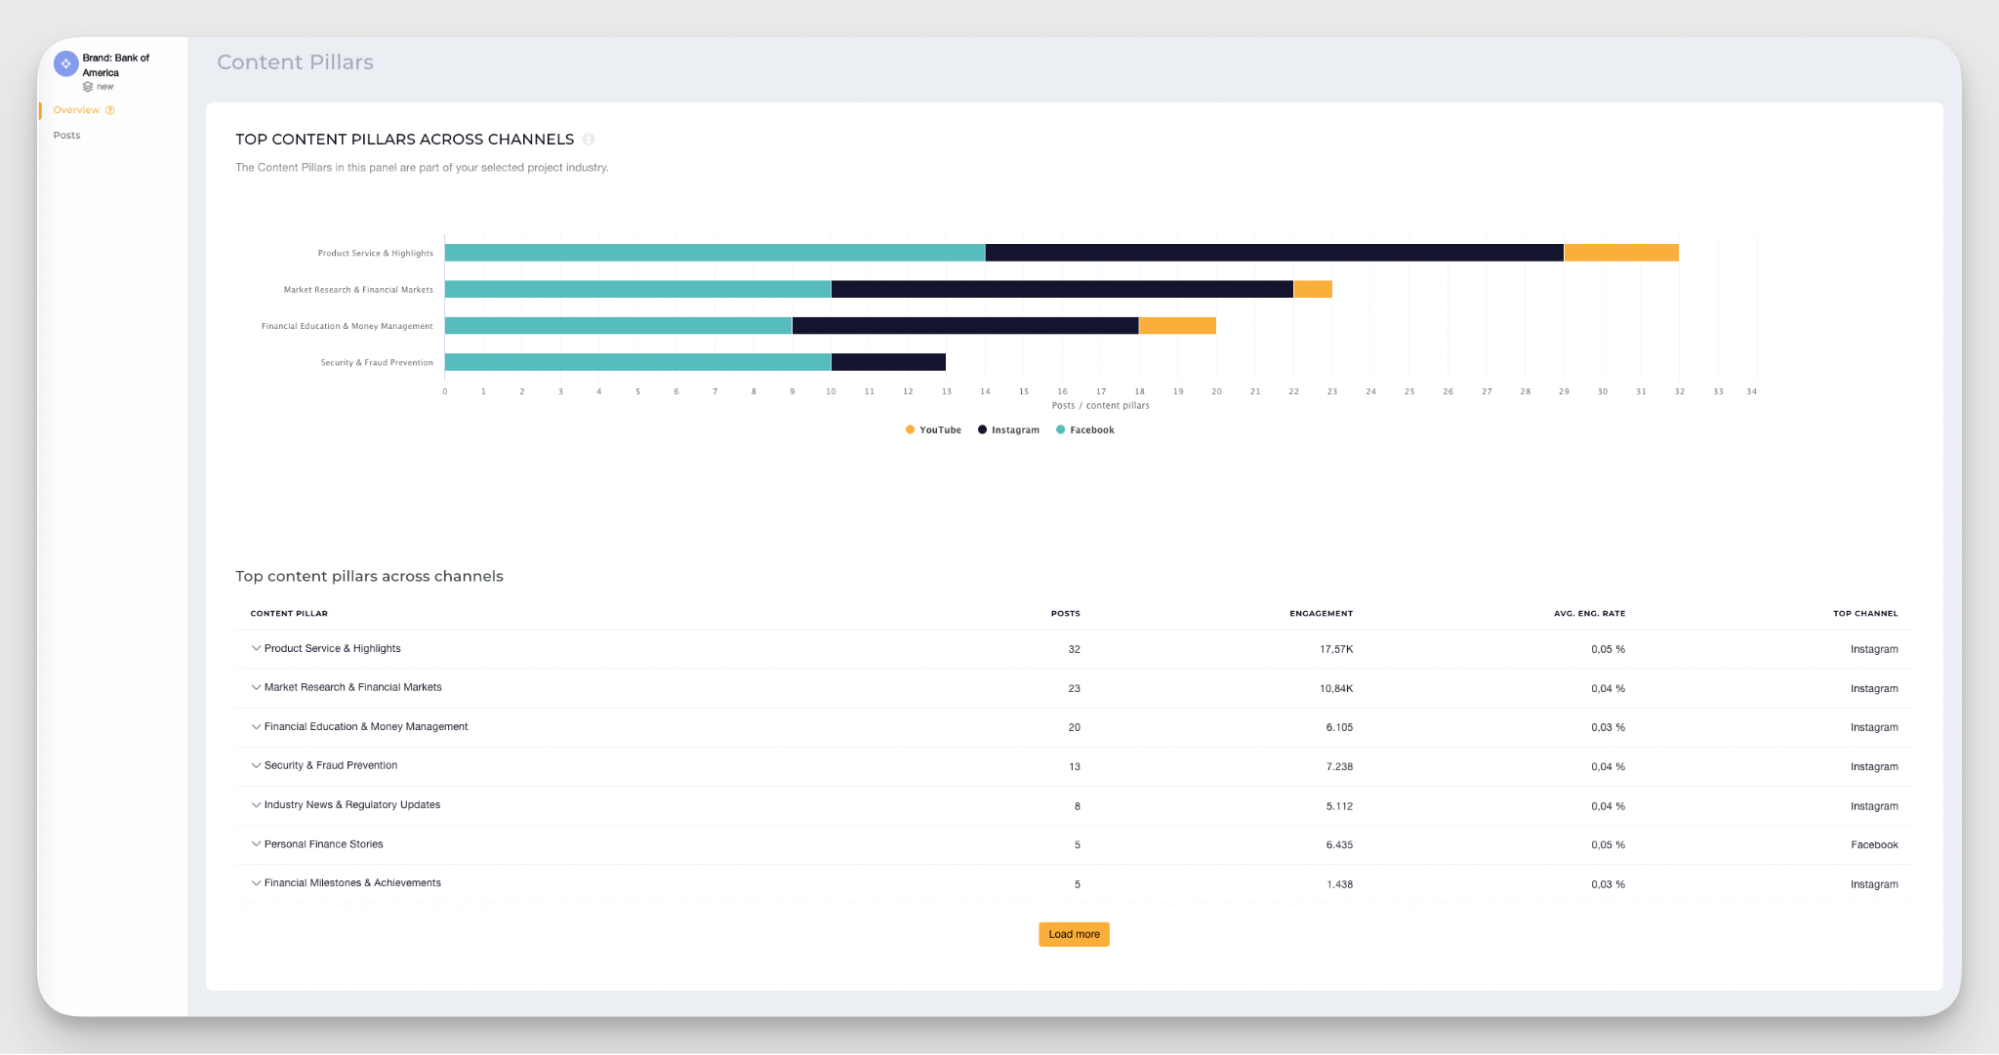
- Content themes that resonate with your audience. Socialinsider analyzes which content pillars generate the strongest engagement. You can refine your content strategy and double down on the topics your audience responds to.
- Optimal time to post. Knowing when your audience is active helps you post at the right time. My personal opinion is that posting time is overrated as a performance factor, but it still makes sense to aim to post at the time when your audience is most active.
Competitive metrics
Adding a bit of competitor data helps put your performance into context.
Stakeholders don’t always know whether 5% growth in a month is impressive or underwhelming. But if that same 5% growth puts you ahead of your closest competitor, the picture changes quickly.
A full competitive analysis usually deserves its own report with deeper metrics and insights. But for recurring performance reports, I recommend adding these two data points:
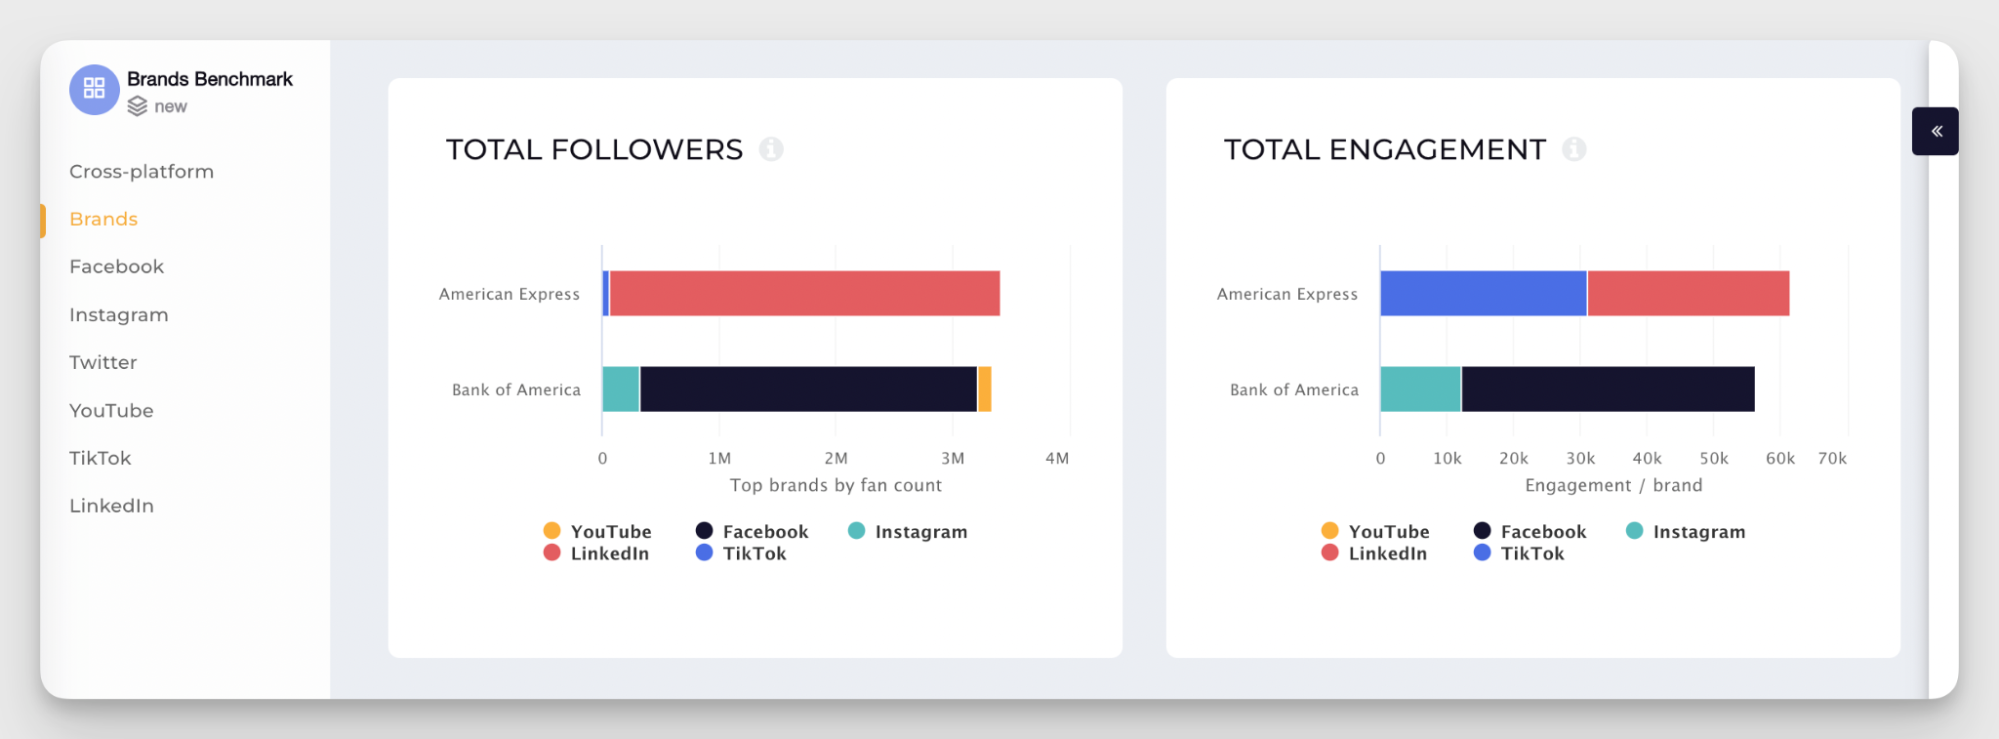
- Side-by-side performance comparisons. Place your brand next to a key competitor and compare core metrics like follower count or engagement. If you track an aspirational competitor, this quick comparison helps you evaluate your position at a glance.
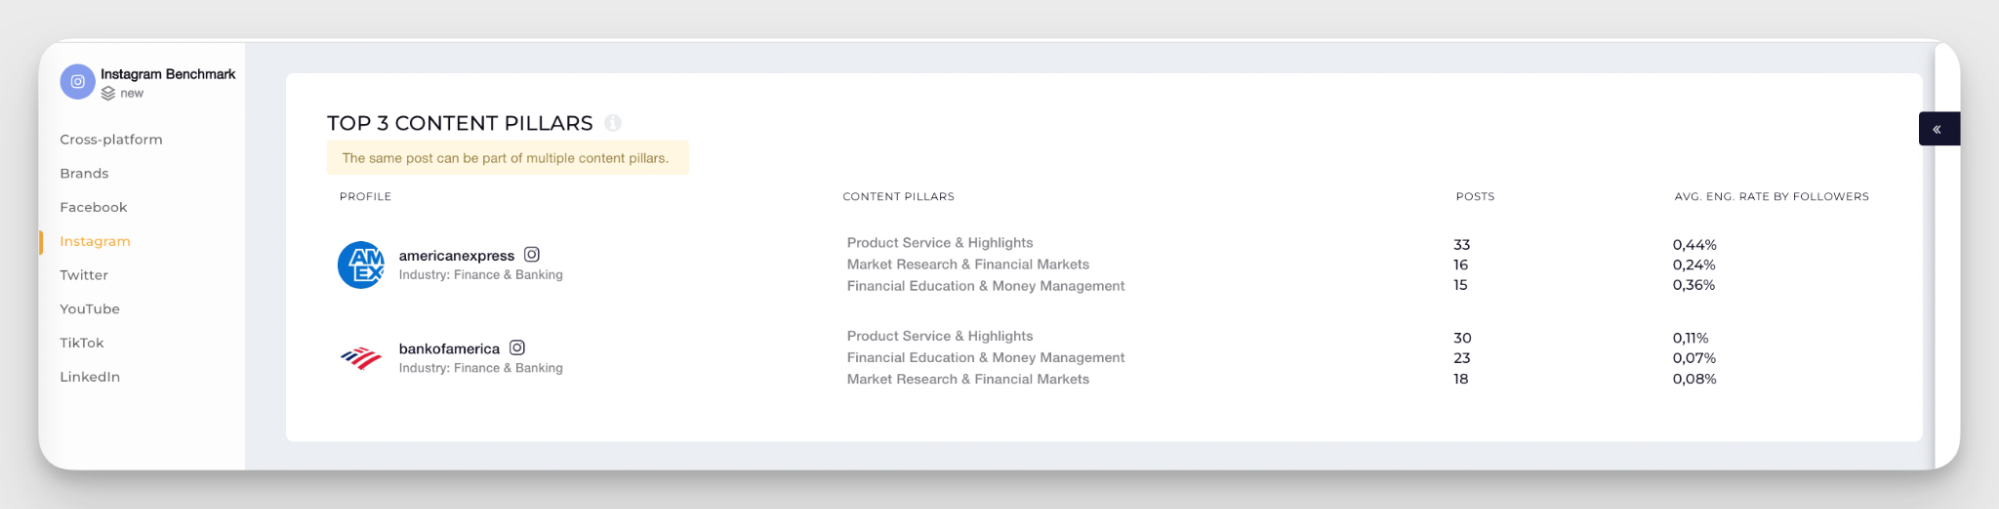
- Competitor content strategy insights. You can also look at the content pillars your competitors rely on. In Socialinsider, you can analyze which topics they post about most often and which ones generate the most engagement. This gives you a quick view of the themes already resonating with an audience similar to yours.
Campaign tracking
Sometimes your report needs to zoom in on a specific campaign, product launch, or activation. In those cases, it helps to isolate only the posts related to that campaign instead of analyzing your entire content mix.
Socialinsider allows this through Brand Content Pillars, a custom content tagging system built with the Query Builder feature. You can create tags based on campaign elements such as hashtags, messaging themes, or product launches, and group posts under that pillar across platforms.
For example, if your campaign uses a branded hashtag (like #withAmex from American Express), you can create a content pillar for that tag. Socialinsider will then collect all posts using it within your selected time frame.
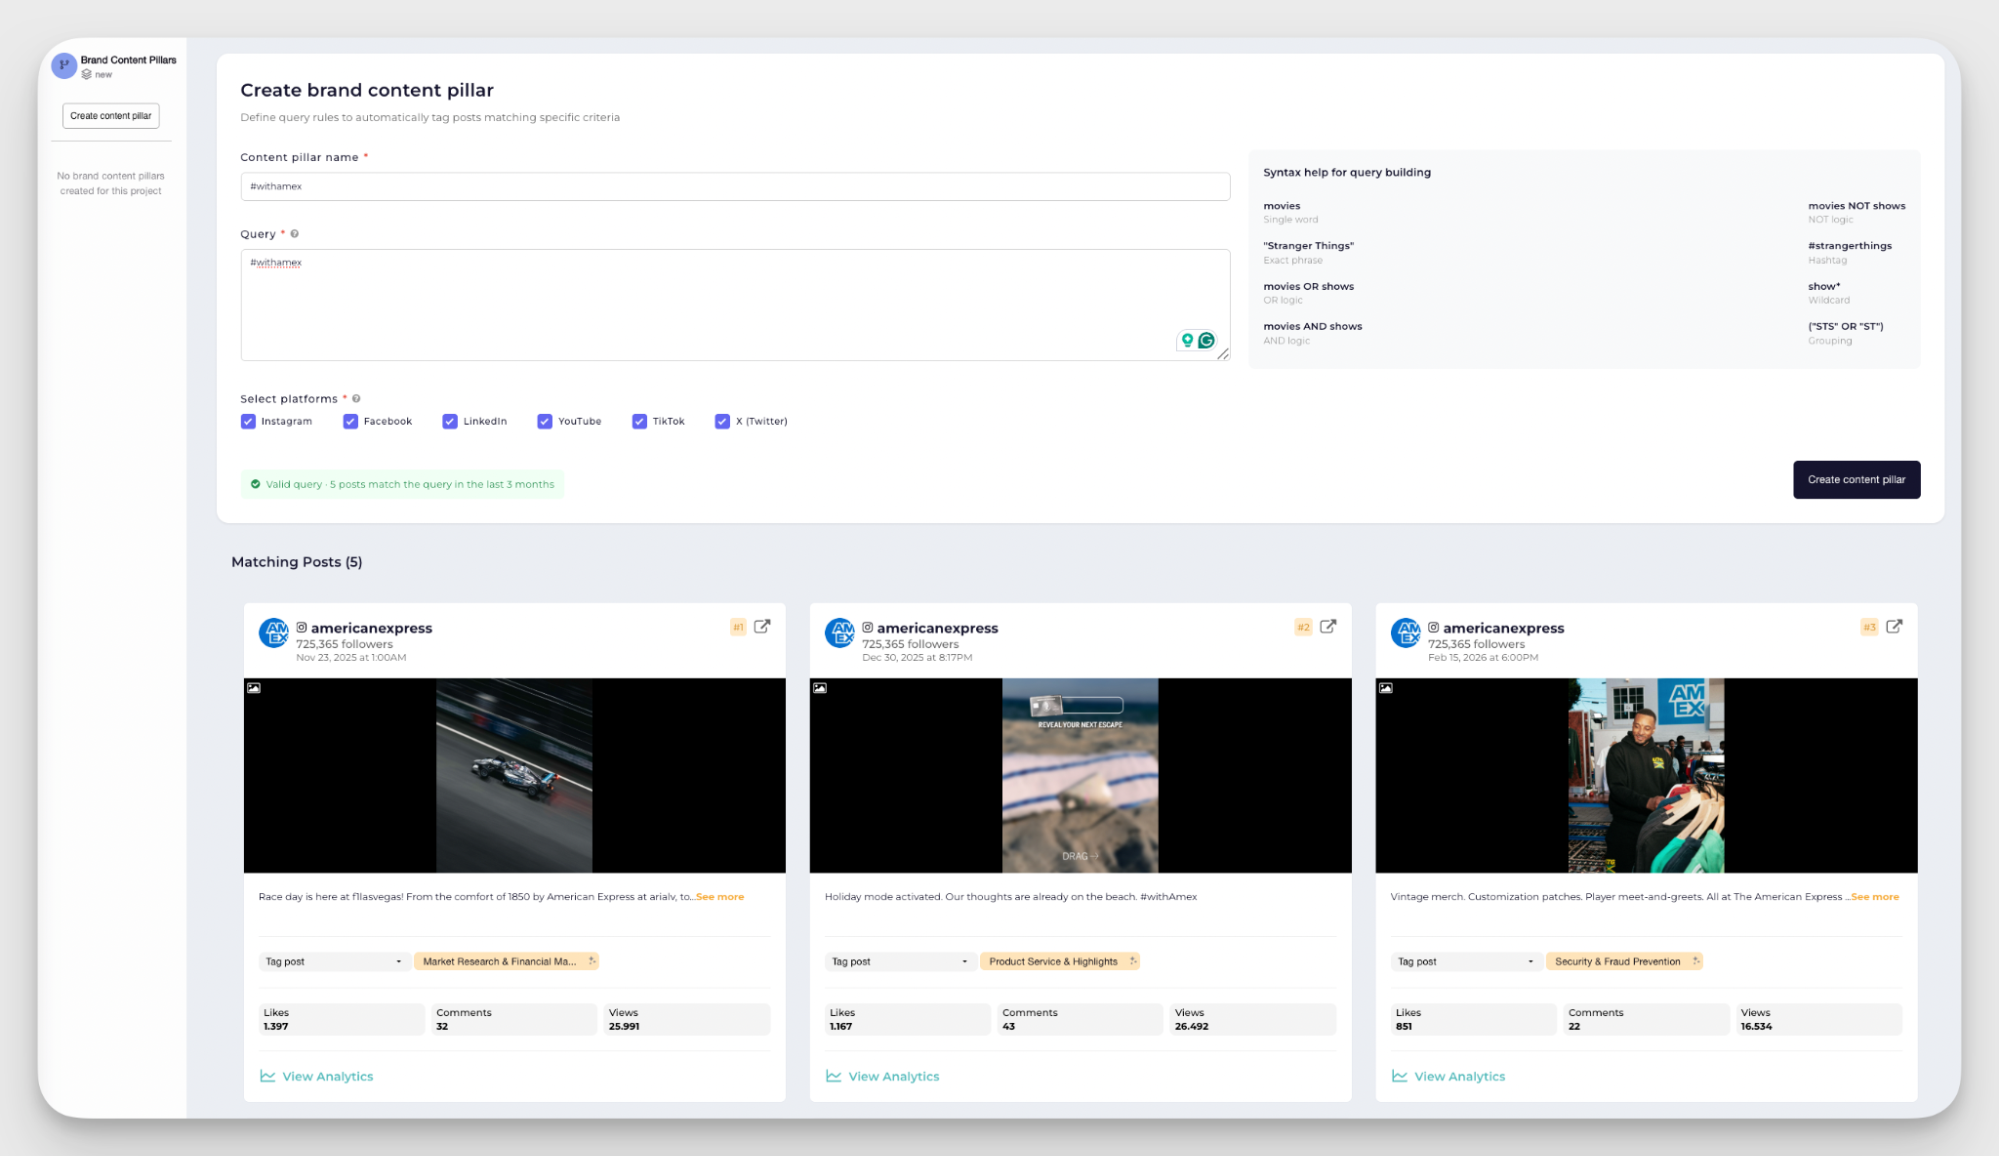
This lets you analyze both individual post performance and aggregated campaign results across platforms — in this case, we tracked both Instagram and TikTok.
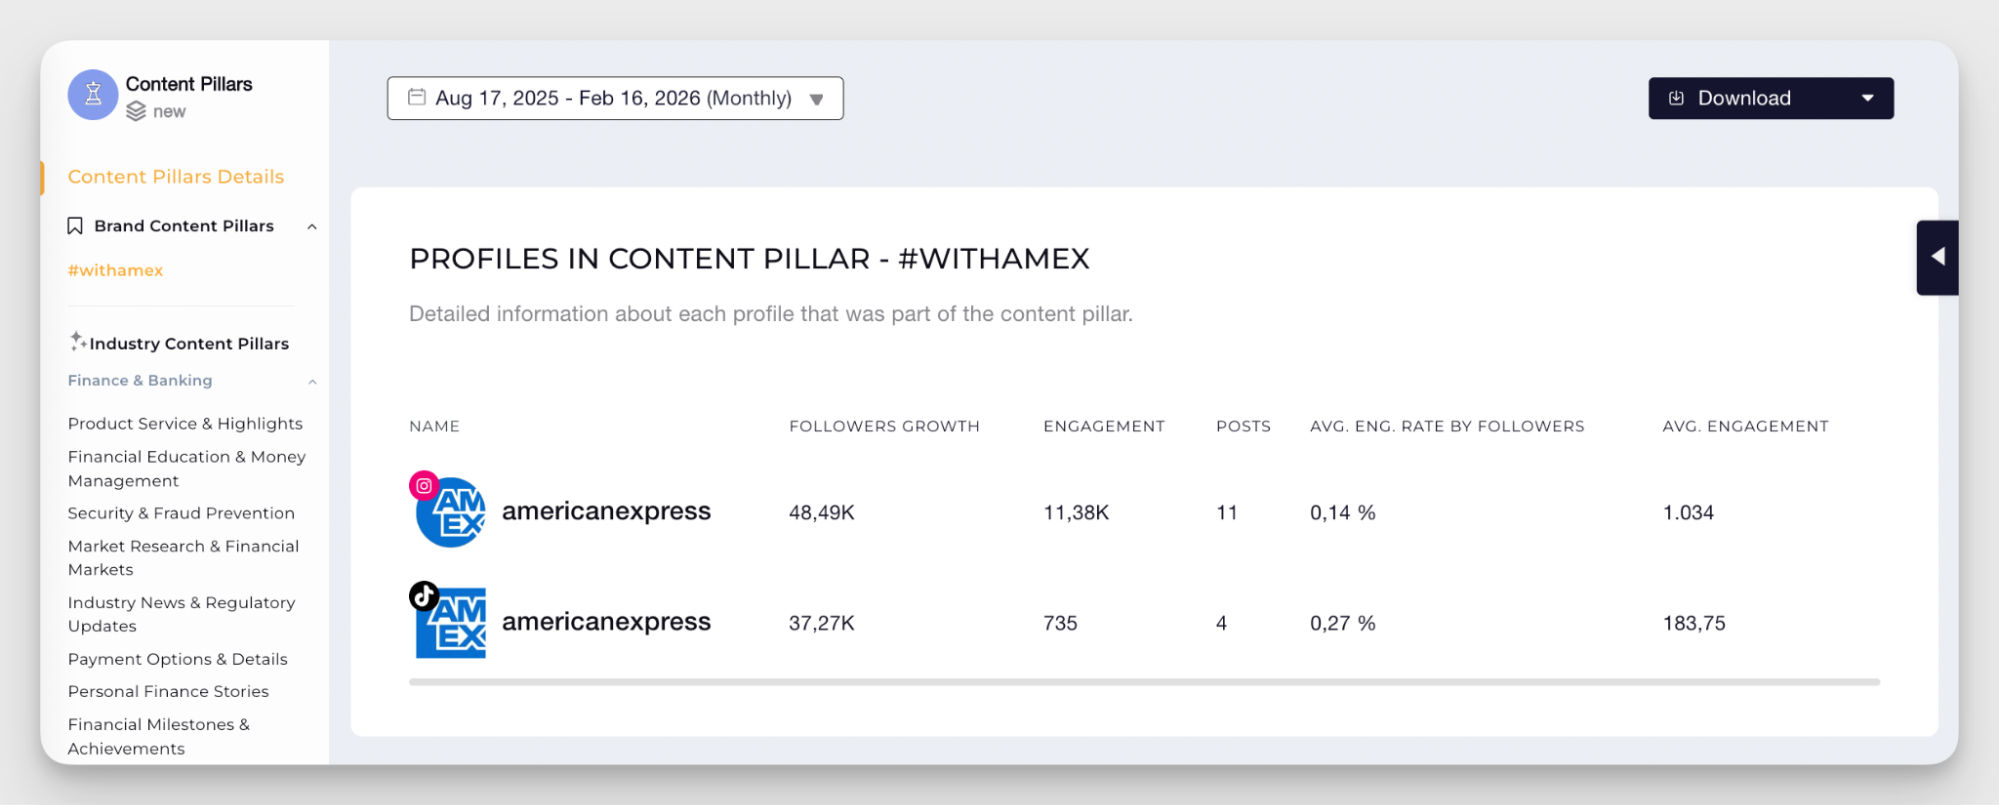
If you need this data to report on a specific campaign, you can download the Brand Content Pillar analysis as a separate report to share with your stakeholders.
Add your profiles to the Socialinsider dashboard
Socialinsider allows you to include both your own managed accounts and your competitors’ accounts in a report.
To connect your own account to Socialinsider, follow these steps:
- Go to the Connect social accounts section in the Socialinsider dashboard
- Choose the platform you want to connect, such as Instagram, Facebook, TikTok, LinkedIn, YouTube, or X
- Authenticate the account by logging in and granting the requested permissions
- Bingo! Socialinsider starts pulling the data, and your social media analytics begin populating automatically in the dashboard
Besides your own accounts, you can also add competitor profiles to your analysis. This allows you to track their public performance metrics and include benchmarking data directly in your reports.
Keep in mind that some insights, like Instagram Stories analytics or audience demographics, are only accessible for accounts you manage and connect directly to Socialinsider. You won’t be able to see this data for your competitors (but you’ll still have plenty of other things to study there!).
Configure automation settings
The final step is deciding how your social media automated reports should be shipped.
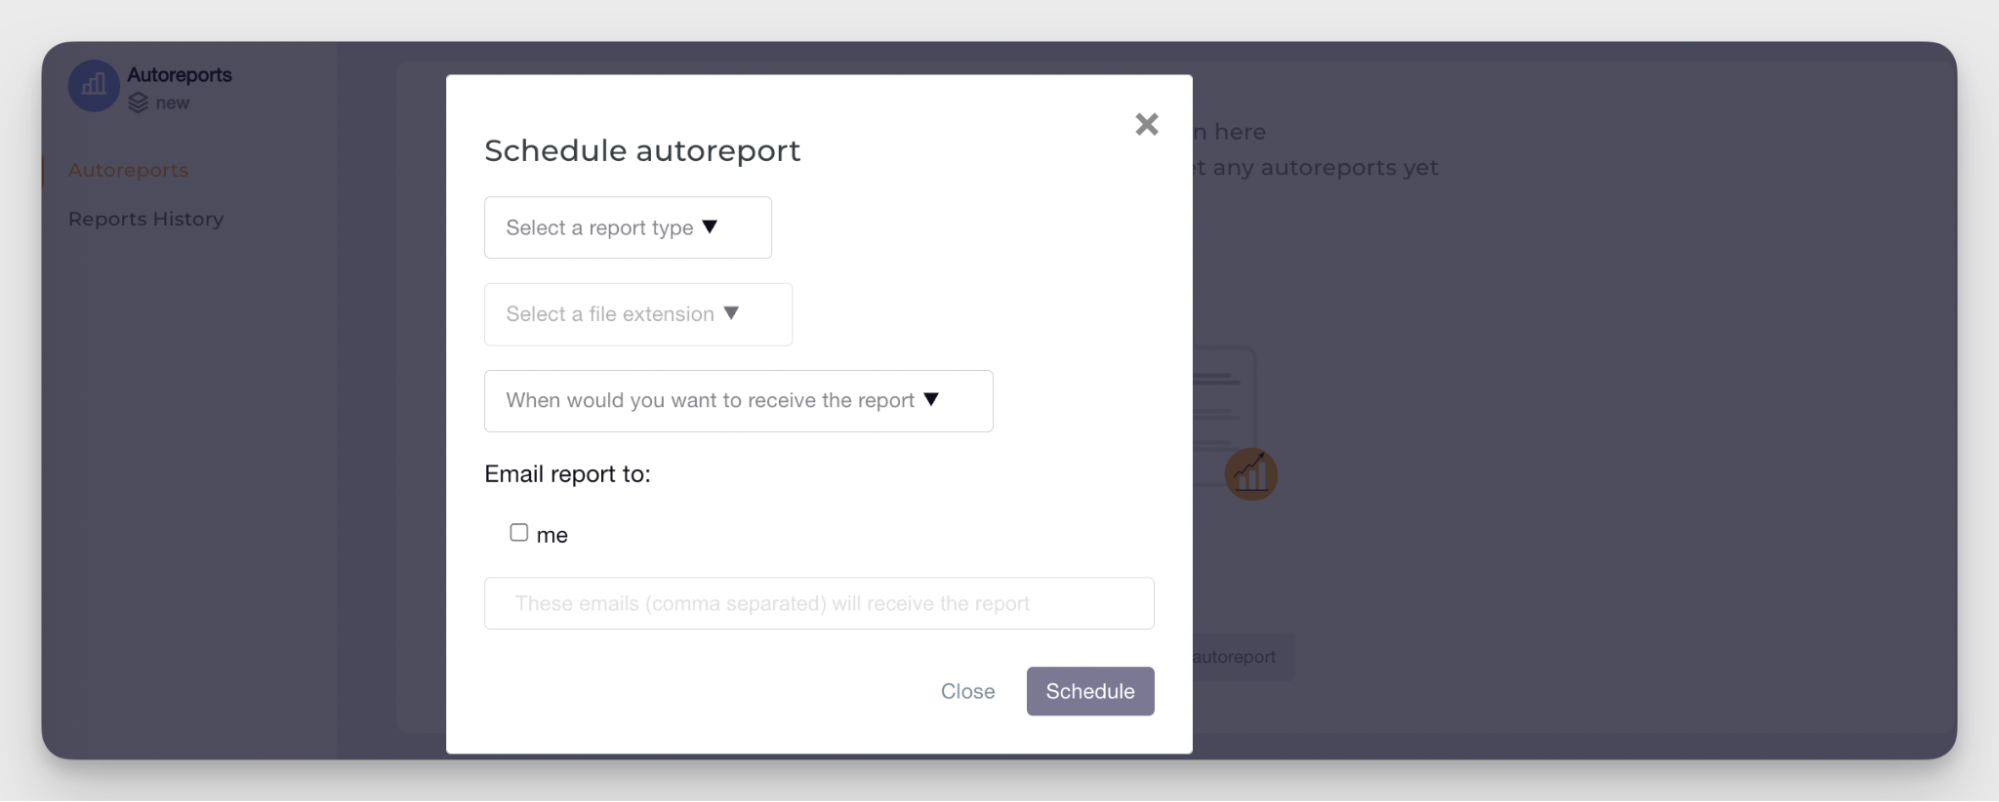
Socialinsider lets you customize the report type, schedule, and distribution so the right stakeholders receive the right insights without manual work:
- Navigate to Autoreports. You can find them on the main dashboard on your left sidebar.
- Select report type. Choose the type of report you want to automate depending on what you want to analyze:
- Post report — analyzes content performance post by post across your selected profiles
- Profile report — tracks the performance of a specific social media account, including both managed profiles and competitors
- Benchmarks report — compares account-level performance side by side between your brand and competitors
- Brands report — provides an aggregated overview of all profiles and platforms grouped under one brand
- Ads report — focuses on paid campaign performance (available when your Meta Ads account is connected)
- Choose export formats. Select the format that fits your reporting needs, such as PDF, PPTX for PowerPoint presentations, or CSV if you want to work further with the data.
- Set report frequency and delivery schedule. Decide how often the report should be generated: daily, weekly, monthly, or quarterly.
- Add recipients and distribution lists. Include the team members, managers, or clients who should receive the report.
Social media reporting is now automated. Congratulations — you are officially free from manual number hunting!
Final thoughts
Social media reporting should be about reading into data, not gathering data itself. Social media reporting automation gives you that shift.
Instead of juggling dashboards and fixing spreadsheets, you can focus on reading your metrics, spotting patterns, and acting on the insights this data gives you.
If you want to spend less time gathering data and more time improving your strategy, Socialinsider helps you automate your social media reporting from end to end. Try it free for 14 days — no strings attached.
Kseniia Volodina
Content marketer with a background in journalism; digital nomad, and tech geek. In love with blogs, storytelling, strategies, and old-school Instagram. If it can be written, I probably wrote it.
Analyze your competitors in seconds
Track & analyze your competitors and get top social media metrics and more!
You might also like


Improve your social media strategy with Socialinsider!
Use in-depth data to measure your social accounts’ performance, analyze competitors, and gain insights to improve your strategy.