Socialinsider Product Updates - August
New in August: Reels or Shorts? Meet the newest tool that settles the debate once and for all 🙌

Bad news: summer is officially over. 😭
August has delivered that final breath of summer. Meanwhile, we've been crafting something special: smarter analytics tools that help you optimize your short-form video content strategy across platforms.
Here's a look at what we accomplished this August. 🙌
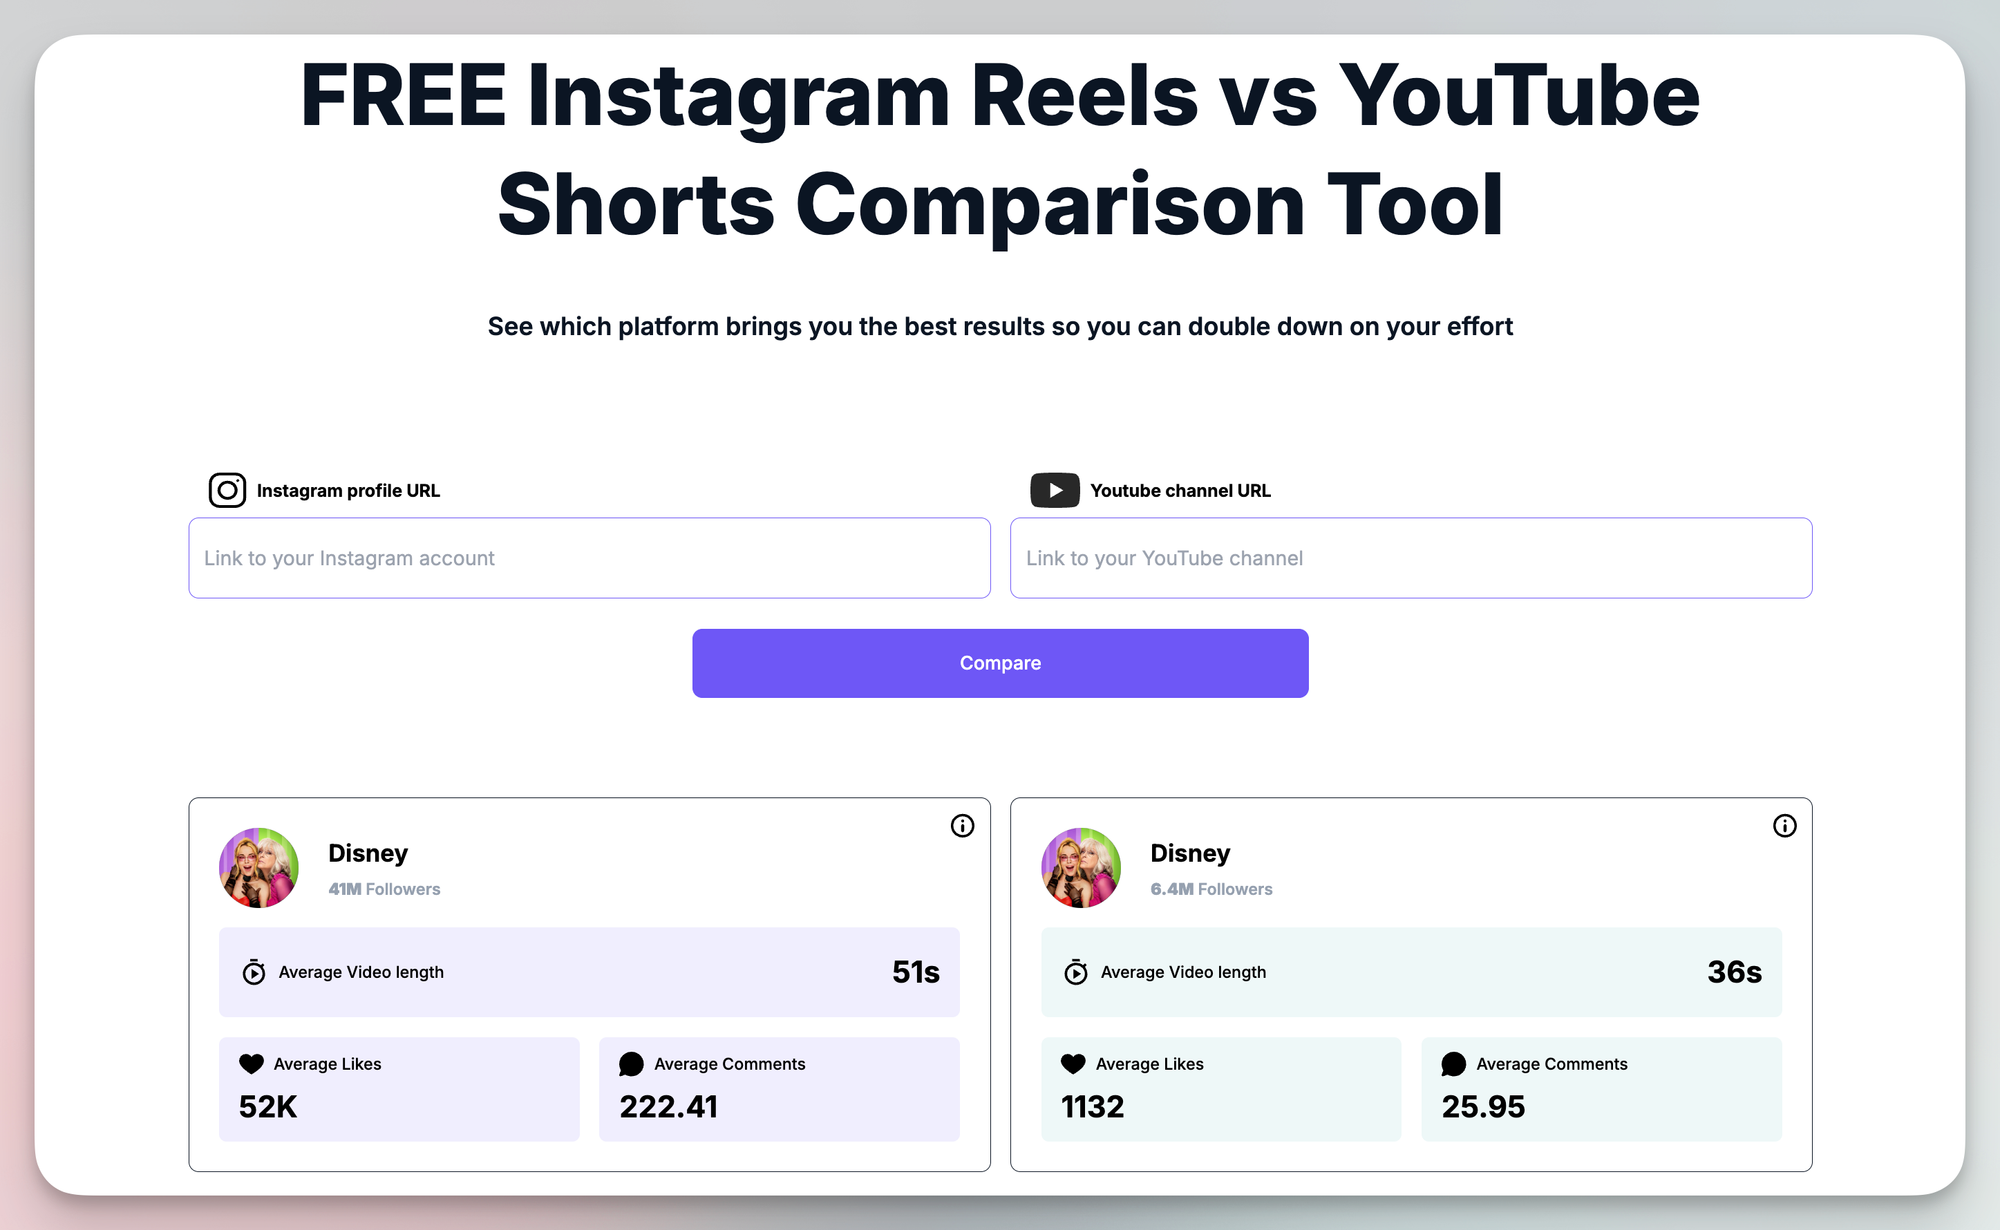
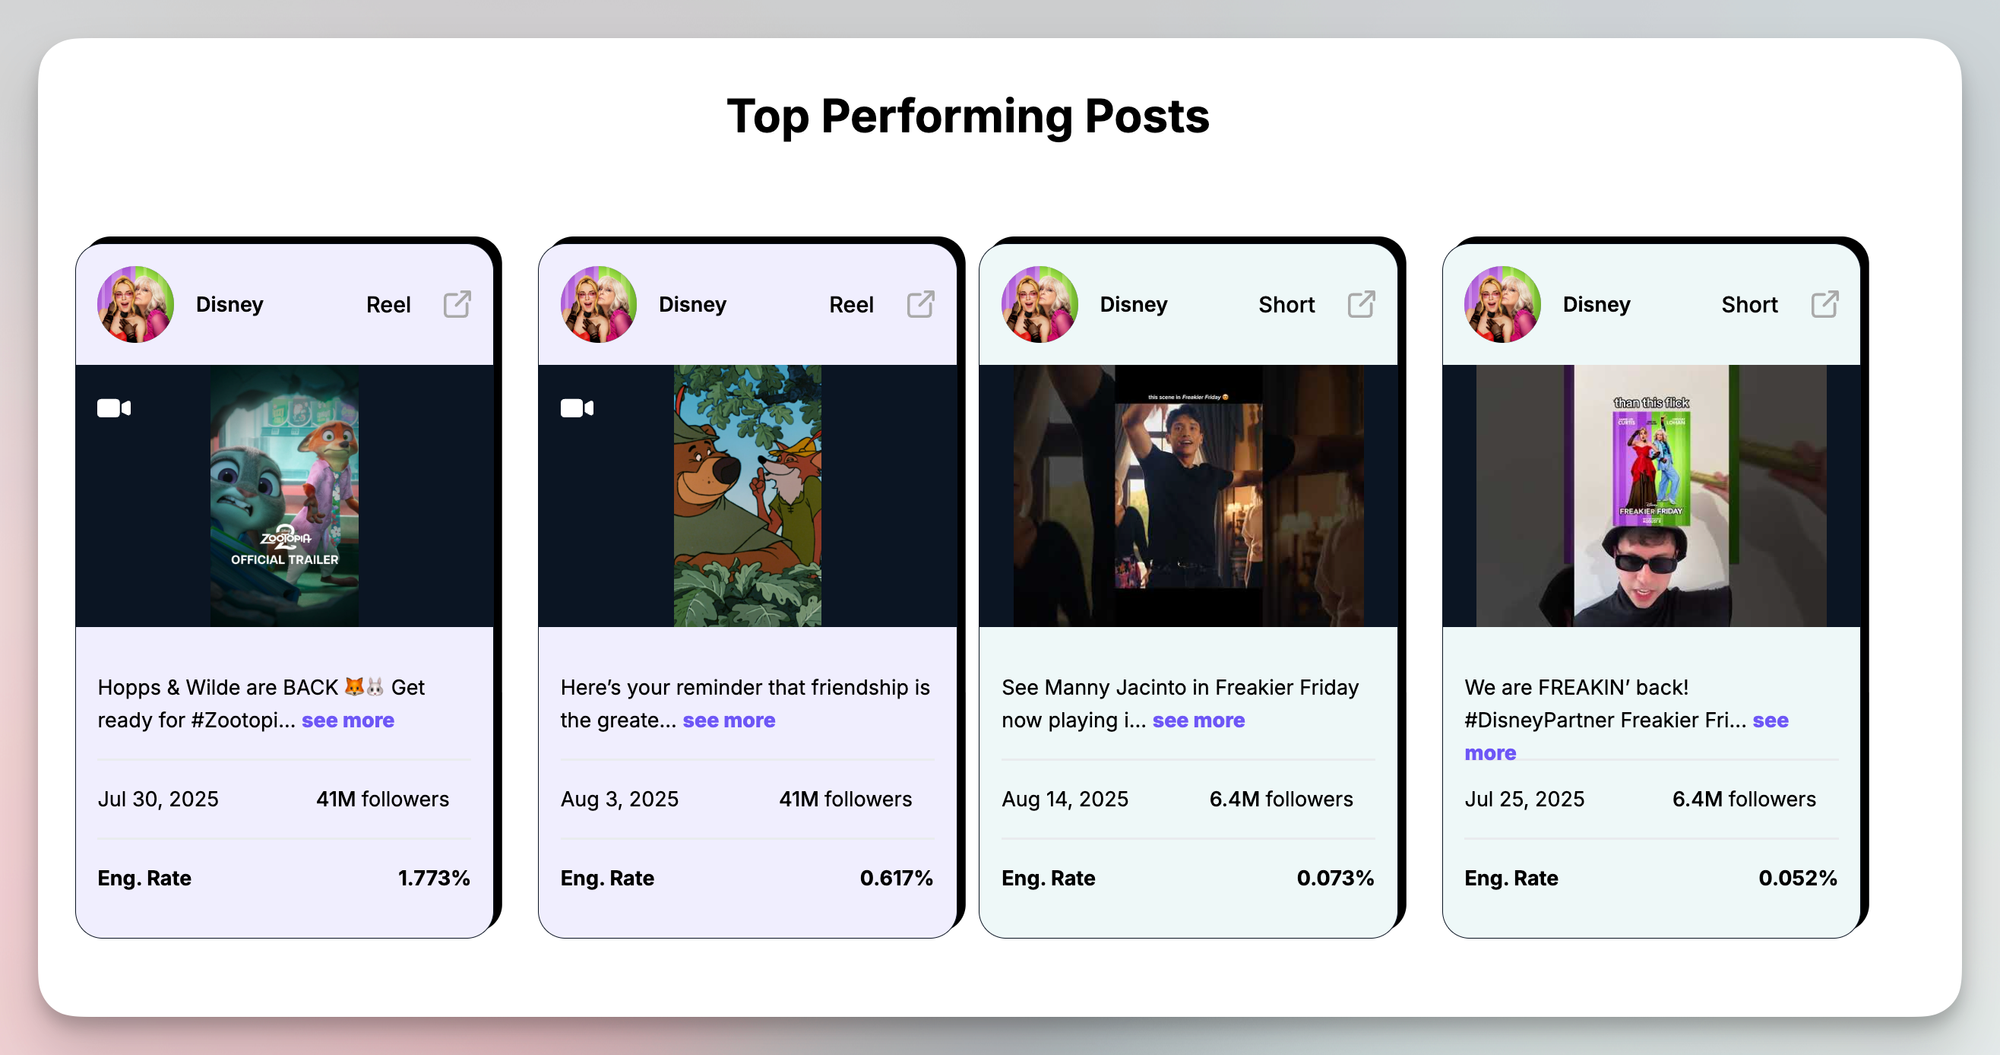
1. Short-Form Video Content Comparison
Our new short-form video comparison tool addresses one of the most common challenges in social media strategy: understanding how your content performs across different platforms.
We've released a complete toolkit for your short-form video analytics strategy at zero cost:
- Facebook Reels vs Instagram Reels Comparison Tool
- Facebook Reels vs TikTok Videos Comparison Tool
- Facebook Reels vs YouTube Shorts Comparison Tool
- Instagram Reels vs TikTok Videos Comparison Tool
- Instagram Reels vs YouTube Shorts Comparison Tool
- TikTok Videos vs YouTube Shorts Comparison Tool
Benefits:
- Make data-driven decisions on video content placement with real performance metrics
- Compare all platforms in one centralized view
- Maximize ROI by identifying which platforms best suit your content style
- Understand audience preferences across different platforms
- Impress clients and stakeholders with clear, visually appealing comparative reports
→ How It Works: Just enter the URLs of the profiles you want to analyze, and our tool automatically gathers the relevant performance data to display your video insights.
→ Why This Matters: With short-form video becoming the dominant content format, understanding platform-specific performance is crucial for resource allocation and content strategy optimization.
Key insights available across all tools include:
- average video length
- average videos/ day
- average video views
- view rates
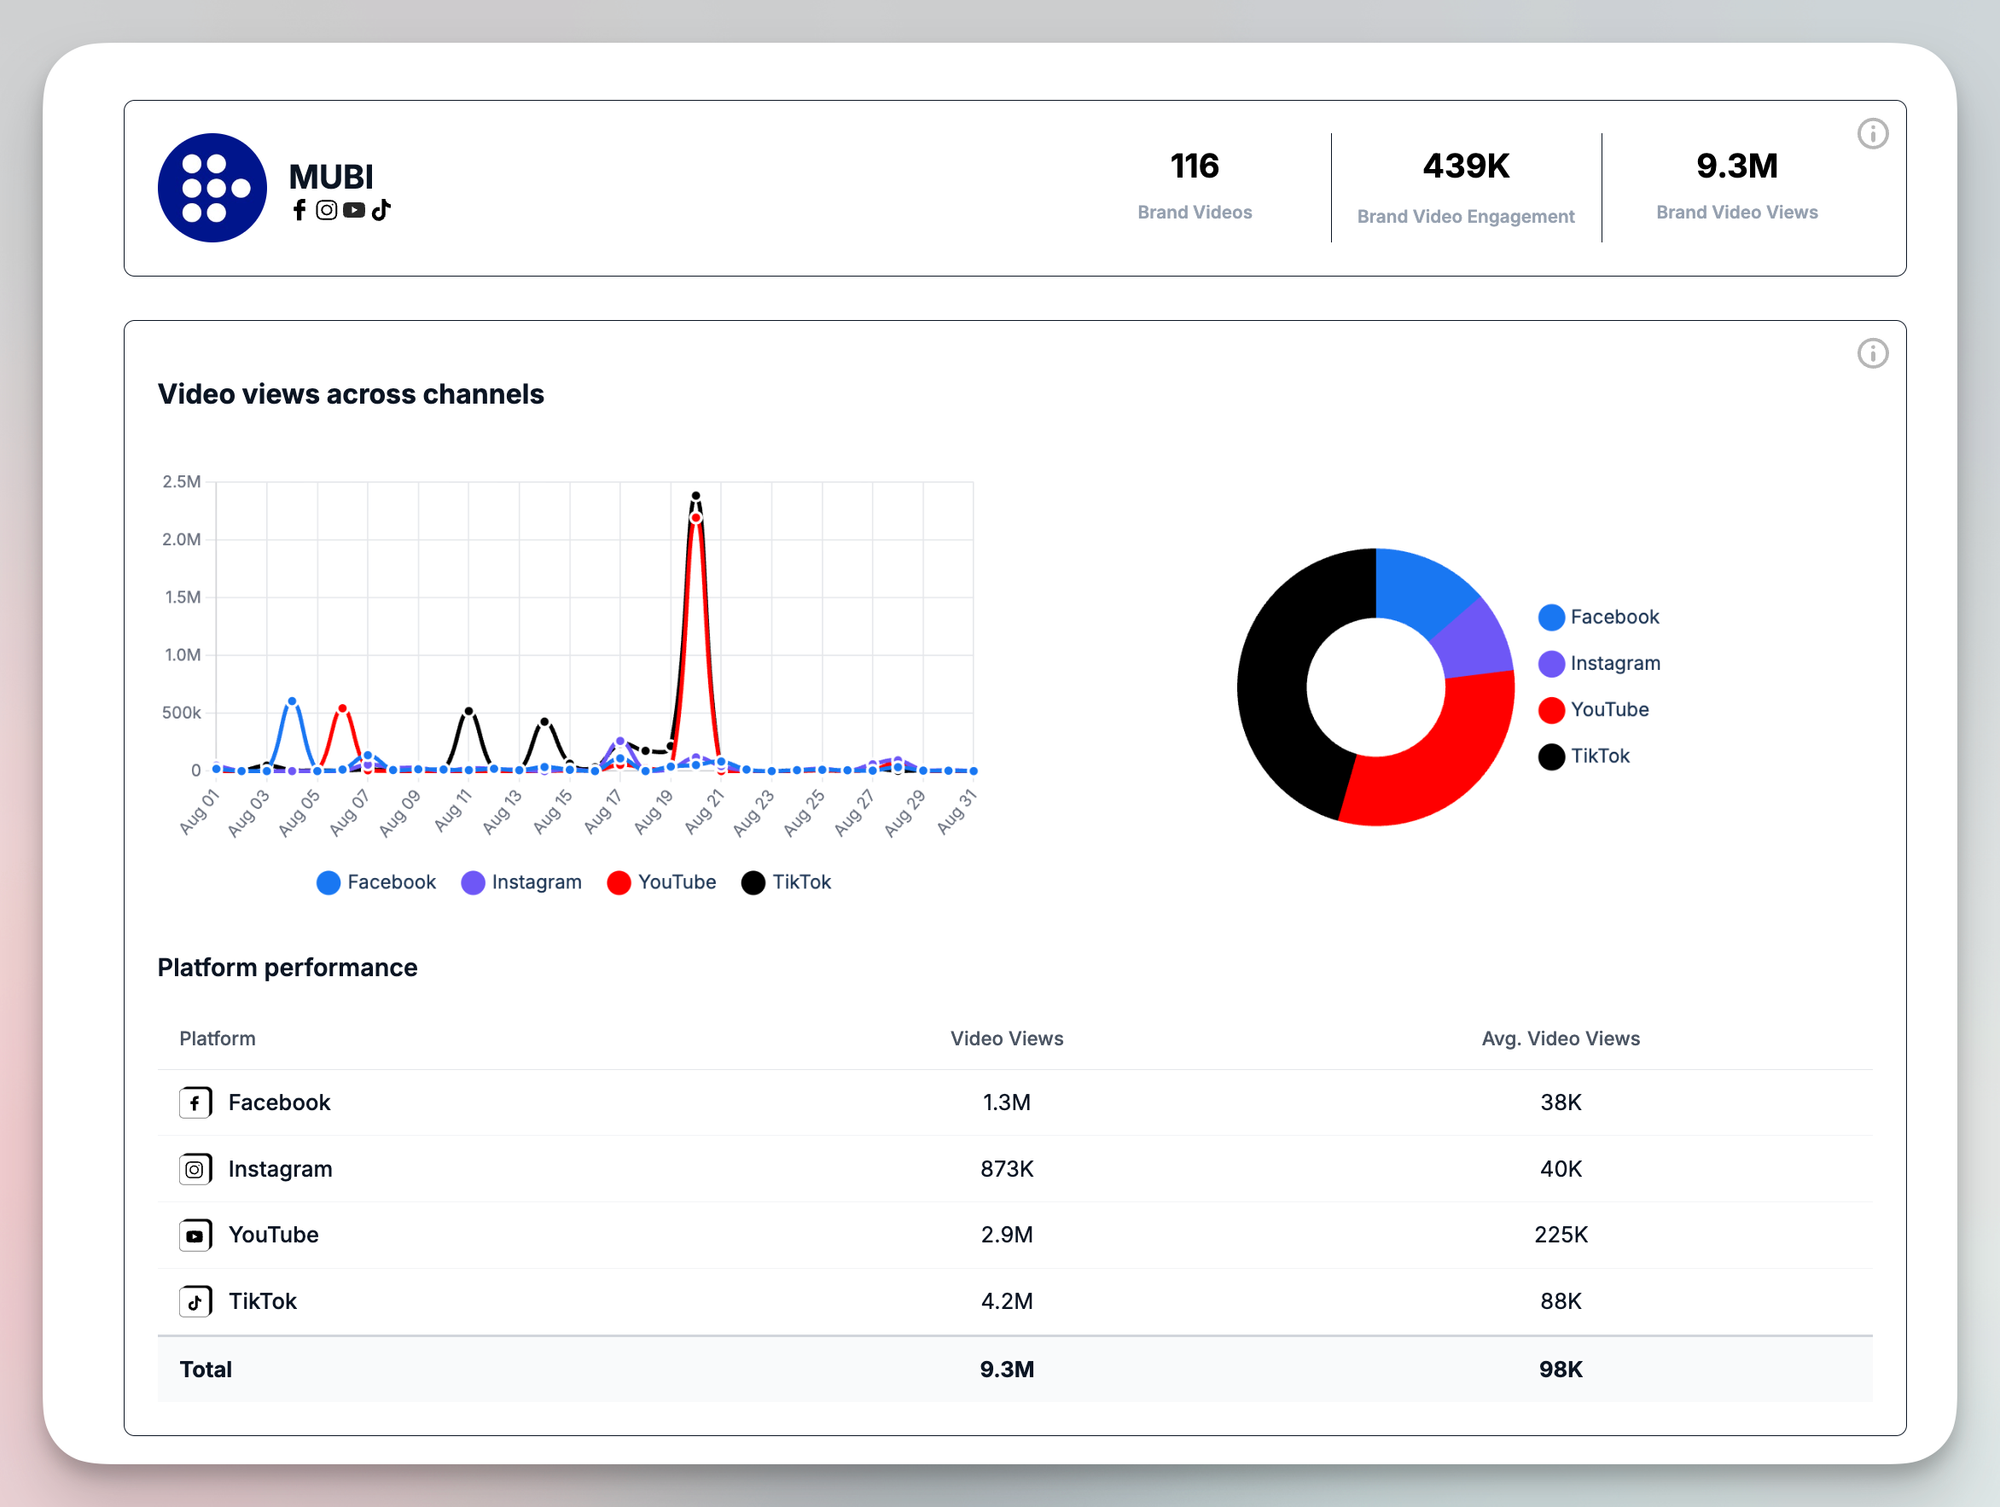
2. Brand Video Analytics
This powerful tool offers an in-depth analysis of your video content performance, providing brand-specific insights.
Benefits:
- Access a comprehensive cross-channel analysis of any brand's video performance
- Identify content trends and patterns that drive stronger engagement for your specific brand
- Eliminate guesswork in video content creation by understanding what truly resonates with your audience
- Determine the most effective platform for your video content
→ How It Works: Just enter the URL of the brand's website you want to analyze, and our tool automatically populates the links to the social media accounts.
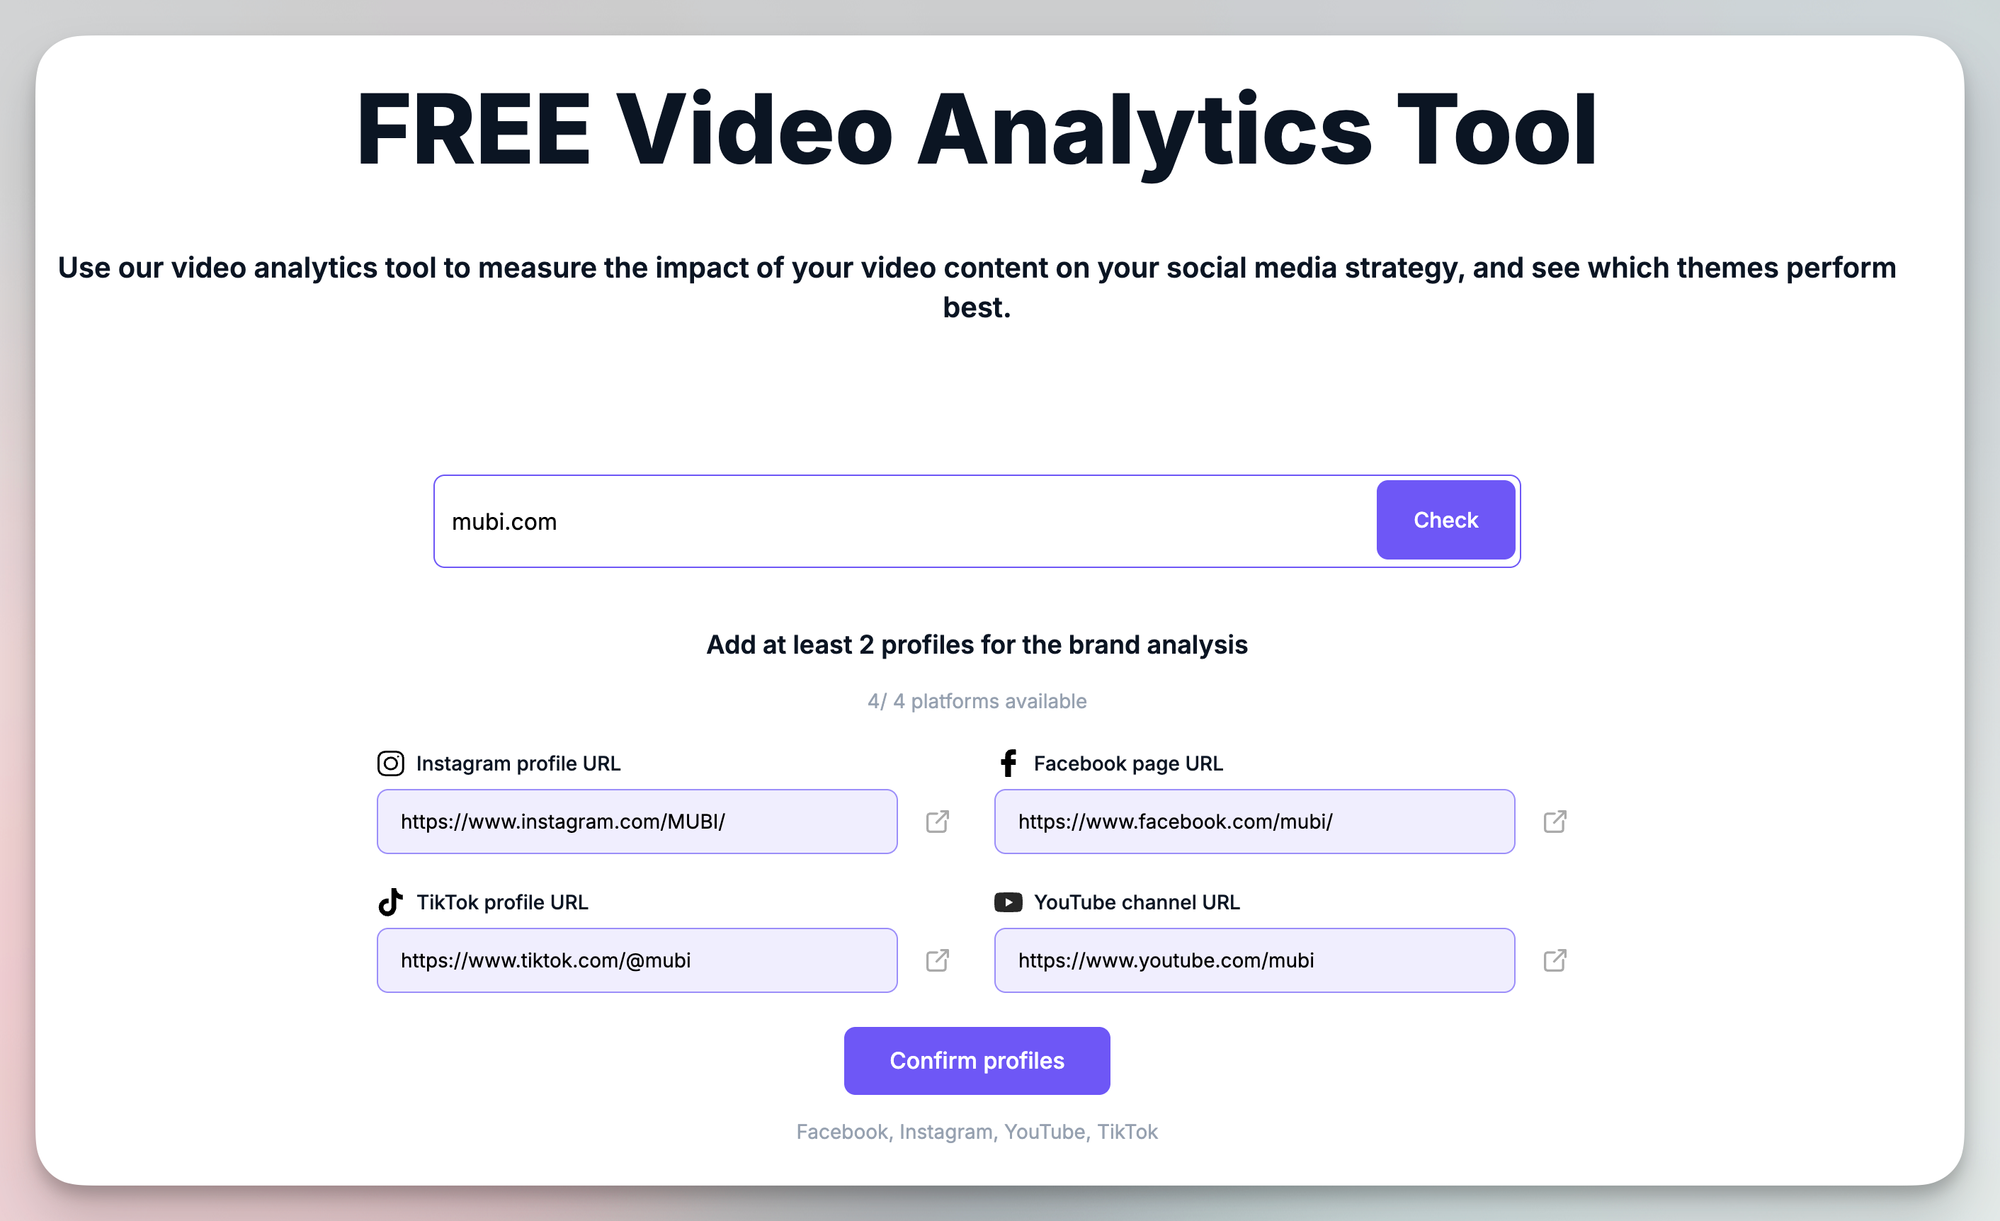
→ You can edit the links or add any that the tool couldn't automatically detect.
After that, you'll see aggregated insights for the brand's video performance with a breakdown by platform.
3. More Sorting Options
We've expanded the sorting capabilities for competitor post analysis, providing you with more ways to understand which content strategies are working in your industry.
Competitor posts can now be sorted by additional performance metrics that were previously only available for your own content.
Benefits:
- See competitor posts with the highest reach to understand audience expansion
- Sort by views/impressions to identify top-performing content formats
- Compare engagement vs. reach vs. views to spot different strategic approaches
- Guide content decisions based on performance drivers
- Enhance competitive analysis through multiple performance metrics
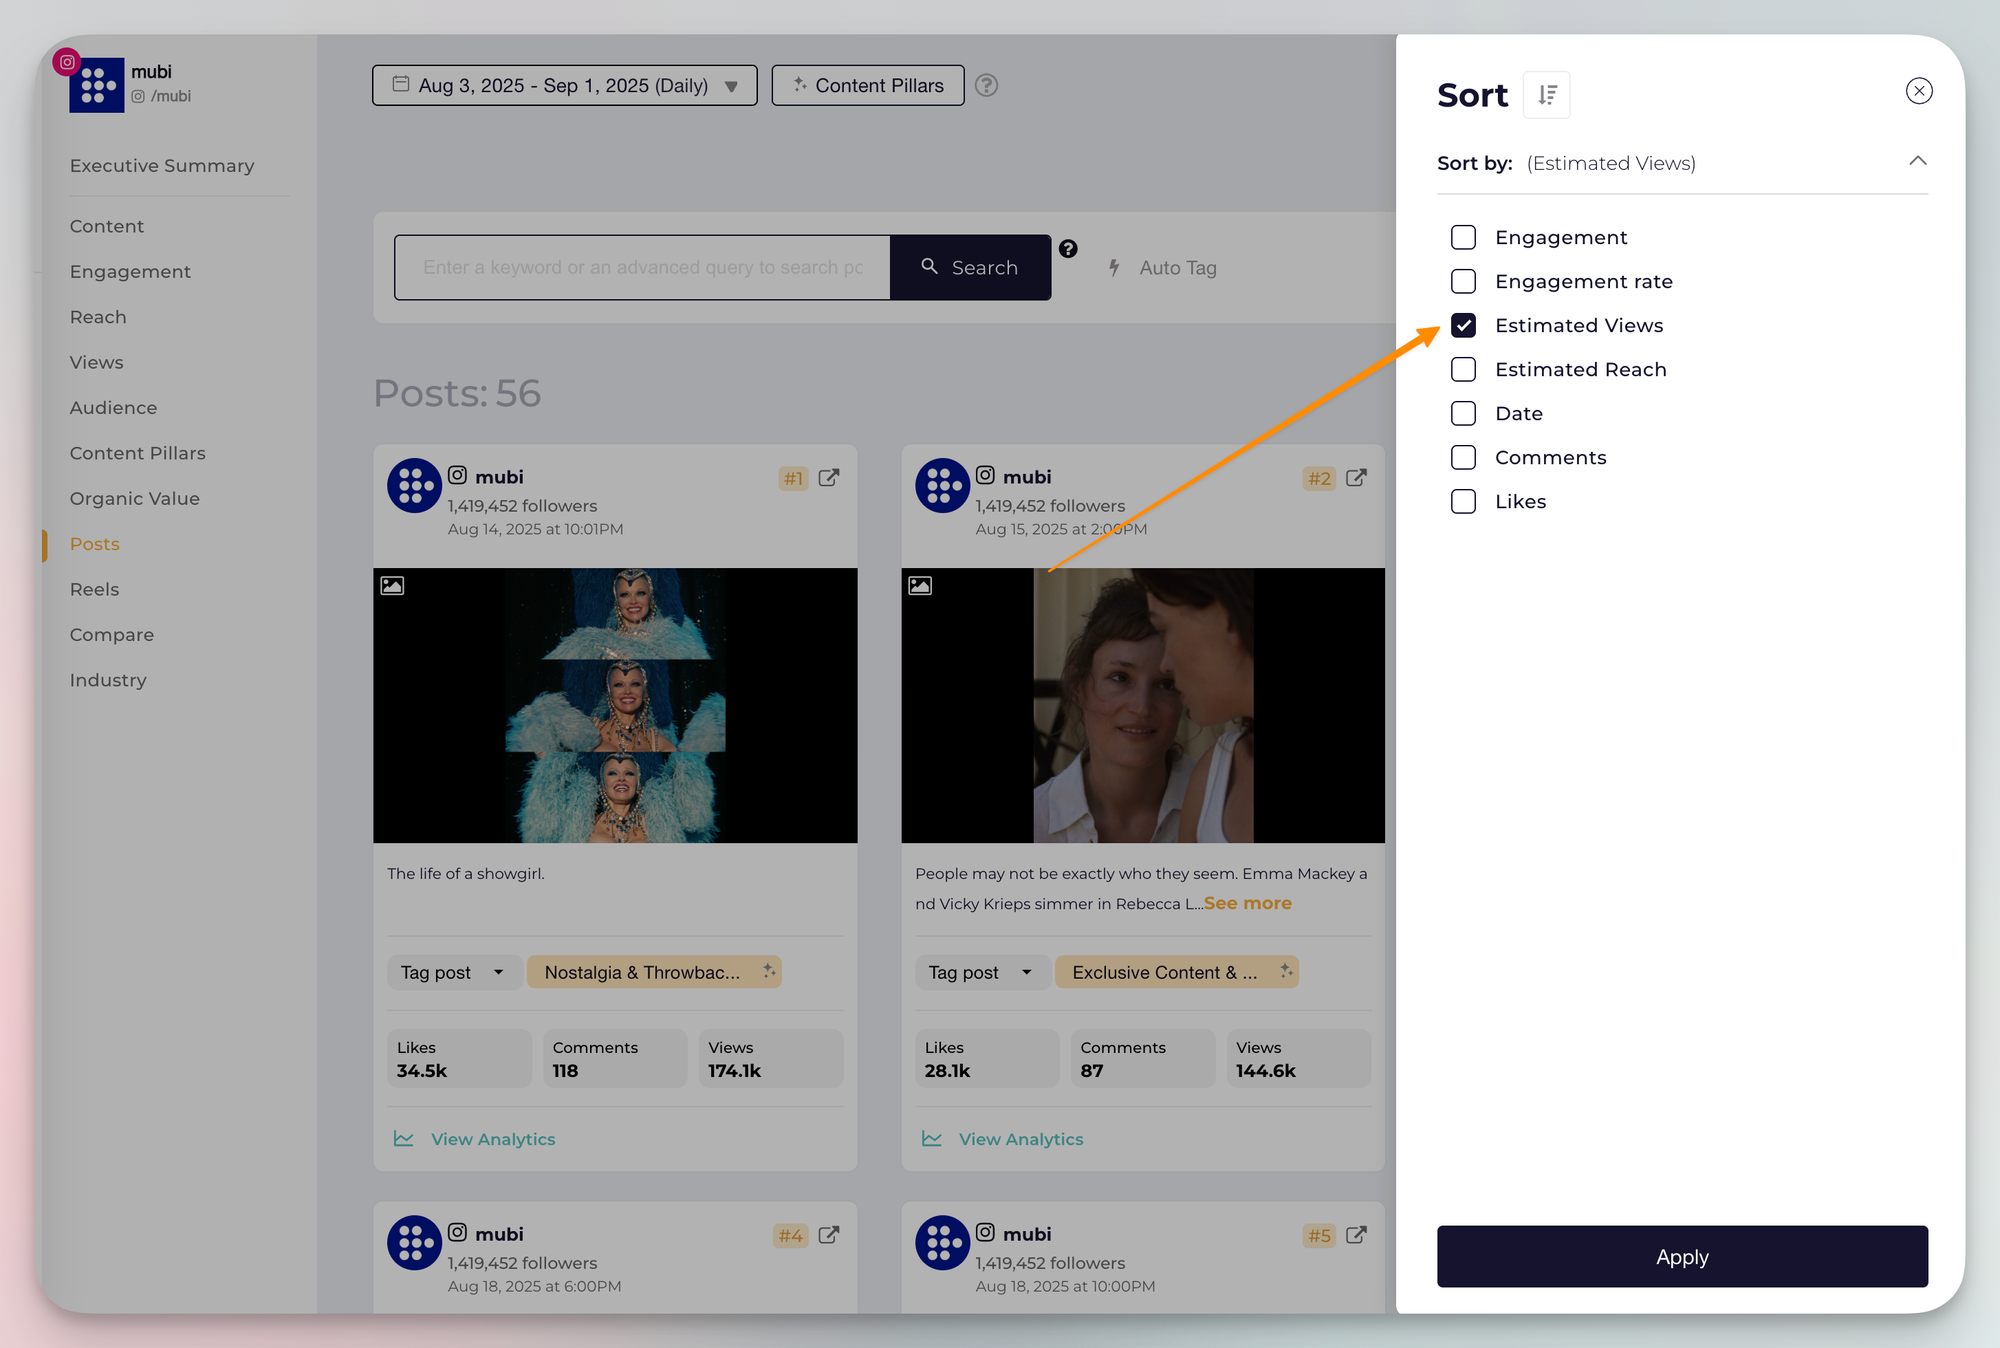
This improvement makes it easier to see what your competitors are doing well, helping you spot trends and get ideas from different angles.
Product Improvements 🚀
August brings a notable product improvement that has to be mentioned - we've redesigned how post type data is presented in the platform, making it more intuitive and actionable.
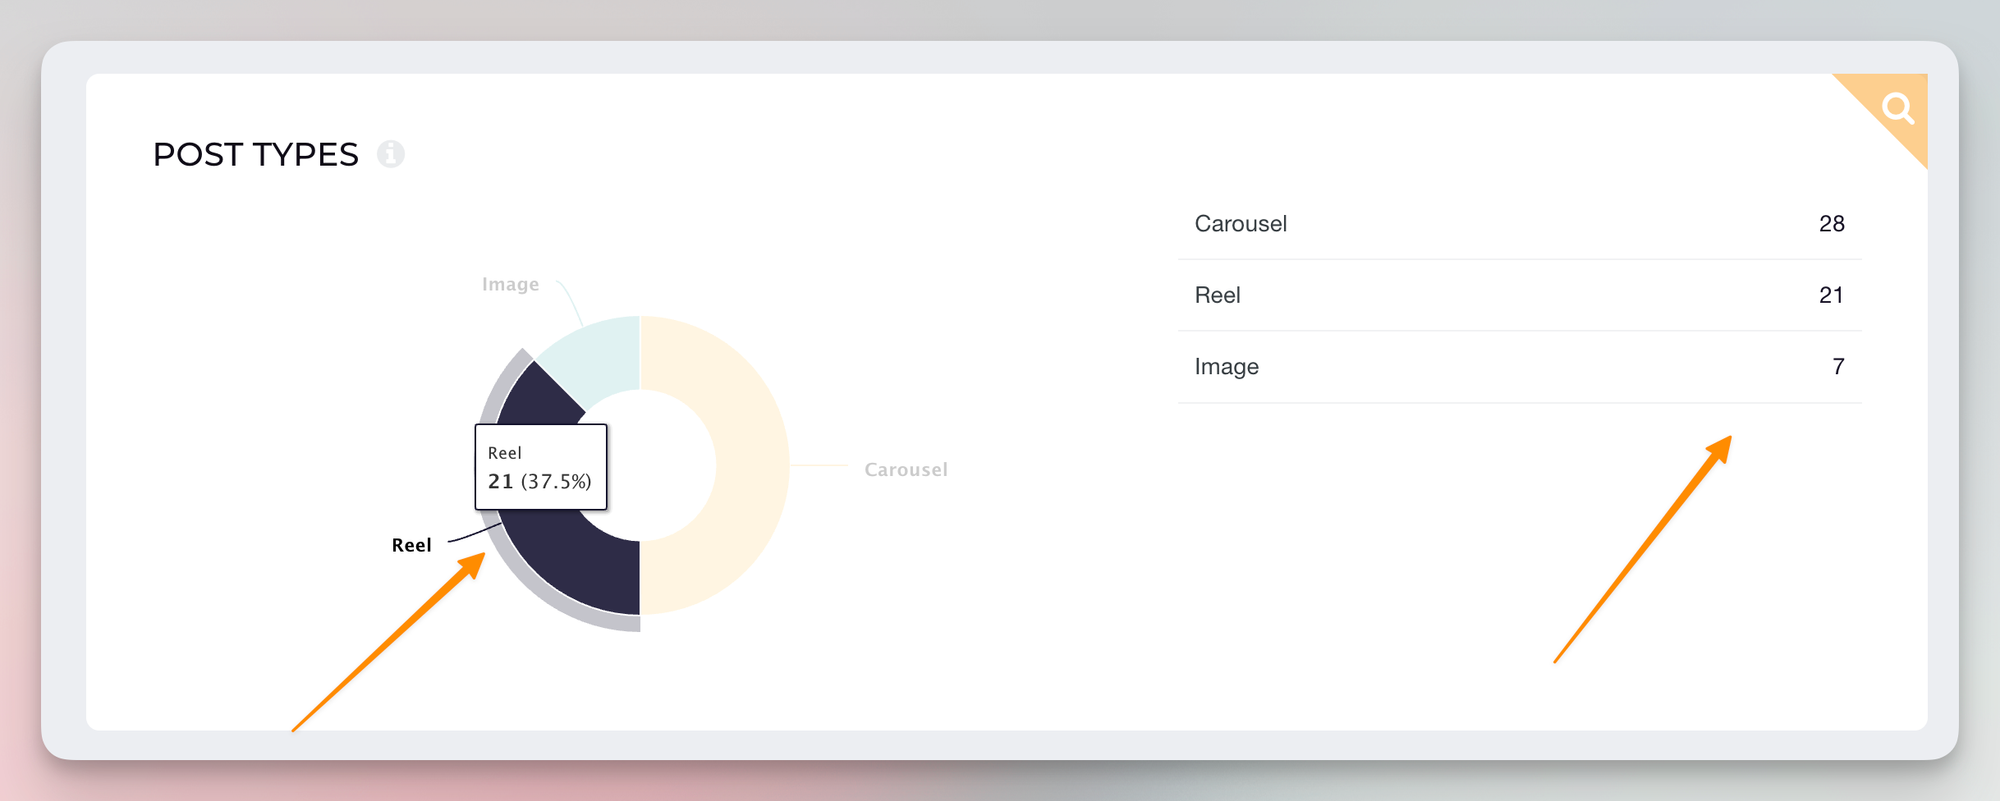
The pie chart displays the percentage distribution of each post type, while the table on the right shows the actual number of posts for each type.
→ Impact on Strategy: These visual improvements help content teams make faster decisions about content mix optimization and resource allocation across different post formats.
Diana Gogolan
Product Manager @ Socialinsider. Designing, Building, Testing, Releasing - from idea to successful feature. Passionate about telling stories that take different forms and shapes.

Know what your competitors do — before your manager asks
Get instant social benchmarks & reports without manual work.
You might also like
Socialinsider Product Updates - February
Diana Gogolan
Mar 01, 2026
The little things that make your life better
Socialinsider Product Updates - January
Diana Gogolan
Feb 02, 2026
The Benchmarks study is finally here 🎉
Socialinsider Product Updates - November
Diana Gogolan
Dec 01, 2025
Facebook Views are here to stay 👀
Improve your social media strategy with Socialinsider!
Use in-depth data to measure your social accounts’ performance, analyze competitors, and gain insights to improve your strategy.