LinkedIn Metrics: The Essential Guide to Analytics That Drive Business Results
Discover the LinkedIn metrics that matter most for B2B marketing success. Analyze and transform insights into strategies that maximize ROI.


LinkedIn is the top spot for B2B marketing and connecting with professionals. But are you really getting the most out of it? If you're not tracking the right numbers, you're missing out.
With over 930 million members worldwide and 80% of B2B leads from social media coming directly from LinkedIn, mastering these metrics isn't optional — it's essential for measuring and maximizing your marketing ROI.
In this guide, I'll walk you through the LinkedIn metrics that matter most, how to track them effectively, and how to transform these insights into strategies that drive real business results.
Ready to improve your LinkedIn strategy with data-driven decisions? Let's dive in.
Key takeaways
-
Profile & audience metrics represent the data that reveals how visible you are on LinkedIn and whether you’re reaching the right people.
-
Content performance metrics measure how well your posts resonate, engage, and drive actions from your audience.
-
Conversion and business metrics connect your LinkedIn activity directly to leads, revenue, and return on investment.
What are LinkedIn metrics?
LinkedIn metrics are quantifiable measurements that track the performance of your LinkedIn marketing efforts. They provide concrete data about how your content resonates with your audience and how your strategy contributes to business objectives.
Think of LinkedIn metrics as your marketing compass — they show if you're heading in the right direction or need to adjust your approach. Without them, you're posting content and hoping for the best, rather than strategically optimizing based on what works.
LinkedIn offers two primary native analytics options:
- Company Page Analytics: Provides insights into page visitors, followers, and content performance
- Campaign Manager: Offers metrics for paid campaigns, including impressions, clicks, and conversions
These dashboards provide valuable data but have notable limitations:
- Limited historical data (typically 12 months)
- Basic export capabilities
- Minimal competitive intelligence
- No cross-platform comparison
This is where specialized tools like Socialinsider excel, offering extended historical data, competitive analysis, and customizable reporting in one unified dashboard.
Tracking LinkedIn metrics directly impacts your success in several ways:
- Performance optimization: Identify which content and posting times generate the highest engagement
- Resource allocation: Determine where to invest time and budget for the best return
- ROI demonstration: Prove the value of your LinkedIn efforts to stakeholders
- Competitive positioning: Benchmark data helps you understand how your performance compares to industry peers
- Audience insights: Learn who your content is reaching and resonating with
Whether you're a small business owner or marketing professional, mastering LinkedIn metrics is key to transforming your LinkedIn presence from just another digital asset into a powerful engine for business growth.
15 essential LinkedIn metrics you need to track
Measuring your success on LinkedIn requires tracking the right LinkedIn metrics. We've compiled the most important LinkedIn metrics to track that will give you meaningful insights into your performance, not just vanity numbers.
Each metric below includes what it measures, how to find it, what constitutes good performance, and practical ways to improve your results.
Profile & audience metrics
1. Page views
- What it measures — Profile views count how many LinkedIn members have visited your profile within a specific timeframe. This LinkedIn performance metric shows your visibility on the platform.
- How to access this metric — Go to your LinkedIn profile and click on "Show all analytics" beneath your introduction section. Select the "Profile views" tab.
- What good performance looks like — Good performance varies based on your industry and goals, but a consistent upward trend in profile views indicates growing visibility.
- How to improve this metric:
- Update your profile with a professional photo and compelling headline.
- Post content regularly (at least 2-3 times weekly).
- Comment thoughtfully on others' posts.
- Use relevant industry keywords in your profile.
- Join and participate in LinkedIn Groups related to your field.
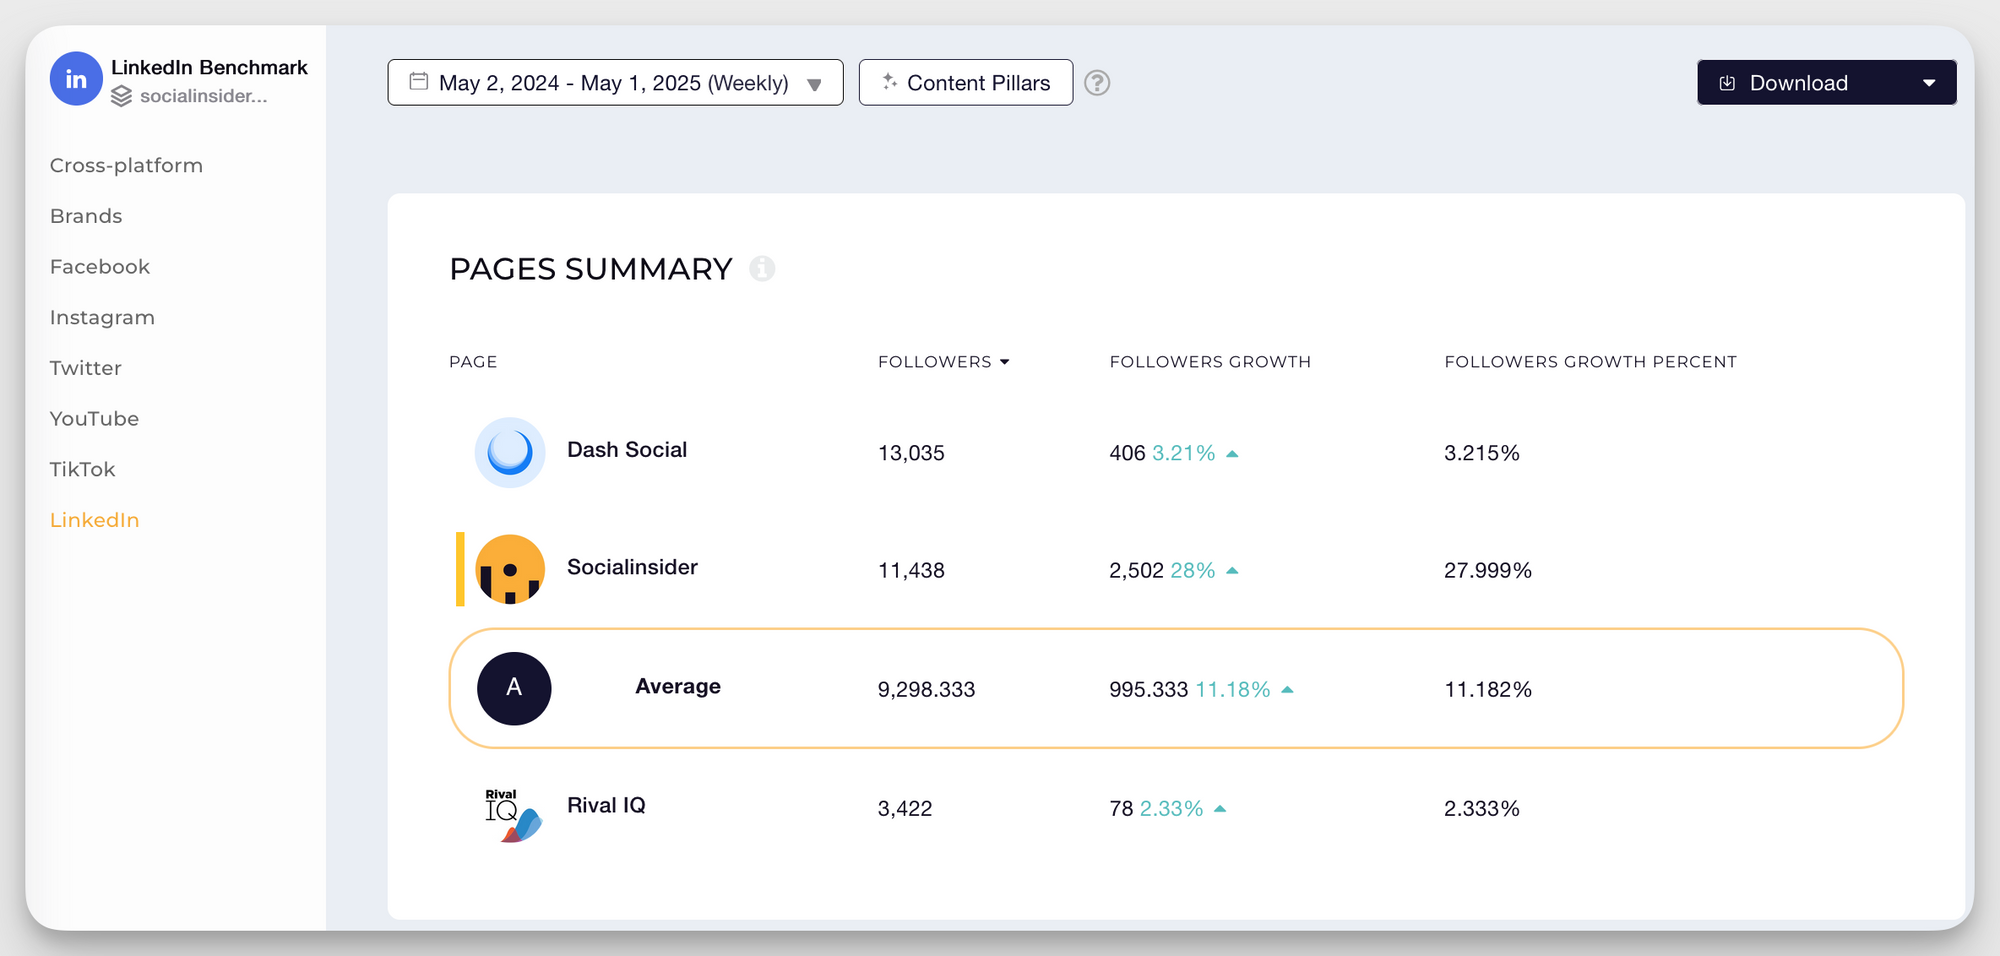
2. Follower growth rate
- What it measures — Follower growth rate calculates the percentage increase in followers over a specific period.
- The formula is: Follower growth rate = [(New followers - Lost followers) / Total followers at start of period] × 100
- How to access this metric — For company pages, go to Admin View > Analytics > Followers. For personal profiles, go to your dashboard, where you can see follower counts.
- What good performance looks like — A monthly growth rate of 2-5% is healthy for established accounts. New accounts should aim for 5-10% monthly growth.
- How to improve this metric:
- Create and share valuable, relevant content consistently.
- Naturally include "Follow" CTAs in your content.
- Cross-promote your LinkedIn profile on other platforms and distribution channels, like email or blogs.
- Engage with comments in real time.
- Use hashtags to expand reach.
While LinkedIn shows basic follower growth, Socialinsider provides comparative growth analysis against competitors and industry benchmarks, helping you understand if your growth rate is competitive in your specific sector.
3. Search appearances
- What it measures — Search appearances show how many times your profile appeared in LinkedIn search results. This indicates whether your profile contains the keywords potential clients are searching for.
- How to access this metric — Go to your profile and click on "See all analytics" beneath your introduction section. Select the "Search appearances" tab.
- What good performance looks like — Aim for steady growth in search appearances, especially from your target companies or industries. 50+ weekly search appearances is a strong performance for most professionals.
- How to improve this metric:
- Research and incorporate industry-specific keywords in your headline, summary, and experience sections.
- Add skills that match what potential clients search for and get endorsements for them.
- Create LinkedIn articles, newsletters, and posts using trending industry keywords.
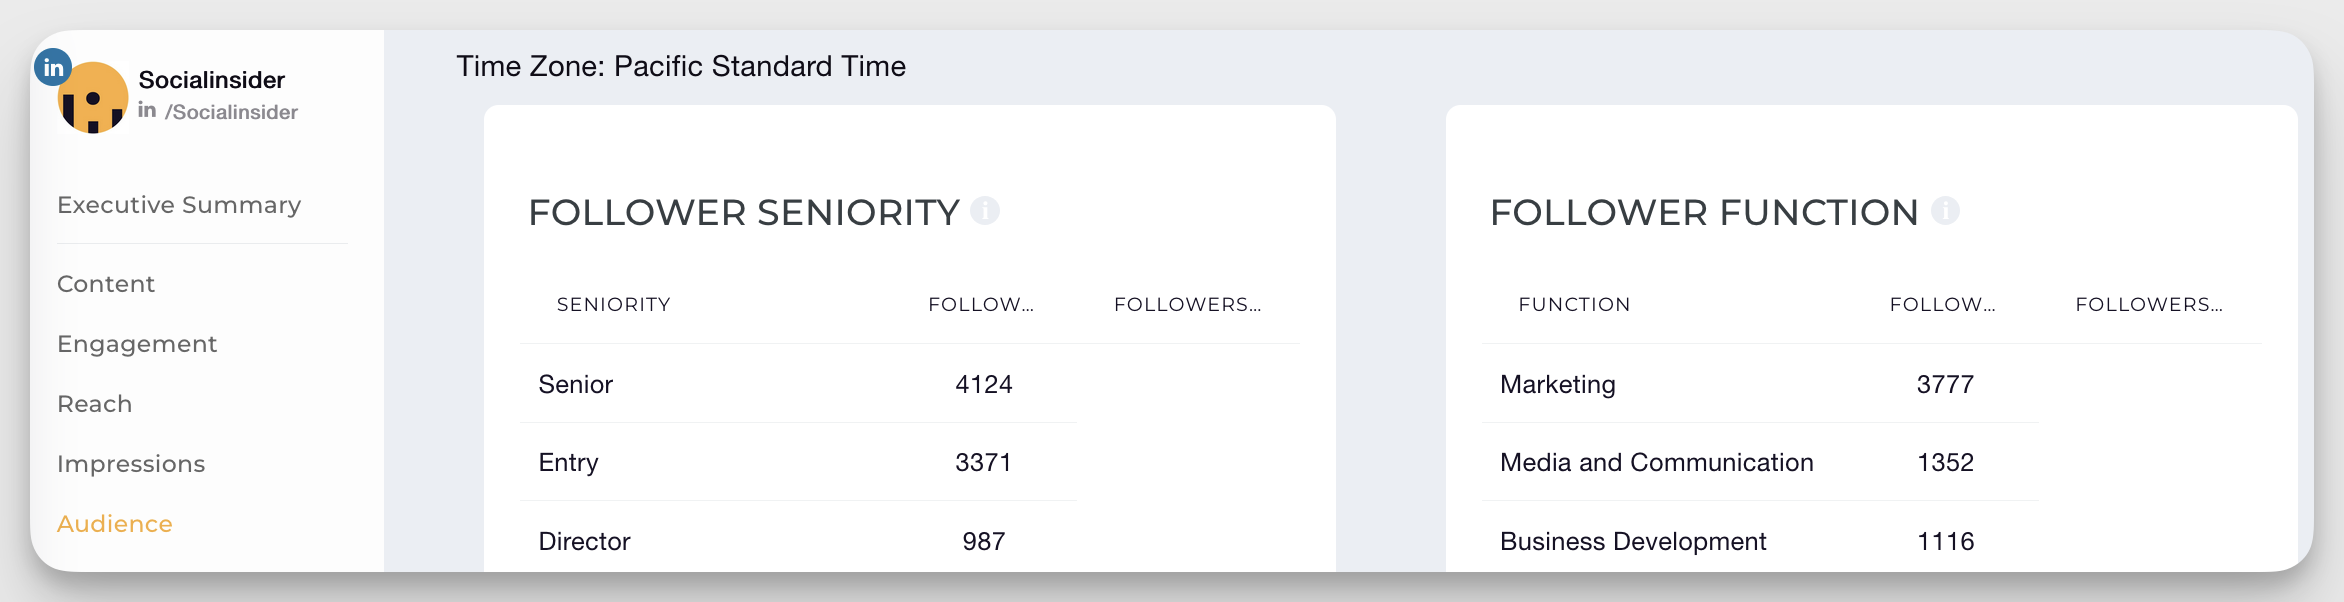
4. Audience demographics
- What it measures — Audience demographics show the professional characteristics of your followers, including job functions and location.
- How to access this metric — For company pages, go to Admin View > Analytics > Followers > Demographics. For personal profiles, go to Analytics > Audience.
- What good performance looks like — Good performance means your actual audience aligns with your target audience. For example, if you sell enterprise software, you want a high percentage of followers from large companies and in IT decision-making roles. If you're not sure what your ideal audience looks like, look into social media personas.
- How to improve this metric:
- Create content specifically addressing the needs of your target audience.
- Join LinkedIn Groups with ideal audience members.
- Use language specific to your ideal followers.
- Partner with LinkedIn influencers who have the audience you want to reach.
While LinkedIn offers basic metrics, Socialinsider can help you analyze your social media audience in depth, identifying opportunities to better reach your target demographic.
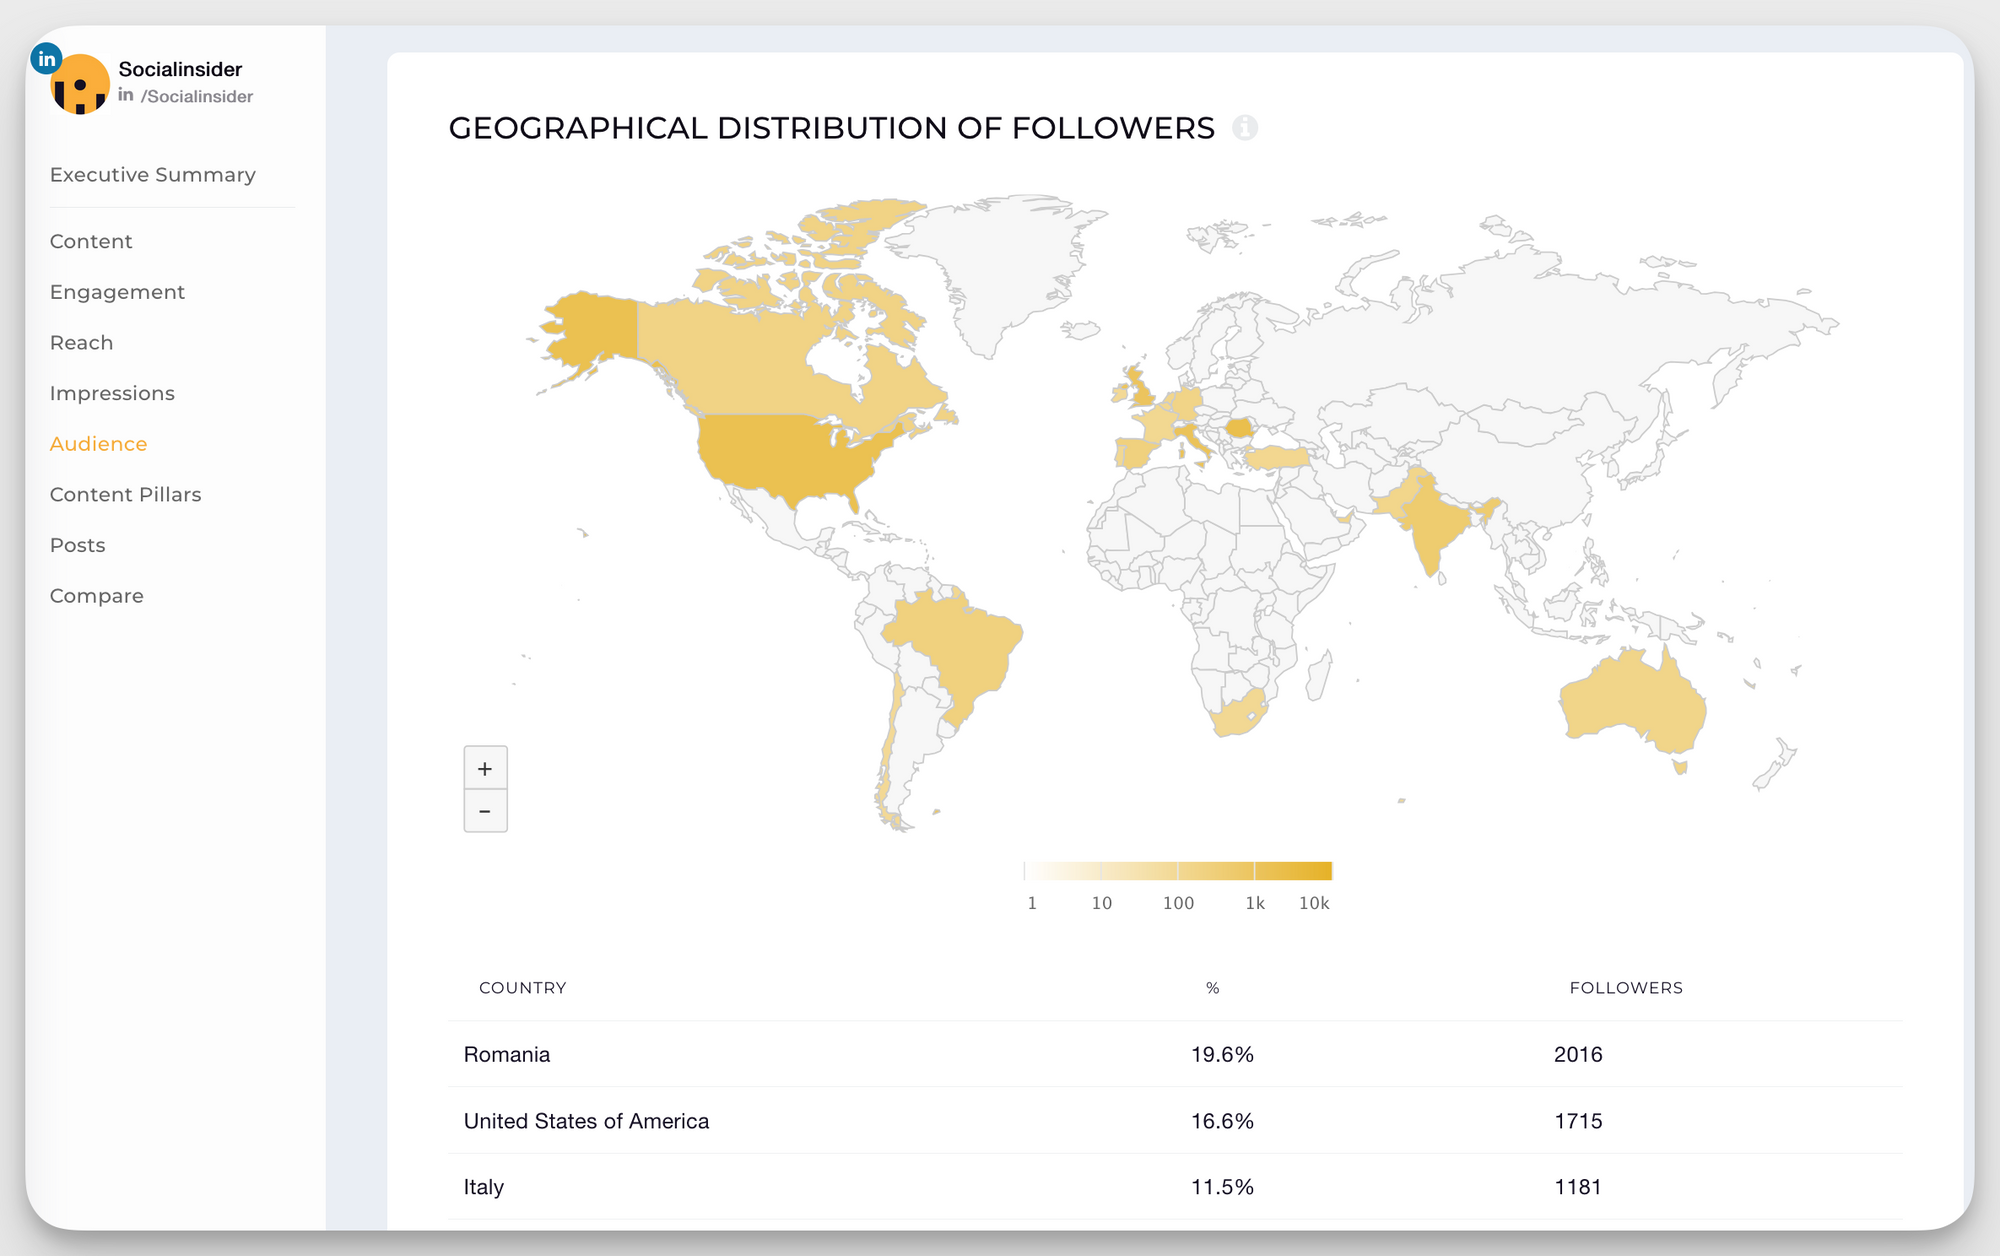
Understand your audience in terms of seniority, job title (not just department), industry, and company size so you can measure performance and adjust your content strategy if needed.
Content performance metrics
5. Post impressions
- What it measures — Post impressions count how many times your content was displayed to LinkedIn users, whether or not they clicked, reacted, or engaged with it.
- How to access this metric — For personal profiles, click "View analytics" under any of your posts. For company pages, go to Admin View > Analytics > Content engagement.
- What good performance looks like — Good performance depends on your follower count, but aim for impressions at least twice your follower count for each post (which may be difficult to achieve organically). This indicates your content is reaching beyond just your direct connections.
- How to improve this metric:
- Post during high-traffic hours (may differ depending on your audience).
- Create content that encourages tagging and sharing.
- Use 3-5 relevant hashtags per post.
- Try different content formats (text, images, documents, polls, videos).
- Engage with commenters quickly to signal to the LinkedIn algorithm that your post is generating conversation.
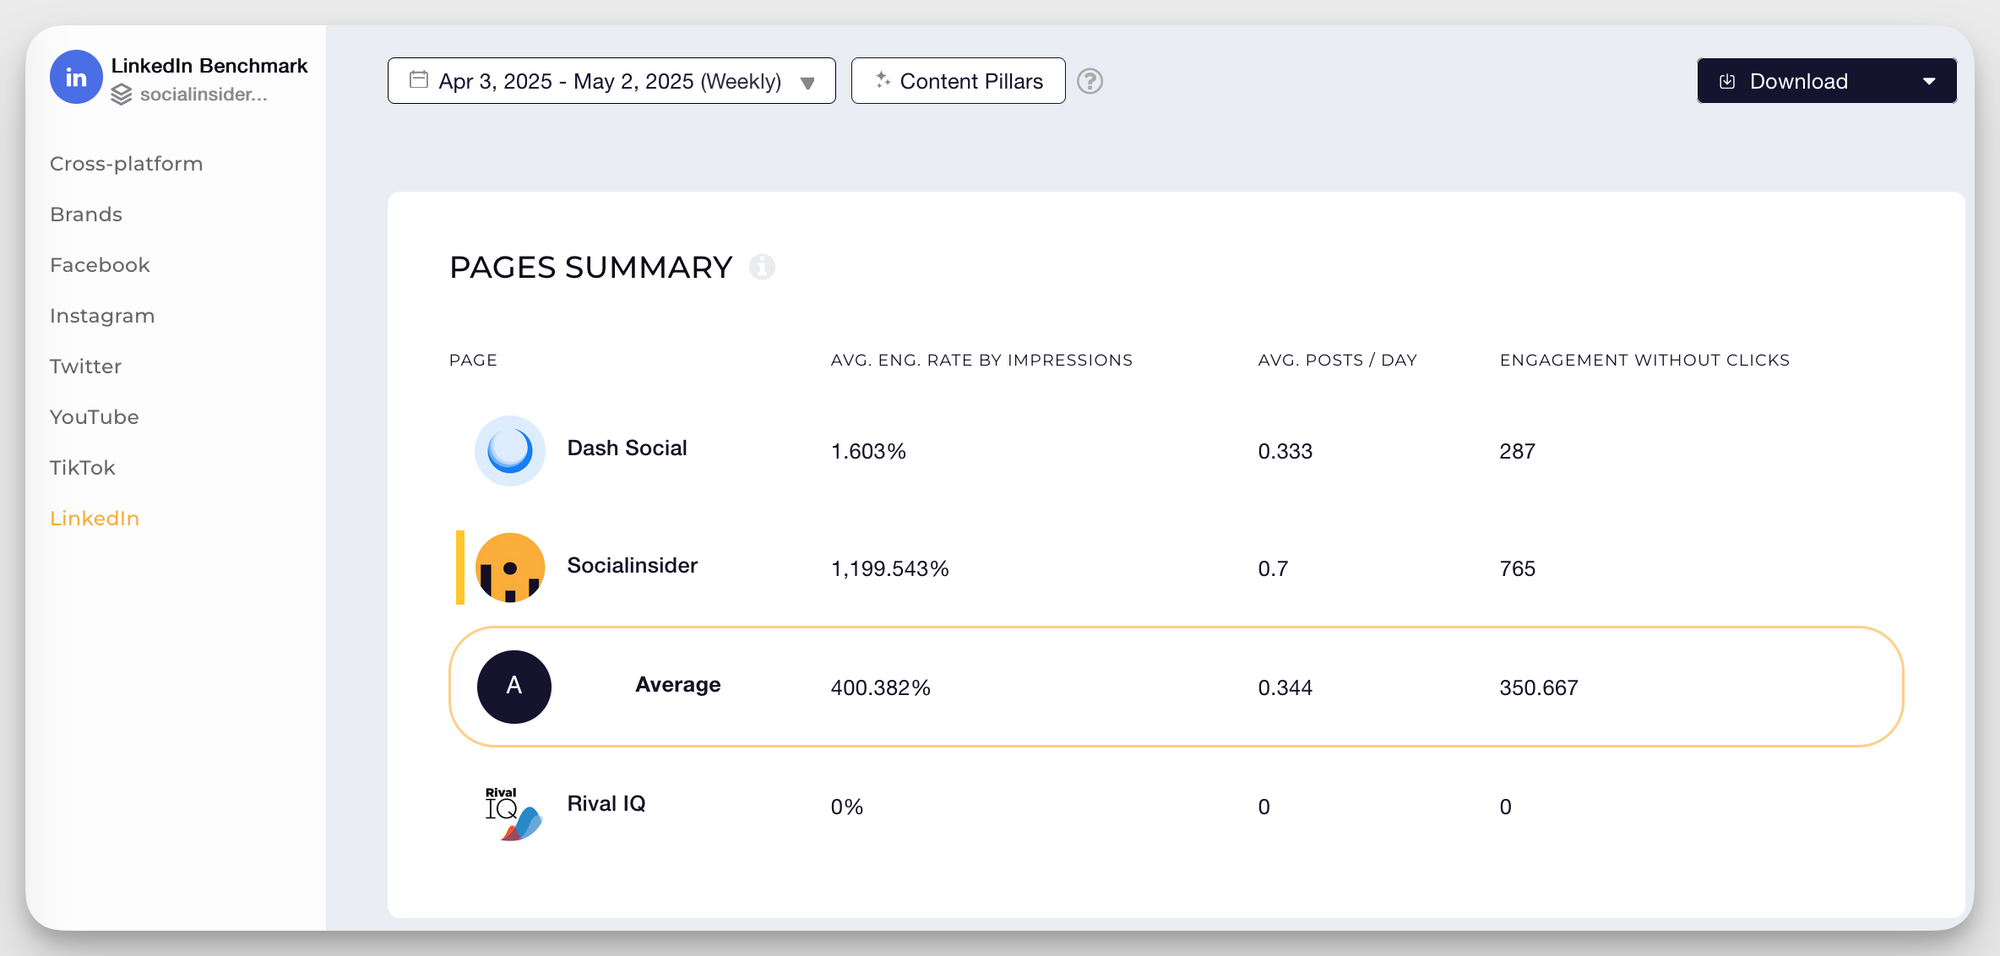
6. Engagement rate
- What it measures — Engagement rate calculates the percentage of people who engaged with your content relative to those who saw it.
- The formula is: Engagement rate = (Reactions + Comments + Shares + Clicks) / Impressions × 100
- How to access this metric — LinkedIn doesn't calculate this automatically, but you can use the formula above with data from your post analytics. Click "View analytics" on any post to see the components needed.
- What good performance looks like — According to LinkedIn metrics benchmarks:
- The average engagement rate by impressions on LinkedIn is 5.00%, reflecting a 30% year-over-year increase.
- Under 2% engagement needs improvement, 2–5% is average, and anything over 5% is considered good performance.
- How to improve this metric:
- Test different content formats and themes to see which gets the highest engagement with your audience.
- Ask questions in your posts and respond to comments.
- Create content that solves specific problems for your audience
- Use storytelling techniques to make content more relatable.
- Include clear CTAs.
Socialinsider automatically calculates engagement rates across all your LinkedIn content and competitors, saving time on manual calculations and providing industry benchmarks to understand your comparative performance.
7. Click-through rate
- What it measures — Click-through rate (CTR) measures the percentage of people who clicked on links in your content relative to those who saw it.
- The formula is: CTR = (Number of clicks / Impressions) × 100
- How to access this metric — Click "View analytics" on individual posts to see clicks and impressions, then calculate CTR using the formula above.
- What good performance looks like — A good CTR on LinkedIn ranges from 2-4%. Links to original, valuable content can achieve rates of 5-10% or higher.
- How to improve this metric:
- Create compelling headlines for your content
- Include a clear value proposition for why people should click
- Use custom link previews with eye-catching images and compelling descriptions
- Place links earlier in your post rather than at the end
- Test different CTAs to see which drives the most clicks
8. Video view rate
- What it measures — Video view rate calculates the percentage of video views relative to impressions, showing how compelling your video thumbnails and topics are.
- The formula is: Video view rate = (Number of views / Impressions) × 100
- Note: LinkedIn counts a "view" when a video plays for at least 2 seconds.
- How to access this metric — Click "View analytics" on any video post to see views and impressions, then calculate the rate manually.
- What good performance looks like — A good video view rate on LinkedIn is 30-40%, with top-performing videos reaching 50-60%. Anything below 15-20% needs improvement.
- How to improve this metric:
- Create eye-catching custom thumbnails.
- Add captions to videos (the majority of LinkedIn videos are watched without sound).
- Keep videos short — under 2 minutes is ideal.
- Put your key message in the first 5-10 seconds.
- Use an engaging hook that creates curiosity.
- Optimize videos for mobile viewing (square or vertical formats).
Socialinsider offers detailed video performance analytics across multiple platforms, including LinkedIn, allowing you to compare LinkedIn video metrics across your social channels to identify which video styles perform best on each platform.
9. Content shares
- What it measures — Content shares count how many times users have shared your posts with their own networks, amplifying your reach beyond your direct followers.
- How to access this metric — Click "View analytics" on individual posts to see the number of shares.
- What good performance looks like — Share counts vary widely based on follower count, but aim for a share rate (shares divided by impressions) of at least 0.5%. Top-performing content may reach 1-2%.
- How to improve this metric:
- Create content that makes the person sharing look knowledgeable to their network (data, little-known facts, useful guides).
- Develop original research or industry data that provides unique insights.
- Use formats that are easily digestible (lists, infographics, short tips, memes).
- Take a clear position on industry trends.
- Ask people to share if they found the content valuable.
- Create content that helps solve common problems.
In a short chat I've recently had with Kate Meyers Emery about the importance of analyzing specific metrics, she gave me this advice:
It depends on your goal! If you're trying to build brand awareness, then engagement, engagement rate, and followers are important. If you're changing to improve brand sentiment, then looking at comments and tags is the winner.
Conversion & business metrics
10. Referral traffic
- What it measures — Referral traffic measures the number of visitors to your website that came directly from LinkedIn.
- How to access this metric — In Google Analytics, go to Acquisition > Social > Network Referrals and look for traffic from LinkedIn.
- What good performance looks like — Good performance means LinkedIn is among your top 5 social referral sources, with growing visit numbers and better-than-average engagement metrics (time on site, pages per session).
- How to improve this metric:
- Share website content with added context about why it's valuable.
- Post different types of content from your site (blog posts, case studies, resources).
- Include relevant and compelling CTAs in your posts.
- Create LinkedIn-specific landing pages and track campaigns.
- Use LinkedIn articles to preview longer content on your website.
- Test different posting times to see when your audience is most likely to click through.
11. Lead generation
- What it measures — Lead generation counts how many qualified leads your LinkedIn activities produce, whether through organic content, direct outreach, or paid campaigns.
- How to access this metric — Track leads from LinkedIn in your CRM by using UTM parameters and lead source fields. For Lead Gen forms, access metrics in Campaign Manager.
- What good performance looks like — Good performance means LinkedIn leads have a higher conversion rate than average for your business, with a lower cost per lead than other channels.
- How to improve this metric:
- Create gated content specifically for LinkedIn audiences.
- Use LinkedIn Lead Gen forms for easier lead capture.
- Follow up with new connections using relevant, personalized messages.
- Share content that addresses specific pain points in your buyers' journey.
- Create content that demonstrates your expertise in solving problems.
- Ensure your profile and company page clearly communicate your unique value proposition.
12. Cost per lead (for paid campaigns)
- What it measures — Cost per lead calculates how much you spend on LinkedIn advertising to generate each qualified lead.
- The formula is: Cost per lead = Total ad spend / Number of leads generated
- How to access this metric — In LinkedIn Campaign Manager, go to the "Conversions" tab for your campaign.
- What good performance looks like — Good performance varies widely by industry and campaign, but CPL typically ranges from $30-$80 per lead. For high-value services or products, costs may be much higher. Even though LinkedIn CPL may require bigger budgets than other platforms, marketers also report higher quality leads.
- How to improve this metric:
- Test different audience segments to find the most responsive groups.
- Create highly targeted offers for specific job titles or industries.
- A/B test ad creative to improve conversion rates.
- Optimize landing pages for higher conversion rates.
- Refine your lead qualification criteria to ensure quality.
- Use retargeting campaigns for people who've engaged with your content
13. Conversion rate
- What it measures — Conversion rate calculates the percentage of LinkedIn visitors who complete your desired action (signing up, downloading content, requesting a demo).
- The formula is: Conversion rate = (Number of conversions / Number of visitors) × 100
- How to access this metric — Track with LinkedIn Campaign Manager for ads, or in Google Analytics for your website, by looking at visitors from LinkedIn.
- What good performance looks like — The average conversion rate across LinkedIn ad formats is about 6%, with lead generation form completion rates typically between 10% and 15%.
- How to improve this metric:
- Ensure messaging consistency between LinkedIn content and landing pages.
- Create LinkedIn-specific landing pages that continue the conversation.
- Test different offers to find what resonates with your LinkedIn audience.
- Use social proof specific to LinkedIn professionals.
- Simplify forms to reduce friction (especially on mobile).
- Add urgency or scarcity elements when appropriate.
Here's a very important note, emphasized also by Emma Faggoter, Social Media Coordinator at Slice.
Numbers alone don’t tell the full story – you need context to uncover real insights.
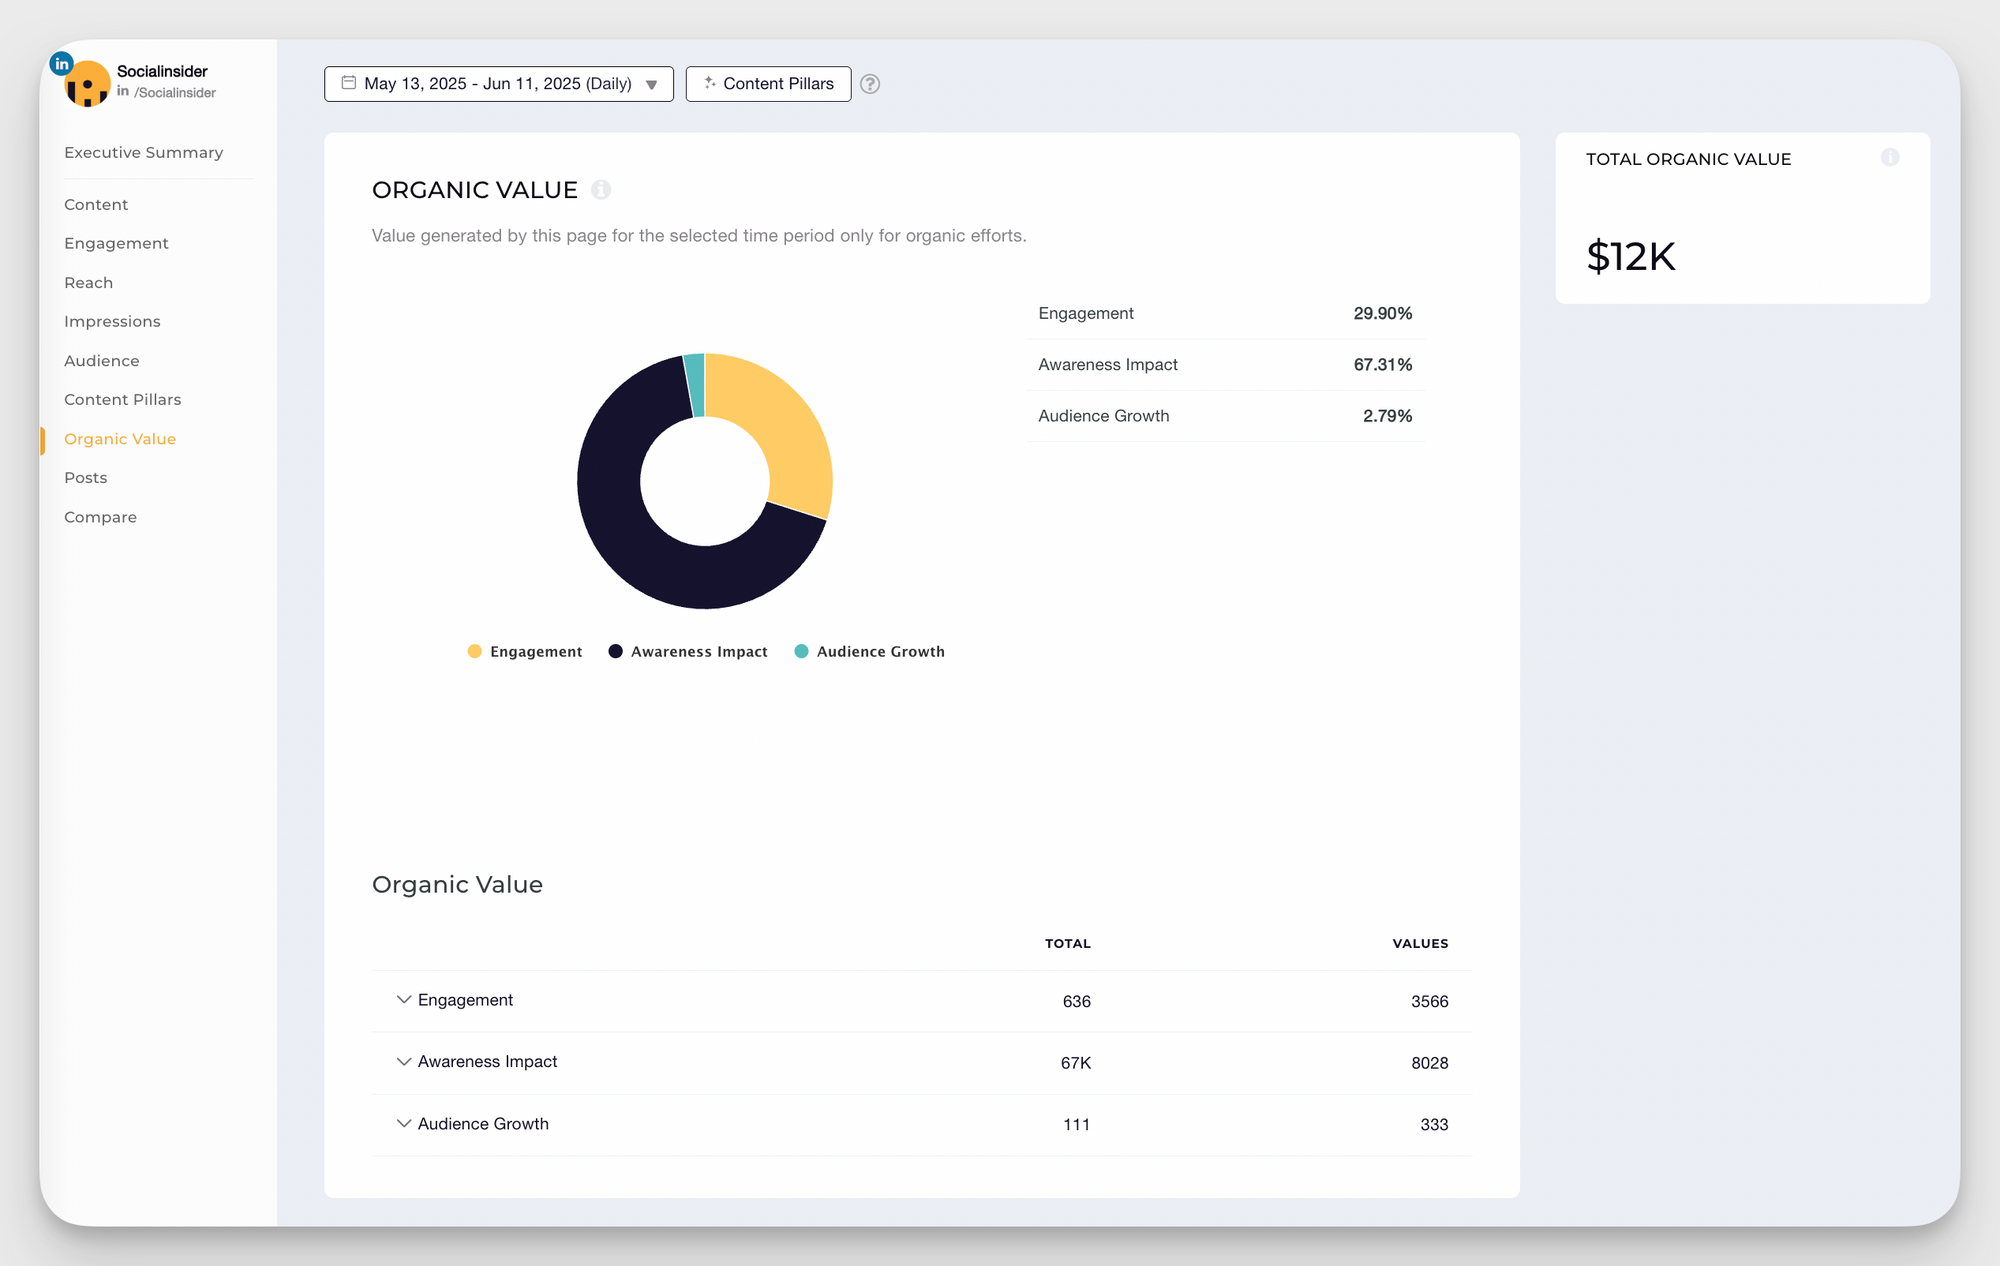
Organic value
At Socialinsider er recently lancuhed a feature that can be of most help for you when it comes to proving the value brought by LinkedIn to your company.
This unique feature takes your organic reach, engagement, and follower data, applies cost-per-thousand impressions (CPM) benchmarks, and calculates the estimated dollar value of your non-paid posts. By pairing this with traditional KPIs, you can show executives not just how your campaigns performed, but how much they’re worth in real business terms.
15. Return on investment (ROI)
- What it measures — ROI measures the business return generated from your LinkedIn marketing efforts compared to the costs.
- The formula is: ROI = [(Revenue attributed to LinkedIn - Cost of LinkedIn activities) / Cost of LinkedIn activities] × 100
- How to access this metric — Combine data from your CRM, Google Analytics, and LinkedIn spending to calculate.
- What good performance looks like — A positive ROI is good, but most businesses aim for at least 3-5x return on social media marketing investments. For LinkedIn specifically, due to higher costs but better B2B targeting, expect a 2-4x ROI.
- How to improve this metric:
- Track LinkedIn leads through your entire sales funnel.
- Decrease costs by improving ad targeting and organic reach.
- Create content specifically designed to move prospects through your sales funnel.
- Test different content types and offers to find the most cost-effective approach.
- Improve your lead-nurturing process for LinkedIn-generated leads.
Socialinsider's comprehensive LinkedIn reporting helps you connect your performance to business outcomes by tracking results over time and benchmarking against other brands. This makes ROI calculation easier, while also offering actionable insights to help with strategy improvement.
And here's a final tip that Chi Thrukal, award-winning creative, gave me:
Read the data points but turn them into a story. The stakeholders won't connect the dots for you, you have to show them what are the intangibles that come from these tangible data points.
How to use LinkedIn analytics to optimize performance
We already covered how to find specific LinkedIn metrics. Let's now look at how to navigate LinkedIn's native analytics to get a comprehensive view of your performance.
Company page analytics
LinkedIn provides fundamental analytics for company pages that help you understand your audience, content performance, and growth trends.
Dashboard overview
When you log into your company page as an admin, click on the "Analytics" tab in the left navigation. This opens the main analytics dashboard, which is divided into six primary sections:
- Content — Provides detailed LinkedIn post metrics, including impressions, engagement rate, click-through rates, and performance data for all your published content.
- Visitors — Shows traffic to your page, demographic breakdowns of viewers, and which sections they're viewing.
- Followers — Displays follower growth, demographic information, and individual followers.
- Leads —Tracks lead generation from your page, including form fills and direct inquiries.
- Newsletters — Provides analytics on newsletter subscribers, open rates, and engagement metrics.
- Competitors — Offers competitive analysis by comparing your page's performance against similar companies.
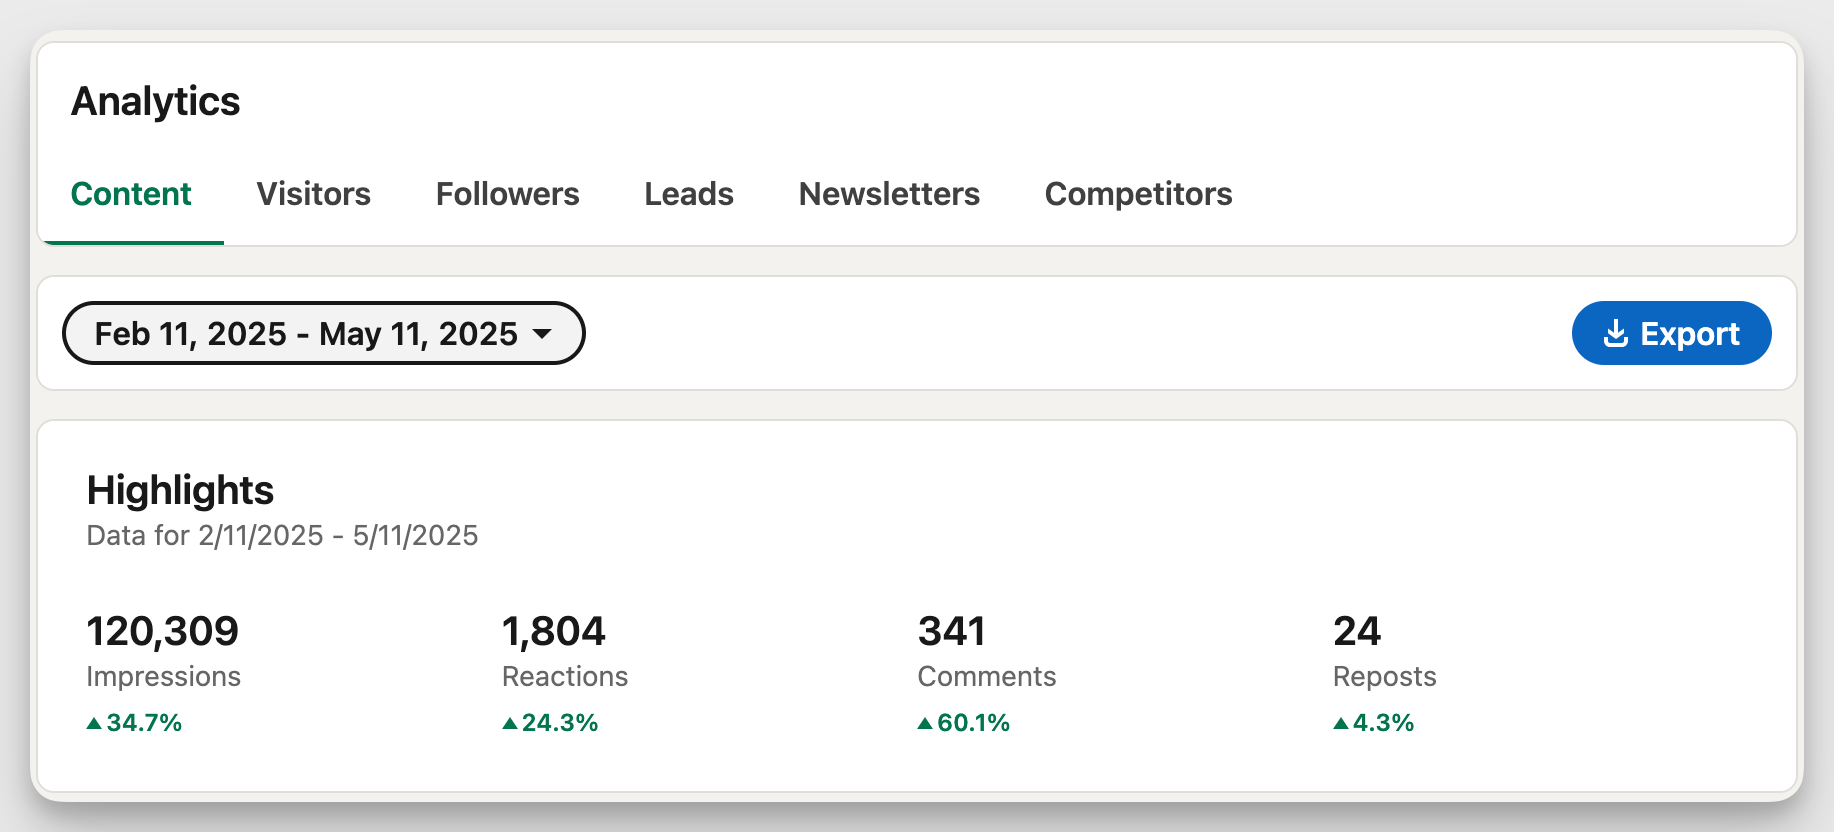
The dashboard presents a clean, visual overview of your key metrics with graphs showing performance over time and comparison data to help you understand social media trends.
Export options
LinkedIn allows you to export your analytics data for deeper analysis:
- Click the "Export" button in the upper right corner of any analytics section
- The data is exported as an .XLS file.
- Select your date range (up to 12 months for most metrics). LinkedIn limits historical data access depending on the metric, making regular exports important for long-term trend analysis.
Campaign manager analytics
If you're running paid campaigns on LinkedIn, Campaign Manager provides detailed LinkedIn ad metrics to track and optimize your ad performance.
Navigation instructions
- Log in to Campaign Manager at linkedin.com/campaignmanager.
- Select the account you want to analyze.
- Click on the "Performance" tab to see an overview of all campaigns.
- For detailed metrics on a specific campaign, click on its name.
- Navigate between tabs (Performance, Creatives, Demographics, etc.) to view different aspects of your campaign performance.
The interface allows you to filter and segment data by date range, campaign objective, ad format, and other variables to isolate the information most relevant to your analysis.
Key reports overview
- Performance dashboard — Shows high-level metrics for all campaigns, including impressions, clicks, CTR, conversions, and spend, with customizable graphs and benchmark comparisons.
- Conversions tab — Tracks actions taken after ad clicks, including leads, sign-ups, and purchases with attribution data.
- Demographics tab — Shows which audience segments (job functions, seniority, company size, etc.) engage most with your ads.
- Creatives tab — Compares performance across different ad formats, headlines, images, and copy variations.
- Video analytics — For video ads, provides detailed metrics on views, completion rates, and viewer behavior by demographic.
- Campaign metrics — Includes impressions, clicks, CTR, conversions, conversion rate, total spend, CPC, CPM, cost per conversion, and engagement data (reactions, comments, shares).
- Audience analysis — Breakdowns of audience response by job function, seniority, industry, company size, and location, with performance comparisons.
Custom reporting options
Campaign Manager offers several ways to customize and deepen your analytics:
- Chart customization — Modify metrics, visualizations, and date ranges within the dashboard.
- Custom metrics — While Campaign Manager doesn't support in-dashboard custom formulas, you can create calculated fields in exported reports or external tools like Excel.
- Segment performance — Break down results by demographic filters, device, campaign elements, or time of day.
- Scheduled reports — Automate report delivery to stakeholders on a daily, weekly, or monthly basis.
- Multi-campaign analysis — Compare performance across campaigns to identify trends and top performers.
Final thoughts
Success on LinkedIn comes from consistent measurement, analysis, and optimization. The metrics that matter most for your brand depend on your specific business goals, whether that's building awareness, generating leads, or establishing thought leadership.
However, numbers tell only part of the story. Behind every metric is a human connection — a professional looking for valuable information, solutions to their challenges, or inspiration for their work. Focus on creating genuine value, and the metrics will follow.
FAQs about LinkedIn metrics
1. What are the most important KPIs for LinkedIn?
The most important LinkedIn key metrics to track depend on your specific business goals:
- Brand awareness: Impressions, reach, follower growth rate
- Engagement: Engagement rate, comments per post, share rate
- Lead generation: Click-through rate, conversion rate, cost per lead
- Recruitment: Job application rate, talent brand index, career page views
- Sales: Social Selling Index (SSI), InMail acceptance rate, connection growth
2. How often should I check my LinkedIn metrics?
For optimal performance monitoring without getting overwhelmed by data:
- Daily — Quick check of recent post performance (5 minutes)
- Weekly — Review of key performance indicators and content effectiveness (30 minutes)
- Monthly — Comprehensive analysis of trends, audience growth, and goal progress (1-2 hours)
- Quarterly: In-depth performance review with strategy adjustments (half-day)
Use tools like Socialinsider to automate reporting on different timeframes and save time.
3. How do I pull metrics from LinkedIn for reporting?
For company pages, access your analytics section through the left navigation, select your desired metrics category (Content, Visitors, Followers, etc.), set your time range, and click the "Export" button in the upper right corner to download in an .XLS format.
In Campaign Manager, navigate to the Performance tab, apply your desired filters for campaigns and dates, then use the Export function to download your data.
Most LinkedIn data can be exported for up to 12 months of historical information, though some metrics may have shorter availability windows.
4. How can I improve underperforming LinkedIn metrics?
The most effective approach combines content optimization, strategic timing, and consistent analysis of what performs well for both your page and competitors.
For visibility metrics, adjust your posting schedule to high-traffic times and explore different content formats. To boost engagement metrics, create more interactive content with questions, polls, and conversation starters. For conversion metrics, refine your calls-to-action and ensure content aligns with audience needs. For audience growth, increase posting consistency and cross-promote your LinkedIn presence.
Sabina Varga
Content marketing expert with 15 years of experience in digital marketing. I dream of beach life but love the city as a multitasking mom juggling playgrounds, books, brunches, and travels.

Know what your competitors do — before your manager asks
Get instant social benchmarks & reports without manual work.