How to Use Socialinsider with Looker Studio for Better Reporting Workflow
Discover how to effectively use Socialinsider with Looker Studio to enhance your data analysis and gain deeper insights into your brand's performance.

Have you ever wanted to turn your social media marketing data into a fully customized, interactive dashboard?
Socialinsider already makes it easy to generate clear, ready-to-share reports. But sometimes you need something more tailored. Especially when you want to create a dashboard with data sources from social as well as web or your online store.
That’s where using Socialinsider with Looker Studio can add an extra layer of flexibility.
In this guide, I’ll show you how to combine Socialinsider with Looker Studio to generate a dashboard that answers all the questions your executives or clients might have.
Let’s get started.
Key takeaways
-
Why combine Socialinsider with Looker Studio? Connecting Socialinsider with Looker Studio allows you to transform real-time social media data into clear, automated dashboards that make performance insights easier to analyze and share.
-
How to connect Socialinsider with Looker Studio? You can connect Socialinsider to Looker Studio by using the official connector, authenticating with your API key, selecting the projects and profiles you want to analyze, and creating a data source for your dashboard.
-
Which kind of reports can you build with Socialinsider in Looker Studio? With Socialinsider data in Looker Studio, you can build automated dashboards for weekly performance monitoring, client reporting, campaign tracking, and cross-platform analysis.
-
Best practices for creating dashboards in Looker Studio: The most effective Looker Studio dashboards focus on answering specific questions, highlight key KPIs, maintain consistent structure, and present insights that support data-driven decisions.
What is Looker Studio?
Looker Studio is a data visualization and reporting platform by Google that helps you turn raw data into easy-to-understand dashboards.
Instead of looking at numbers in spreadsheets, you can visualize your data using charts, graphs, and interactive reports.
Why use Looker Studio for social media reporting?
If you’re working with a lot of data, Looker Studio is the place to be. But here are three more reasons why it’s a great choice for social media reporting when paired with Socialinsider.
Create reusable reporting systems
One of the biggest advantages of Looker Studio is that you only need to build your dashboard once. After that, it becomes a reusable reporting system.
For example, if you create a monthly social media performance dashboard along with website metrics, it will automatically update with new data each month so you don’t have to rebuild the report every time.
Customize reporting
Looker Studio gives you flexibility in how you present your data. You can create different report layouts, add filters, and adjust visual elements depending on the audience. For example, a marketing team might want a detailed dashboard, while leadership may prefer a simpler report focused only on high-level social media KPIs.
Make reporting easier to share and collaborate on
Looker Studio reports are easy to share with teams, clients, or stakeholders through a simple link. Instead of sending updated files every time data changes, everyone can access the same dashboard.
This makes collaboration easier because teams can discuss insights while looking at the same live data.
Why combine Socialinsider with Looker Studio?
You don’t want your Looker Studio dashboard to be filled with last week’s data. Socialinsider makes that easy by providing you with real-time data.
Here are four more reasons why an integration with Socialinsider will get you better reports in Looker Studio.
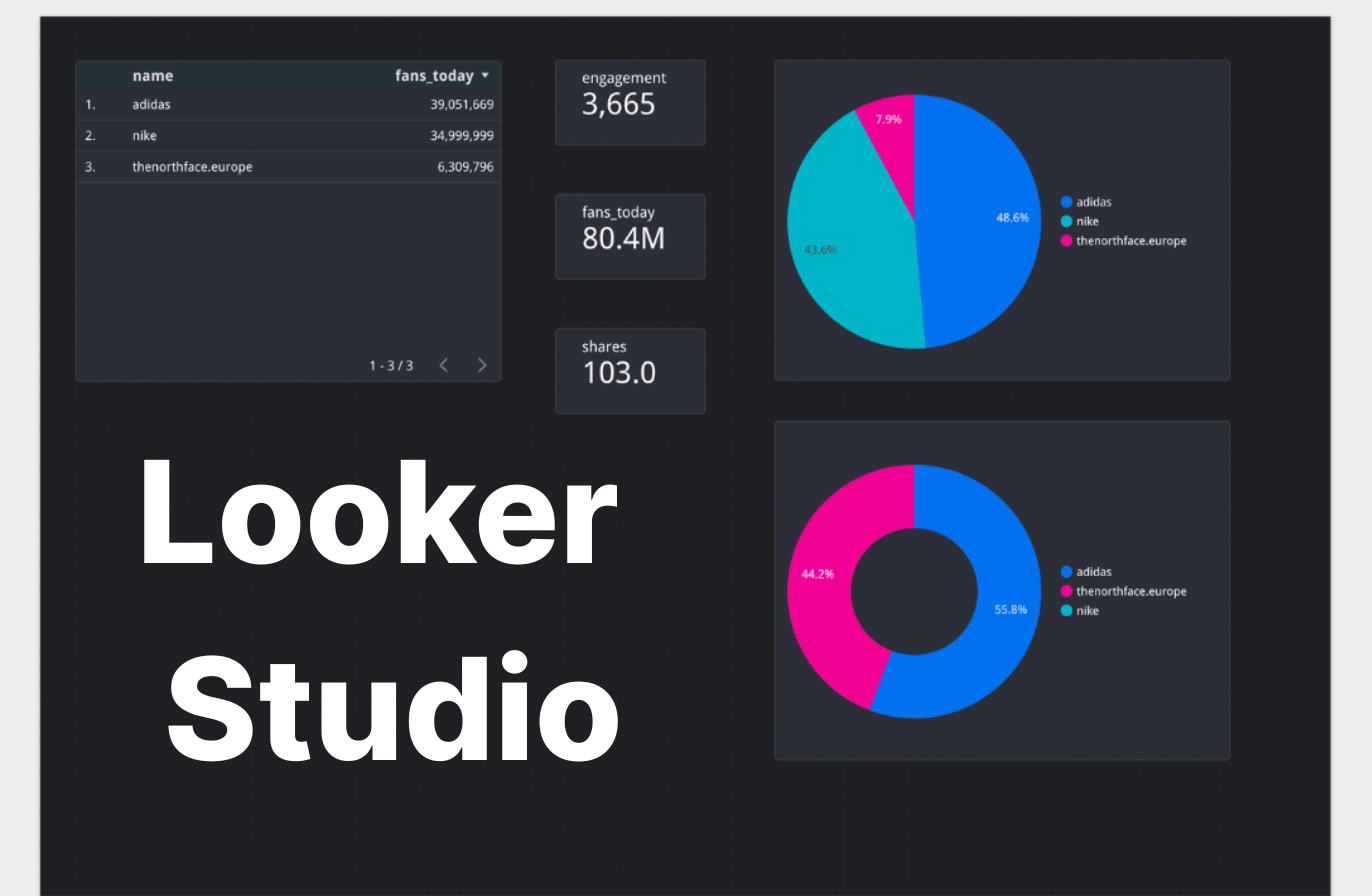
Customize raw metrics into clearer visual insights
Socialinsider provides detailed social media analytics, but visualizing those metrics in Looker Studio can make insights easier to communicate. Instead of listing numbers in a table, you can turn them into charts and visual comparisons. This makes it much easier for stakeholders to quickly understand trends, performance gaps, and opportunities.
Make cross-platform reporting easier
Trying to get Facebook insights from Meta? And YouTube insights from a completely different tool?
Socialinsider helps with cross-platform data so you can get all your social data in one place. This is why I’ve found that connecting Socialinsider data to Looker Studio makes it much easier to see everything in one place.
For example, you can set up the Looker Studio dashboard to view Instagram, Facebook, LinkedIn, and TikTok performance side by side.
Make competitive reporting seamless
Competitive analysis becomes much easier when the data is already structured in a dashboard. With Socialinsider providing competitor insights and Looker Studio visualizing them, you can quickly compare engagement, posting activity, or growth across brands.
Instead of compiling competitor reports manually, the dashboard already shows where you stand in the market.
Get client-ready reports without manual work
If you’ve ever built reports for clients or leadership, you know how time-consuming it can be. Combining Socialinsider with Looker Studio helps automate a lot of that process.
Once the dashboard is set up, it becomes a ready-to-share report that updates automatically, making it easier to present insights without spending hours preparing slides or spreadsheets.
How to connect Socialinsider with Looker Studio?
Connecting Socialinsider to Looker Studio is a straightforward process. Here’s how to set it up step by step.
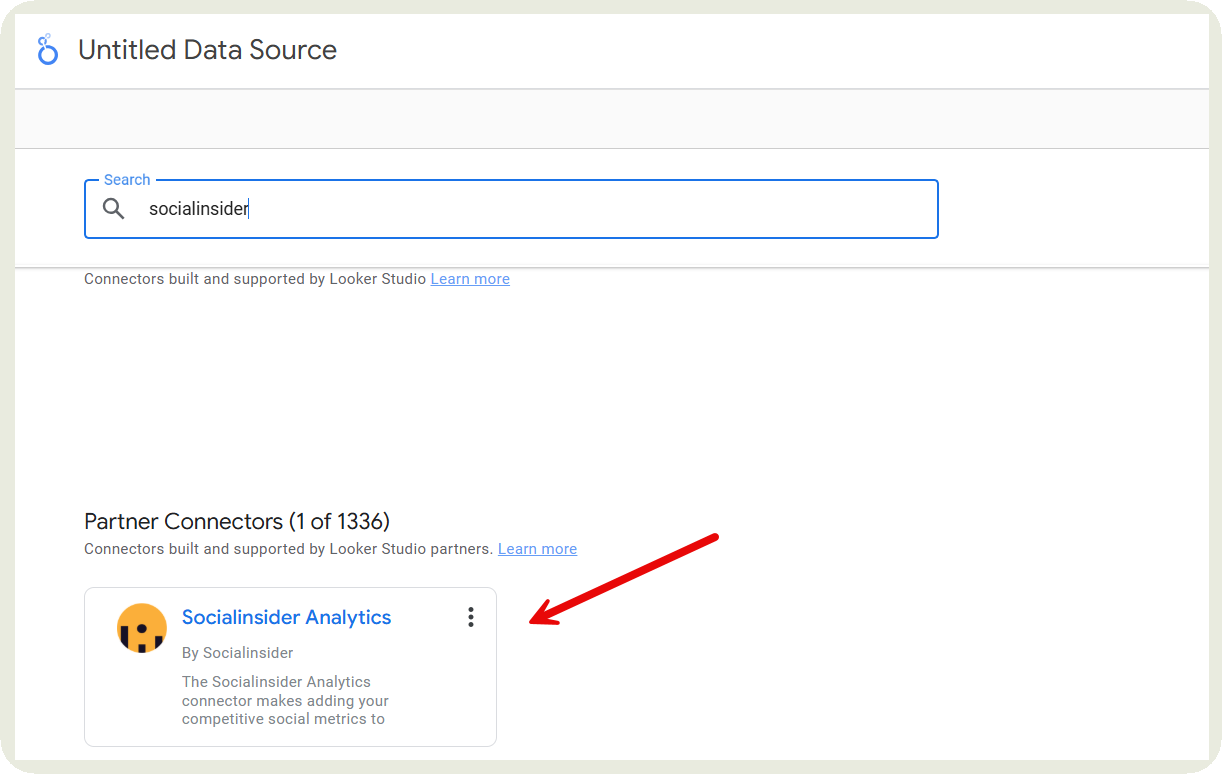
1. Find the Socialinsider connector in Looker Studio
First, go to Looker Studio and open the connectors gallery. Google renamed Data Studio to Looker Studio, so if you’ve used the older version before, the process will feel familiar.
In the connectors search bar, type Socialinsider. You should see the official Socialinsider connector appear in the results. Select it to start the integration process.
Before you proceed, there’s one important requirement: the Looker Studio integration works through a Socialinsider API key, which is available as an add-on to any Socialinsider plan. If the integration add-on isn’t enabled in your account, the connector won’t be able to pull data.
2. Authenticate your account
Once you select the connector, you’ll be asked to authorize the connection between Looker Studio and Socialinsider.
To do this, you’ll need your API key, which you can find inside your Socialinsider account. Copy the API key and paste it when Looker Studio prompts you for it.
This step simply allows Looker Studio to securely access the data from your Socialinsider account. After adding the key and granting permissions, the connection will be established and you can move on to selecting your data.
3. Choose your data
Next, you’ll decide which data you want to bring into your dashboard.
Start by selecting the Socialinsider project you want to connect. Projects usually contain the brands or clients you’re tracking. If you manage multiple brands, you can connect different projects and compare them in the same dashboard.
After choosing the project, select the social media platforms you want to include, such as Instagram, Facebook, TikTok, or LinkedIn. Then you can define the profiles you want to analyze.

4. Create your data source
Once your selections are finalized, Looker Studio will generate a data source based on the Socialinsider data you connected.
This data source acts as the foundation for your reports. From here, you can start building charts, tables, and dashboards inside Looker Studio using the metrics pulled from Socialinsider.
The best part is that once the data source is set up, your reports will update automatically whenever new data is available.
How to build your reporting dashboard in Looker Studio
When I build dashboards in Looker Studio, I usually start simple — adding a few key elements first and then expanding the report depending on what insights I want to highlight.
Here’s how you can structure your reporting dashboard.
Set up your core dashboard elements
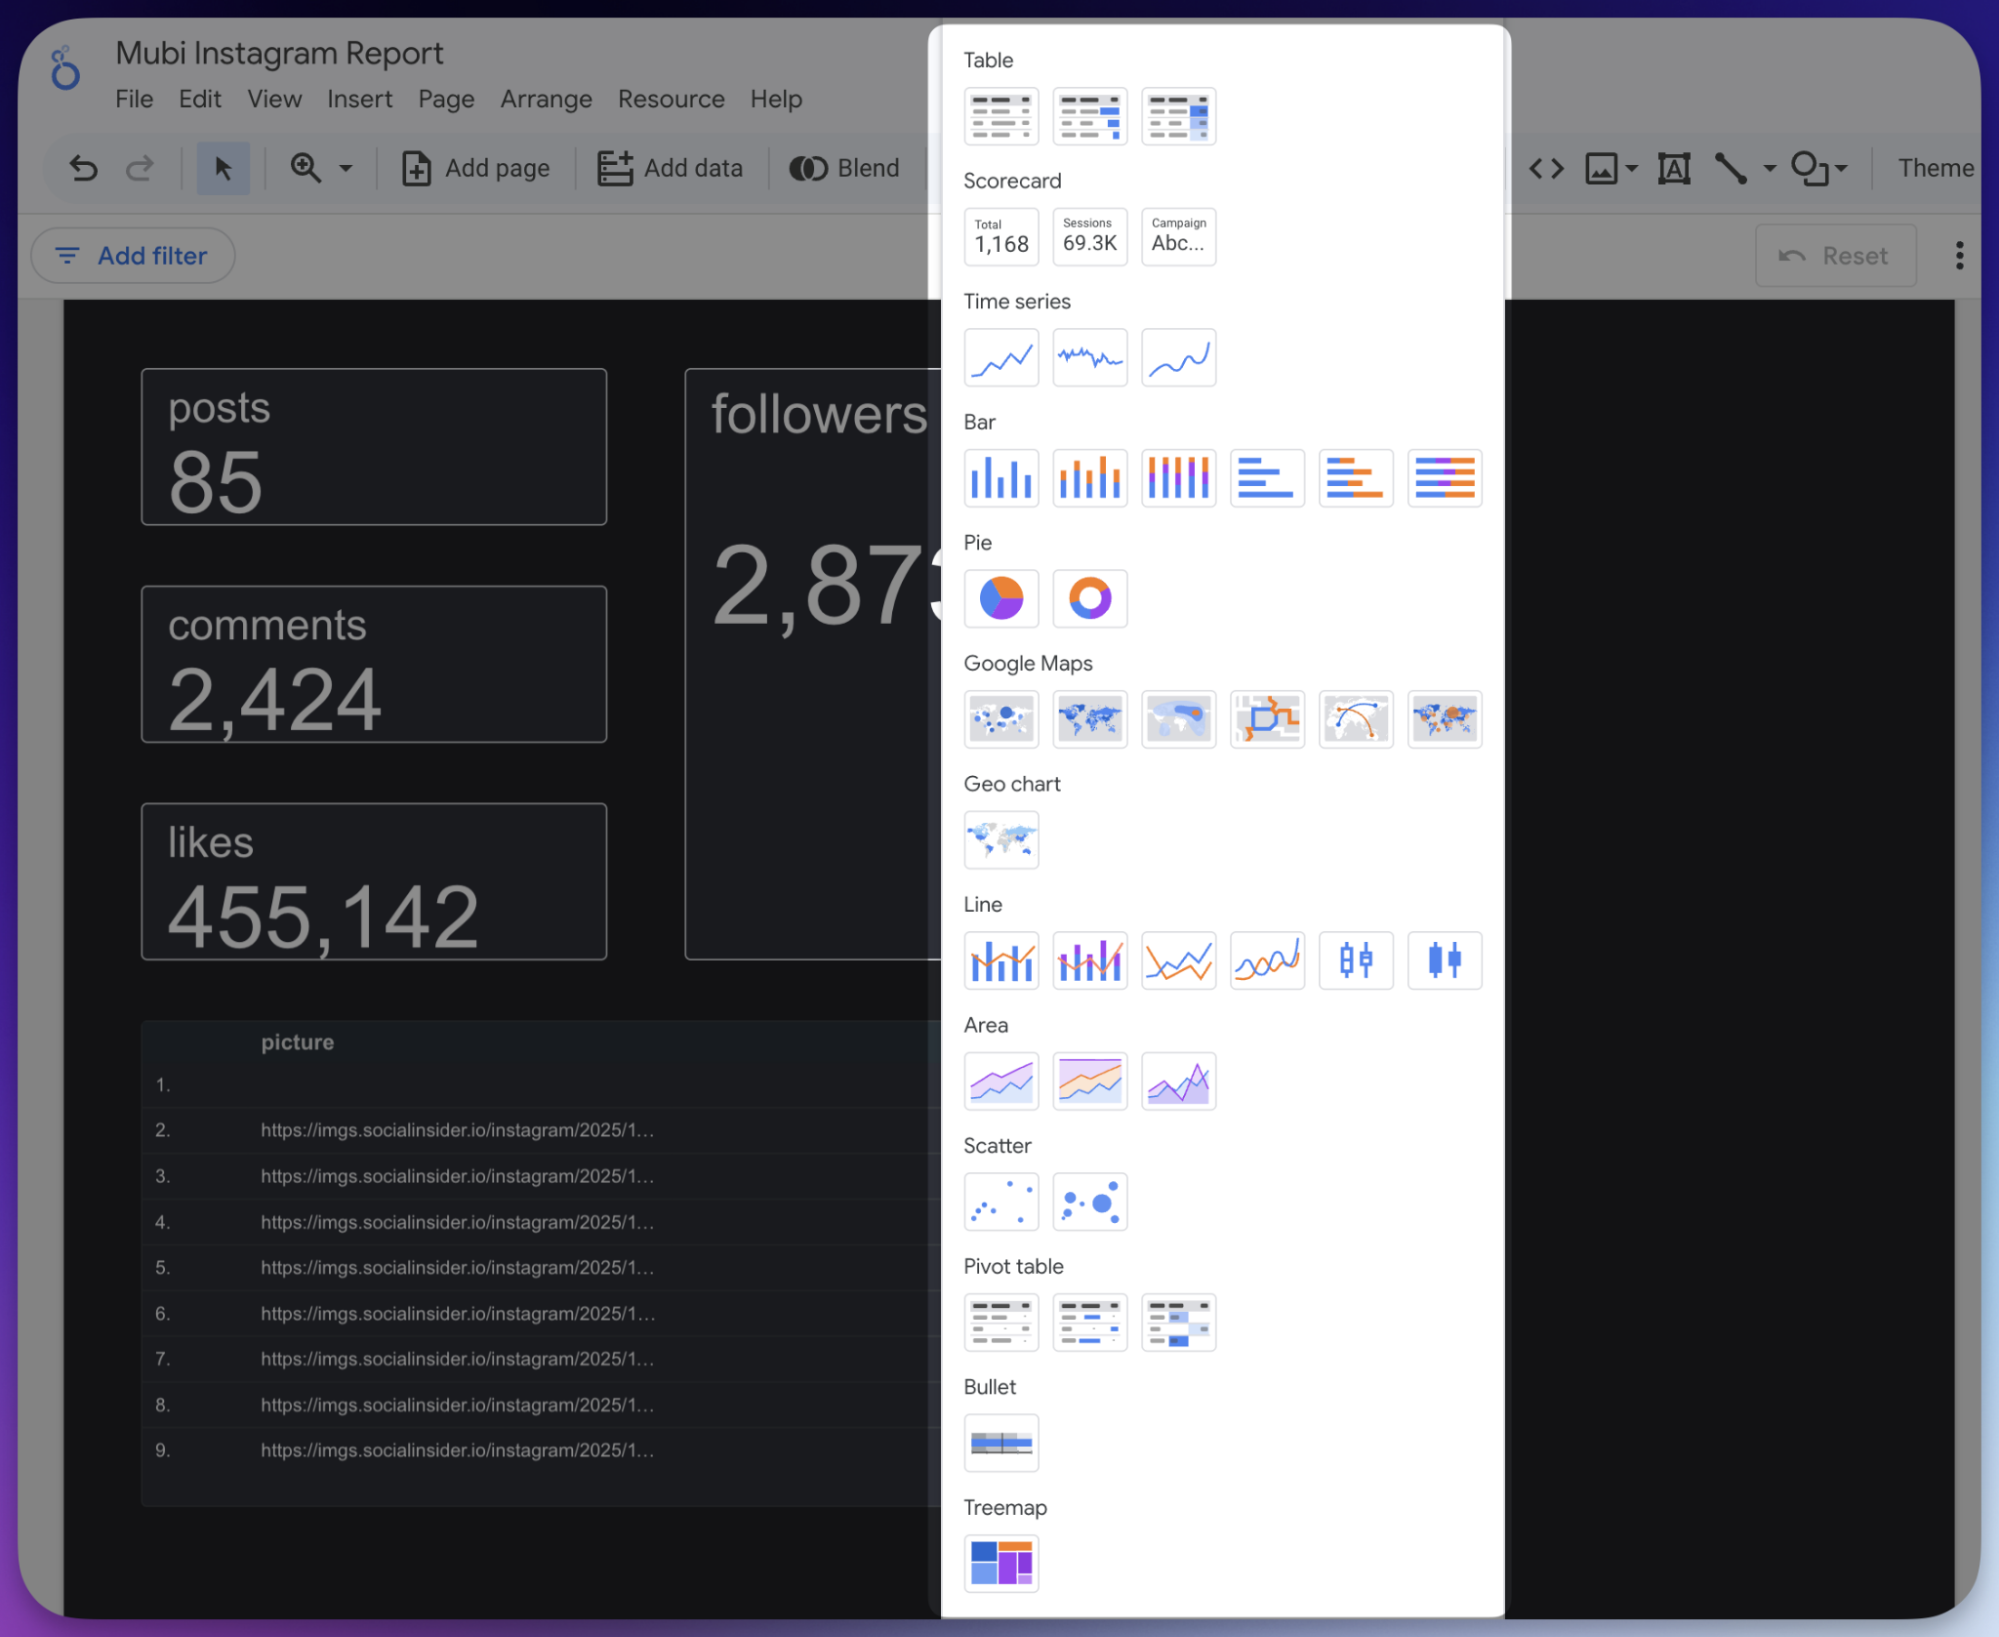
When you open Looker Studio, you’ll start with a blank canvas. This is where you begin adding the visual elements that will display your Socialinsider data.
Looker Studio offers several visualization options like charts, tables, and scorecards. I usually start by adding a few core elements that quickly show performance trends. For example:
- Scorecards for total metrics like engagement, reach, or followers
- Line charts to track engagement rate or follower growth over time
- Tables showing top-performing posts by engagement or reach
- Comparison charts to evaluate performance across platforms or competitors
Socialinsider also allows you to bring in different types of metrics such as post-level metrics, profile-level metrics, and benchmark data, which makes it easier to build both performance and competitive reports inside the same dashboard.

Set up filters
Filters are one of the features that make Looker Studio social media dashboards truly interactive. Instead of creating separate reports for every scenario, you can add filters that allow viewers to adjust the data themselves.
For example, I usually add a date range filter so the dashboard can switch between weekly, monthly, or quarterly analysis.

You can also add filters for:
- Social media platforms
- Profiles or brands
- Content pillars
- Campaigns or time periods
This makes the dashboard much more flexible. Instead of rebuilding a report, you can simply change the filter and instantly explore a different view of the data.
Build dashboards for different reporting requirements
One thing I’ve learned when building reporting dashboards is that one dashboard rarely fits every use case. Different teams and stakeholders usually need different views of the same data.
For example, you might build:
- A performance dashboard showing engagement trends and top content
- A competitive analysis dashboard comparing your brand with competitors
- A cross-platform dashboard showing how each social channel contributes to overall performance
- A client-facing report focused on high-level KPIs and growth metrics
Since Looker Studio dashboards are easy to duplicate and customize, you can quickly adapt your base dashboard for different reporting needs without starting from scratch each time.
Which kind of reports can you build with Socialinsider in Looker Studio?
Once your data is connected, you can use Looker Studio to build different types of social media reports depending on what you want to track.
I’ve found that the most useful dashboards usually focus on a specific reporting goal, whether it’s monitoring weekly performance, presenting results to clients, or tracking how a campaign is performing.
Here are a few common types of Looker Studio social media reports you can create.
- Weekly performance reports: Weekly reports help you quickly understand how your social media is performing without digging through multiple dashboards. I usually build a simple weekly dashboard with metrics like engagement rate, follower growth, posting frequency, and top-performing posts.
This type of dashboard makes it easy to spot what worked and adjust your content strategy for the following week.
- Client reporting: Instead of manually creating presentations every month, you can build a dashboard that automatically updates with the latest Socialinsider data.
For example, a client report might include high-level KPIs, platform performance comparisons, and engagement trends over time. Since the dashboard is visual and easy to share, clients can quickly understand the results without needing to go through spreadsheets or long reports.
- Campaign tracking: Campaign dashboards are useful when you want to track the performance of specific initiatives over a defined period. I usually set these up with filters so the report focuses only on posts related to a campaign.
For example, you might track engagement, reach, and content performance during a product launch or promotional campaign. By visualizing the data in one dashboard, it becomes much easier to see which content formats or platforms contributed the most to the campaign’s success.
Best practices for creating dashboards in Looker Studio
Here are some best practices I implement while creating dashboards with the Socialinsider Looker Studio integration:
- Start with the question, not the metric: Before adding charts or tables, think about the question your dashboard should answer. For example: Is engagement improving? Which platform performs best? When you start with a clear question, it becomes much easier to choose the right metrics and visualizations instead of filling the dashboard with unnecessary data.
- Avoid clutter and focus on key KPIs: It’s tempting to include every available metric, but too much data can make a dashboard harder to read. Focus on a few key KPIs that clearly show performance, such as engagement rate, reach, follower growth, or top-performing posts.
- Use consistent naming and structure: Keep metric names, chart labels, and dashboard sections consistent. For example, use the same naming format for platforms, campaigns, or content pillars across all charts. This helps viewers quickly understand the data.
- Build for decision-making. A good dashboard should help teams decide what to do next. For instance, highlighting top-performing posts or engagement trends can help identify which content formats to repeat or optimize in future campaigns.
Final thoughts
If there’s one thing I’ve learned from building social media reports, it’s that the goal isn’t collecting data. It’s about making data easier to understand and act on. That’s where combining Socialinsider with Looker Studio really helps.
You get the depth of Socialinsider’s analytics with the flexibility of a fully customizable dashboard. Once everything is connected, reporting becomes more about exploring insights than exporting data.
Over time, your dashboard turns into a living workspace where you can track performance, compare competitors, and quickly answer the questions that come up in strategy meetings. And the best part? Once the system is built, it keeps working for you.
Nidhi Parikh
Nidhi Parikh is SaaS writer that believes scrolling through social media is research for work. When not working, find her binge watching the latest series or reading anything she can get her hands on.

Analyze your competitors in seconds
Track & analyze your competitors and get top social media metrics and more!
You might also like


Improve your social media strategy with Socialinsider!
Use in-depth data to measure your social accounts’ performance, analyze competitors, and gain insights to improve your strategy.