Social Media Evaluation: A 6-Step Framework to Measure What Matters
Discover a 6-step social media evaluation framework with platform-specific benchmarks and ways to connect organic social to business outcomes.


Few marketing questions put social media leaders on the spot quite like, "So, how's social media performing?"
Suddenly, the engagement rates, reach numbers, and follower counts you've been tracking don't seem like enough to justify budget, headcount, or strategic direction.
To answer that question with confidence — and back it up in the boardroom — you need more than surface-level numbers.
You need a rigorous social media evaluation process: a structured a way to understand how effective social media marketing really is and how to connect it to the business goals leadership actually cares about.
Read on to discover the metrics, frameworks, and best practices that will help you measure what matters and make a compelling case for your social media investments.
Key takeaways
- An effective social media evaluation framework follows a structured process, impying auditing your baseline, aligning KPIs with business goals, collecting reliable data, benchmarking performance, and turning insights into actions that improve results.
- To evaluate social media performance accurately, track a balanced mix of visibility, engagement, audience quality, content effectiveness, traffic, conversion, and paid media metrics rather than relying on any single indicator.
- Social media ROI should be measured by connecting social activity to revenue and business outcomes through attribution models and value-based metrics that capture both direct conversions and long-term brand impact.
Before evaluating the data, define what success on social media looks like for your brand
One of the most common reasons social media reports fail to land with leadership is surprisingly simple: they're measuring the wrong thing.
Too often, social media teams start with the metrics and work backward.
They surface engagement rates, follower growth, impressions, and clicks — but without a clear definition of success tied to business outcomes, these numbers lack the context needed to drive decisions.
After all, is 100,000 impressions a win? Is a 5% engagement rate impressive? The answer depends entirely on what your organization is trying to achieve.
A brand expanding into a new market may prioritize visibility and recognition — for them, reach and share of voice are meaningful indicators of strategic progress.
A B2B company, on the other hand, may be less concerned with likes and more focused on whether social media is generating pipeline.
Meanwhile, a mature brand might weigh customer retention, community engagement, and long-term loyalty as primary success indicators.
That's why evaluating social media effectiveness starts long before you open an analytics dashboard. It begins with aligning on the business outcome you're trying to influence — ideally in collaboration with the wider marketing or leadership team.
So before analyzing performance, make sure you're matching your metrics to your primary business objective:
- Brand awareness: reach, impressions, share of voice, audience growth
- Lead generation: click-through rate, conversions, cost per lead, lead quality
- Sales: revenue, conversion rate, return on ad spend (ROAS)
- Customer retention: engagement rate, repeat purchases, customer lifetime value
- Community building: comments, shares, mentions, sentiment, active followers
The key is simple: don't judge awareness campaigns by sales metrics or lead-generation campaigns by reach alone. Success looks different for every goal — and the strongest social media leaders are the ones who make that distinction explicit before reporting begins.
A 6-step social media evaluation framework that will help you understand this medium’s impact on your brand
Social media generates no shortage of metrics.
The challenge, for anyone responsible for reporting upward, is knowing which ones deserve attention and what they actually tell you about business performance.
To make sense of the data, you need a clear evaluation process — one that scales with the complexity of your strategy and holds up under executive scrutiny.
The six steps below will help you approach social media measurement more strategically, turning scattered metrics into a coherent narrative that's easier to act on and easier to present to leadership.
Along the way, you'll also find social media reporting best practices that make your findings clearer, more credible, and more impactful across stakeholder groups.
Step 1: Audit your current baseline
It's tempting to jump straight into performance metrics.
But without a starting point, even the best data can be misleading.
So before evaluating what's working, take stock of where your brand stands today.
A brand audit helps you establish that baseline.
Look at your audience growth, engagement, reach, traffic, conversions, and content performance across platforms. Pay attention to patterns: which content consistently resonates, which channels drive meaningful results, and where are you underperforming?
The goal is to create a clear reference point. After all, you can't measure progress if you don't know where you started.
Step 2: Define your KPIs by goal and platform
A dashboard packed with metrics can create the illusion of rigor while making it harder to identify what's actually driving brand performance.
The most useful KPIs are the ones that reflect how your audience behaves on each platform — and map directly to the outcomes your organization has committed to.
Audiences come to LinkedIn to learn, network, and discover professional expertise. This makes metrics such as engagement quality, profile views, follower growth among target audiences, and lead generation particularly valuable.
On Instagram, saves, shares, reach, and website clicks often reveal whether content is capturing attention and driving interest.
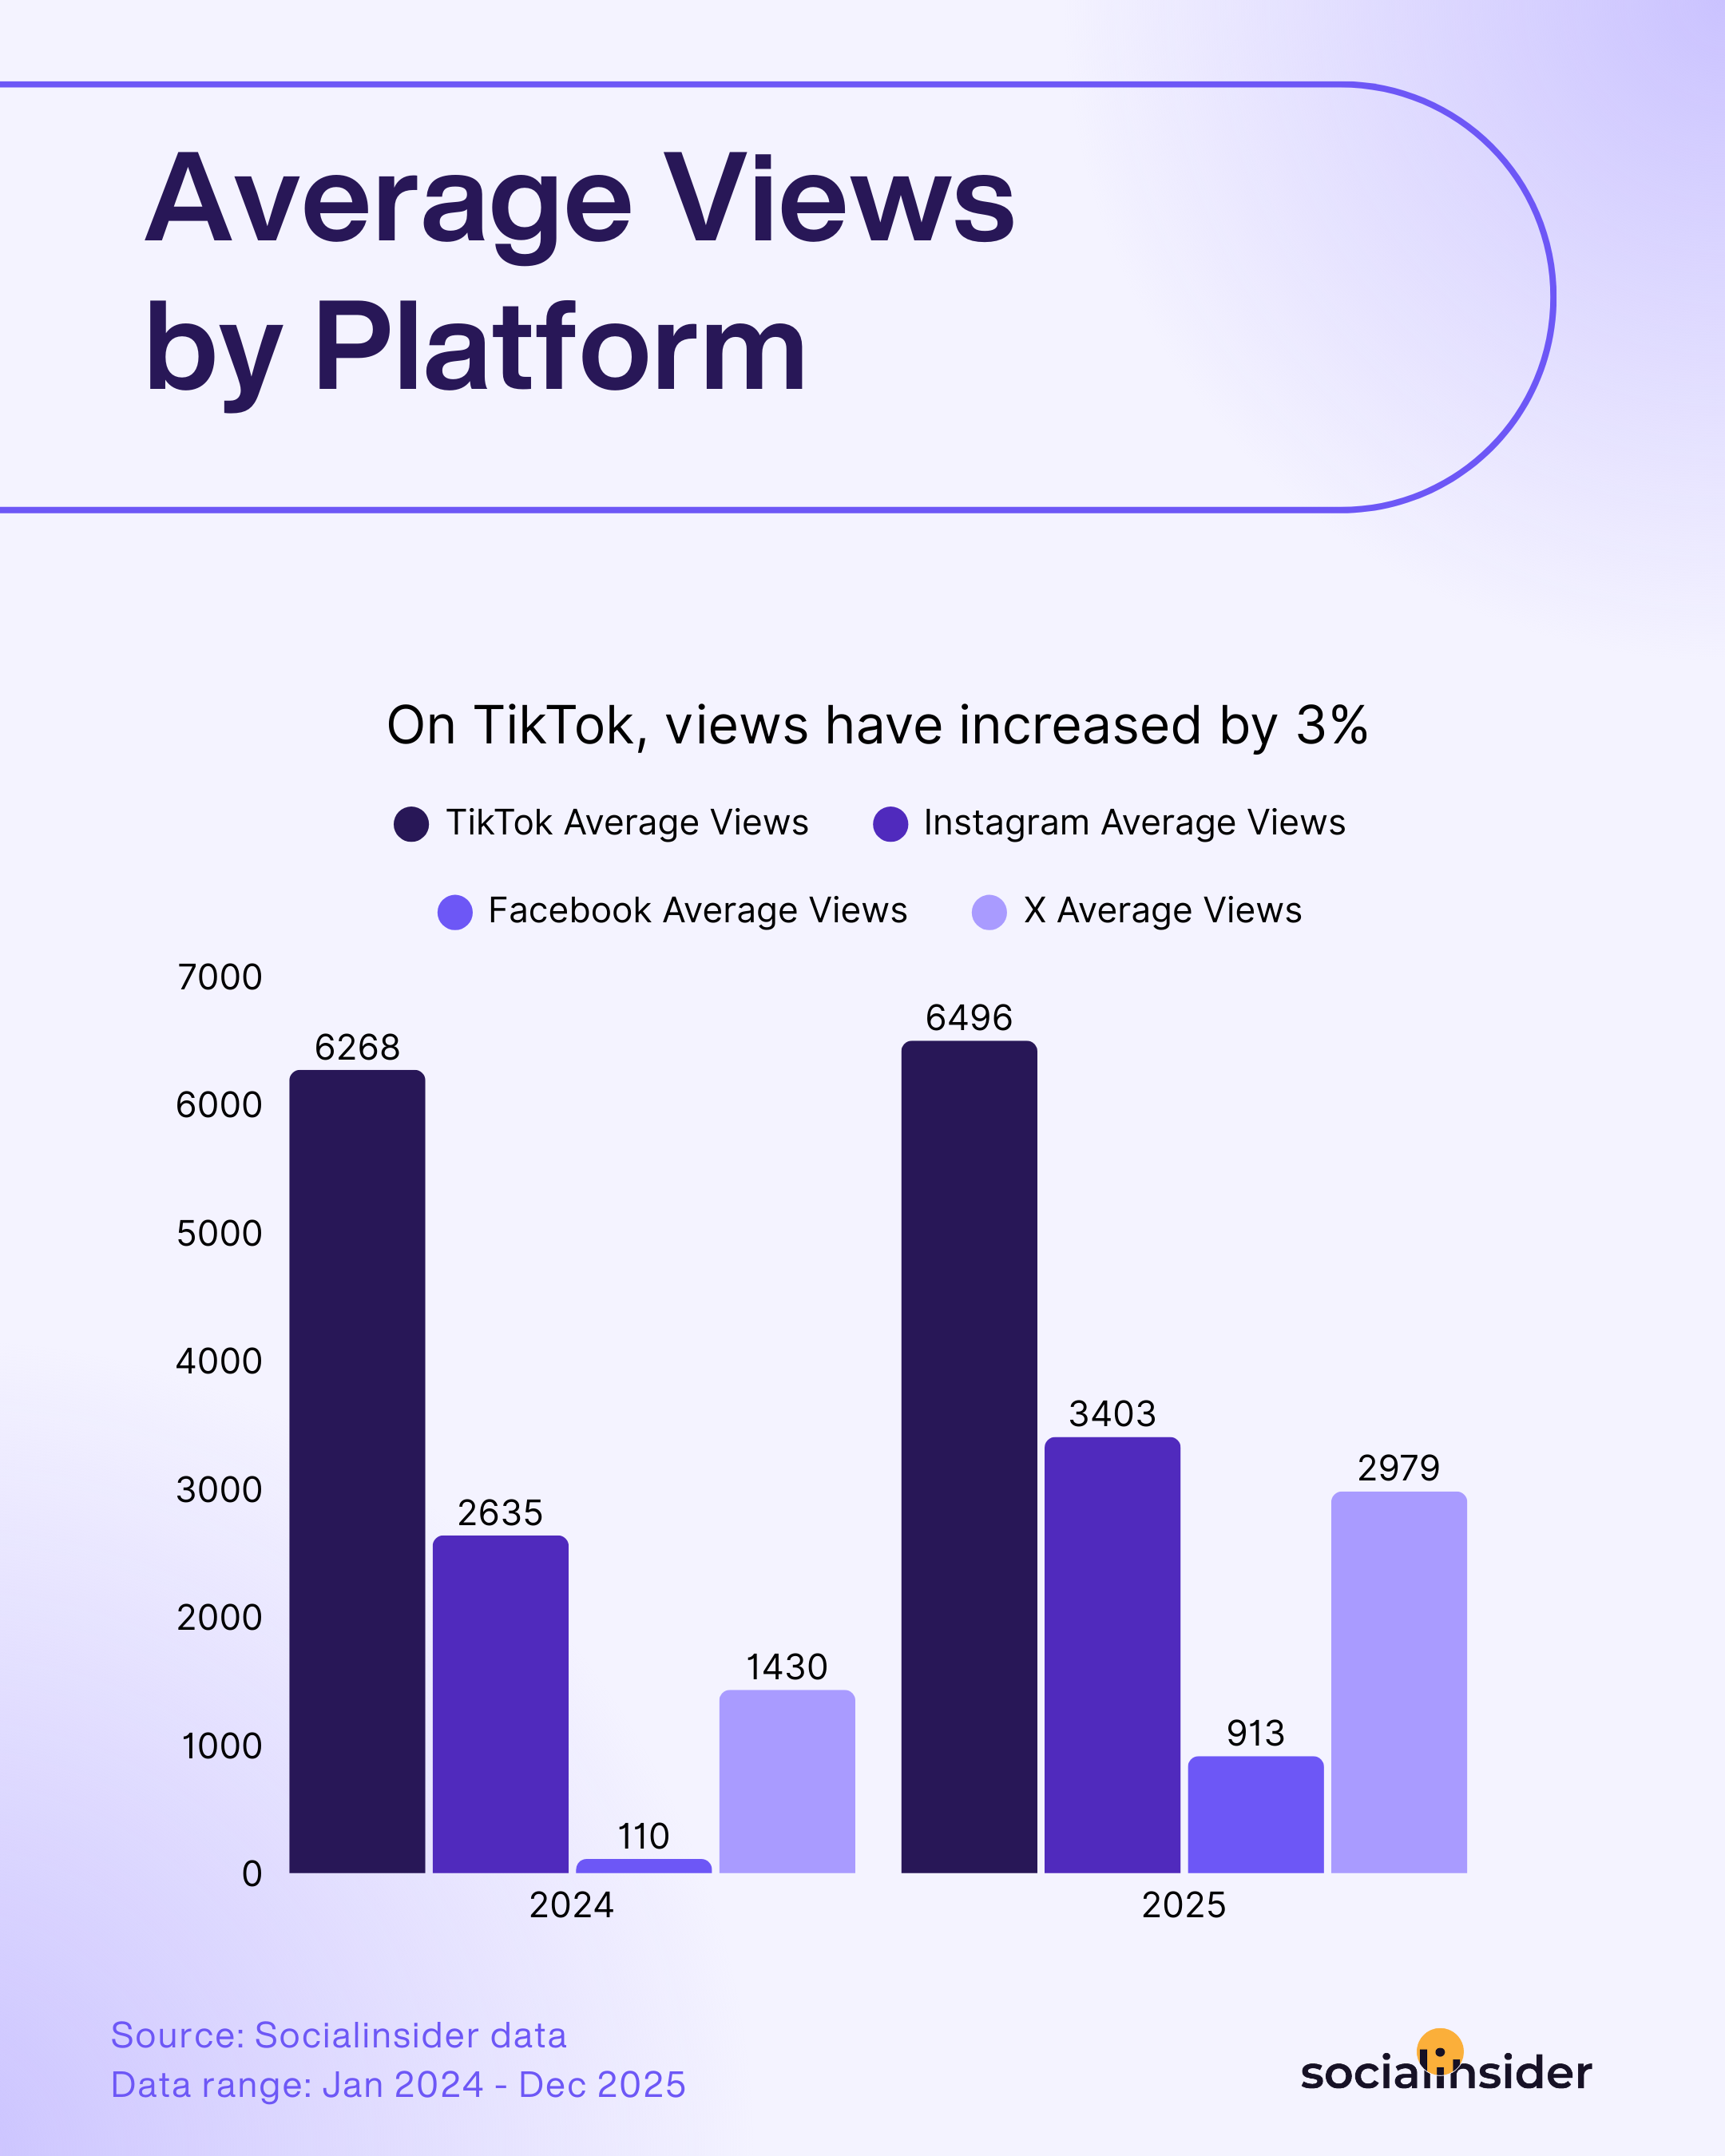
On TikTok, watch time, completion rate, and shares can tell you far more about content performance than follower growth alone.
The same principle applies to your goals.
A campaign designed to increase brand awareness should be evaluated differently from one focused on driving leads or sales.
And when building out your measurement framework, every KPI should answer a specific question about performance. Otherwise, it becomes noise in a report rather than a signal that leadership can act on.
Step 3: Select your data sources (native analytics vs. third-party tools)
Before drawing conclusions from your data, take a moment to consider where that data is coming from.
Native analytics tools excel at platform-level analysis.
They provide valuable audience insights, content performance metrics, and engagement data that help explain how people interact with your brand on a specific channel.
For understanding audience behavior and content performance, they're often the most reliable source available.
As your evaluation becomes more sophisticated, however, their limitations become harder to ignore.
Historical data may be restricted, cross-platform analysis can be time-consuming, and identifying broader performance trends often requires manually combining information from multiple sources.
Third-party social media analytics tools solve this by centralizing data across channels — giving social media teams a single source of truth for trend analysis, competitor benchmarking, historical reporting, and cross-platform comparisons.
The strongest evaluation frameworks don't treat native and third-party analytics as competing options. They use each for what it does best — native tools for granular, platform-specific behavior; third-party tools like Socialinsider for the cross-channel visibility that strategic reporting demands.
Step 4: Gather and clean your data
At this stage, it can be tempting to dive straight into social media analysis.
Resist that urge. Even the most sophisticated evaluation framework will produce unreliable insights if the underlying data is incomplete or inconsistent.
Start by collecting data from all relevant sources and ensuring you're comparing like with like.
Check that reporting periods are aligned, duplicate data has been removed, and brand metrics are defined consistently across platforms.
A month-over-month comparison, for example, becomes far less meaningful if one platform includes paid results while another only reports organic performance.
This step is also a good opportunity to identify anomalies. A sudden spike in engagement might be the result of a viral post, a paid campaign, or a reporting error. Without proper context, all three can look surprisingly similar in a dashboard.
Think of data cleaning as quality control. The more accurate and organized your data is before analysis begins, the more confidence you'll have in the conclusions you draw later.
Step 5: Analyze, benchmark, and draw conclusions
By now, you've collected your social media metrics, aligned them with your goals, and organized your data.
The next step is interpreting what it all means.
Look for trends, outliers, and recurring patterns. Which content themes consistently drive engagement? Which channels contribute most to your objectives? And where are you seeing momentum?
I find that social media analysis becomes much easier when you can view performance from multiple angles.
This is why I often turn to Socialinsider.
Depending on the question I'm trying to answer, I might analyze a single channel, compare performance across platforms, or look at several brands side by side.
For example, when evaluating competitors, Socialinsider's benchmarking dashboards make it easy to compare audience growth, engagement, reach, and content performance within the same view.

That perspective is valuable because strong performance isn't always obvious.
One brand may be growing its audience faster, while another is generating significantly higher engagement with a smaller community. Looking beyond your own data often reveals opportunities that would otherwise go unnoticed.
The same principle applies to channel-level analysis. Socialinsider's cross-platform reporting allows you to see how content performs across networks, making it easier to understand where your audience is most receptive and where your strategy is generating the strongest return.
Once you've done your social media competitor analysis, the final layer of analysis is benchmarking.
Benchmarks provide the context needed to determine whether your results are genuinely strong or simply average.
Direct competitive benchmarking helps you understand your position within your market, while industry benchmarks reveal broader trends that may be influencing performance across the board.
A decline in engagement, for example, may signal a problem with your content.
That's why I rarely evaluate metrics without a benchmark attached to them.
Socialinsider's social media benchmarks reports provide industry-specific performance data across major social networks, helping you understand what "good" actually looks like for your niche.
This way, you can develop a clearer understanding of where your competitive advantages lie and which opportunities deserve your attention next.
Step 6: Turn insights into actions
This is where many evaluation processes quietly break down.
Teams spend weeks collecting data, building dashboards, and presenting findings, only to move on to the next campaign without changing anything.
As a result, the same mistakes get repeated and the same opportunities go unnoticed.
Every insight should lead to a decision.
If video content consistently outperforms static posts, adjust your content mix. If a particular audience segment engages more frequently, consider creating content specifically for them. If one platform generates strong awareness but few conversions, revisit its role within your broader strategy.
Ultimately, the goal of a social media evaluation process is not just to report on what happened — it's to make the next strategic decision smarter than the last one.
Key data points will help you effectively evaluate your social media performance
Evaluating social media performance at a strategic level means looking beyond any single metric and understanding how different data points interact.
Here are the metrics that matter most, and what they actually tell you about your brand's performance and competitive position:
Reach & visibility
Reach measures the number of unique users exposed to your content, while views reveal how often that content was consumed.
Together, they provide insight into your brand's ability to capture attention and maintain a presence in crowded social feeds.
At a broader level, share of voice helps answer how visible your brand is compared to competitors. A growing share of voice often signals increasing brand awareness and market presence, making it a valuable metric for brands focused on visibility and positioning.
Within Socialinsider, you can track reach trends over time, measure average reach, analyze reach rates relative to your audience size, and identify which content formats generate the greatest visibility.

In the example above, it's immediately clear that Reels generate substantially more reach than carousels or static images. Insights like these help explain where visibility is coming from and can inform future content and distribution decisions.
Engagement rate
Engagement rate is often considered one of the strongest indicators of content relevance.
A high engagement rate suggests your content is resonating with the audience it reaches, while a declining rate can signal content fatigue, audience misalignment, or increased competition for attention.
One detail that often gets overlooked is that there isn't a single way to calculate engagement rate. Different formulas answer different questions:
- Engagement rate by followers measures engagement relative to your audience size and is useful for assessing community engagement.
- Engagement rate by reach measures engagement among people who actually saw the content, making it particularly valuable for evaluating content effectiveness.
- Engagement rate by views focuses on those who consumed the content and is especially helpful when analyzing video performance.
This distinction matters because the same post can produce very different results depending on the formula used. A campaign may generate strong engagement among viewers while appearing less impressive when measured against your total follower count.
Socialinsider helps eliminate that ambiguity by providing multiple engagement-rate calculations within the same dashboard, allowing you to analyze performance from different perspectives.

Looking at engagement through several lenses often leads to richer insights.
Rather than asking whether engagement is "good" or "bad," you can better understand how effectively your content is converting visibility into meaningful audience interactions.
Audience quality
A growing audience is encouraging, but growth alone doesn't tell you whether you're attracting the right people.
Audience quality looks beyond follower counts to evaluate whether your social media presence is reaching people who are genuinely relevant to your brand.
Depending on your goals, this may involve analyzing audience demographics such as location, age, language, industry, job title, or other characteristics that indicate alignment with your target market.
Follower growth is another important piece of the puzzle.
While sudden spikes can be exciting, sustainable growth often tells a more meaningful story about brand awareness and content relevance. Consistent audience growth suggests that your content is attracting new users and giving them a reason to stay connected with your brand.
In this sense, our guide on how to calculate follower growth breaks down the most common formulas and benchmarks.

Within Socialinsider, social media audience analysis combines both perspectives.
You can monitor follower growth over time, identify periods of accelerated or declining growth, and evaluate growth rates alongside your overall audience size.
Viewed together, these metrics provide a clearer picture of audience quality than follower count alone.
Content performance metrics
Every brand has content it keeps producing because it feels important. Then there's the content the audience actually cares about.
The gap between those two things is often where the most valuable insights are hiding.
When evaluating content performance, don't limit yourself to identifying the post with the highest engagement. One standout post can be the result of timing, luck, or a temporary trend.
What's more useful is finding patterns: which formats consistently outperform others, which topics repeatedly spark conversations, or which content themes generate engagement regardless of when they're published.
In this sense, analyzing content pillars for social media becomes particularly useful.

In the example above, the difference between content categories is impossible to ignore. Fitness Challenges & Events and Nutrition & Healthy Habits generate significantly more engagement than the remaining pillars, despite not necessarily accounting for the majority of published content.
Insights like these help you decide where you should invest your next campaign budget.
Thus, the best-performing content isn't always the content that gets the most attention once. It's the content that continues delivering results over time.
Conversion & traffic metrics
Social media platforms are designed to keep users scrolling. Every click away from the feed is a small win.
That's why traffic metrics deserve special attention. Unlike likes or views, they reflect a conscious decision to learn more about your brand, product, or offer.
Link clicks show how often your content sparks enough interest to drive action, while click-through rate (CTR) helps you understand how persuasive that content is relative to the number of people who saw it.
Website sessions from social media add another layer of insight by revealing which platforms are attracting visitors.
Taken together, these metrics help you see if people are simply interacting with your content, or are they interested enough to continue the relationship beyond social media?
Paid performance metrics
Paid and organic content may appear in the same feed, but they shouldn't be evaluated by the same standards.
Organic content is often measured by its ability to build awareness, engagement, and community over time.
Paid campaigns, on the other hand, are typically tied to specific business outcomes and budgets, making efficiency metrics far more important.
That's where metrics such as ROAS (Return on Ad Spend), CPC (Cost per Click), CPM (Cost per Mille), and CPE (Cost per Engagement) come into play. Together, they show how much value you are generating for every dollar spent.
A campaign may deliver impressive reach, but if the cost of acquiring traffic or conversions is too high, its impact on the business becomes harder to justify.
Conversely, a campaign with modest engagement can still be highly successful if it drives revenue efficiently.
For this reason, I recommend evaluating paid and organic performance separately before looking at the bigger picture. Combining the two too early can mask important insights and make it difficult to understand what's driving results.
Platform-by-platform performance benchmarks for effective social media results evaluation
A strong engagement rate on LinkedIn may be average on Instagram. Likewise, reach, views, and follower growth can vary significantly from one platform to another.
That's why assessing the results of social media marketing requires platform-specific benchmarks.
So before drawing conclusions about performance, it's important to understand what success looks like on each network.
Instagram remains one of the most competitive social platforms for brands, making benchmarks essential for understanding whether your performance is truly above average.
The latest Instagram benchmarks report by Socialinsider reveal notable shifts in both audience growth and content engagement:
Audience growth benchmarks
Instagram audience growth declined across all account sizes in 2025.
Smaller accounts continued to grow faster, averaging 22% growth for profiles with 1K–5K followers, while accounts with 100K–1M followers averaged 11.25%.
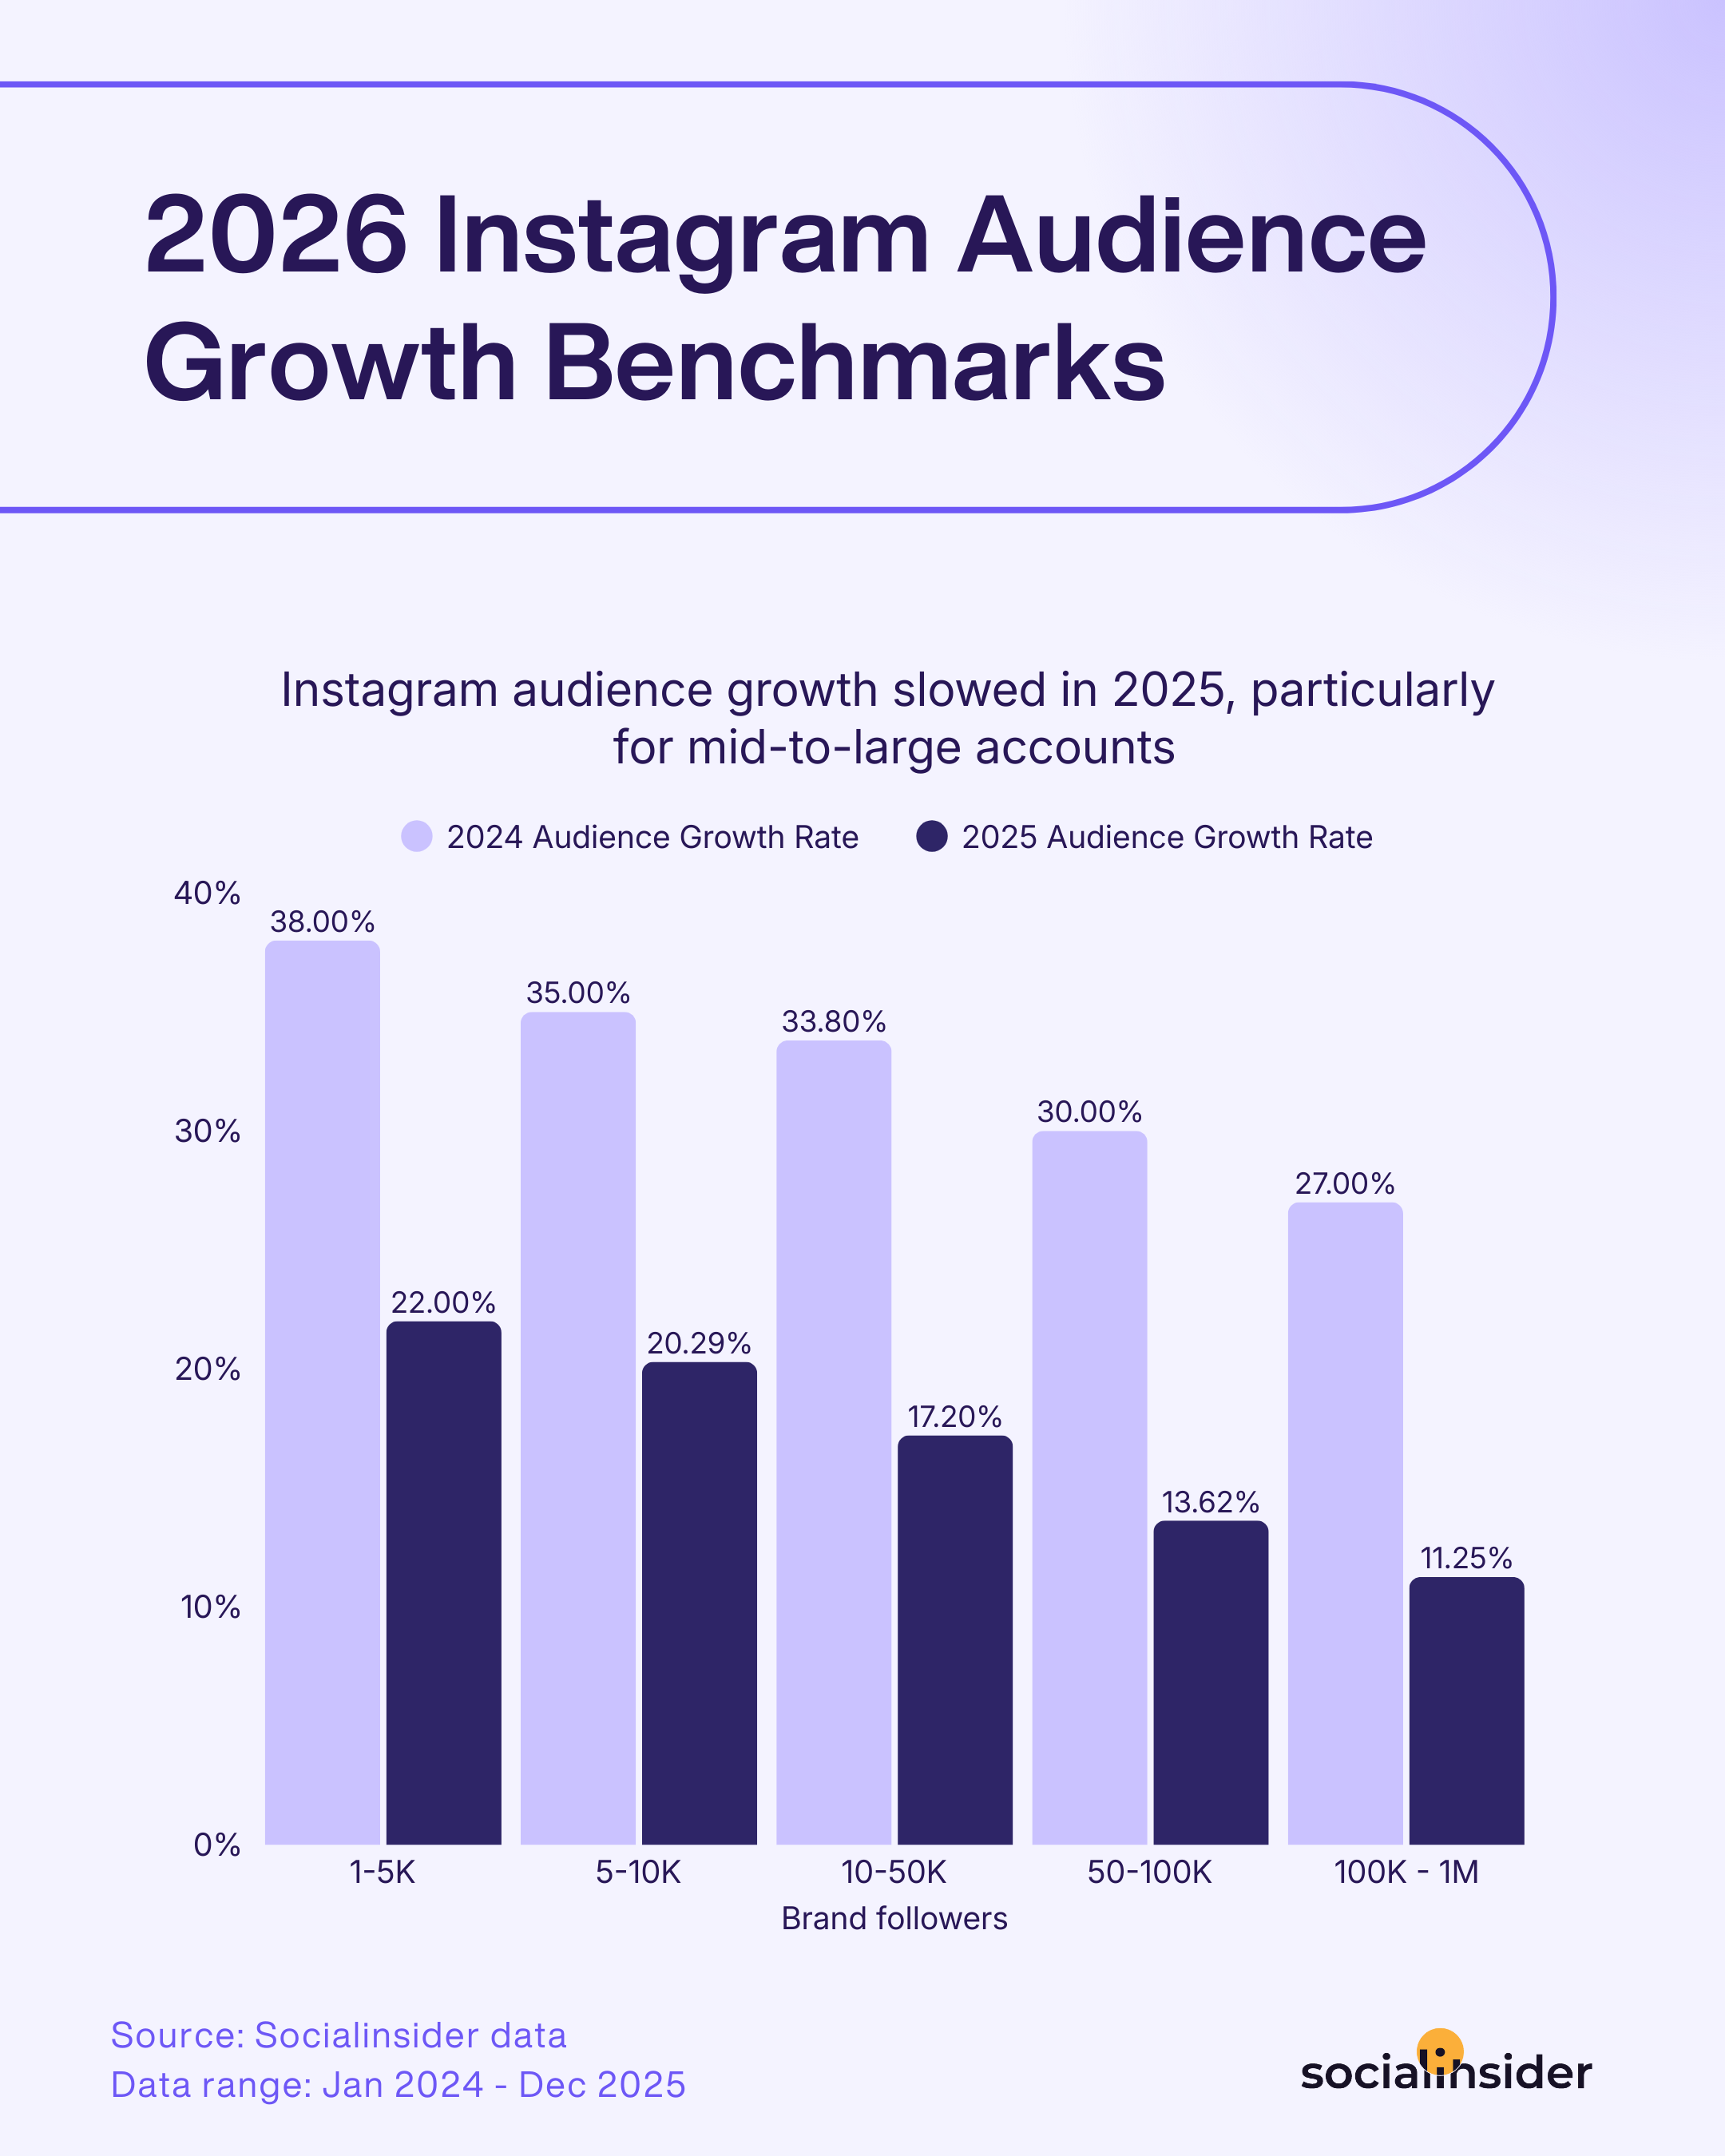
The data highlights a broader trend: audience growth becomes more challenging as accounts scale.
Engagement rate benchmarks
Carousels remain Instagram's most engaging content format, with an average engagement rate of 0.55%. Reels follow closely at 0.52%, while image posts average 0.37% engagement.
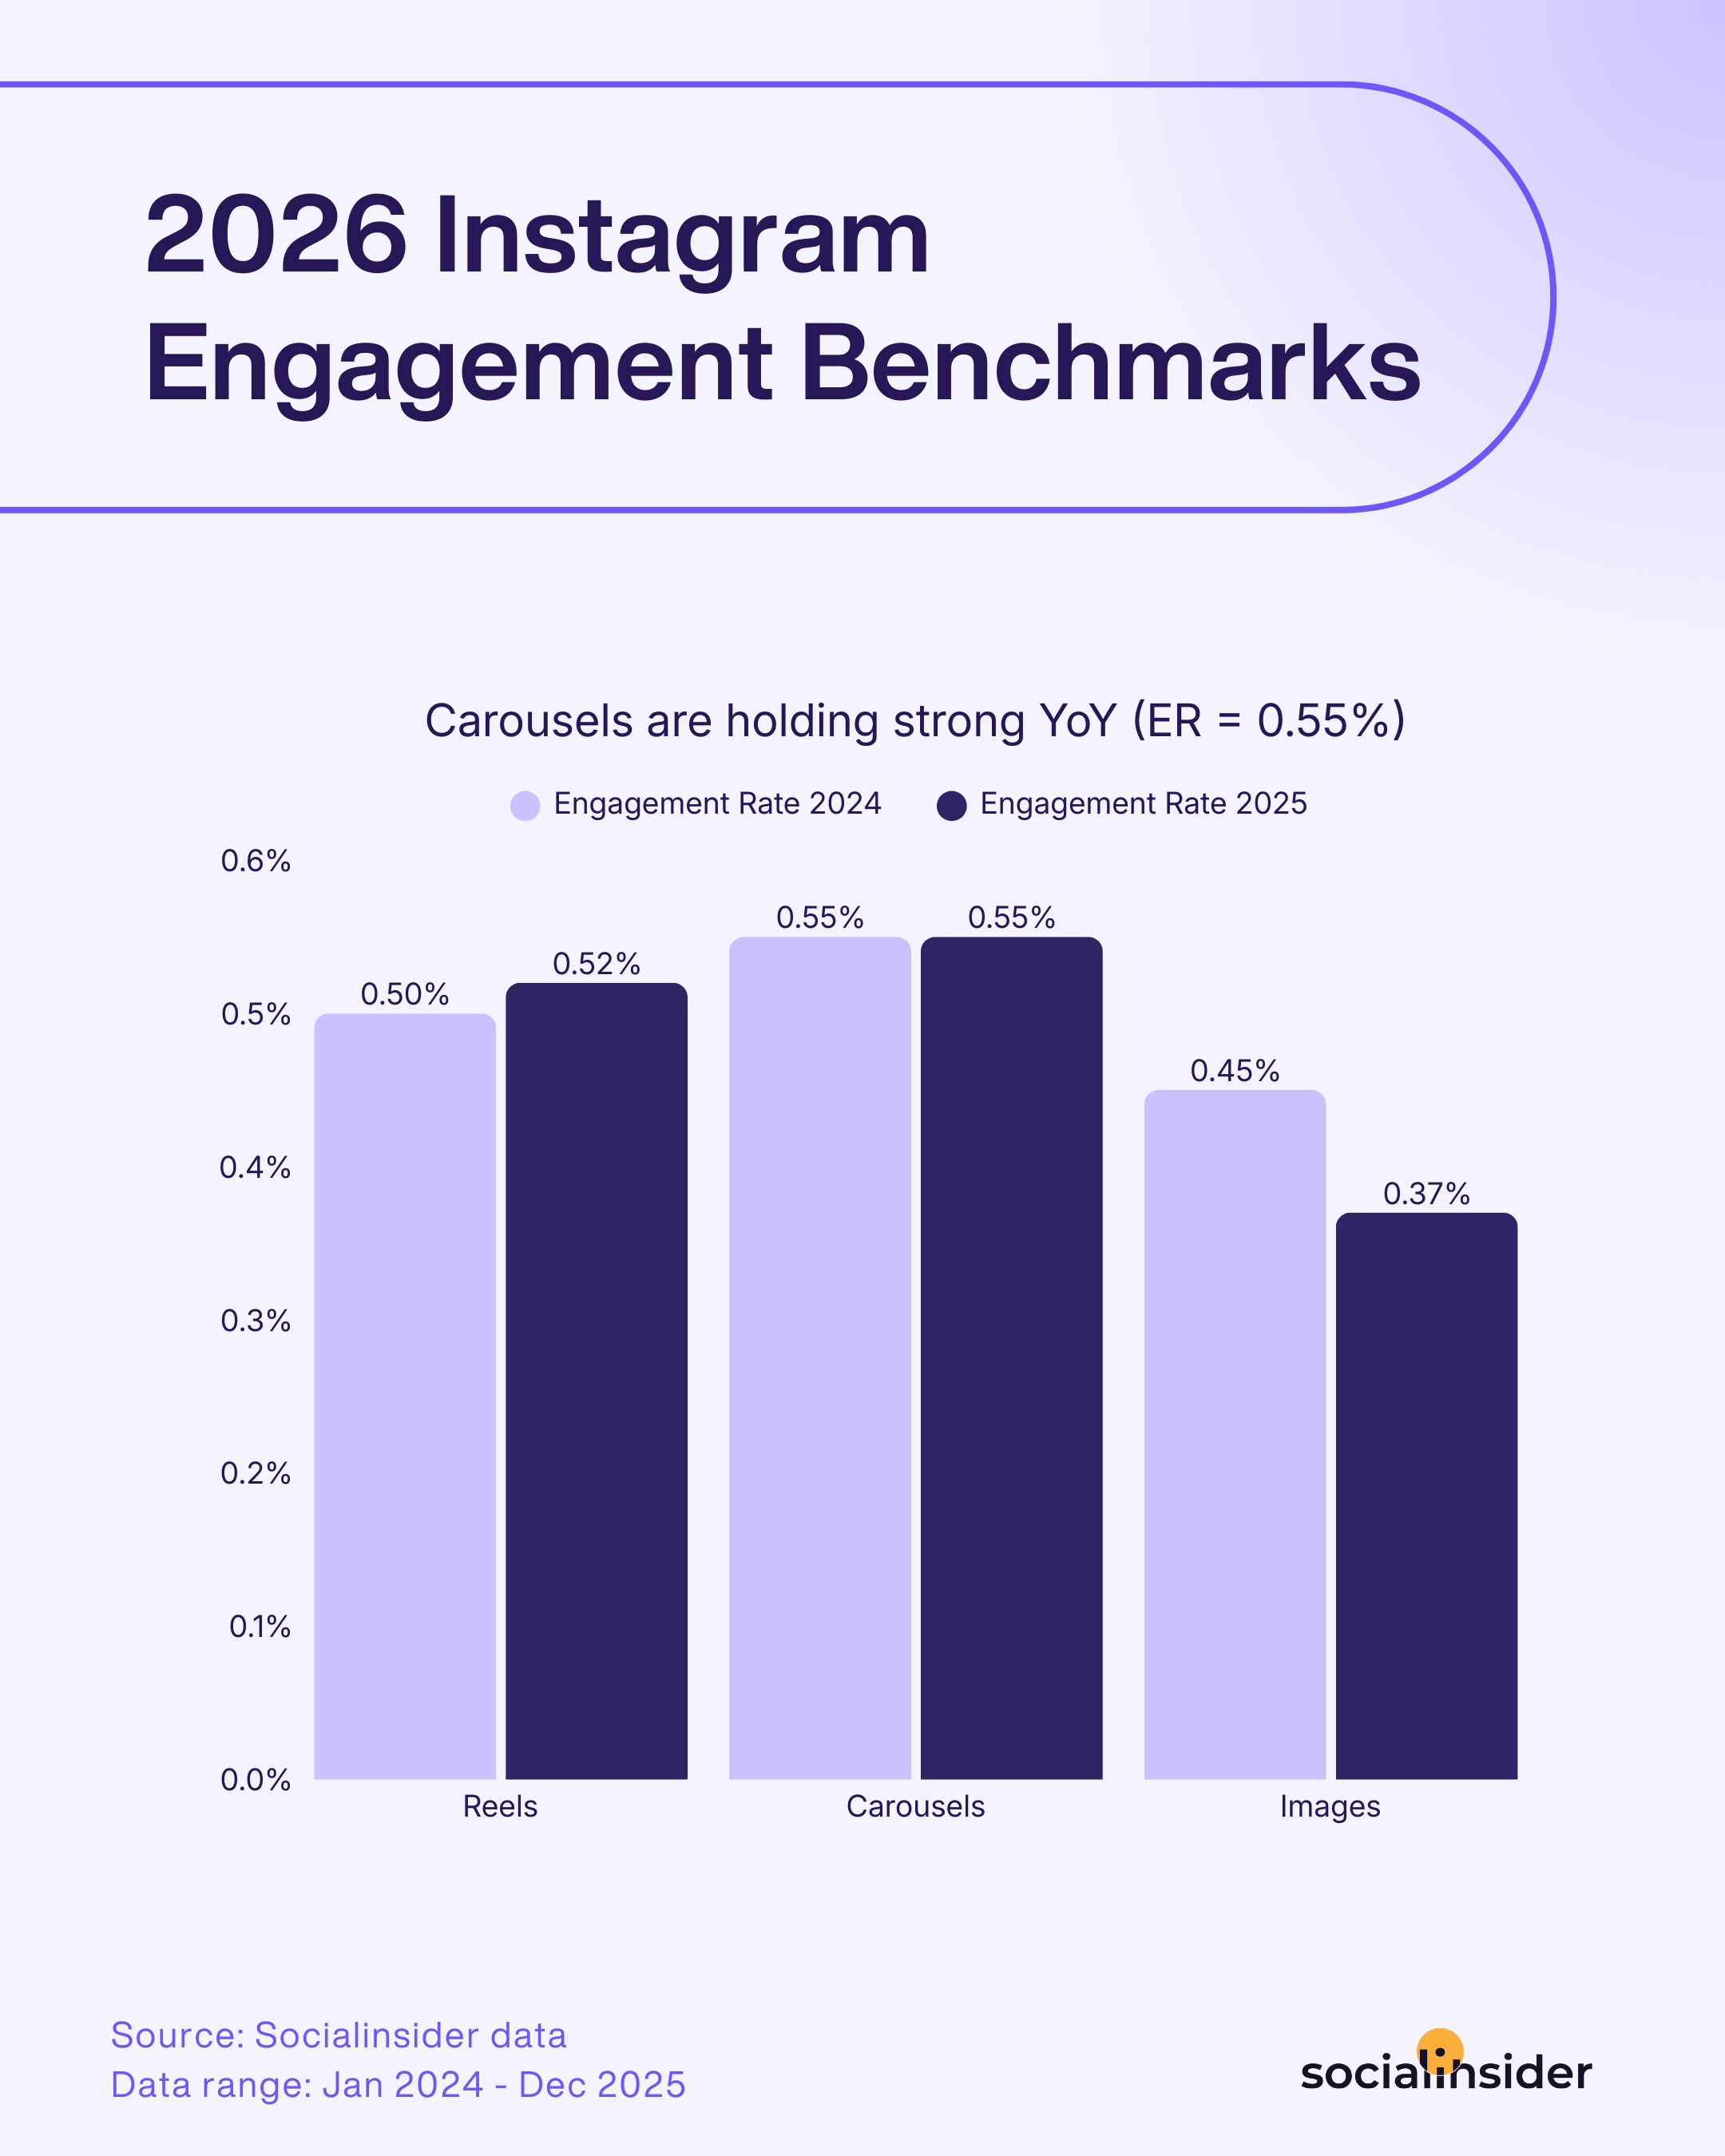
While Reels continue to dominate reach, carousels remain the strongest choice for driving engagement.
Facebook may not generate the same level of buzz as newer platforms, but it continues to deliver strong results for brands focused on community building, reach, and audience growth.
The latest Facebook benchmarks report by Socialinsider reveals some interesting shifts in how audiences engage with content and how pages are growing:
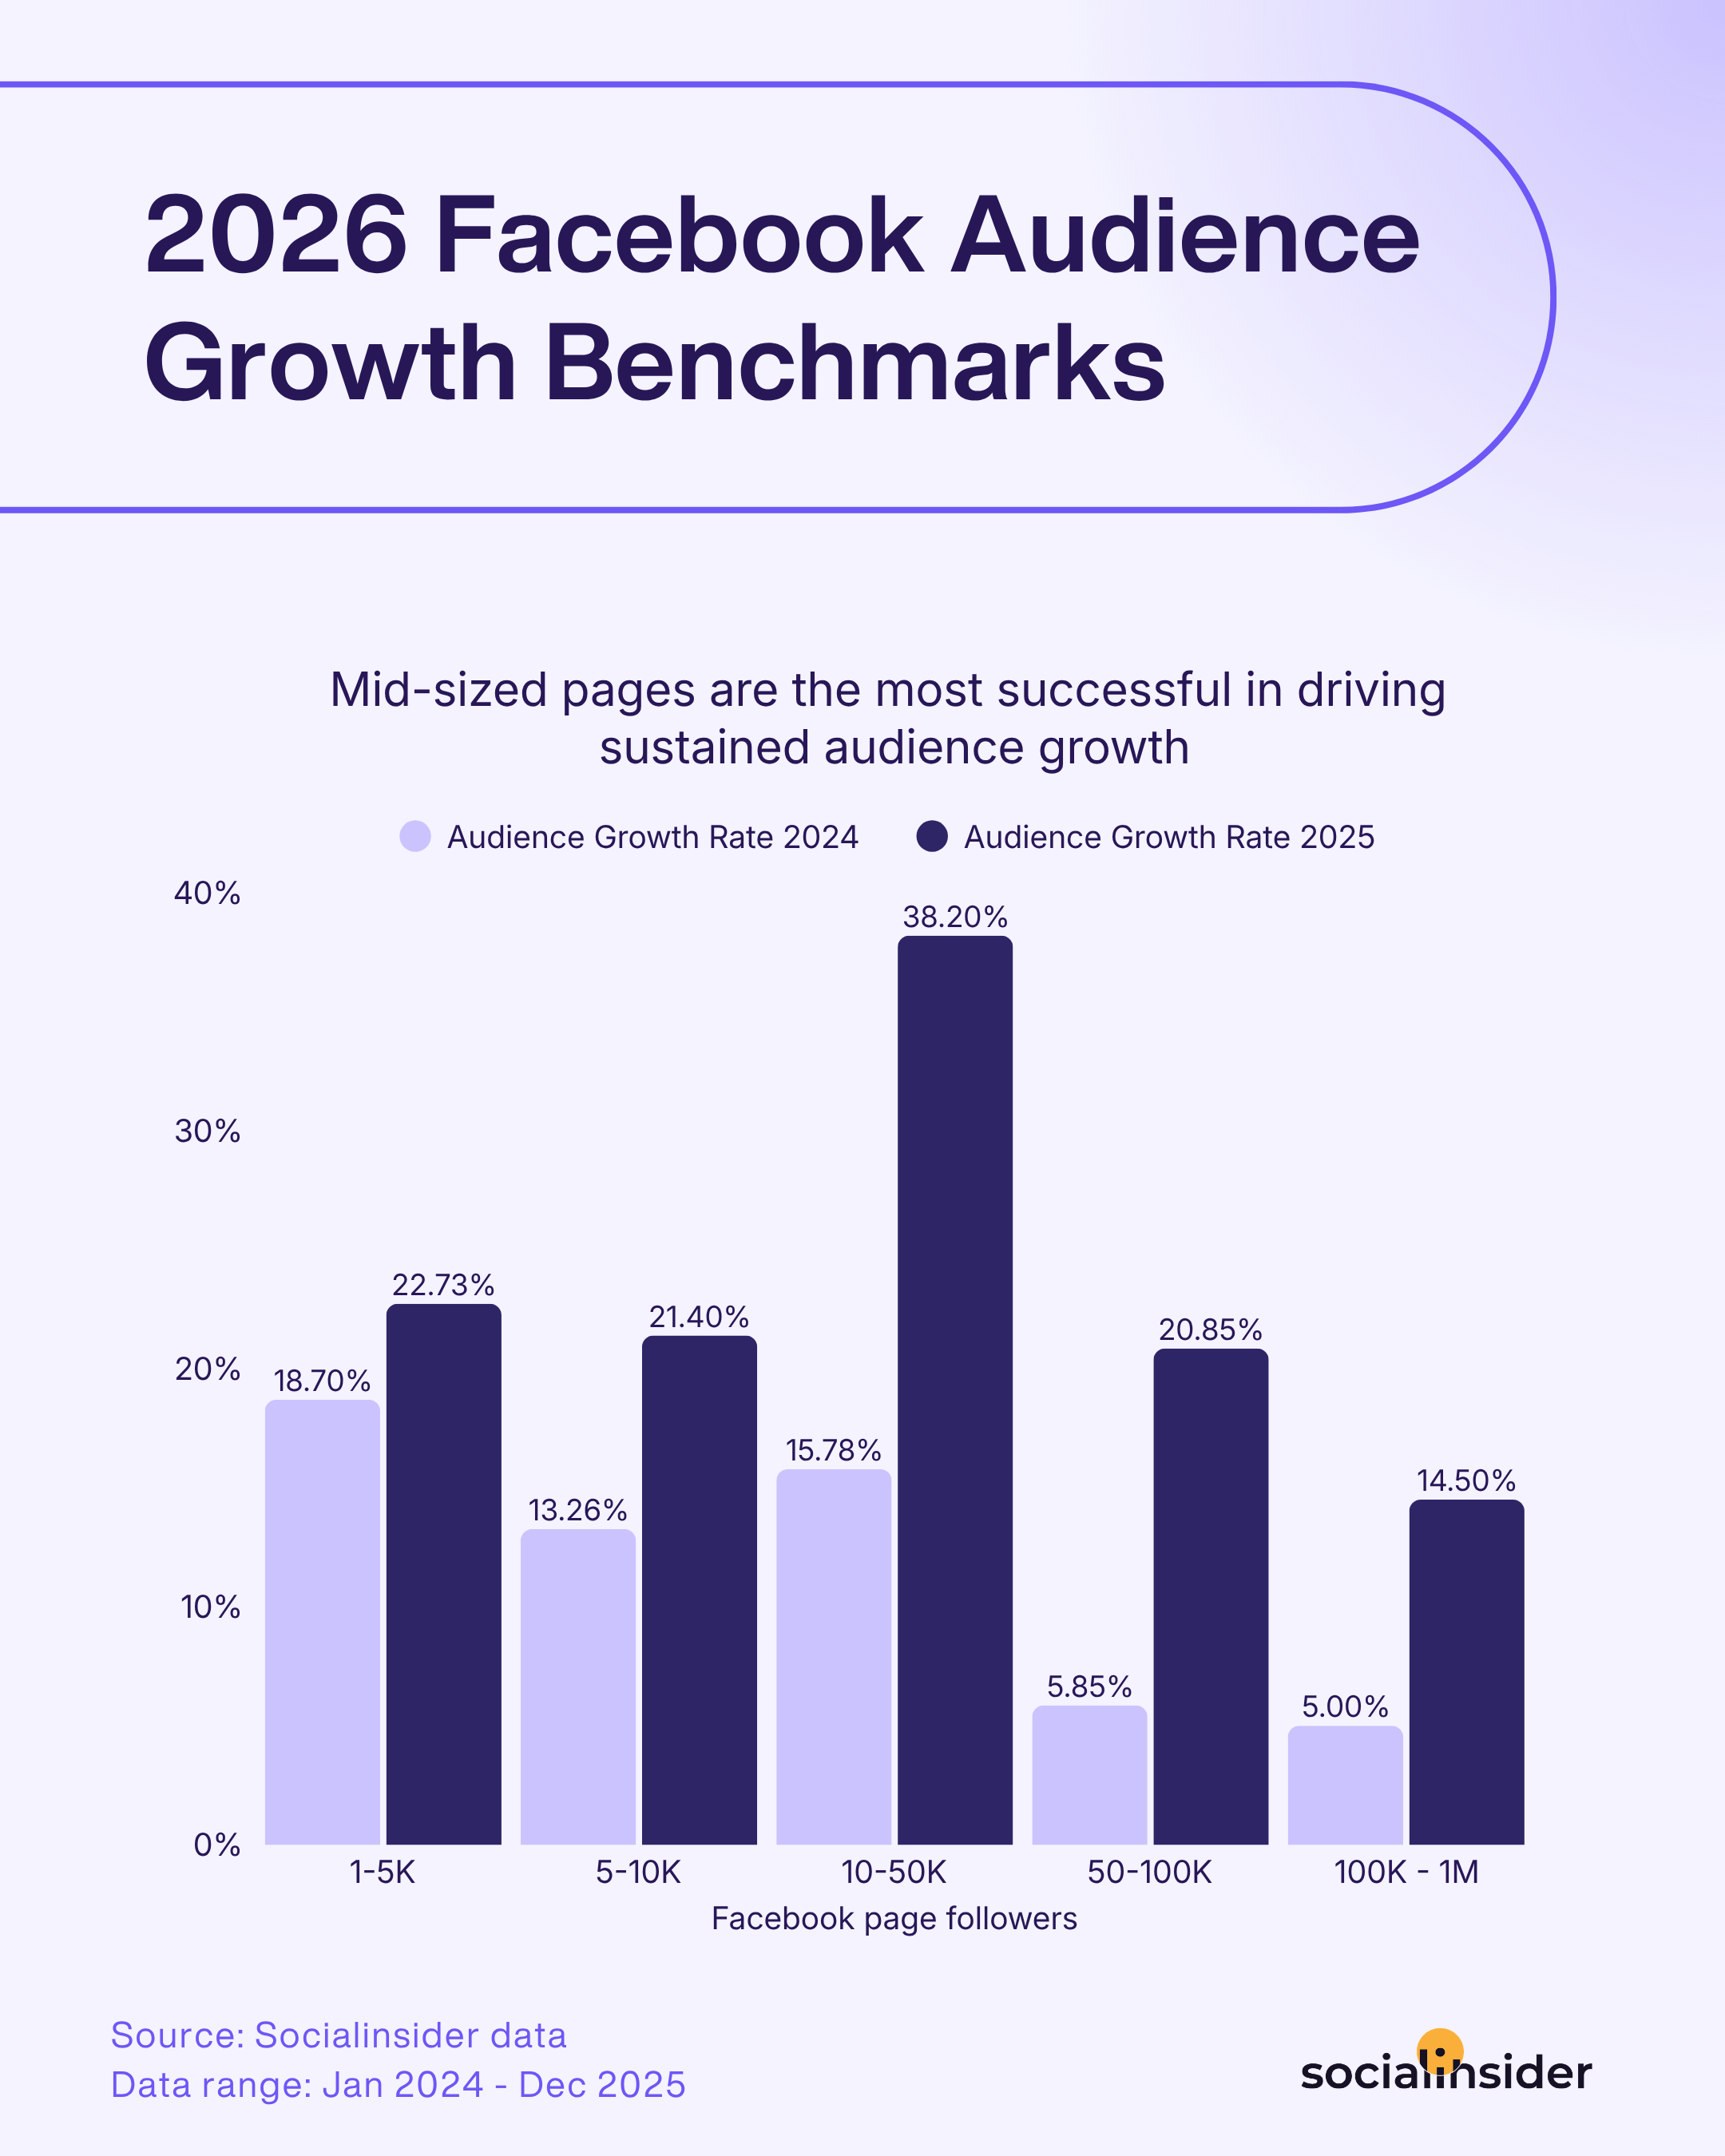
Audience growth benchmarks
Facebook audience growth increased across all page sizes in 2025, with mid-sized pages seeing the strongest results.
Pages with 10K–50K followers achieved an average growth rate of 38.2%, significantly outperforming both smaller and larger accounts.
Engagement rate benchmarks
Status posts generated the highest engagement rate on Facebook in 2025, averaging 0.20%. Reels followed at 0.18%, while album and image posts averaged 0.18% and 0.15%, respectively.
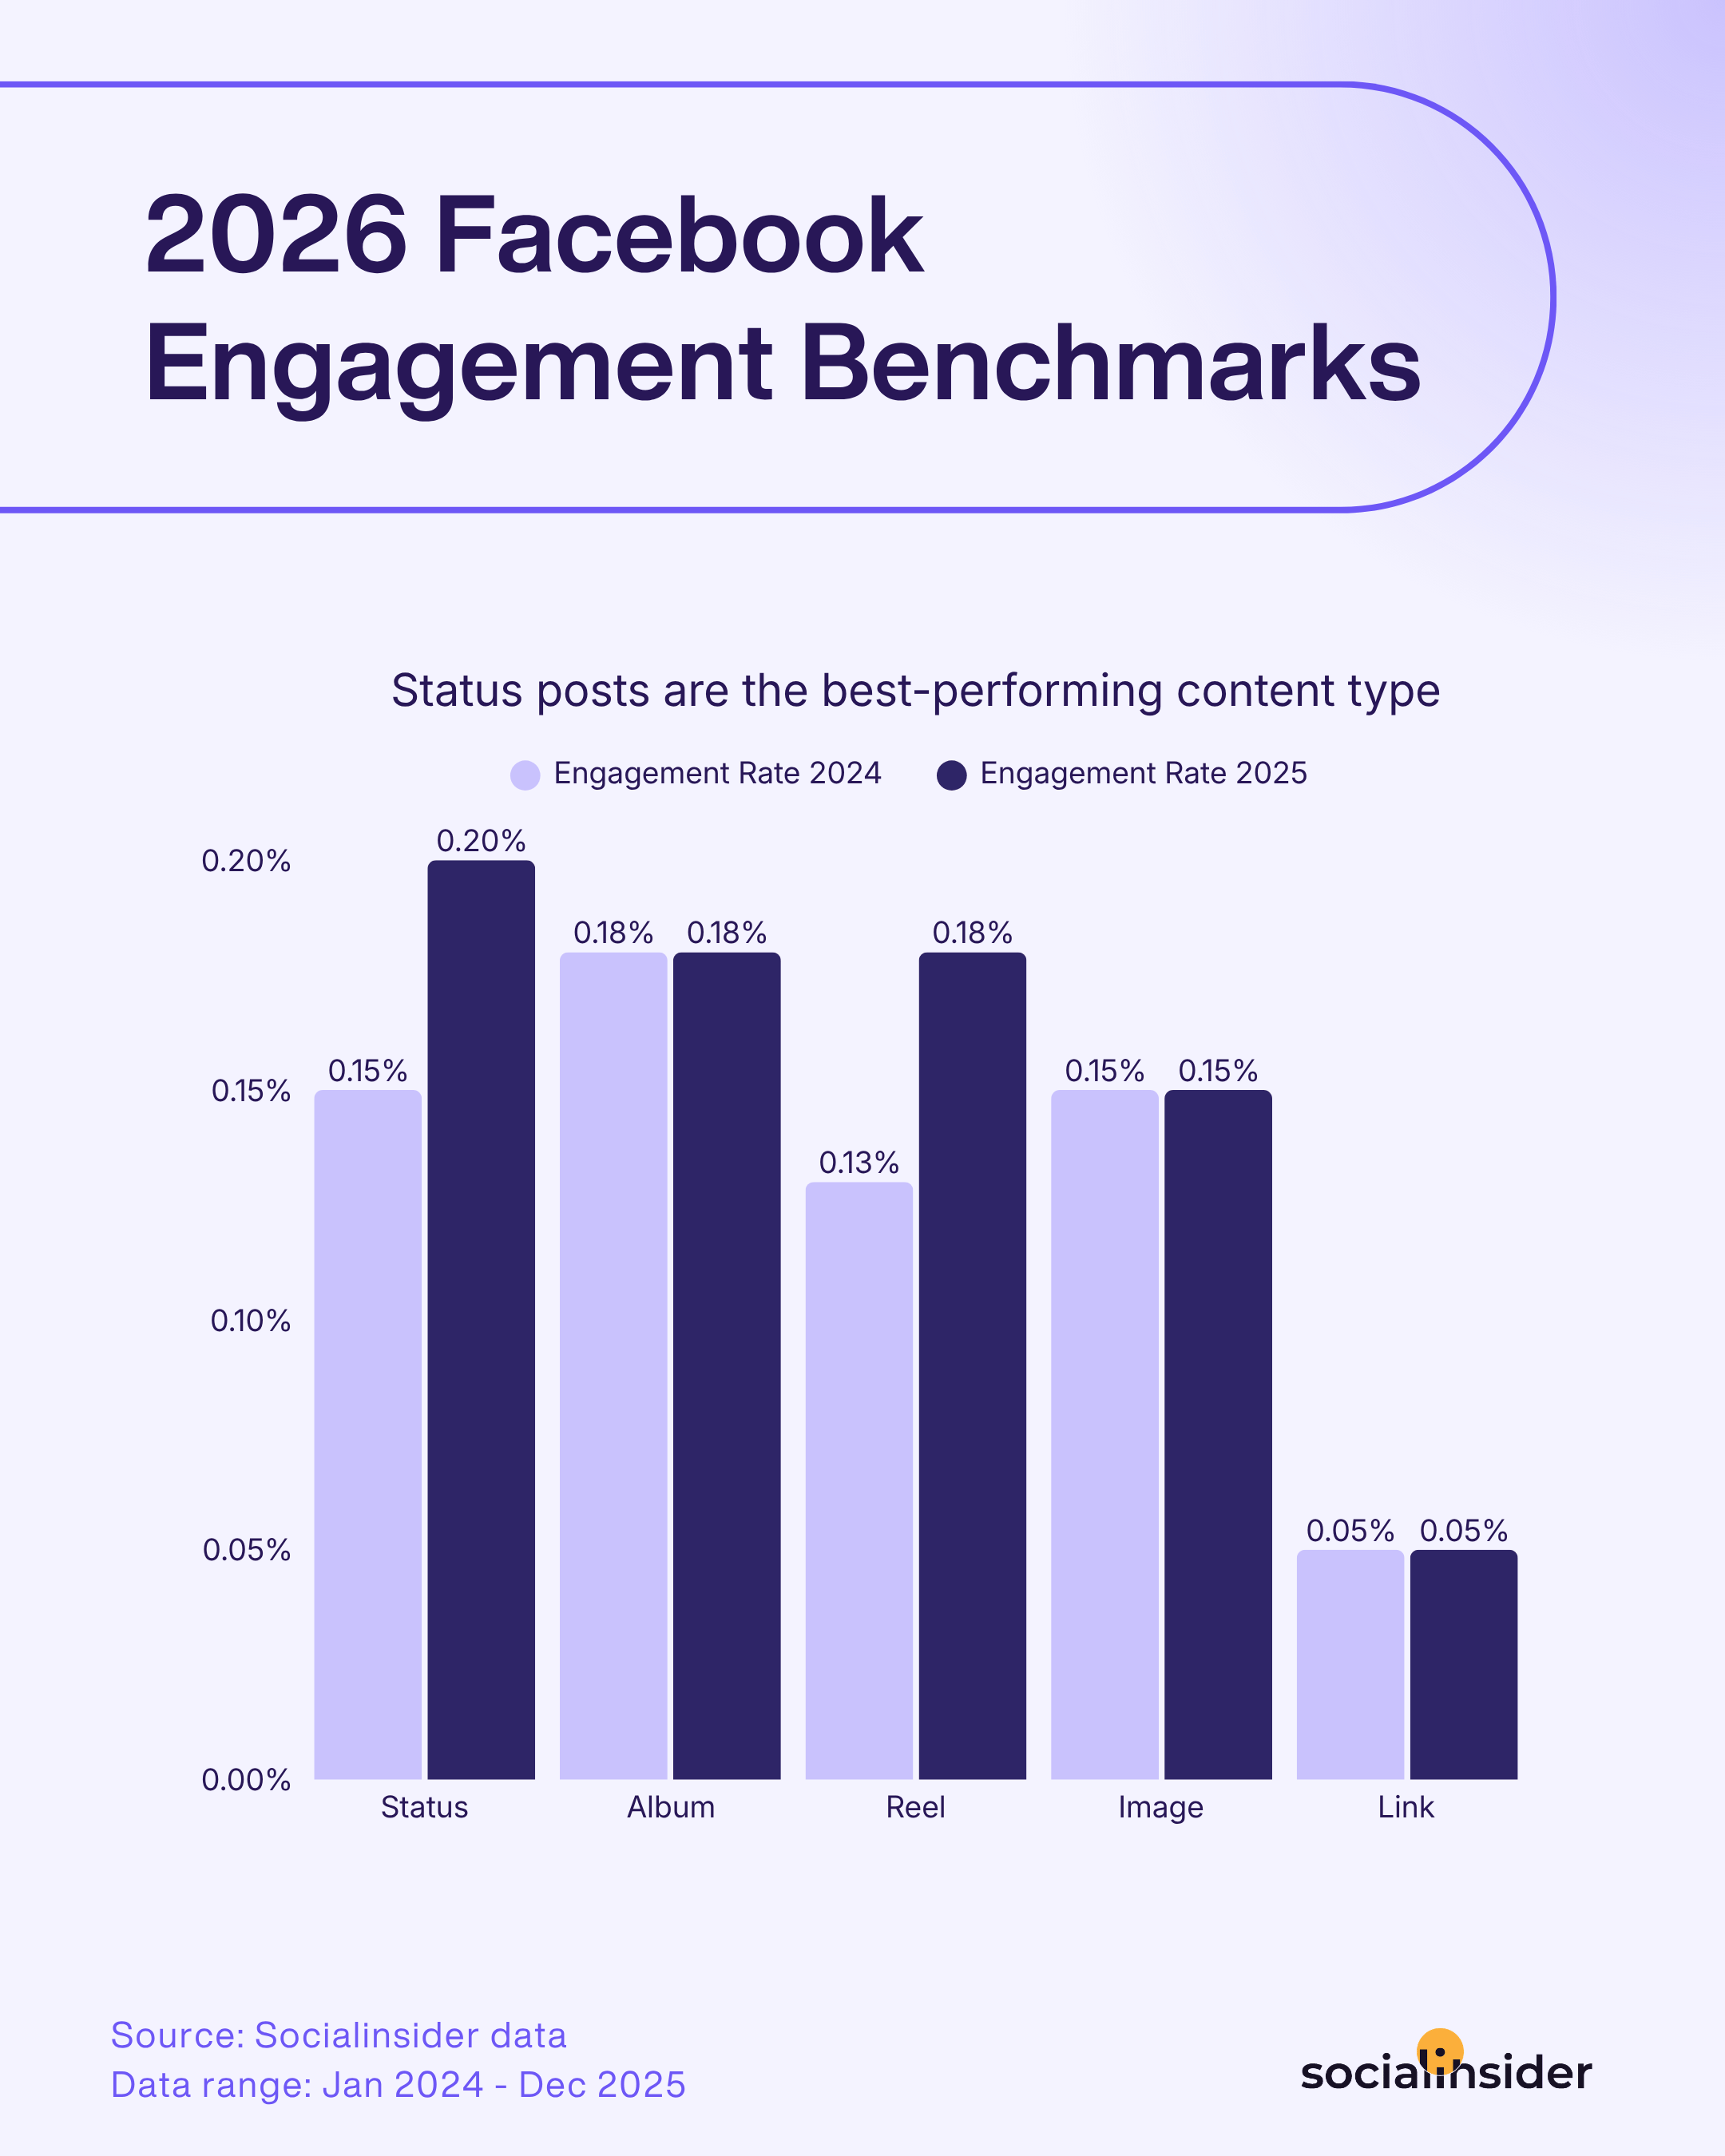
The data suggests that simple text-based updates continue to perform surprisingly well on Facebook, despite the platform's increasing focus on video content.
TikTok
TikTok continues to offer some of the strongest growth and engagement opportunities in social media, although the platform is becoming increasingly competitive as it matures.
The latest TikTok benchmarks report by Socialinsider highlights how audience growth and engagement vary across account sizes.
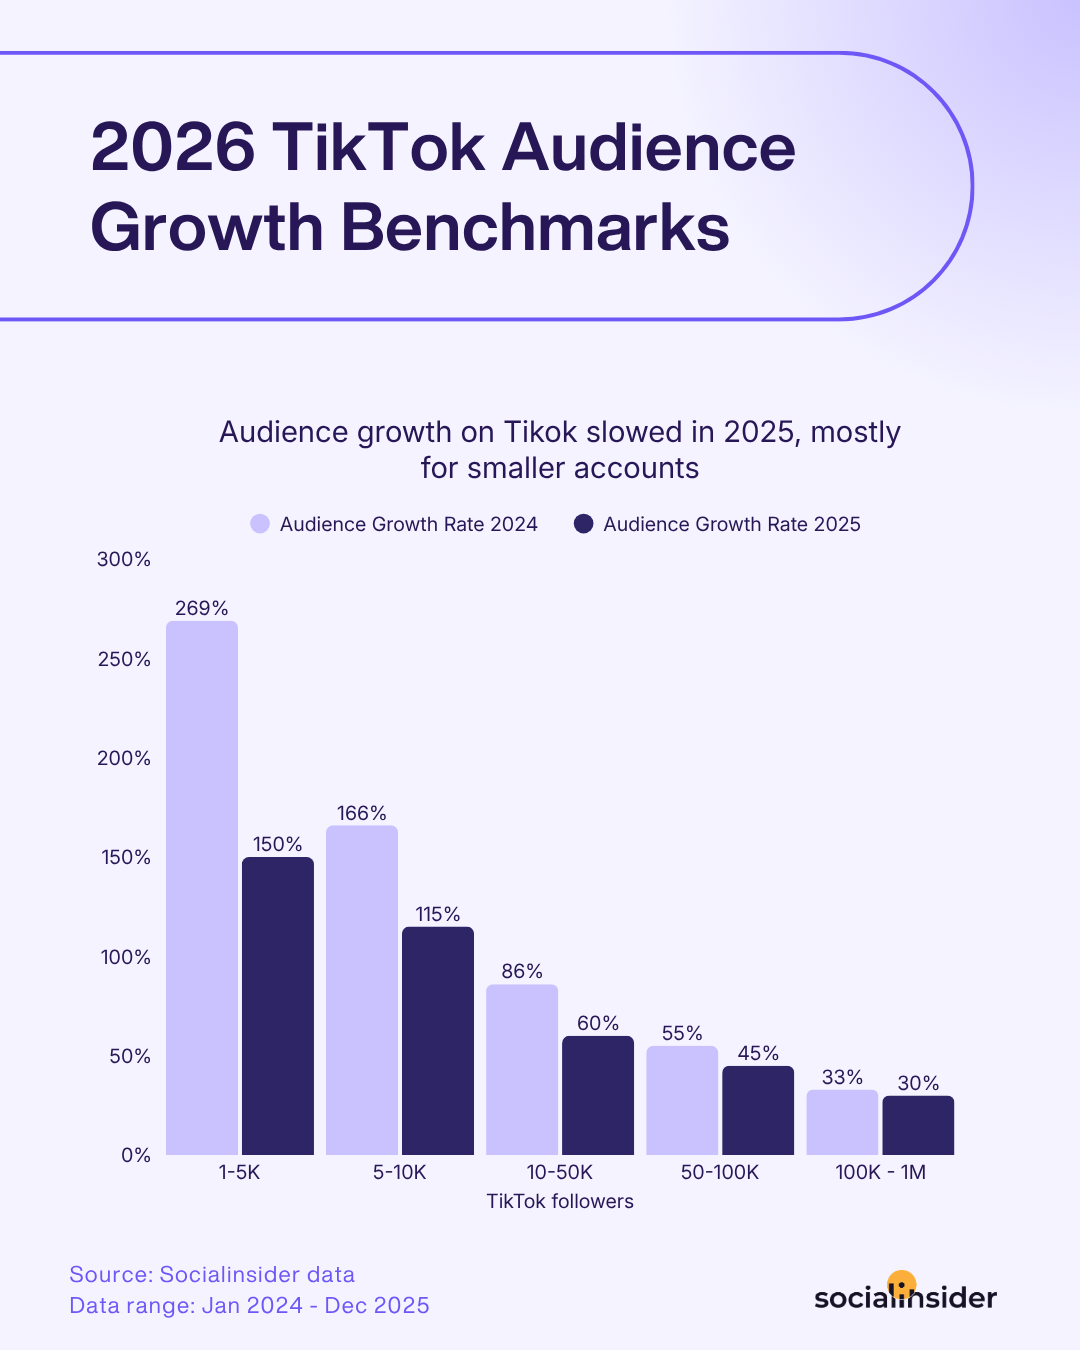
Audience growth benchmarks
TikTok audience growth slowed in 2025, particularly among smaller accounts.
Even so, the platform continues to deliver impressive growth rates compared to other networks.
Accounts with 1K–5K followers achieved an average growth rate of 150%, while profiles with 100K–1M followers averaged 30% growth.
Engagement rate benchmarks
TikTok engagement remained strong across all account sizes, averaging between 3.75% and 4.4%. Smaller accounts led the way, with profiles in the 1K–5K follower range achieving the highest engagement rate at 4.4%.
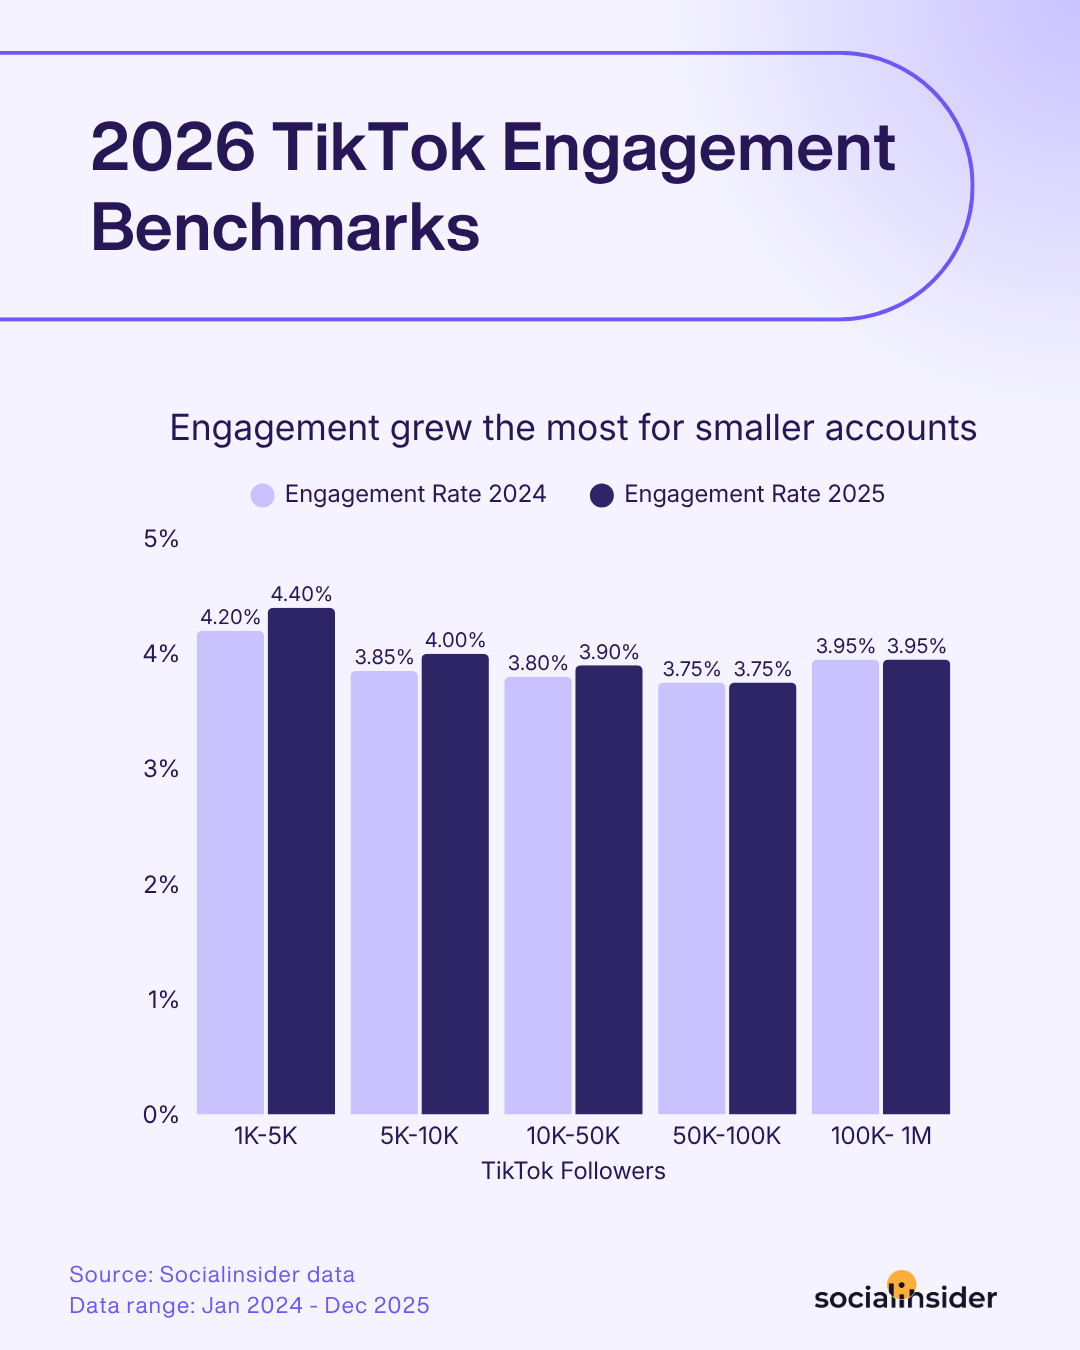
The data suggests that while audience growth is becoming more challenging, TikTok continues to excel at generating audience interaction, particularly for smaller and mid-sized creators.
Success on LinkedIn often looks different than on other social networks.
Brands are competing for credibility, expertise, and meaningful professional engagement.
The latest LinkedIn benchmarks report by Socialinsider reveals which content formats and growth patterns are driving results on the platform.
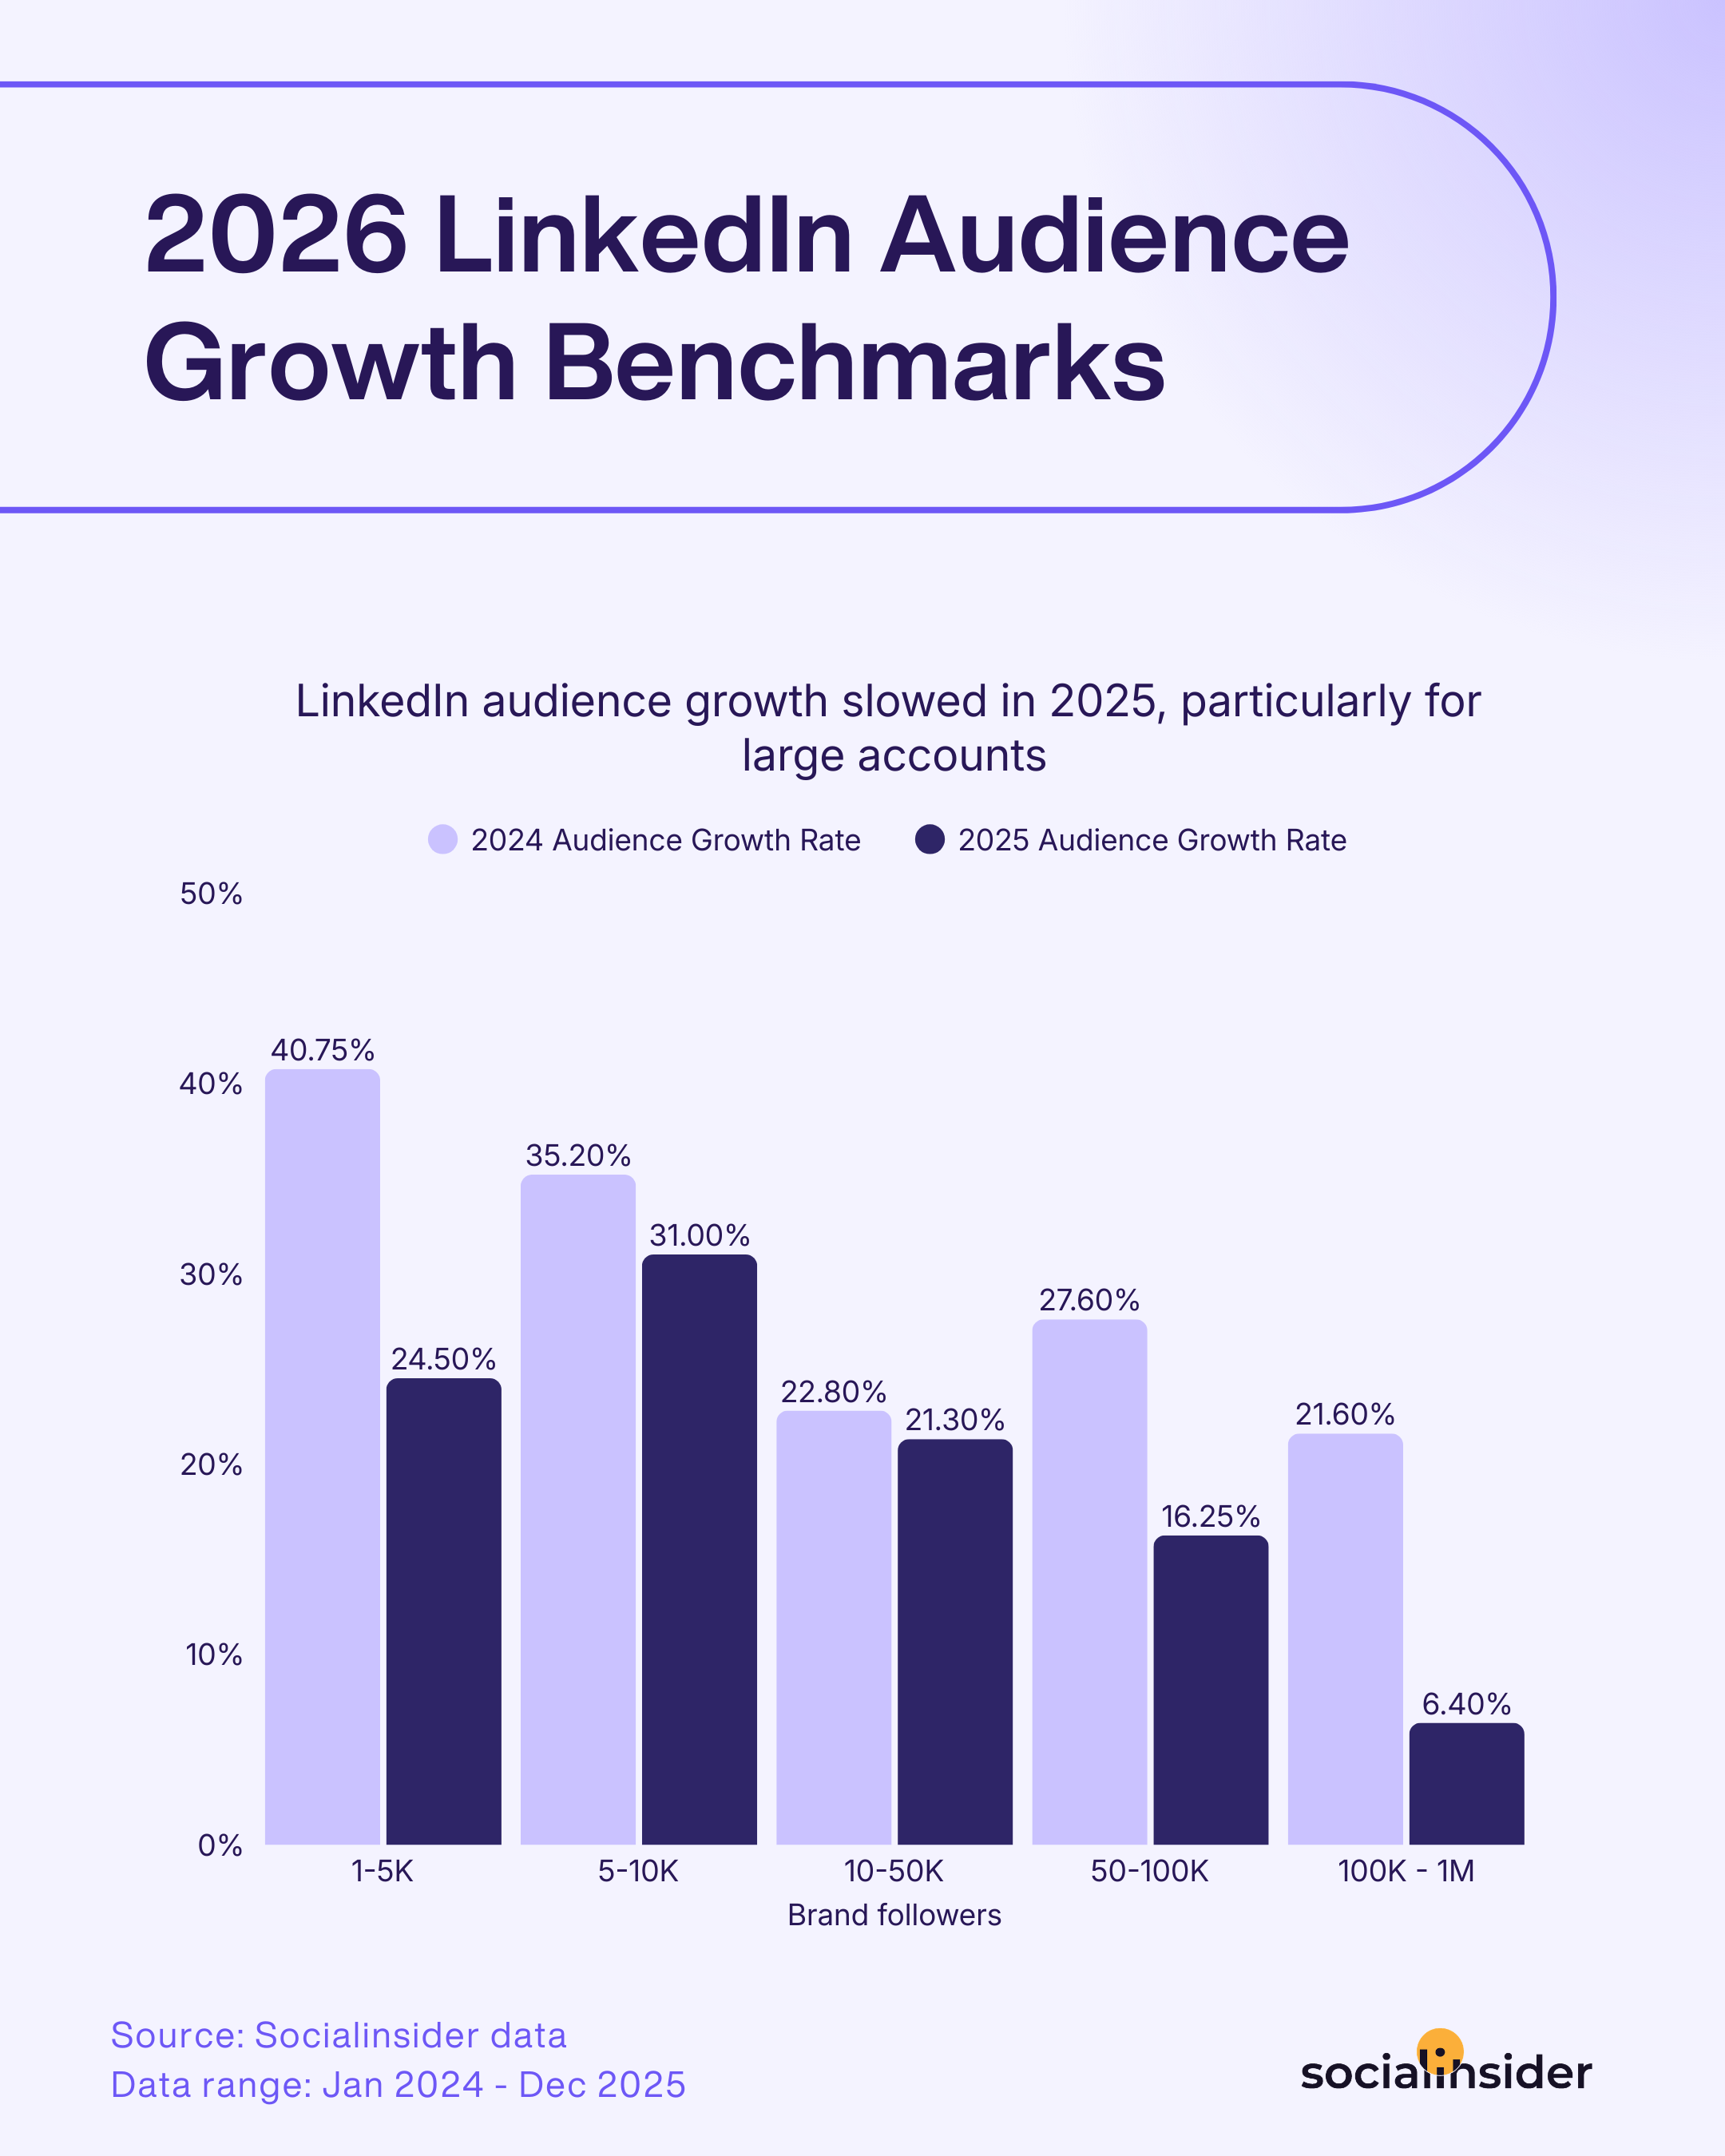
Audience growth benchmarks
LinkedIn audience growth slowed in 2025, particularly among larger accounts.
Pages with 5K–10K followers achieved the highest average growth rate at 31%, while pages with 100K–1M followers averaged 6.4% growth.
Engagement rate benchmarks
Native documents generated the highest engagement rate on LinkedIn in 2025, averaging 7%. Multi-image posts followed at 6.45%, while videos and images averaged 6% and 5.3%, respectively.
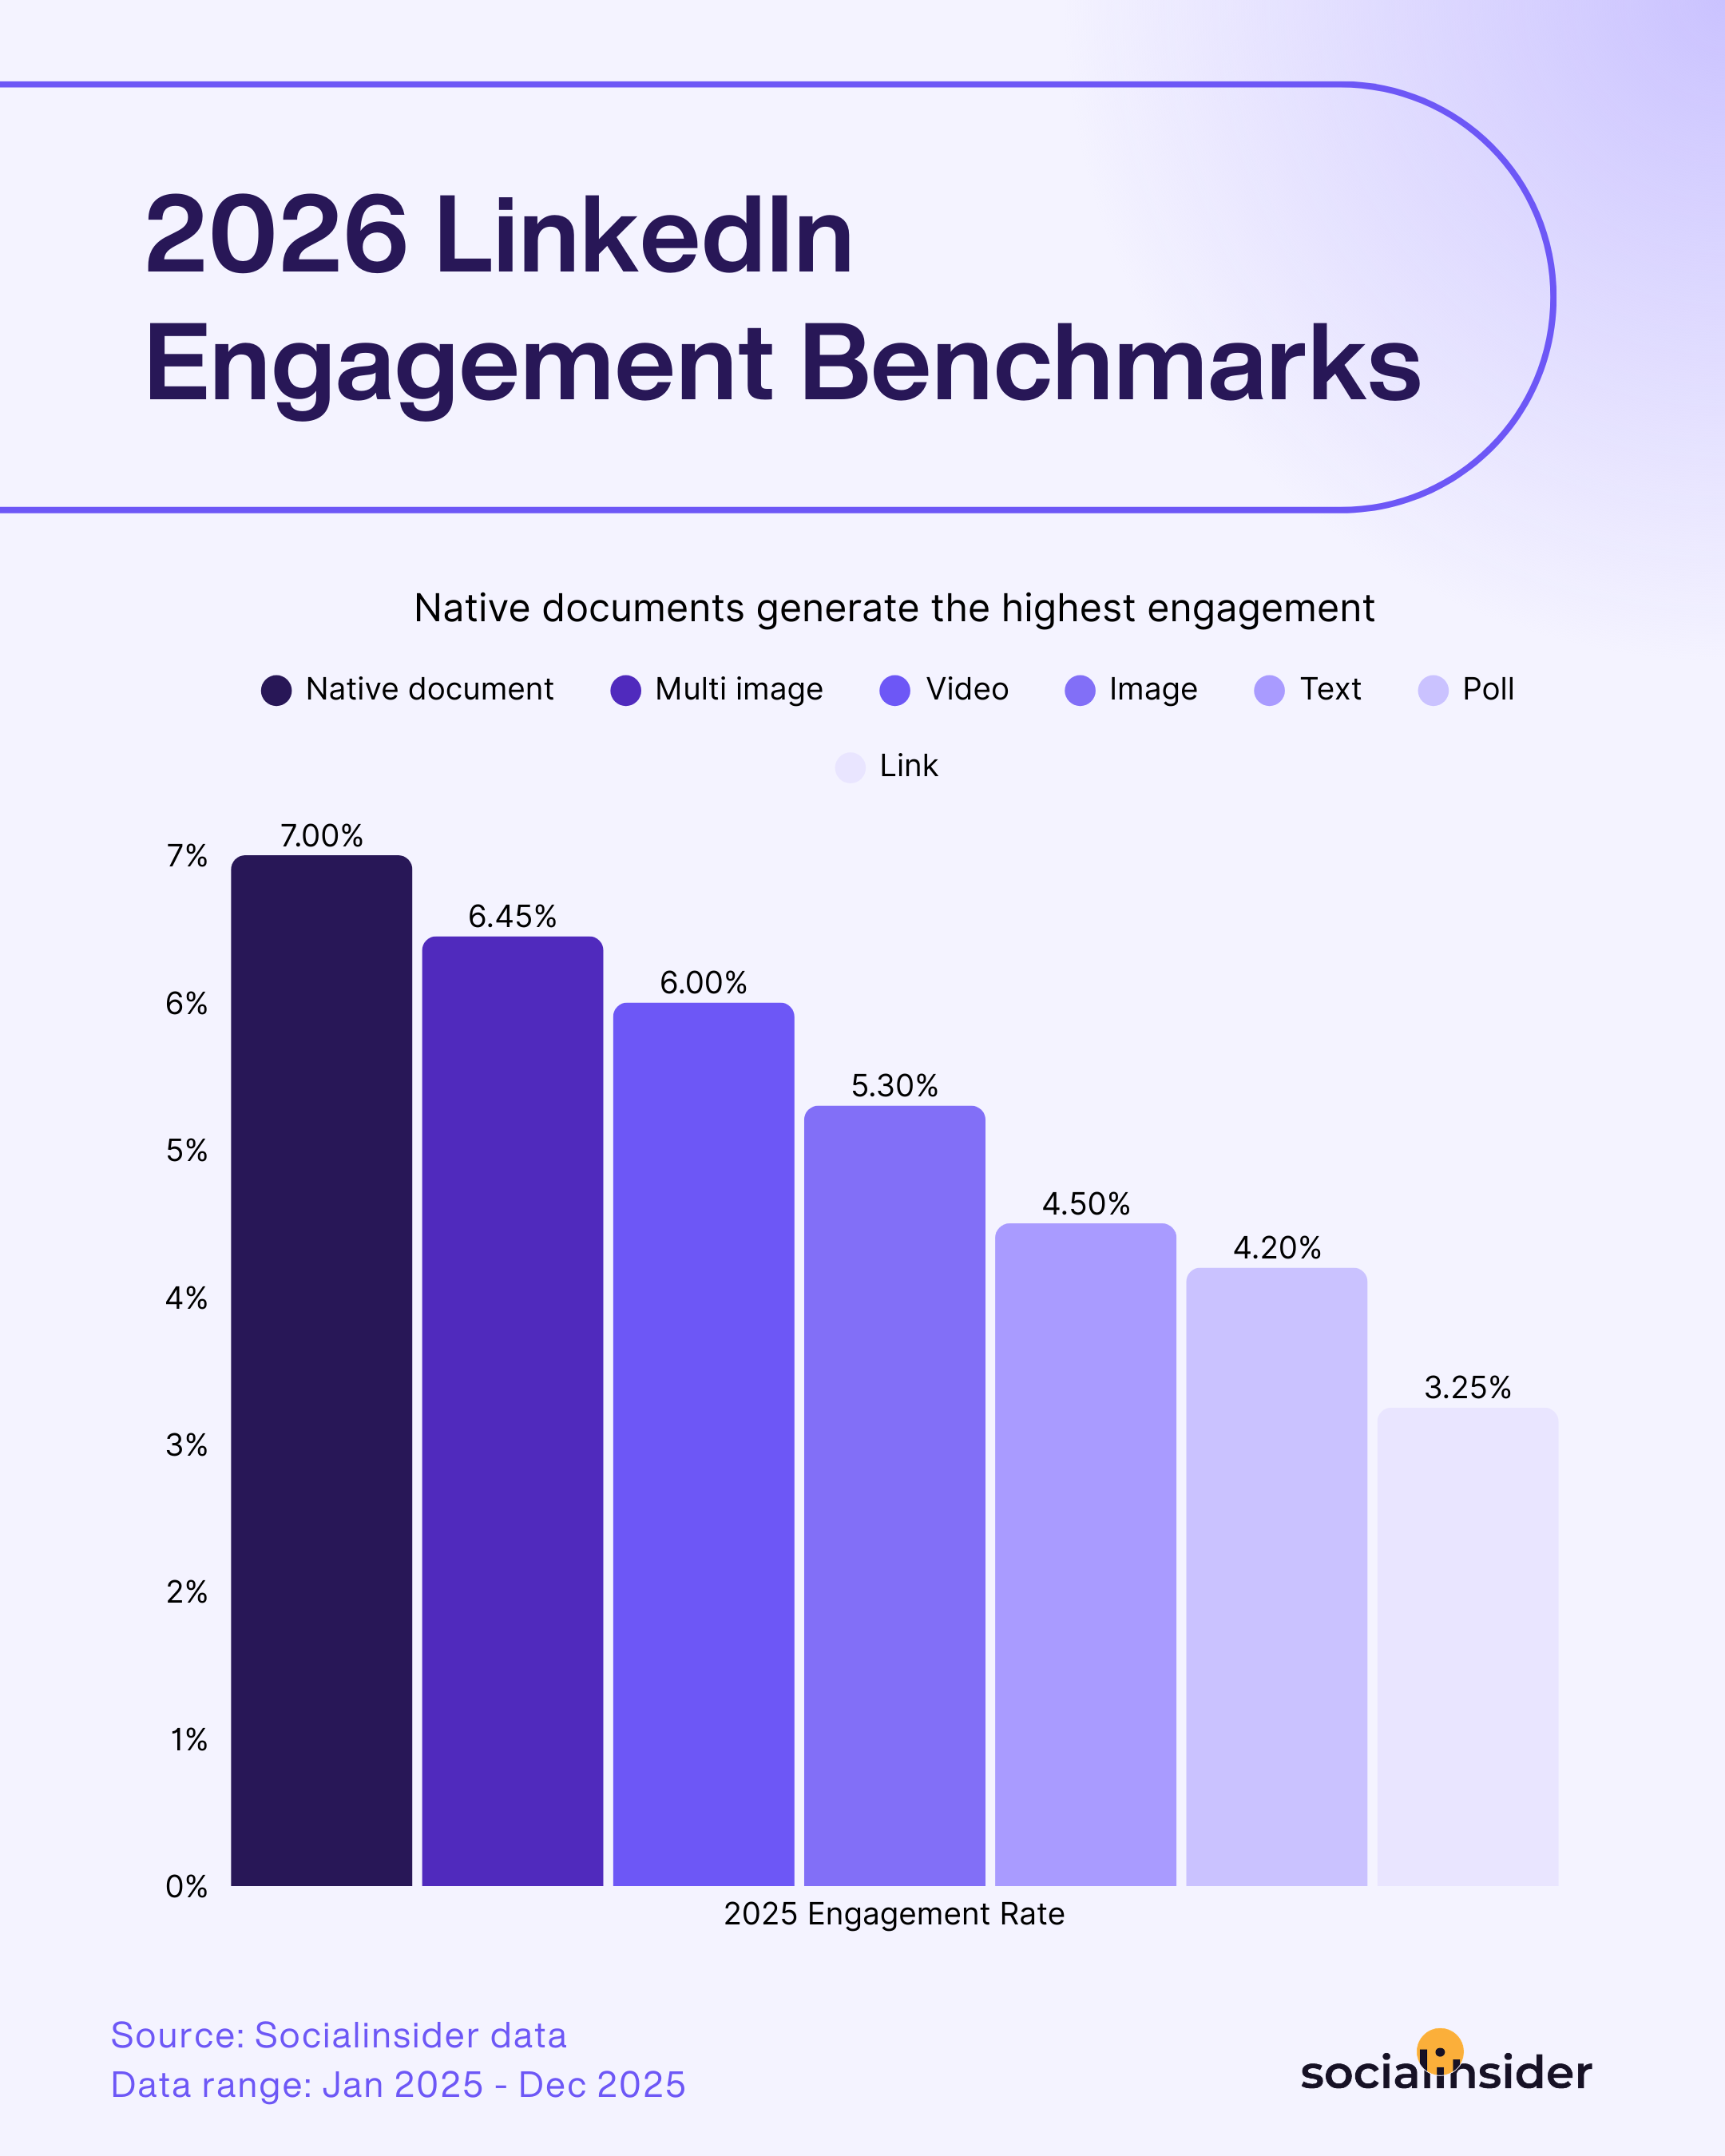
The data suggests that educational, in-depth content continues to perform exceptionally well on LinkedIn, with native documents leading all content formats for engagement.
How to evaluate social media ROI and overall business impact?
The further you move up the reporting chain, the more the language of social media has to change.
A 5% engagement rate means something to a social media manager. To a CFO or CMO, the question is simpler: what did this generate for the business?
That's why measuring social media ROI requires a different lens — one that translates social media activity into the financial and strategic outcomes that matter to the people making budget decisions.
The sections below explore two of the most important pieces of that puzzle: attribution and value measurement.
Attribution models for social (last-touch vs. multi-touch)
Few purchases happen after a single social media interaction.
Someone might discover your brand through an Instagram Reel, visit your website from LinkedIn a week later, and finally convert after clicking a retargeting ad.
That's why attribution matters.
Last-touch attribution gives full credit to the final interaction before conversion, making it easy to track but often undervaluing the role social media plays earlier in the customer journey.
Multi-touch attribution distributes credit across multiple interactions, providing a more realistic view of how different channels contribute to results.
If you're interested in exploring the strengths and limitations of each model, our guide to social media attribution breaks them down in more detail.
How to connect social metrics to revenue?
One of the biggest limitations of traditional ROI measurement is that it tends to reward the easiest outcomes to track.
A direct purchase from a social media post is easy to attribute. Increased brand awareness, stronger audience relationships, and sustained engagement are not. Yet those outcomes often influence future buying decisions long before a conversion takes place.
This is why I like looking at social media through a value lens rather than a conversion-only lens.
Socialinsider's Organic Value feature estimates the financial impact of your organic social media efforts by considering factors such as awareness impact, engagement, and audience growth.

In the example above, organic social activity generated an estimated value of $1.1M, with awareness impact contributing the largest share.
This way of analyzing the results of social campaigns quantifies the impact of social media initiatives that might otherwise be overlooked in traditional ROI reporting.
If you'd like to learn more about how the metric is calculated, our guide to social media value breaks down the methodology in detail.
Final thoughts
The longer I work in data-driven marketing, the more convinced I become that evaluation is about perspective.
Metrics can tell you what happened. But it's perspective — and the right analytical infrastructure — that helps you understand why it happened and what to do next.
The social media leaders who grow their brand's presence consistently are the ones who treat evaluation not as a reporting obligation, but as a strategic input.
Because ultimately, social media evaluation is less about proving success and more about creating it.
FAQs on social media evaluation
How to present the findings of your social media evaluation to stakeholders?
Adapt your report to your audience. While social media managers may need channel-specific metrics, executives typically care more about business impact, trends, and ROI. Rather than simply presenting numbers, explain what changed, why it happened, and what actions should follow. For a deeper look at tailoring reports for different stakeholders, see our executive reporting guide.
What are some common mistakes when evaluating social media performance?
A common mistake is evaluating platforms in isolation instead of considering their contribution to broader business goals. Many brands also overlook qualitative signals such as DMs, comments, and customer sentiment, which can provide valuable context. Another pitfall is ignoring seasonality, which can distort performance comparisons and lead to misleading conclusions.
Anda Radulescu
Content writer & copywriter with a 5-year track record in digital marketing. Equal parts keen observer & committed go-getter. A proud cat mom with a passion for music & exploring the world.

Know what your competitors do — before your manager asks
Get instant social benchmarks & reports without manual work.

