How Effective is Social Media Marketing - How To Track The Data To Get Answers
Discover how effective social media marketing is based on data and how it can elevate your brand in today's digital landscape.

The internet is full of data proving that social media marketing works. But the real question is: does it work for you? Is your social media marketing effective and successful, or were those sleepless nights of campaign planning in vain?
To find out what social media marketing effectiveness really looks like in 2025, I spoke with Katie Parkes, Director of Social & Community at Apollo.io and in our chat she shared a lot of tips on how to evaluate your social media performance, interpret the right metrics, and prove your social media impact to stakeholders.
Let’s roll!
Key takeways
-
Your metrics tell the story. Engagement, reach, and follower growth form your performance baseline, while advanced indicators like Organic Value and Share of Voice help prove business impact.
-
Turn data into action. Use insights from dedicated analytical tools like Socialinsider to analyze user-generated content, content pillars, and competitor data to find what works for your audience.
-
Build a system. A solid measurement framework supported by the right tools ensures consistent tracking, benchmarking, and reliable reporting to stakeholders.
-
Benchmark against the right peers. Comparing your results with competitors helps you set realistic goals and see whether your performance is strong for your scale.
How effective is social media marketing today, according to data?
With over 5 billion people on social platforms worldwide according to Statista, social media marketing has shifted from optional to essential.
In fact, Sprout Social Index states that social media is responsible for 81% of consumers making spontaneous purchases multiple times a year. Gen Z and Millennials, who now control the majority of purchasing power, rely heavily on social media to discover products and make purchasing decisions.
However, reach and buzz alone won’t satisfy leadership. Let’s talk ROI numbers, because that’s what your board really cares about:
- Social media marketing delivers an average ROI of 250% — that's $2.50 earned for every dollar spent.
- Short-form video delivers the highest ROI, with only 22% of marketers reporting similar success with long-form video.
- According to HubSpot, the platform with the highest ROI in 2024 was YouTube. The short-form video success, combined with the power of Google Ads, makes it very credible, and 54% of marketers plan to increase investment for 2025.
- Based on 2024 Sprout Social’s Influencer Marketing report, 49% of consumers are inspired for monthly purchases by influencer posts.
Does that mean that social media converts like never before?
The answer is: it depends.
Social media conversion rates vary a lot across different sources. According to First Page Sage’s data, organic social media converts at 2.4% on average for B2C and 1.7% for B2B. It is slightly lower than email (2.8% B2C / 2.4% B2B), but higher than paid socials (2.1% B2C / 0.9% B2B)
At the same time, a broader research by Ruler Analytics shows the social media average conversion rate of 2.9%.
One thing all of the reports have in common is the breakdown by industry. Average conversion rate is hugely influenced by the industry, platform, and content format you’re using. You will see a much higher TikTok conversion rate in B2C retail cosmetics with vertical videos than in B2B SaaS with a static image.
As for the platforms, here’s how the average conversion rate looks like for each one in 2025:
- Facebook is still the conversion leader with 9.21% (Umbrex)
- LinkedIn is the strongest channel for B2B with 5-15% (Sprinklr)
- Instagram sits at a somewhat modest 1-3%(Sprout Social)
TikTok, being a discovery-first channel, shows 0.46% (Enrichlab)
Effectiveness of social media marketing for B2B vs B2C businesses
Social media works for both B2B and B2C brands, but not exactly in the same way.
B2C marketers use social to build emotion and drive impulse decisions. They focus on platforms that support faster customer journeys and more visual storytelling. According to Soax and their research, 91% of B2C marketers use Facebook versus 83% in the B2B sector.
B2B purchases are more rational, involve multiple decision-makers, and span longer cycles. Soax says, 86% of B2B marketers use LinkedIn as their core source of leads, building credibility and long-term relationships. Leads take more nurturing and cost more: the average customer acquisition cost in B2B stands at $600–$900 against about $400 in B2C, according to SerpDojo’s data.
But this doesn’t mean you, as a B2B brand, can never use TikTok, or a B2C brand can never succeed on LinkedIn. Despite the differences, you can find your audience with the right content and intent.
As Katie Parkes, Head of Social Media at Apollo.io, explained in our conversation:
If you’re selling Coca-Cola, you’ll get more traction by investing in TikTok or Instagram than on LinkedIn. But even for B2B, the people you want to reach are still there. You just have to tailor your content to the platform and to the audience you’re trying to reach.
What metrics do you track to measure how effective social media marketing is for your business?
The effectiveness of social media always comes down to numbers. But not all numbers show the real state of your accounts.
When asked which metrics signal success for her, Katie shared:
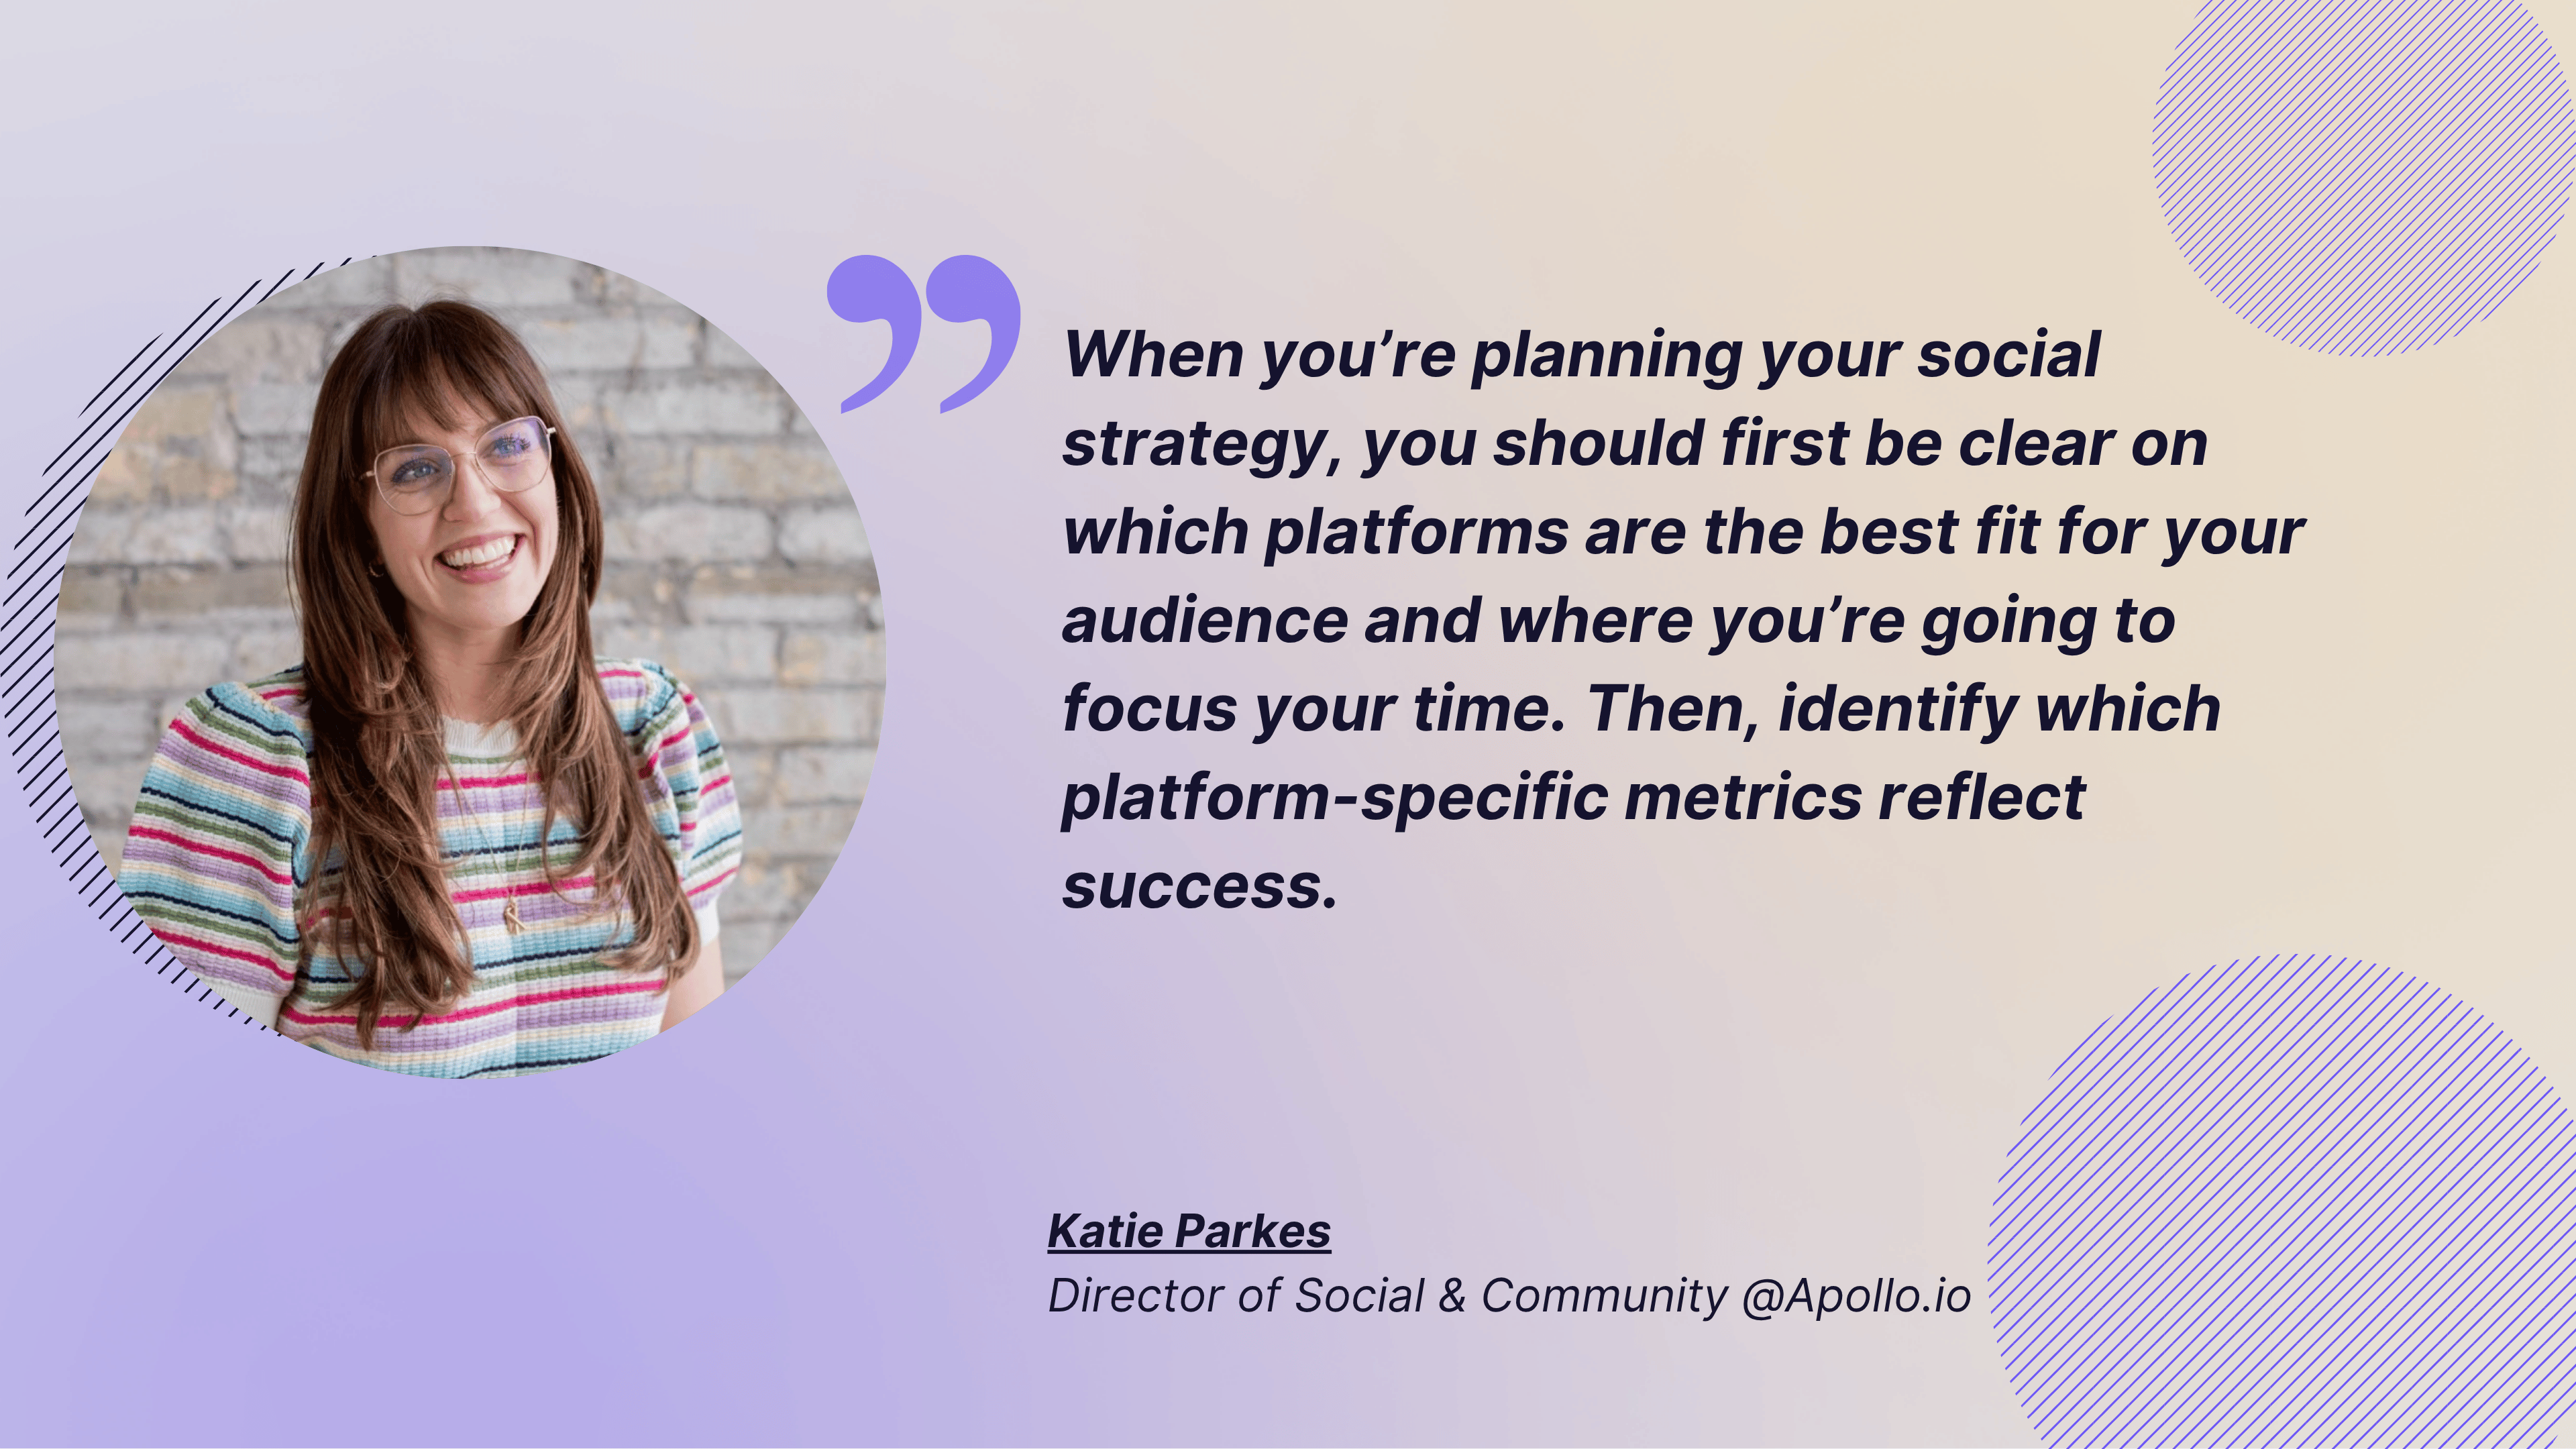
Every brand measures performance differently. But if you want a clear view of what’s working, you need to focus on the metrics that show your social media value.
Let me tell you a bit about the core social media metrics that I track to prove your social media effectiveness.
Traditional performance metrics
Everyday metrics can already tell you a lot about your social media performance. They’re the foundation of your strategy and the first to signal when something’s off.
Let’s look at the key ones: engagement rates, reach and impressions, and follower growth.
Engagement rates by platform
Whenever I evaluate a social media strategy, I start with engagement rate. It’s the clearest indicator of how my audience responds to what I post and whether they react at all.
Engagement rate is a rather wholesome metric because it captures all forms of interaction, not just likes, which have become less relevant in 2025.
As Katie Parkes explains:
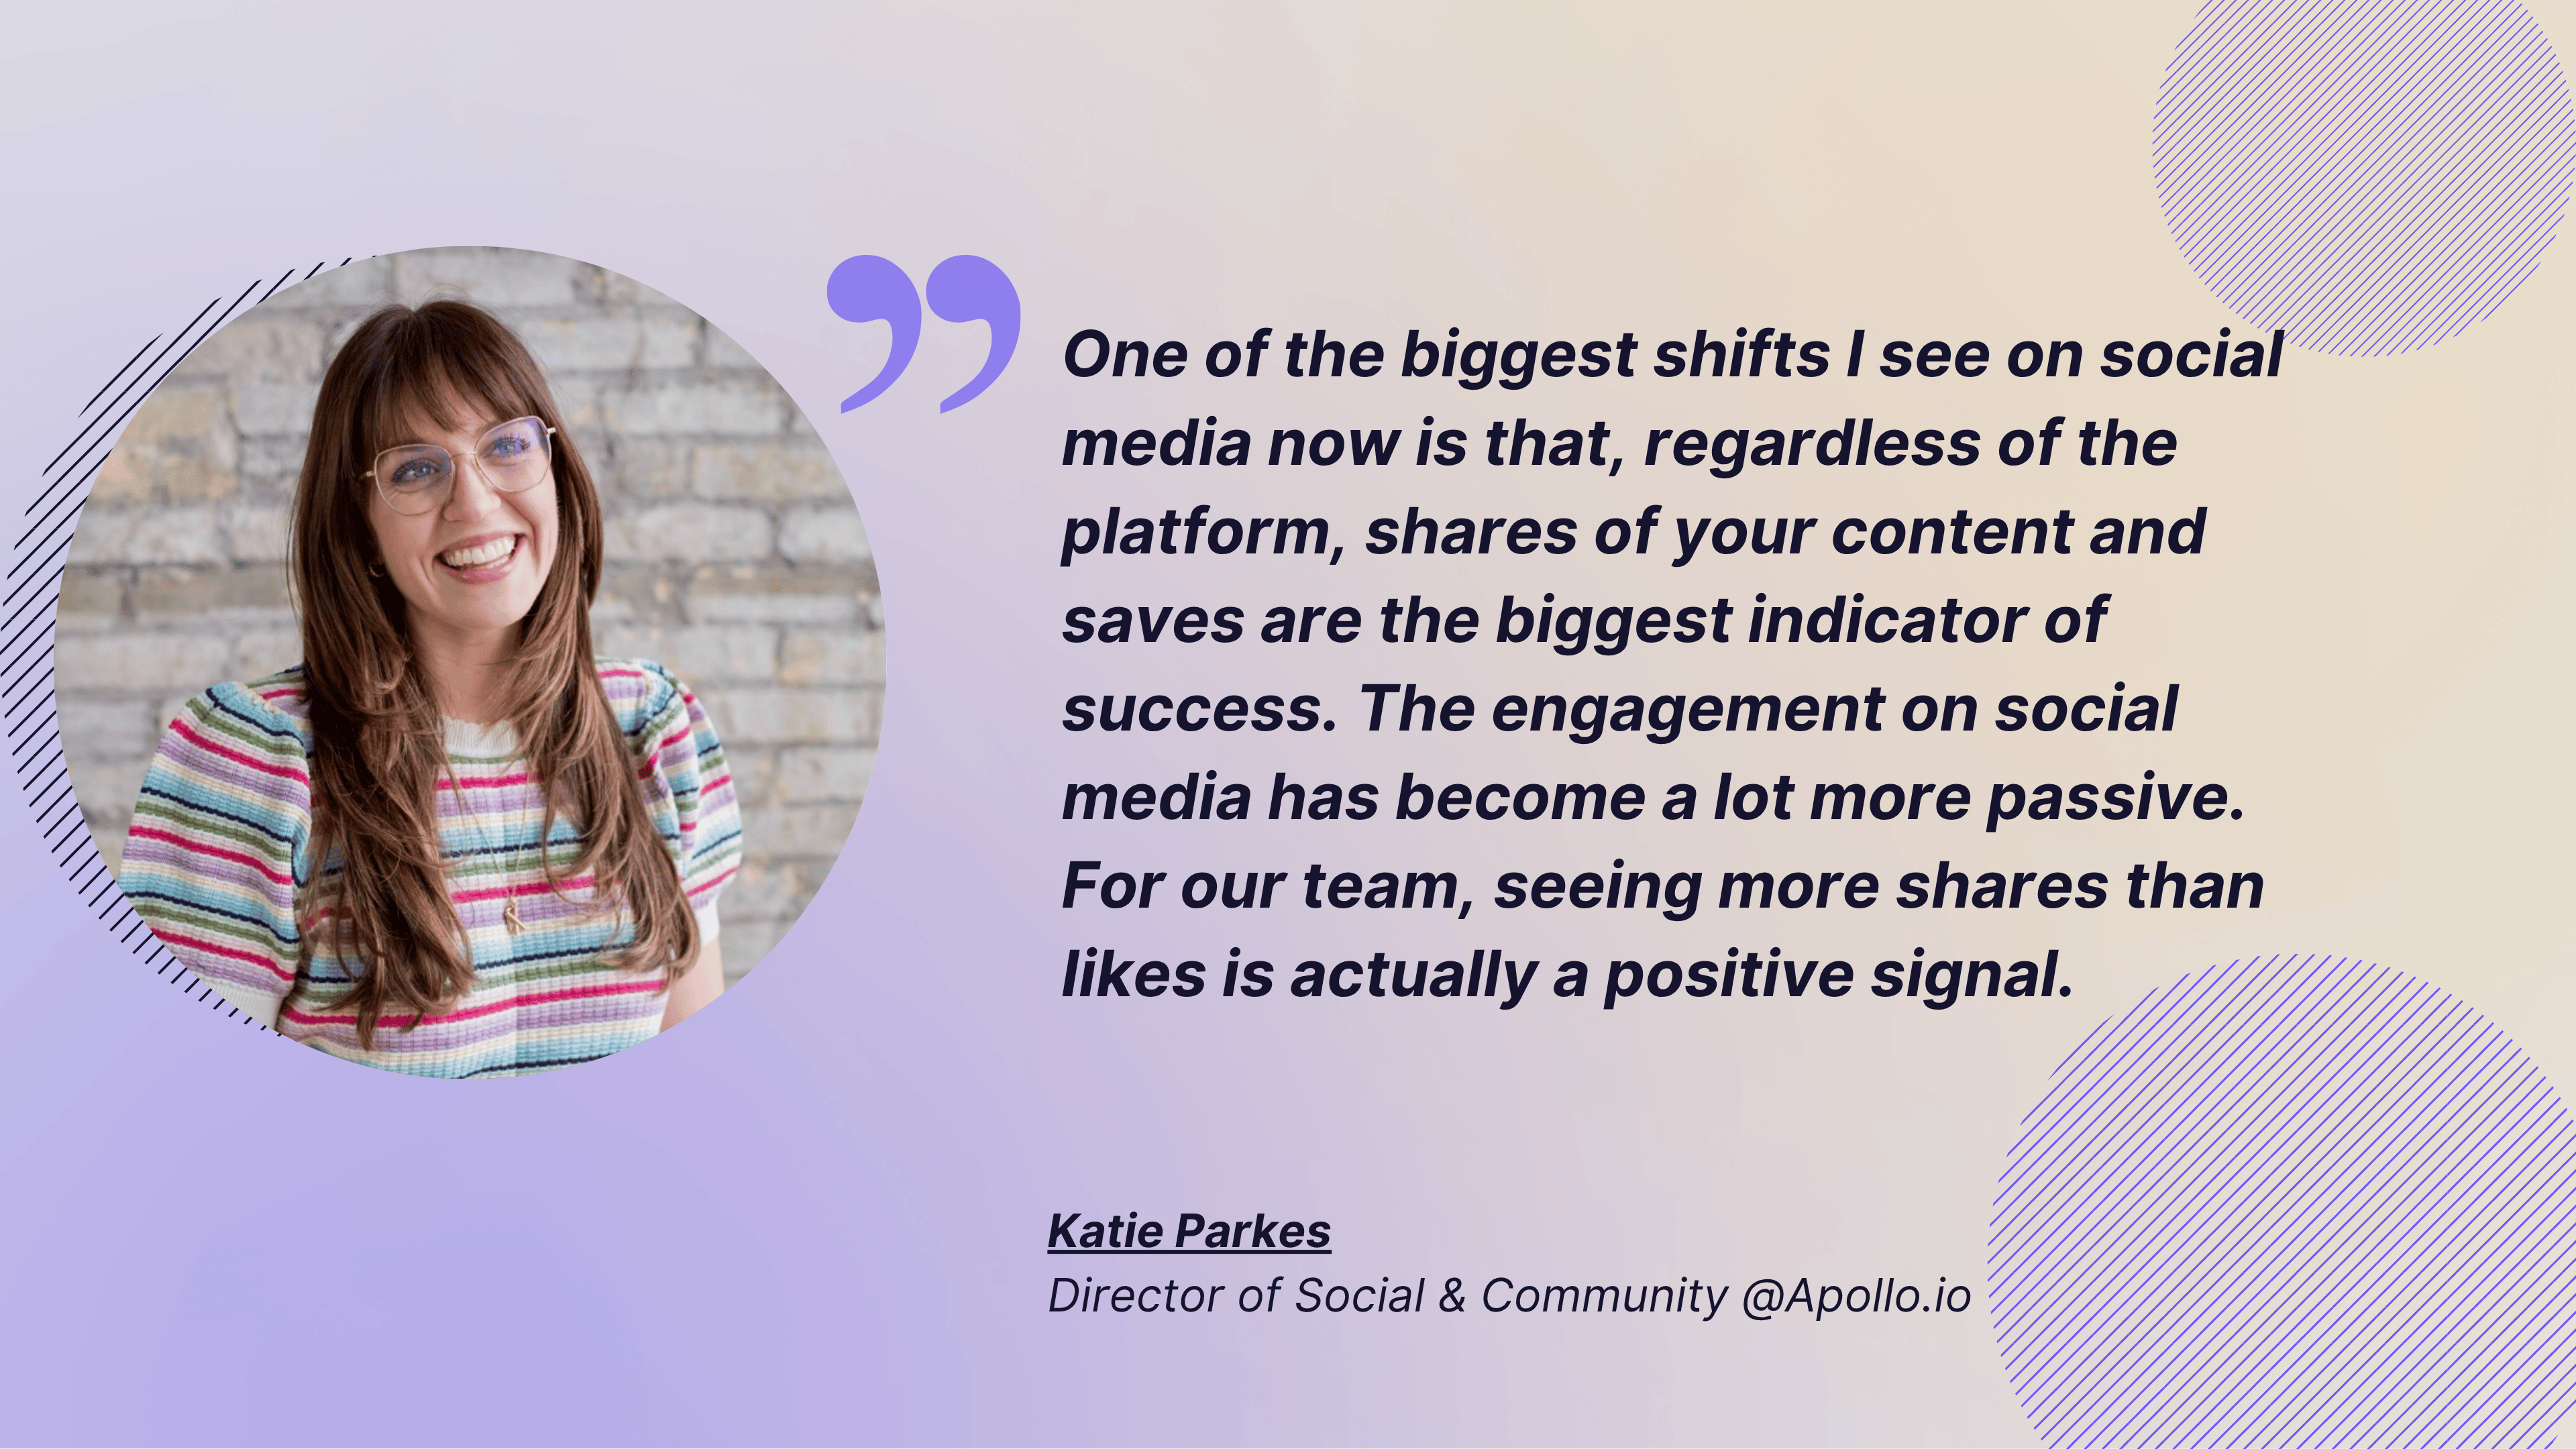
One of the biggest shifts I see on social media now is that, regardless of the platform, shares of your content and saves are the biggest indicator of success. The engagement on social media has become a lot more passive. For our team, seeing more shares than likes is actually a positive signal.
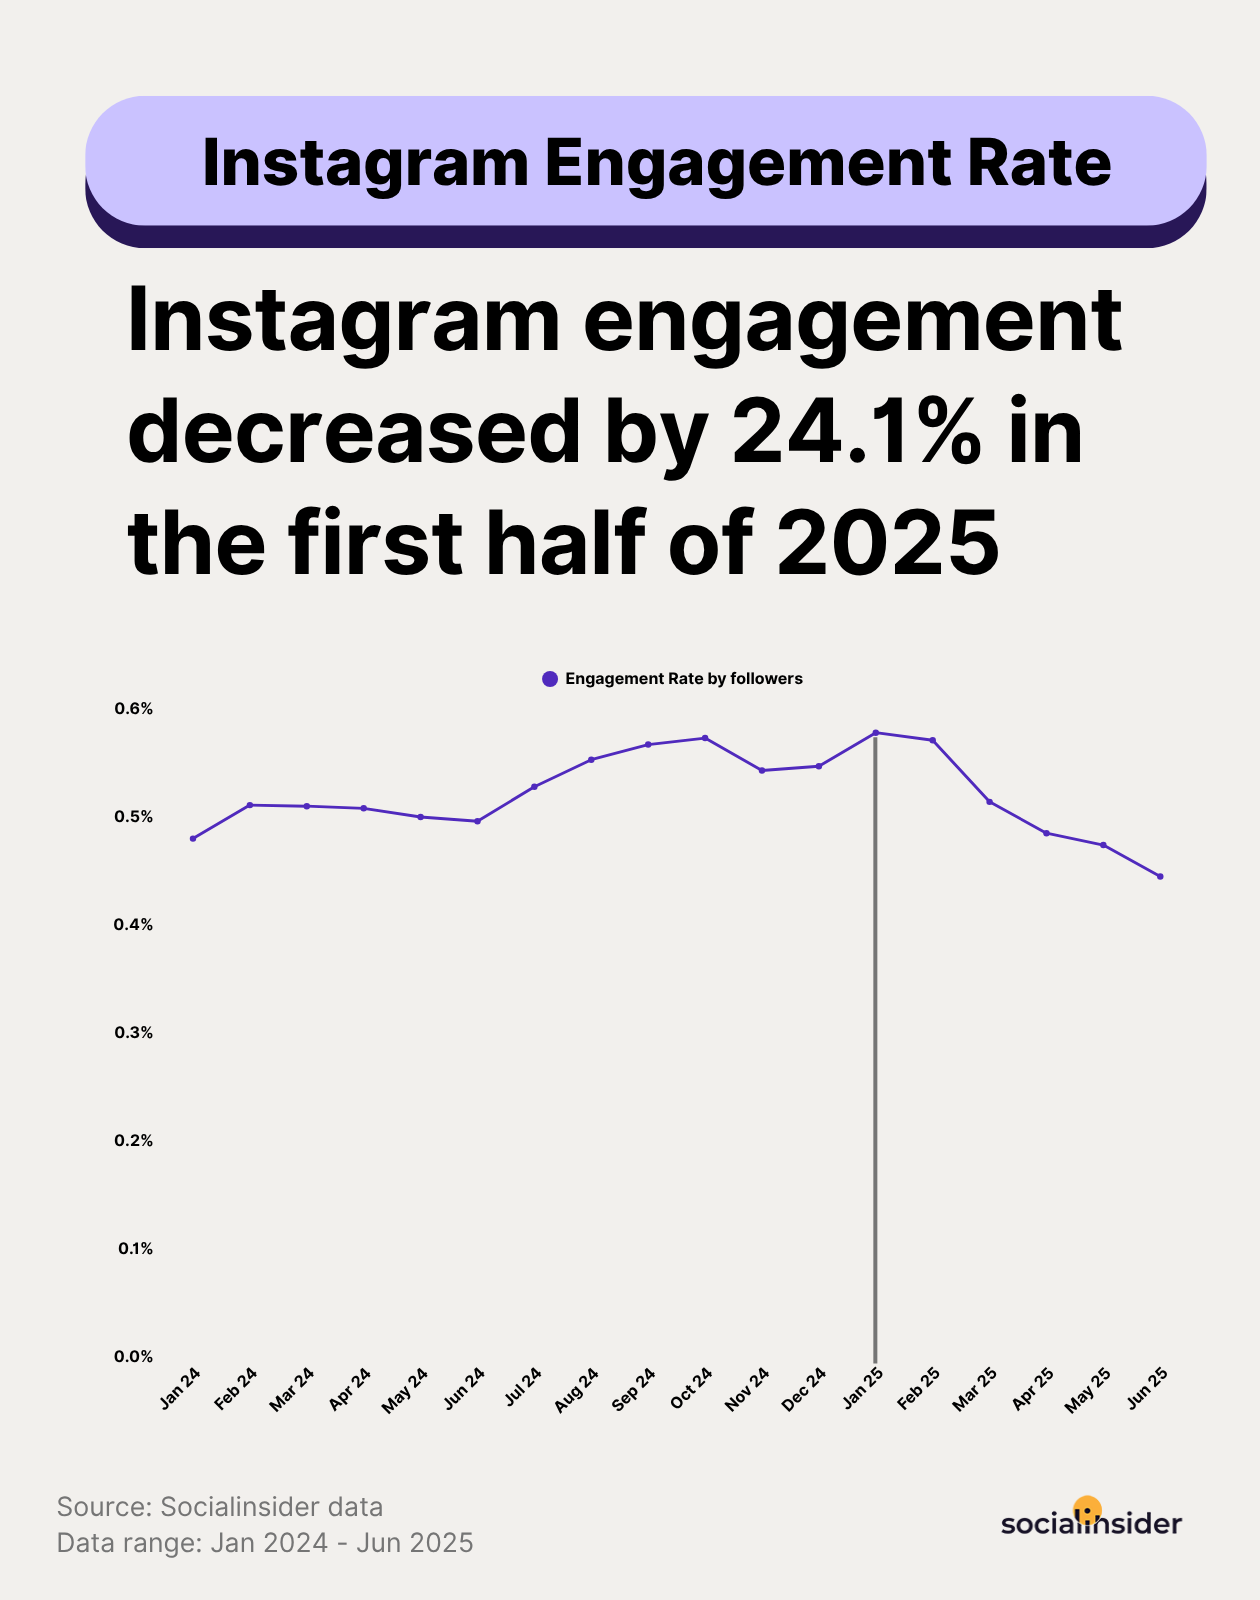
However, tracking engagement rate only makes sense in the context of your industry and your own previous performance. Here’s how current average engagement rates look across major platforms according to Socialinsider’s research:
- Instagram engagement shows a declining trend, averaging 0.47%, as competition and ad saturation make organic reach harder.

- Facebook remains the toughest space for organic performance, with engagement averaging 0.15%. However, the trend shows that overall Facebook engagement is increasing.

- TikTok is on the rise and leads in active interactions, reaching an average engagement rate of 4.90%.

- LinkedIn engagement holds at 5.20%. Despite a small dip, LinkedIn engagement in the first half of 2025 stayed above last year’s levels.
Reach and impressions
These are some powerful indicators of visibility and awareness, especially when exposure is the goal.
I’ve worked with clients who focused almost entirely on reach, and sometimes they were right to. When you’re launching a product or entering a new market, what matters most is getting in front of as many people as possible. A steady rise in reach means your message is landing with new audiences, even if engagement comes later.
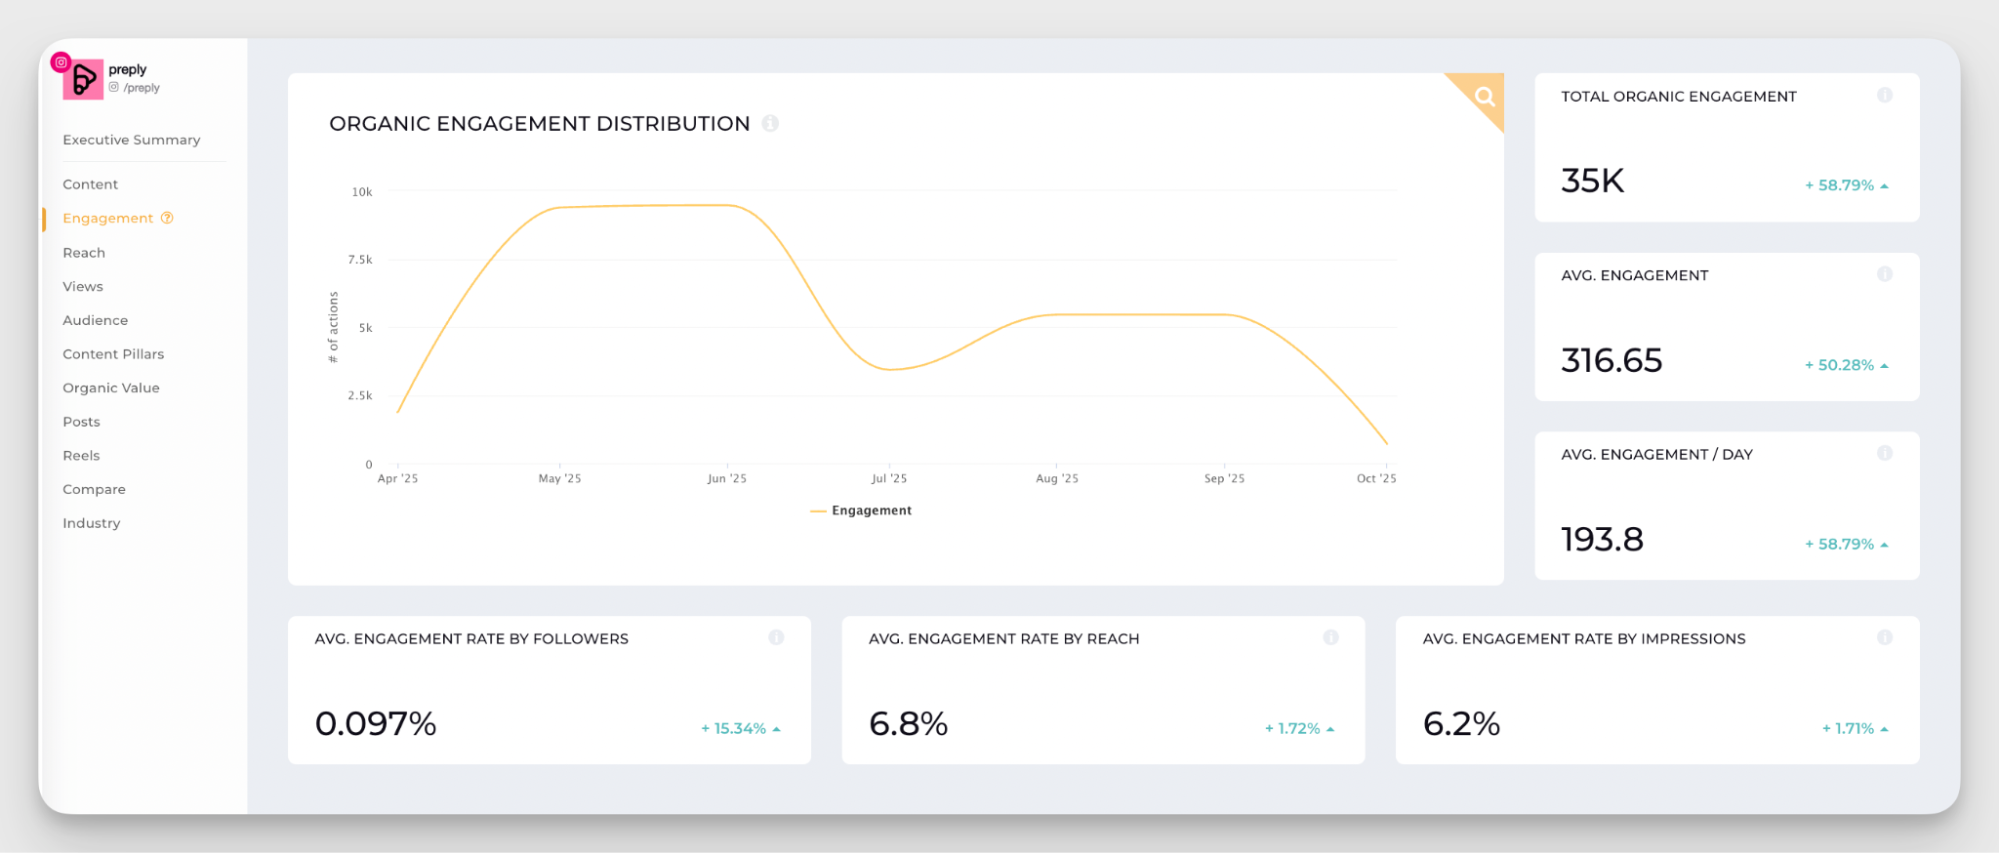
With Socialinsider, you can track both. The platform shows engagement, impressions, and follower growth not only for individual social channels but also at a brand level.
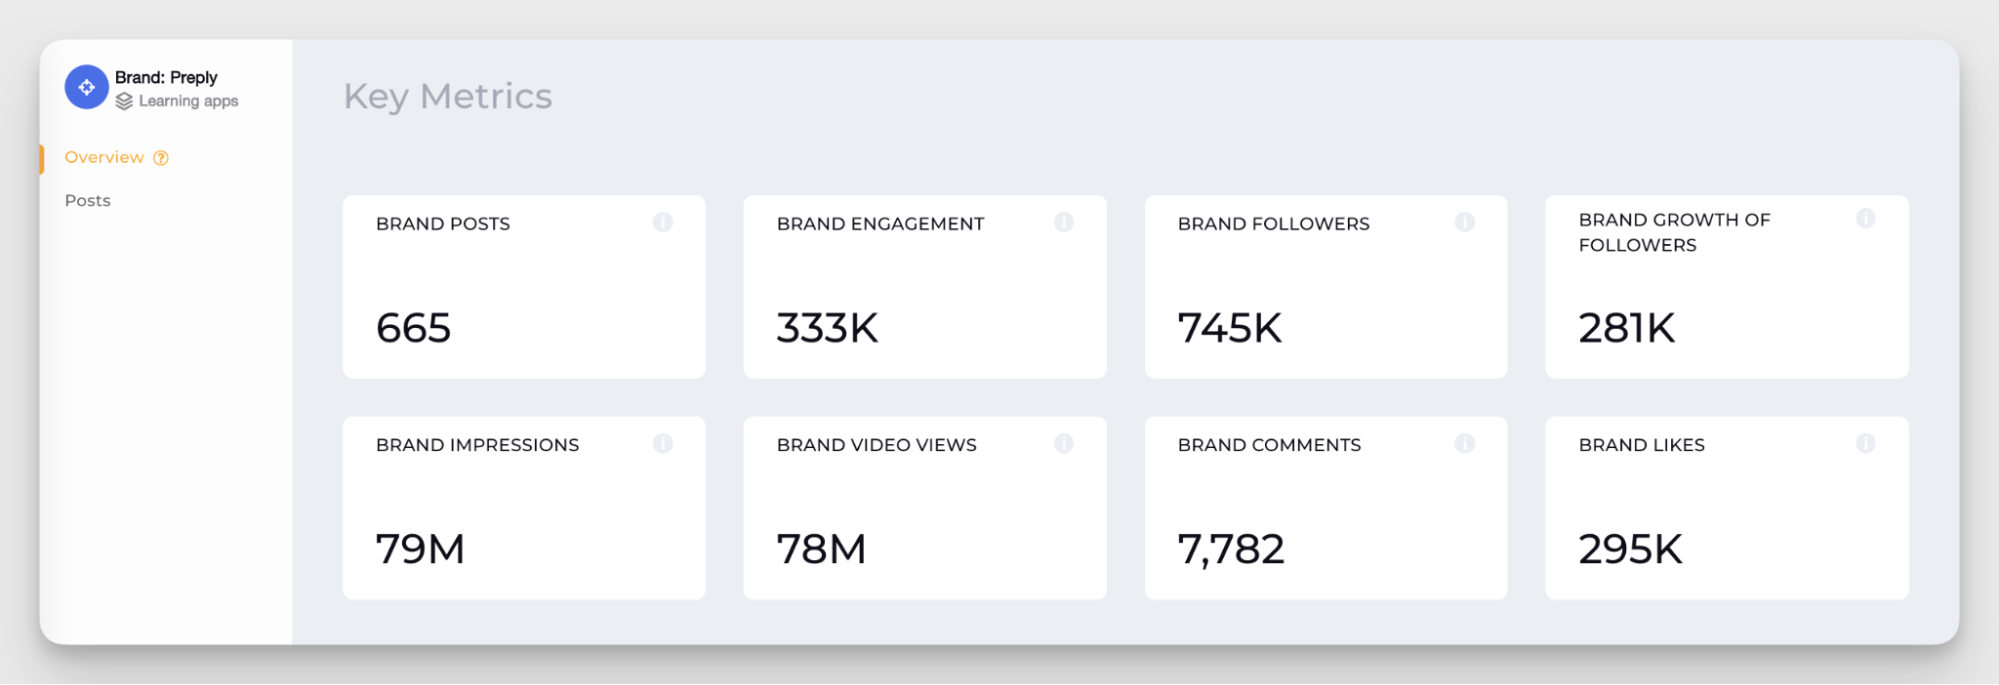
This wider view helps you understand how your content performs in context, across platforms and campaigns.
Follower growth rates
In my experience, you can’t draw meaningful conclusions about engagement if your follower base is too small or too stagnant. So even though follower growth is not the most illustrative metric, it still matters.
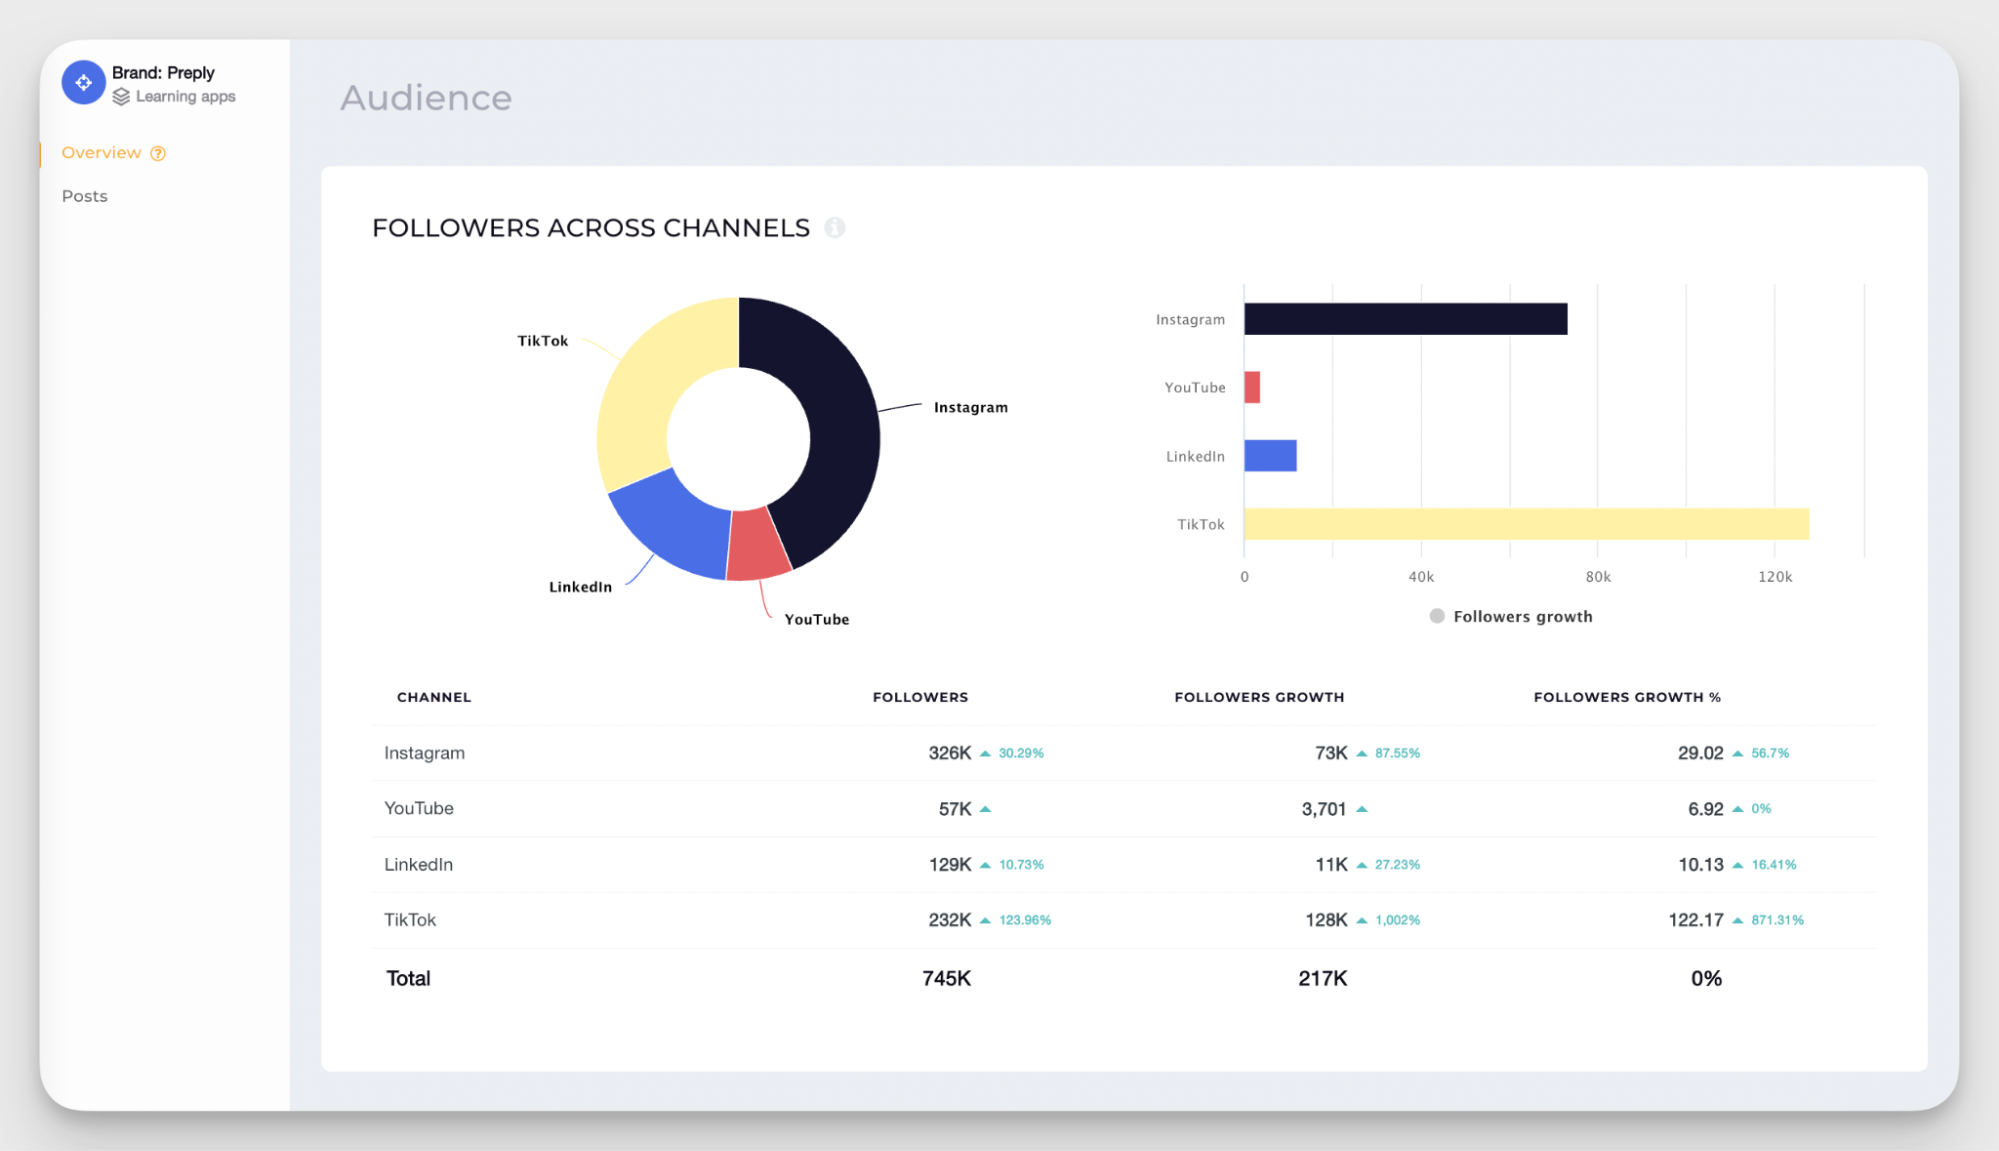
A healthy growth rate shows your message is spreading and new users are joining the conversation. With Socialinsider, you can track follower growth both as a brand-wide total and broken down by platform.
Advanced effectiveness indicators
Basic metrics like reach and engagement are great for day-to-day tracking. But executives often expect deeper insights that shape strategy and justify investment.
To gain confidence in your direction and prove that what you’re doing on social media is working, you need to dig a little deeper. Here’s what you can track to support your strategic decisions:
Organic value
Organic Value is a native metric in Socialinsider that shows how much you’d need to spend on paid ads to achieve the same results you’re getting organically. It’s one of my favorite features because it helps you put a real price tag on your organic content.
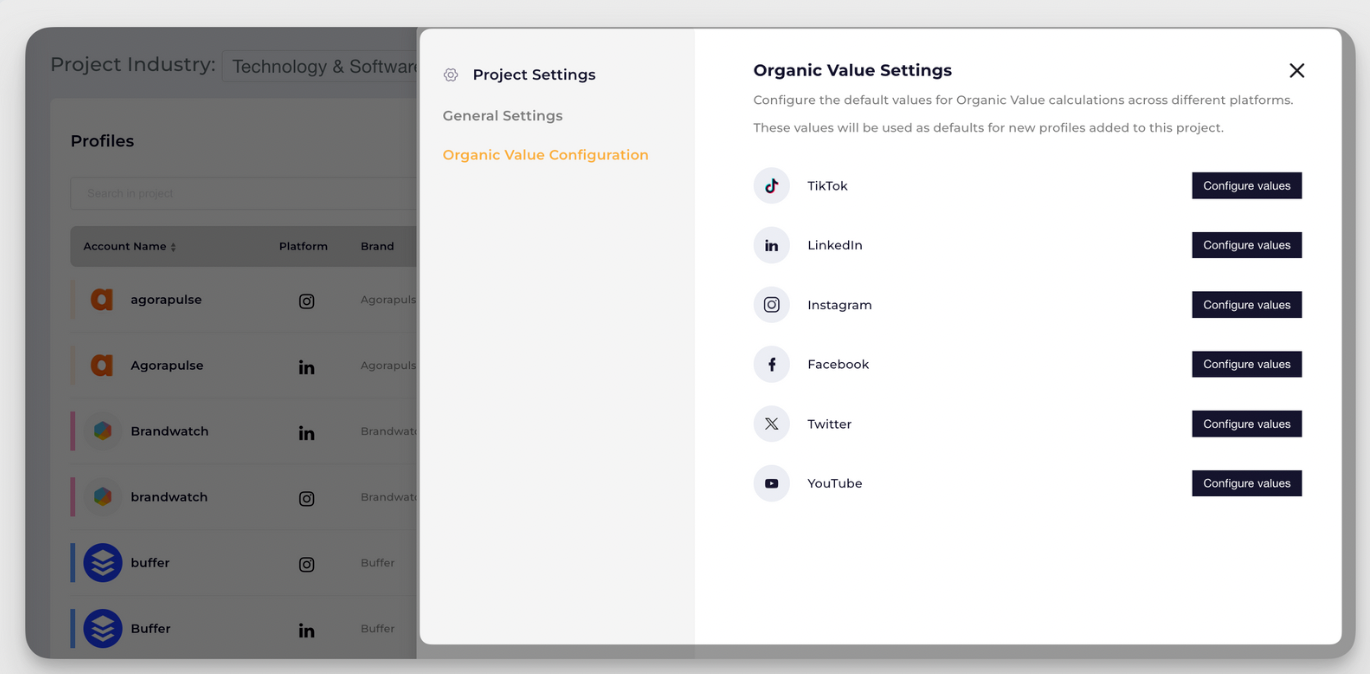
The calculation uses CPM (cost per thousand impressions) and CPE (cost per engagement) benchmarks to estimate what your reach and engagement would cost through paid campaigns. If you already know your own ad costs, you can adjust these values to make the number more accurate for your brand.
Many of my clients use social as a discovery channel rather than a direct sales tool, so ROI can be difficult to measure. In those cases, Organic Value gives a fair estimate of the true worth of your organic work.
Social share of voice
Social share of voice (SOV) shows how visible your brand is in the online conversation compared to your competitors.
Tracking your share of voice is an important part of competitor monitoring, especially in highly competitive industries. It tells you what percentage of your industry’s total mentions belong to you, and not that other guy.
Katie Parkes mentioned in our conversation:
At Apollo, we’re focused on share of voice in the conversation around AI-driven go-to-market. Tracking how we perform against competitors there is really valuable.
A growing share means your message is reaching more people and your visibility is increasing. It also points to how much influence your brand has in shaping opinions and trends within your niche.
Sentiment analysis impact on brand health
Likes and engagement rates are useful, but do you want to know what your audience really thinks about your brand? Then, sentiment analysis is the way to go.
Analyzing sentiment on social media tells you whether the buzz around your brand is positive, neutral, or negative. It shows you how people feel about your brand.
Unlike your performance metrics, it covers more than just your own profiles. Ideally, you want your brand to be talked about outside your own territory and occupy the minds of your audience even when you’re not broadcasting.
Katie Parkes confirms:
Sentiment is still extremely important. It gives us valuable insight when we’re doing social listening — whether that’s understanding how people talk about our platform, what keywords they associate with us, or how often we’re being mentioned over time. It also helps when we’re building or shaping a category. I find it more meaningful to watch sentiment on external posts rather than on our own brand channels.
Sentiment tracking and social listening help you see your true reputation through conversations, comments, and content you didn’t create.
Content pillar performance analysis
Analyzing content pillars helps you understand what topics resonate with your audience and where your creative energy should go next.
When you review your content through this lens, you start seeing trends. Some topics gain traction fast, others fade, and certain formats quietly outperform everything else. Those insights are a gold mine when you’re planning new campaigns or pitching ideas to leadership.
In my experience, tracking how each topic performs is how you move from hunches to a data-driven strategy and create replicable success instead of random viral wins.
Katie Parkes explains that replicating top performers is how her team multiplies social media effectiveness:
When we look at analytics, we go back to which content is getting the most saves and shares. When a post performs well in either of those ways, we’ll try to replicate it — either repost the original a couple of months later, or create a new variation in a similar format but on a different topic. We use those performance signals to guide future creative decisions.
Analyzing your competitors’ content pillars is also a solid move in your social media playbook. You can find patterns and inspiration in there, or outline a direction not worth exploring.
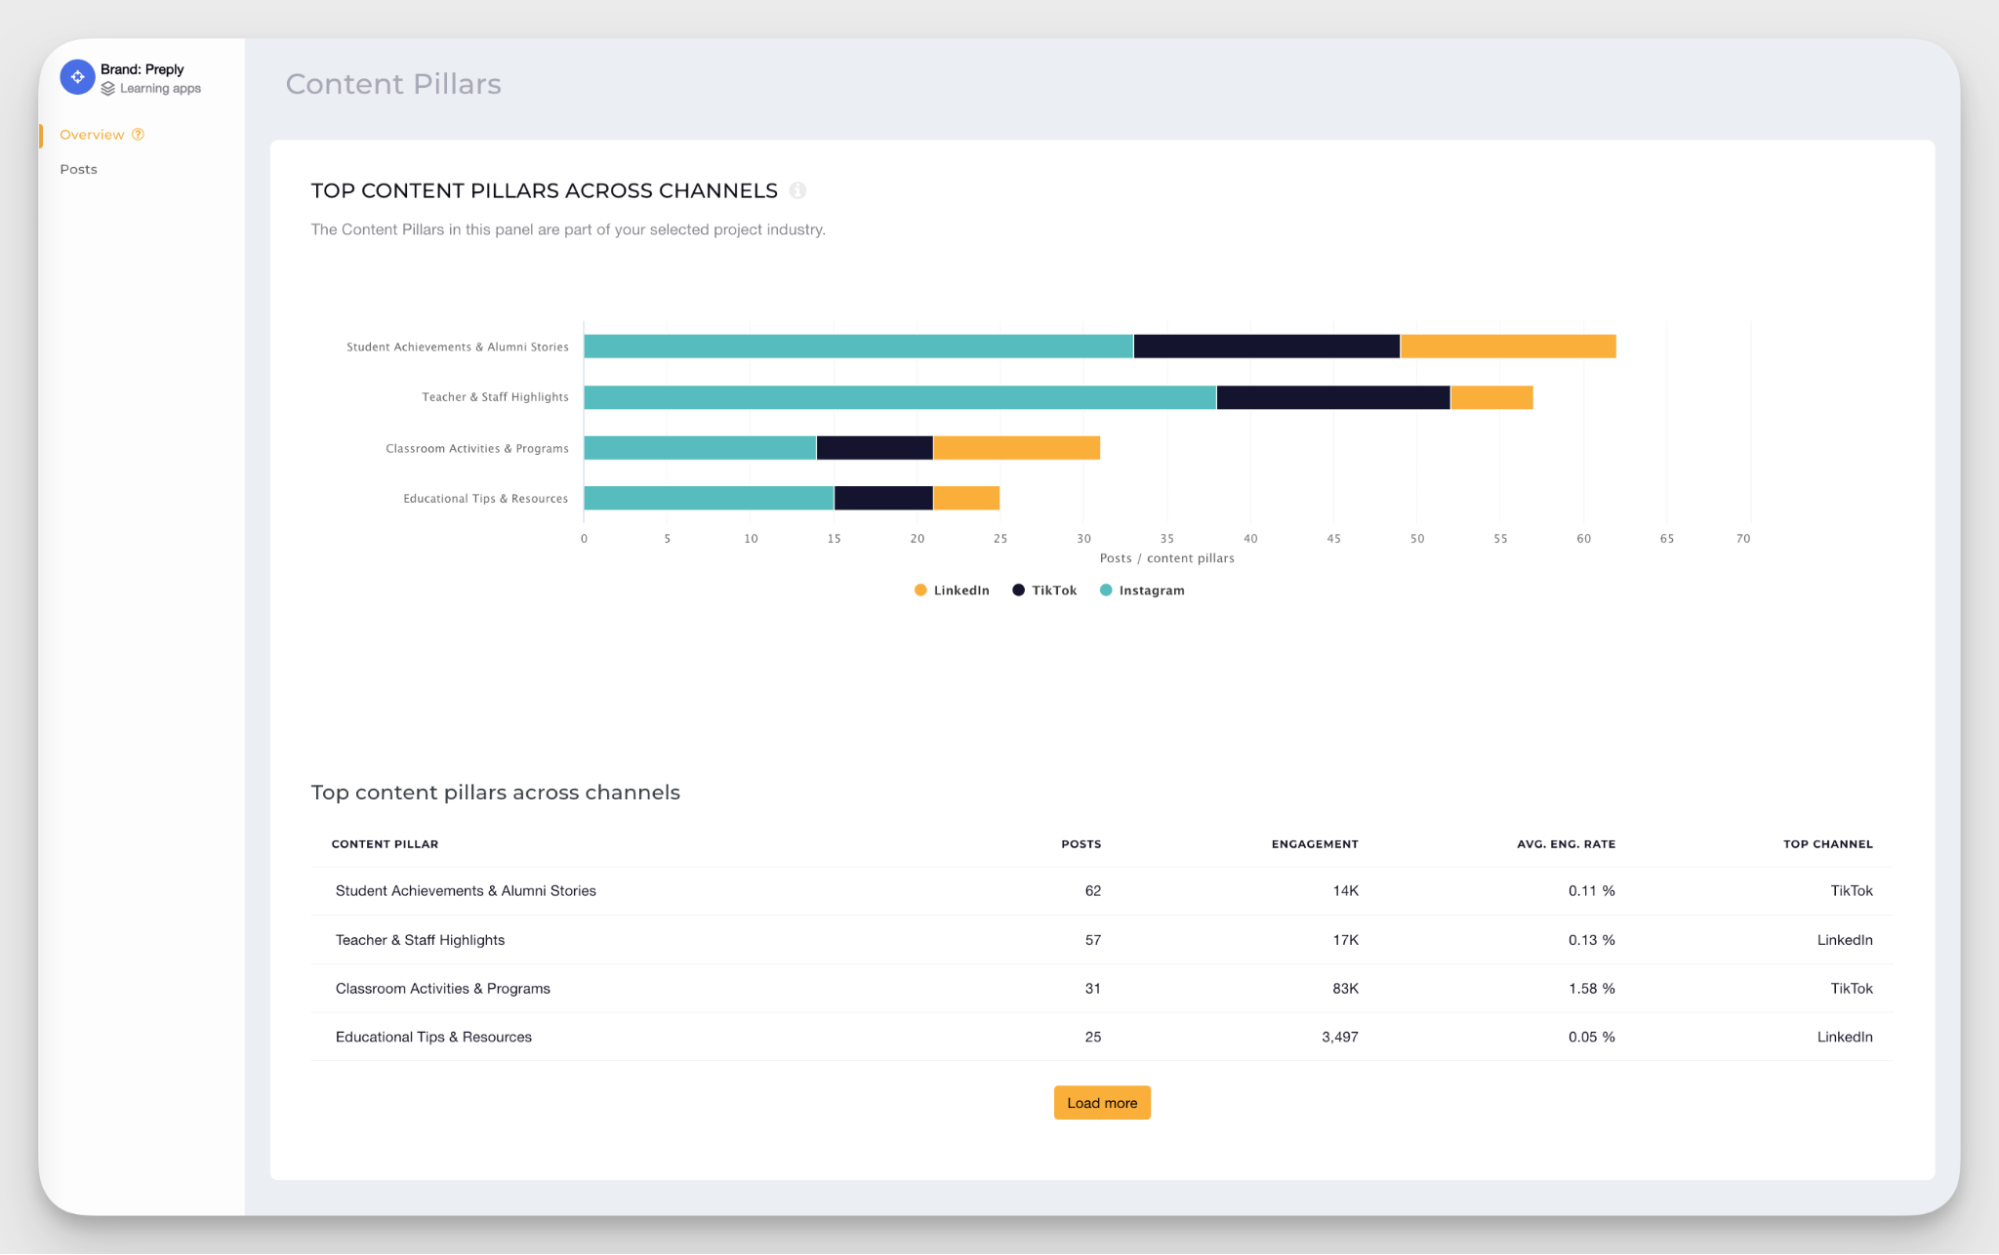
Socialinsider lets you analyze your own content pillars and those of your competitors on one dashboard. You can compare posting volume, engagement rate by pillar, and top-performing themes in a quick snapshot.
Business outcome metrics
In my practice, tying social media results to business numbers has always been the biggest challenge. But this is something that simply needs to be done when evaluating the effectiveness of your social media presence.
If you’re looking for metrics to support your impact on the business as a whole, here’s what to track:
Sales generated via social media
Sales attribution is one of the most powerful ways to prove the value of your work.
But it’s also one of the hardest to track, especially for organic channels. With platforms removing link visibility and pushing in-app content, identifying the role of social media in a customer journey can be tricky.
Still, there are reliable ways to connect sales to social. Start by using UTM parameters on every link you share to trace website traffic and conversions back to specific campaigns.
For B2B, you can also track self-reported attribution. Use your onboarding flow to ask your new leads where they first heard about your brand. Pair this with CRM data to see which social interactions influenced the deal.
Customer lifetime value from social channels
Customer Lifetime Value (CLV) shows how much revenue a customer generates throughout their relationship with your brand. It helps you understand how profitable the relationship with this particular customer is over time.
You can calculate it as:
Average purchase value × Purchase frequency × Average customer lifespan.
CLV is especially valuable for B2B brands, where a single long-term contract can outweigh hundreds of smaller transactions.
For social media, tracking CLV can highlight which channels bring in your most valuable customers, not just the most leads.
For example, I once had a campaign where Facebook brought several times more leads than LinkedIn. But over time, every single LinkedIn lead turned out to have a higher lifetime value — thus, being more profitable — and easily overthrew Facebook impact-wise.
Calculating CLV can give you a good understanding of where to focus your strategy and budget. Combined with attribution data, it shows the lasting business impact of your social media presence.
How to get performance optimization insights based on data?
Data isn’t meant to sit in dashboards. Once you collect your metrics, the next step is to turn them into insights you can act on.
And if your metrics don’t look too bright, don’t get discouraged. That means you have some low-hanging fruits to improve your performance. The key is knowing how to interpret the signals and what to do next.
Here’s what I do to turn data into an action plan:
Analyze user-generated content impact to discover awareness opportunities
User-generated content (UGC) is one of the clearest reflections of brand awareness and community health. When people talk about you, tag your brand, or share content inspired by it, that’s organic advocacy every social media manager dreams about.
Analyzing UGC helps you see how far your message travels beyond your own channels and what kind of stories people tell about your brand.
I always pay attention to which themes or features show up most often in user posts. For example, if a big share of the UGC is praising the UX simplicity of our product, that means it’s a good angle we could lean into more in our own content.
Evaluate content type effectiveness and create an optimization plan based on the findings
Every brand has its own rhythm. What works for one might fall flat for another, even despite being among the hottest best practices of the year.
Take Preply, the online language school, as an example. According to Socialinsider’s Instagram Benchmarks study, carousels tend to perform best overall.
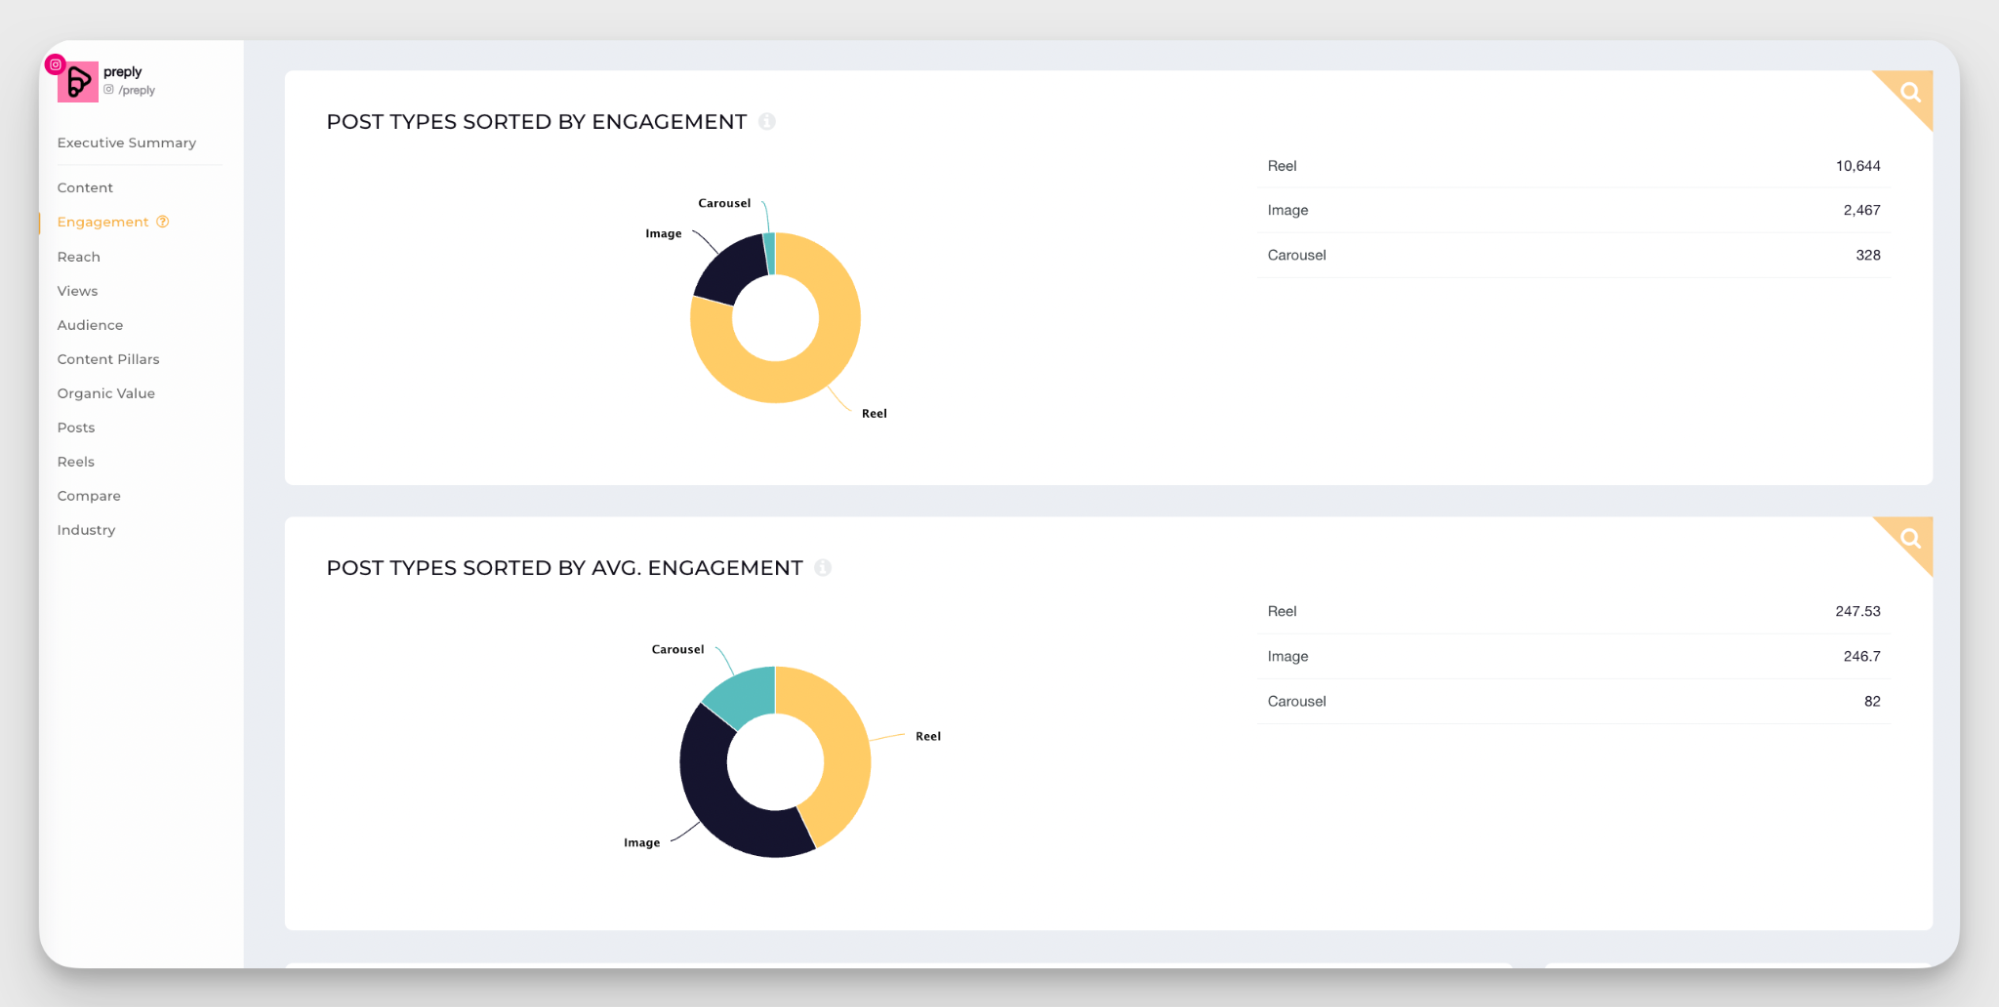
Yet Preply’s most engaging posts fall into either Reels or static image categories. Carousels are the last in average engagement!
Does that mean the benchmark report was wrong? No, it just means that Preply’s audience consumes content differently. And so might yours.
Look at your own data, not just general best practices. See which formats consistently perform better, A/B test small variations, and build an optimization plan that’s based on your specific audience.
Use competitive data to discover best practices in your market
Competitive analysis is one of the fastest ways to find inspiration and identify performance gaps. It shows you what works in your industry and what your audience already expects from brands like yours.
If I were a Preply competitor, I’d want to know which of their posts drive the most engagement and why. When I checked it in Socialinsider, I found that their best-performing content covered slang from multiple different angles.
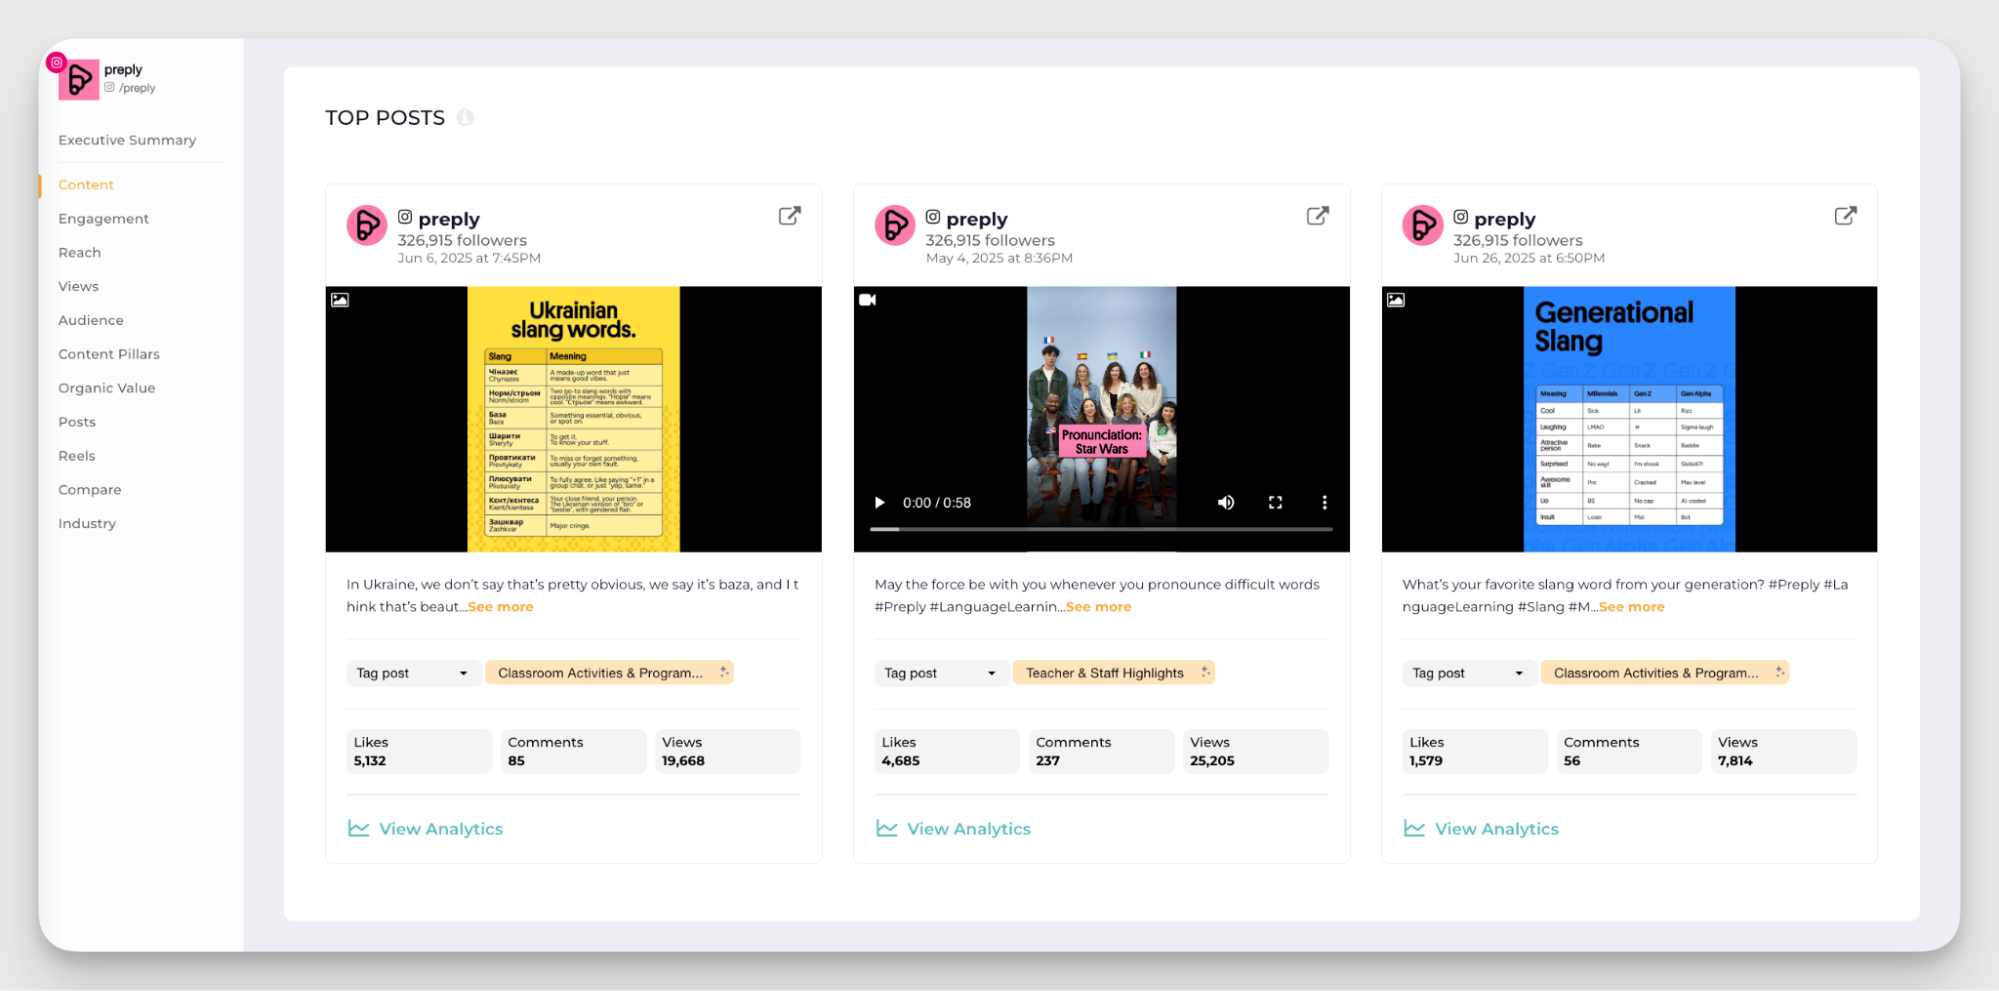
That insight alone tells me what their audience finds entertaining and shareable. And as a competitor, I would be working with a similar audience, so it would be an interesting content format to investigate.
With competitive data, you can benchmark your performance, refine your creative direction, and focus your efforts on trends that already resonate with your target market.
How to create a system to track the effectiveness of your social media?
Tracking all the metrics we’ve covered isn’t a one-time exercise. It’s something you should monitor and refine over time. The key is to make it sustainable — less manual work, more precision, and consistent data.
To do that, you need a proper tracking system. Here’s how I approach it:
Build a measurement framework
Start by setting up solid analytics and tracking. Make sure every post, ad, and campaign is measurable. Add UTM parameters to your links and connect your analytics platform to your CRM so you can clearly see how social contributes to the bigger picture.
Next, implement attribution modeling. Not every conversion will come directly from social, but attribution helps you trace which touchpoints influenced the final decision.
Social media often drives discovery and awareness long before a purchase. So my advice: use models that consider multiple interactions, not just the last click.
Finally, apply competitive benchmarking to set realistic KPIs. This part is crucial to put your goals in context.
Take Preply and italki as an example. Preply has 326K followers and 57.8K engagements, while italki has 109K followers and 9.6K engagements.
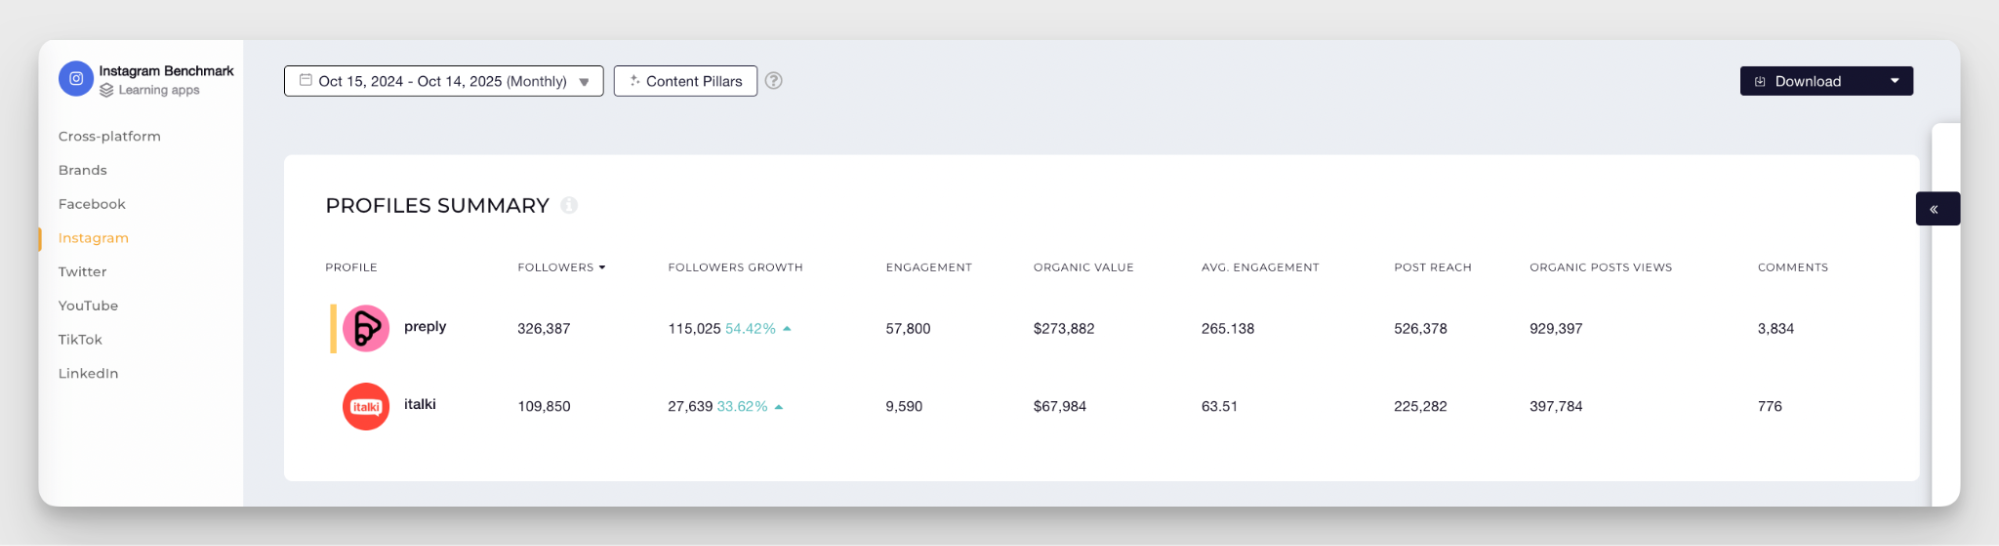
In absolute numbers, Preply is ahead. But when you look proportionally, the picture gets more nuanced.
Italki’s audience is about a third the size of Preply’s, yet its reach is around 43% of Preply’s. This shows strong visibility for its scale. However, its engagement is only about 16% of Preply’s total, meaning its community interacts less actively.
This kind of comparison helps you see more than just who’s bigger. It shows who’s performing efficiently for their size and where there’s room to improve.
Choose the components of your tool kit
Once you have your framework, you need the right tools to keep everything connected. I usually divide them into two essential categories: analytics and listening tools.
Analytics tools
Unless you have a dedicated social media analyst on the team, tracking metrics manually, however precise it can be, takes lots of time. Analytics tools automate data gathering and reporting, making it less time-consuming to keep an eye on your cross-channel strategy.
These tools help you understand how your content performs across multiple channels, compare your performance to competitors, and form reports for stakeholders.
When choosing an analytics tool, look for:
- In-depth metrics. Look for the tool that tracks both traditional metrics like engagement, reach, and impressions, and also more custom ones like Organic Value and content pillar performance.
- Historical data. Access to long-term data lets you track trends and seasonality rather than relying on short-term spikes. Make sure your tool goes back, so you don’t lose valuable data.
- Autoreporting feature. Automated reports save hours of manual work and ensure your stakeholders get updates on time. It also guarantees that the data is consistent from report to report.
- Advanced integrations. The tool should connect with your CRM, ad platforms, and dashboards so you can see a complete view of performance.
Socialinsider covers all of the above, and then some. Besides tracking your own data, you can perform competitor analysis and benchmark your performance from the same dashboard.
Listening tools
Listening tools allow you to look beyond your own accounts. They help you understand what people say about your brand, your competitors, and your industry as a whole.
If you’re on the market for a social listening tool, here’s what to look for:
- Comprehensive coverage. It should monitor multiple sources, including social networks, forums, blogs, and news sites, to give you a full picture of online mentions. Bonus points if it can analyse videos and images.
- Accurate sentiment analysis. Reliable tone detection helps you interpret whether the conversations around your brand are positive, negative, or neutral.
- Advanced filtering and keyword tracking. Filters for language, hashtags, location, and topics make it easier to focus on the most relevant insights. It also allows you to fine-tune your search queries so you don’t track irrelevant mentions.
- Real-time alerts and reporting. Instant notifications and exportable reports allow you to act fast on emerging opportunities or potential crises.
Final thoughts
Evaluating your social media effectiveness is not a type of thing you do once in a while. It’s an ongoing process where you track data, interpret the signals, and take action based on your findings.
With a structured framework and the right set of metrics, you can see not just how your social media performed last week, but how it’s evolving over time.
Socialinsider is a solid addition to your analytical stack, with competitor insights and in-depth analysis of the content performance. Grab the 14-day free trial and check for yourself — no strings attached!
FAQs on social media marketing effectiveness
What is the 50-30-20 rule for social media marketing?
he 50/30/20 rule for social media marketing is a resource allocation framework designed to help brands strategically prioritize their efforts across different platforms:
- 50% of resources should be dedicated to your primary social media platform, where your target audience is most active and engaged. This is where you are likely to see the highest return on investment.
- 30% of resources should go to your secondary platform, which targets a different segment or serves a complementary marketing purpose.
- 20% of resources should be reserved for experimenting with new or emerging platforms, features, or strategies to stay innovative and adaptable.
This rule helps ensure optimal focus while still allowing for diversification and testing of new channels.
Kseniia Volodina
Content marketer with a background in journalism; digital nomad, and tech geek. In love with blogs, storytelling, strategies, and old-school Instagram. If it can be written, I probably wrote it.
Analyze your competitors in seconds
Track & analyze your competitors and get top social media metrics and more!
You might also like


Improve your social media strategy with Socialinsider!
Use in-depth data to measure your social accounts’ performance, analyze competitors, and gain insights to improve your strategy.