YouTube Shorts Analytics Guide: How to Better Analyze Your Shorts’ Performance
Discover essential insights with our YouTube Shorts analytics guide. Master metrics to enhance your video strategy and boost viewer engagement.


I’ve lost count of how many YouTube Shorts I’ve watched just before bed and somehow ended up 40 videos deep at 2 AM. Turns out, I’m not alone.
Shorts have exploded, and brands are finally catching up. But with short videos come short attention spans and the need for sharper analytics. That’s where things get interesting.
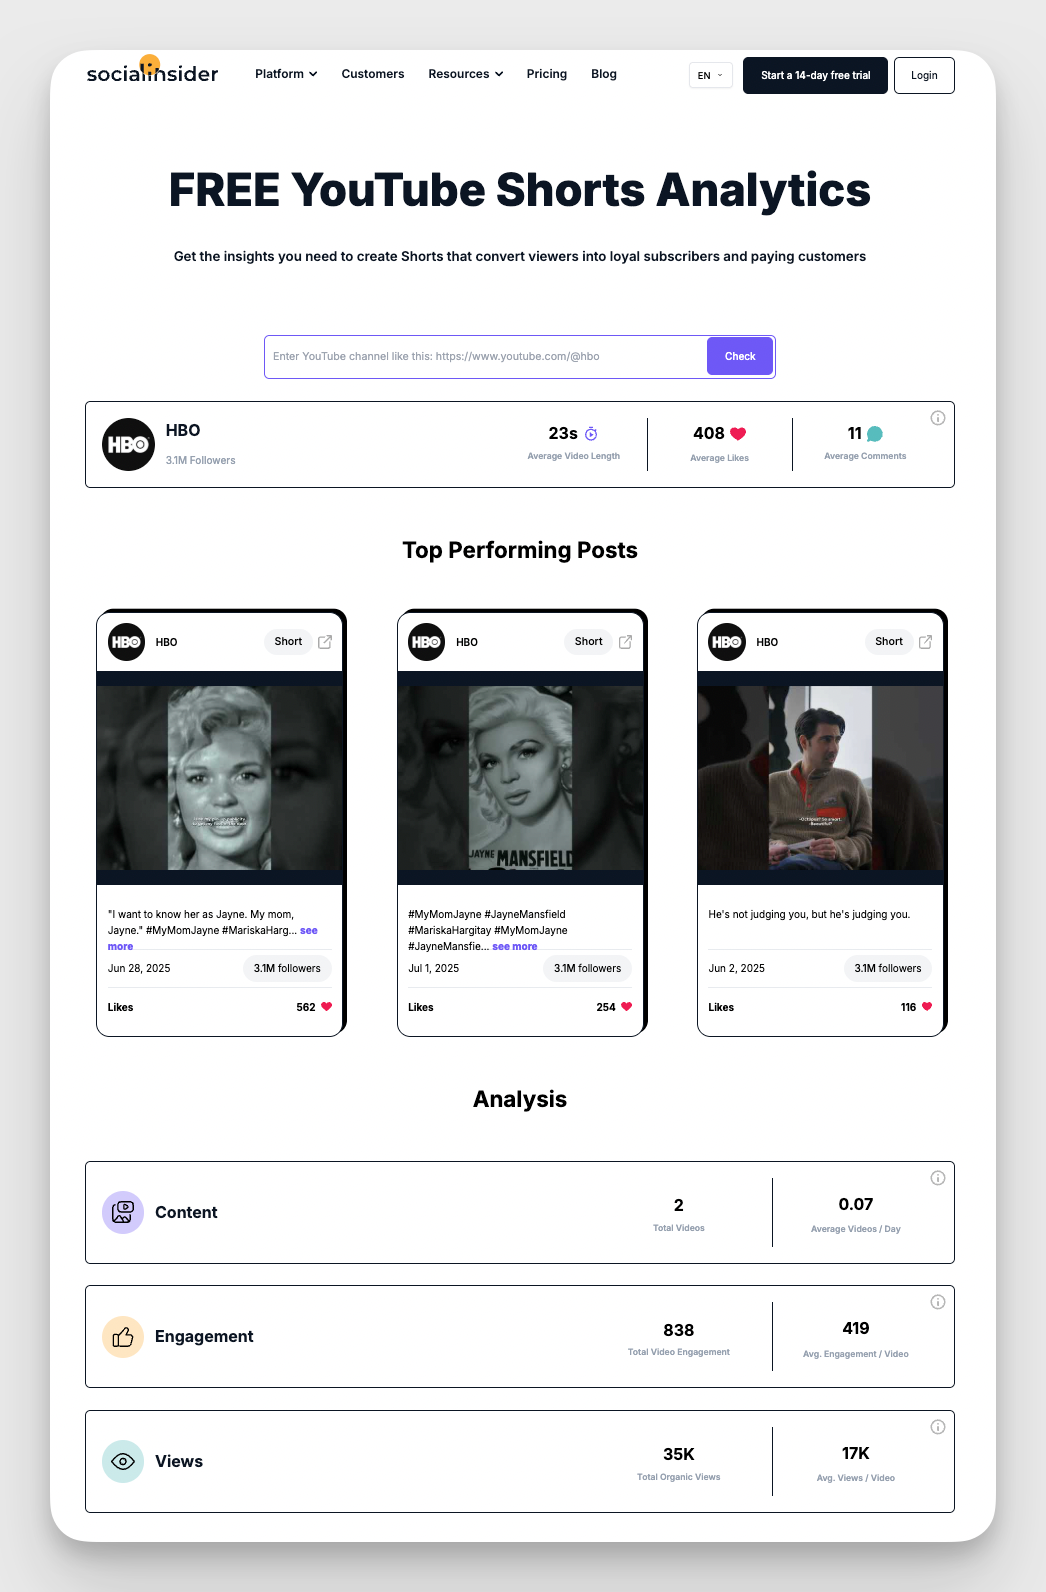
At Socialinsider, we’re mildly obsessed (read: completely hooked) on turning fleeting views into real insights. I have also been digging into how brands can measure what actually works on Shorts, beyond likes and views.
To level things up, I spoke with Thom Gibson, a YouTube strategist and former social media lead at Kit, who’s built a 44K+ subscriber base on his own channel. Between his insights, our team’s findings, and examples, here’s the breakdown on YouTube Shorts analytics.
Key takeaways
-
Differences vs. long-form YouTube analytics: Shorts don’t play by the same rules as long-form—retention and swipes matter more than thumbnails and CTR.
-
YouTube Shorts analysis tools: Native YouTube analytics show what’s happening inside the platform, while tools like Socialinsider reveal the bigger picture.
-
Best practices for creating engaging Shorts: Strong hooks, fast payoffs, and clear CTAs keep viewers watching—and subscribing.
Why is measuring the performance of YouTube Shorts becoming increasingly important?
YouTube Shorts had already reached 153 million monthly U.S. users in 2023 and is expected to reach 192 million by 2026. It can become a major shift in the way users consume content on YouTube.
But for a while, measuring their performance felt like guesswork. I remember trying to figure out why one Short blew up while another flopped, and the data just wasn’t there.
Thankfully, YouTube’s 2023 analytics update changed that. We can now track feed impressions, view-vs-swipe rates, and Shorts-specific audience demographics.
Here are three key reasons to analyze these metrics:
- Understand what your audience actually enjoys. View-vs-swipe rates and retention data reveal what keeps viewers watching (or scrolling away).
- Test and refine content types. Experiment with formats, hooks, and styles and Shorts metrics will show you what sticks.
- Spot content trends early. YouTube analytics help you see what’s gaining traction so you can jump on trends before they peak.
How do Shorts analytics differ from regular YouTube video analytics?
While regular YouTube videos focus on metrics like watch time, click-through rate (CTR), and average view duration, Shorts play by a different set of rules. Here’s how they differ:
- Impressions work differently. Shorts impressions are counted only when a video is seen in the Shorts feed, not when it appears in search or suggested videos.
- View vs Swipe metrics. Shorts analytics include a unique “views vs swipes” metric that shows how many people actually watched your Short instead of swiping past it.
- Short-form retention is key. For Shorts, the first few seconds matter more than ever. YouTube doesn’t track CTR from thumbnails here, the hook has to hit immediately.
- Different engagement signals. Looping, replays, and quick engagement matter more in Shorts than traditional YouTube metrics like watch percentage or end screen clicks.
Thom looks at YouTube Shorts in a very different way from long-form videos. Here’s what he had to say.
With Shorts, audience retention is everything. If people don’t stick past the hook, the rest of the video doesn’t matter. That’s the main metric I focus on — the retention graph. It tells you whether the hook is strong enough to stop the scroll and keep viewers watching. Unlike long-form content where traffic sources, click-through rates, and suggested views matter more, Shorts are almost entirely driven by the Shorts feed. So you need to win viewers in the first few seconds.
How to access your YouTube Shorts analytics?
You can access analytics for Shorts on both desktop and mobile. Let’s check out the step-by-step process for each.
Access YouTube Shorts analytics on desktop
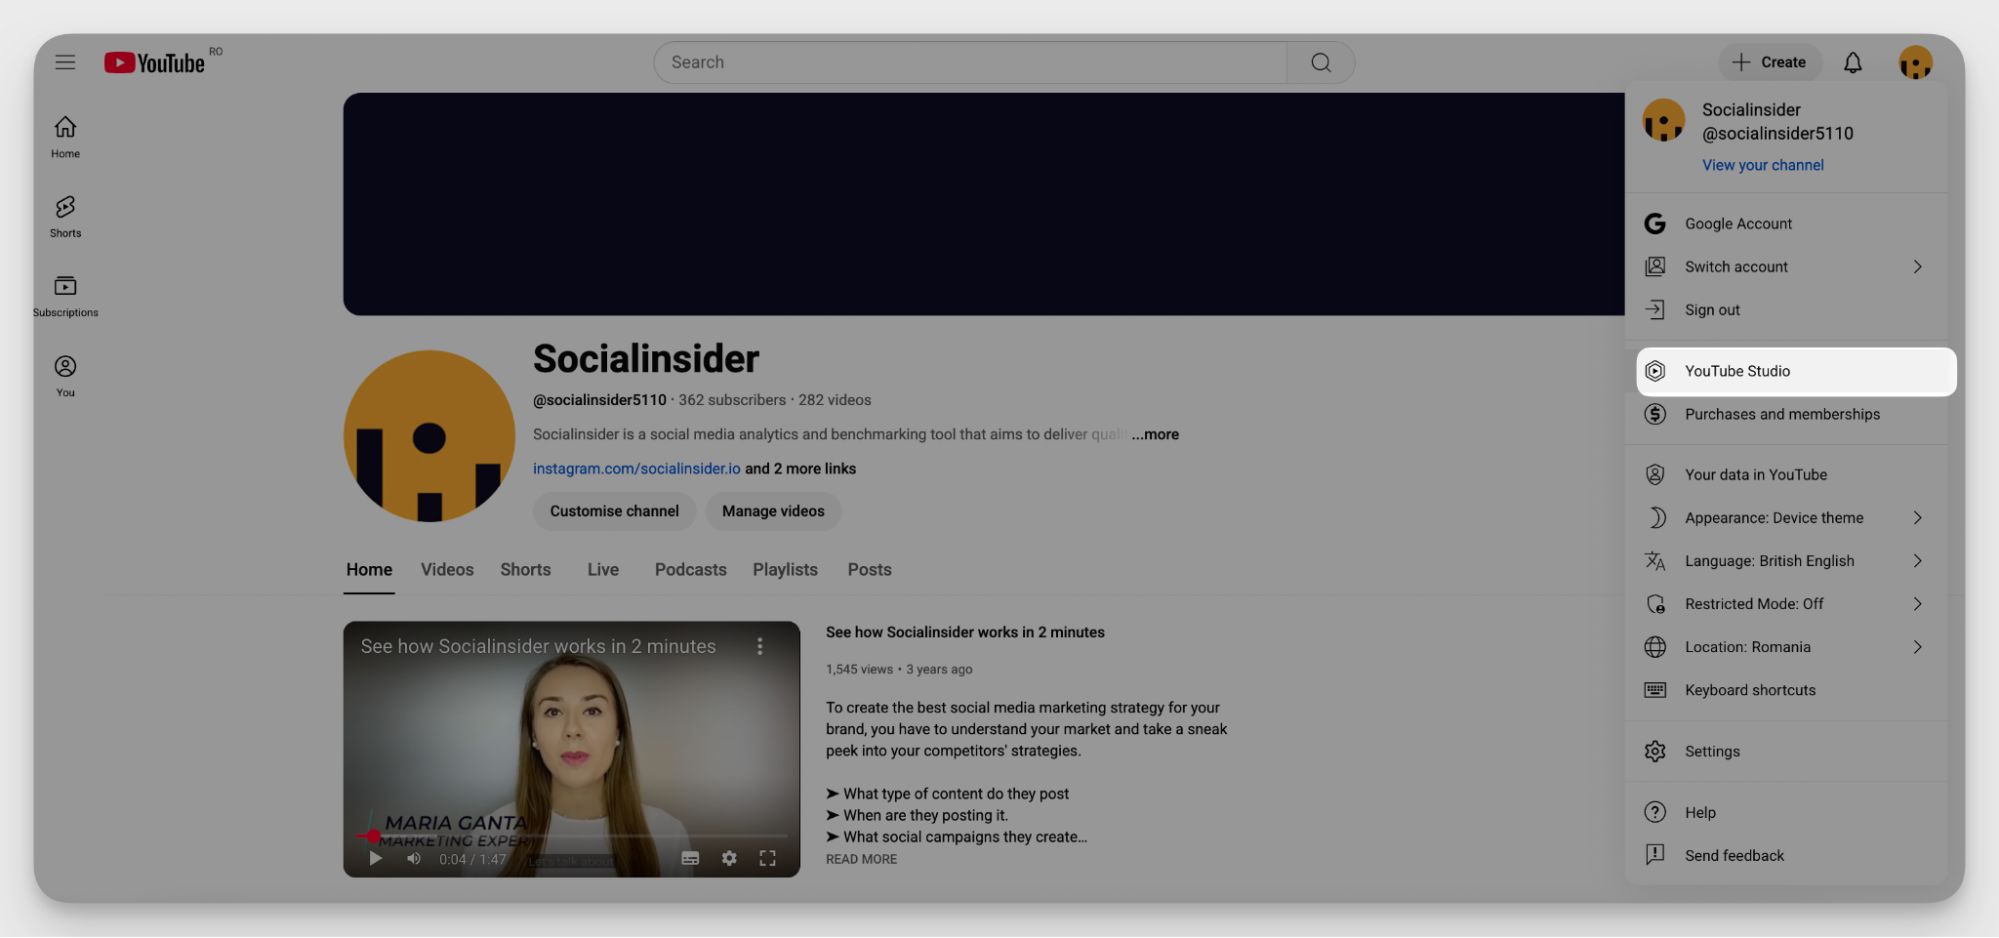
- Log into YouTube. Click on your page logo to find YouTube Studio. Or directly head to YouTube Studio with this link.
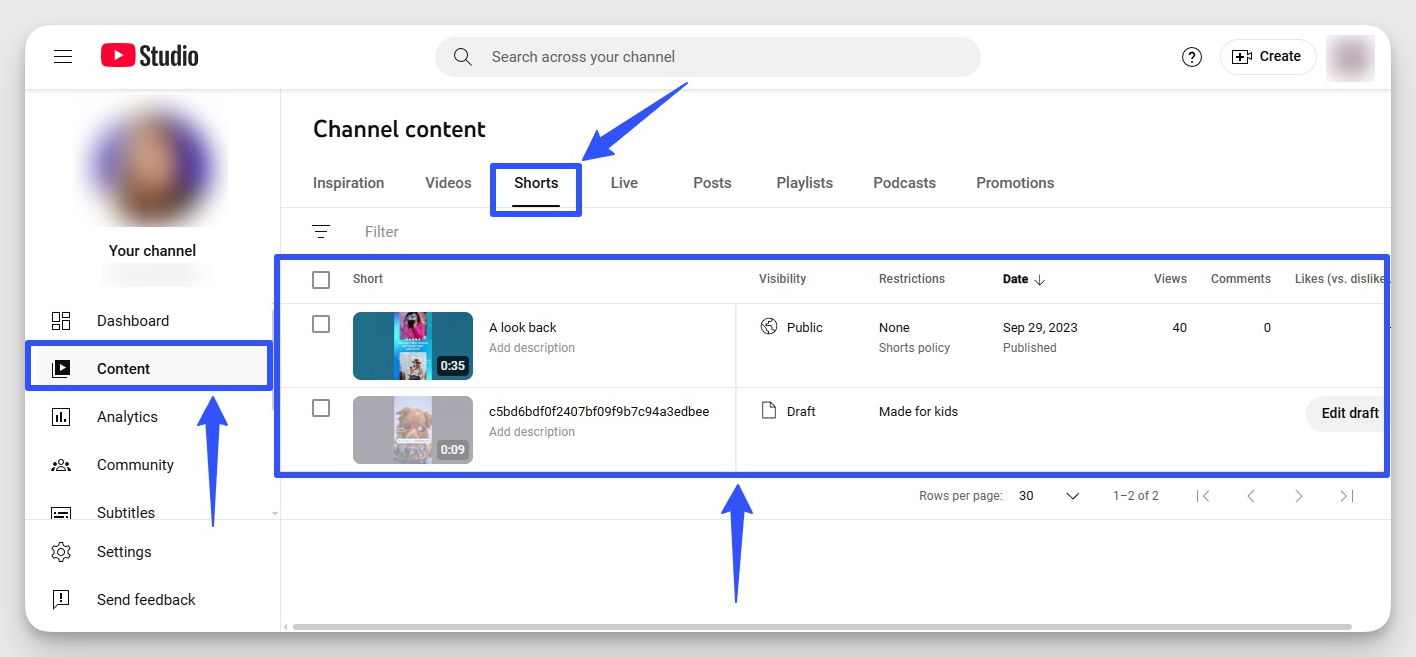
- In the left-hand menu, click on the Content tab to see all videos on the channel. Navigate to the Shorts tab to view only short-form content.
- Hover over the Short you want to analyze and click on the Analytics icon (it looks like a little graph).
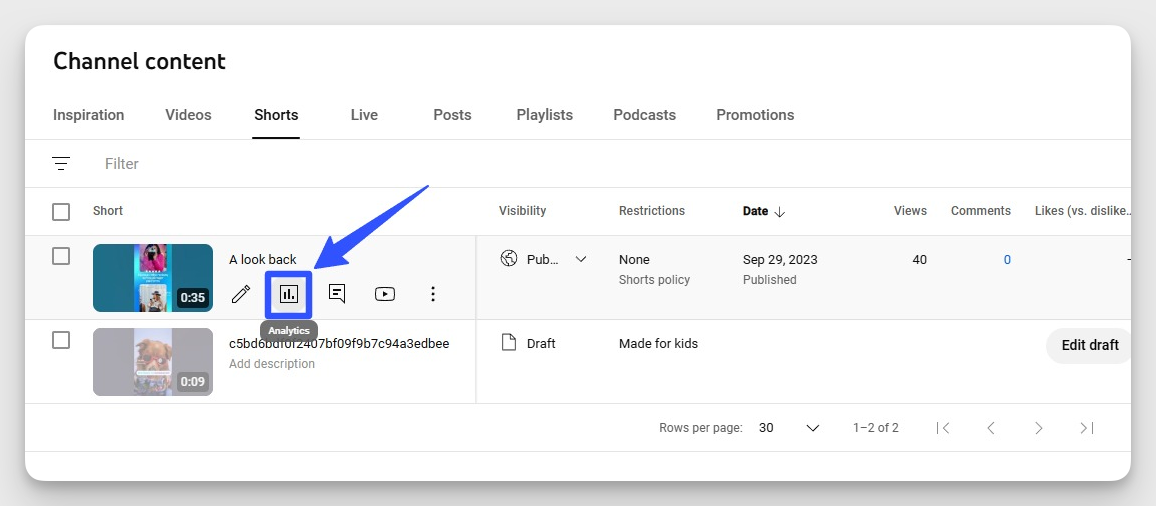
- You’ll land on the Shorts analytics overview page, which shows key data like reach, engagement, and audience details.
- For advanced YouTube Shorts data, click Advanced Mode to unlock filters, comparisons, groups, and customizable charts for deeper insights.
Access YouTube Shorts analytics on mobile
- Open the YouTube Studio app on your phone. If you don’t have it yet, download it from the App Store or Google Play.
- Sign in using your or your client’s account credentials.
- Tap Analytics at the bottom of the screen.
- Go to Shorts to get detailed analytics
Which YouTube Shorts analytics to monitor?
We break down key Shorts metrics into four pillars for easy and streamlined tracking.
Reach analytics and how to use them
- Impressions: The number of times your Short was shown in the Shorts feed.→ Use this to gauge how well your content is being surfaced by the algorithm.
- Views: Counts when someone watches your Short for more than a few seconds.→ Compare average YouTube Shorts views to impressions to understand how engaging your scroll-stopping moment is.
- Engaged views: Counted when someone watches your Short for at least 30 seconds (or to the end, if it’s shorter). → Track engaged views alongside total views to see how many viewers moved from just stopping to actually staying
- Traffic sources: Shows where viewers are finding your Shorts (e.g., feed, browse, external).→ Use this to see which platforms, placements, and search terms are driving the most discovery.
- Swipe vs view ratio: Tells how often people stopped to watch instead of swiping past.→ A low ratio means your hook may need work. Test new intros or visuals to improve it.
- Watch time: Total number of minutes viewers have spent watching your Short.→ Use this to measure overall content value. More watch time means stronger viewer retention.
Engagement analytics and how to use them
- Likes: The number of viewers who tapped the thumbs-up on your Short.→ A strong like count signals immediate viewer approval. Compare across Shorts to spot what resonates.
- Average View Duration: The average time viewers spent watching your Short.→ Use this to understand how engaging your content is and how long you’re holding attention.
- Shares: Shows how many people shared your Short via YouTube or other platforms.→ High share counts often indicate viral potential. Look for common patterns in share-worthy content.
Performance analytics and how to use them
- Subscribers gained: Tracks how many new subscribers a specific Short brought in.→ Use this to spot which Shorts are not just getting views, but actually growing your channel.
- Grouped performance: Compares multiple Shorts by category, format, or theme.→ Use this to test content experiments. For example, group Shorts by “voiceover” vs. “talking head” to see which style gets more engagement or retention.
- Top shorts: Shows your best-performing Shorts based on views, engagement, or subscriber gain.
→ Use this to reverse-engineer success. Dissect what worked in terms of format, hook, timing, and visuals, then apply those Shorts performance insights to new content strategy.
- Top remixes: Shows which of your Shorts are being remixed most by other creators.
→ Use this to spot which formats, sounds, or ideas inspire others. Then double down on that style to spark more community-driven reach.
Advanced analytics to evaluate your Short’s strategy effectiveness
- Audience retention: This metric shows how long people stay glued to your YouTube Short and more importantly, where they lose interest. By analyzing this metric, you can find out what keeps your audience hooked and what causes them to move on to the next Short.
While describing audience retention, Thom mentioned how it can have a cascading effect on different metrics.
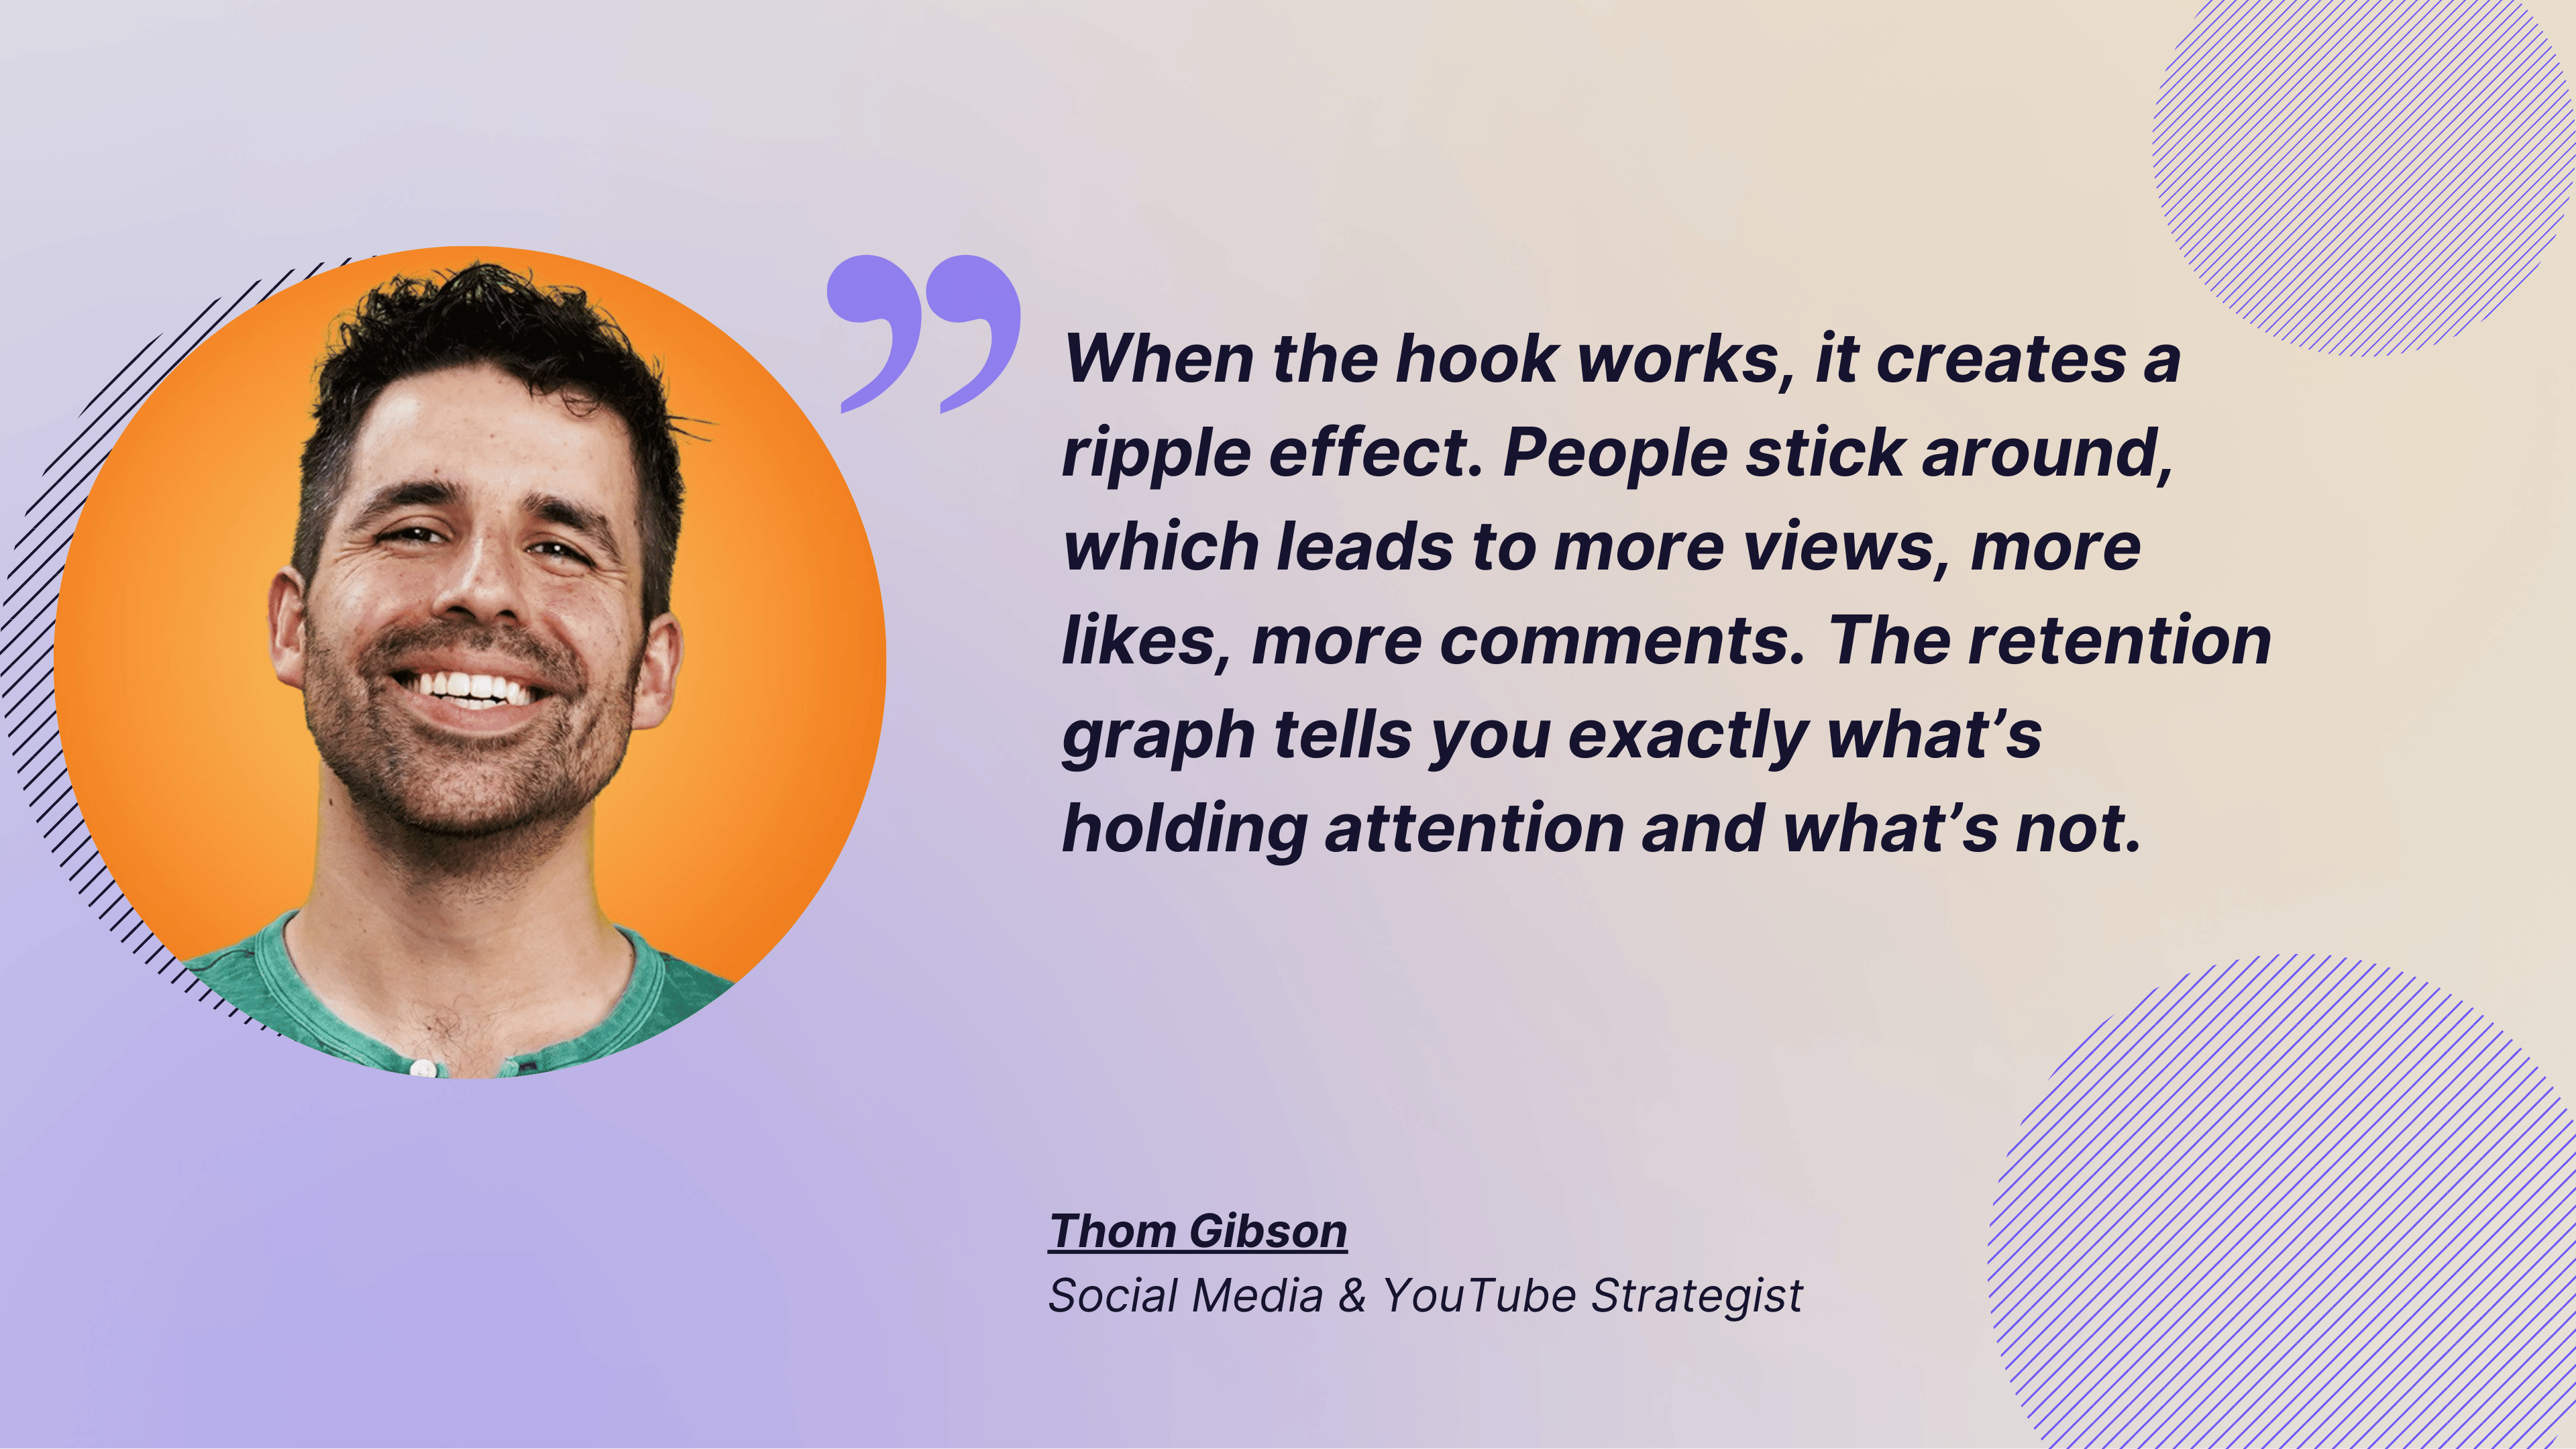
Audience retention is the primary metric I track. Can you get them past the hook? And then for the videos that you do get them past the hook, where do they drop off? If you don’t get them past the hook, you need to keep finding ways to iterate and compel people. When the hook works, it creates a ripple effect. People stick around, which leads to more views, more likes, more comments. The retention graph tells you exactly what’s holding attention and what’s not.
- Comments: Comments are a window into what your audience is thinking, not just what they’re watching. While Shorts don’t always rack up long replies, a spike in comments often signals content that sparked emotion, curiosity, or controversy. Look beyond the count: Are viewers asking questions? Tagging friends? Debating something? That’s social media content worth studying and replicating.
For deeper insight, compare your Shorts to see which ones consistently generate conversation.
- Average views per video: Average views per video show how consistently your Shorts are performing. It’s a strong indicator of whether you’re hitting the mark video after video, not just going viral once.
To calculate it:
- Go to YouTube Studio > Analytics > Advanced Mode.
- Filter by Content type: Shorts.
- Choose a date range (For example, last 30 days).
- Note the total views.
- Count how many Shorts were published in that timeframe.
- Divide total views by number of Shorts.
Tools for YouTube Shorts analytics tracking
YouTube’s native analytics
YouTube’s native analytics for Shorts are impressively comprehensive. They let you see exactly where viewers drop off, compare retention across videos, track swipe vs. view rates, and identify which Shorts drive the most subscribers.
The ‘Compared to other videos' view quickly highlights underperformers, while advanced filters break down results by geography, device, and traffic source. I like using it to spot patterns that keep viewers engaged.
However, since native analytics only shows what happens inside YouTube, complementing it with third-party tools for cross-platform trends and competitive benchmarks gives a fuller, more strategic view.
Third-party analytics tools — Socialinsider
In one sentence, Socialinsider gives you what YouTube’s native analytics misses out on. Wondering what? Here are four things.
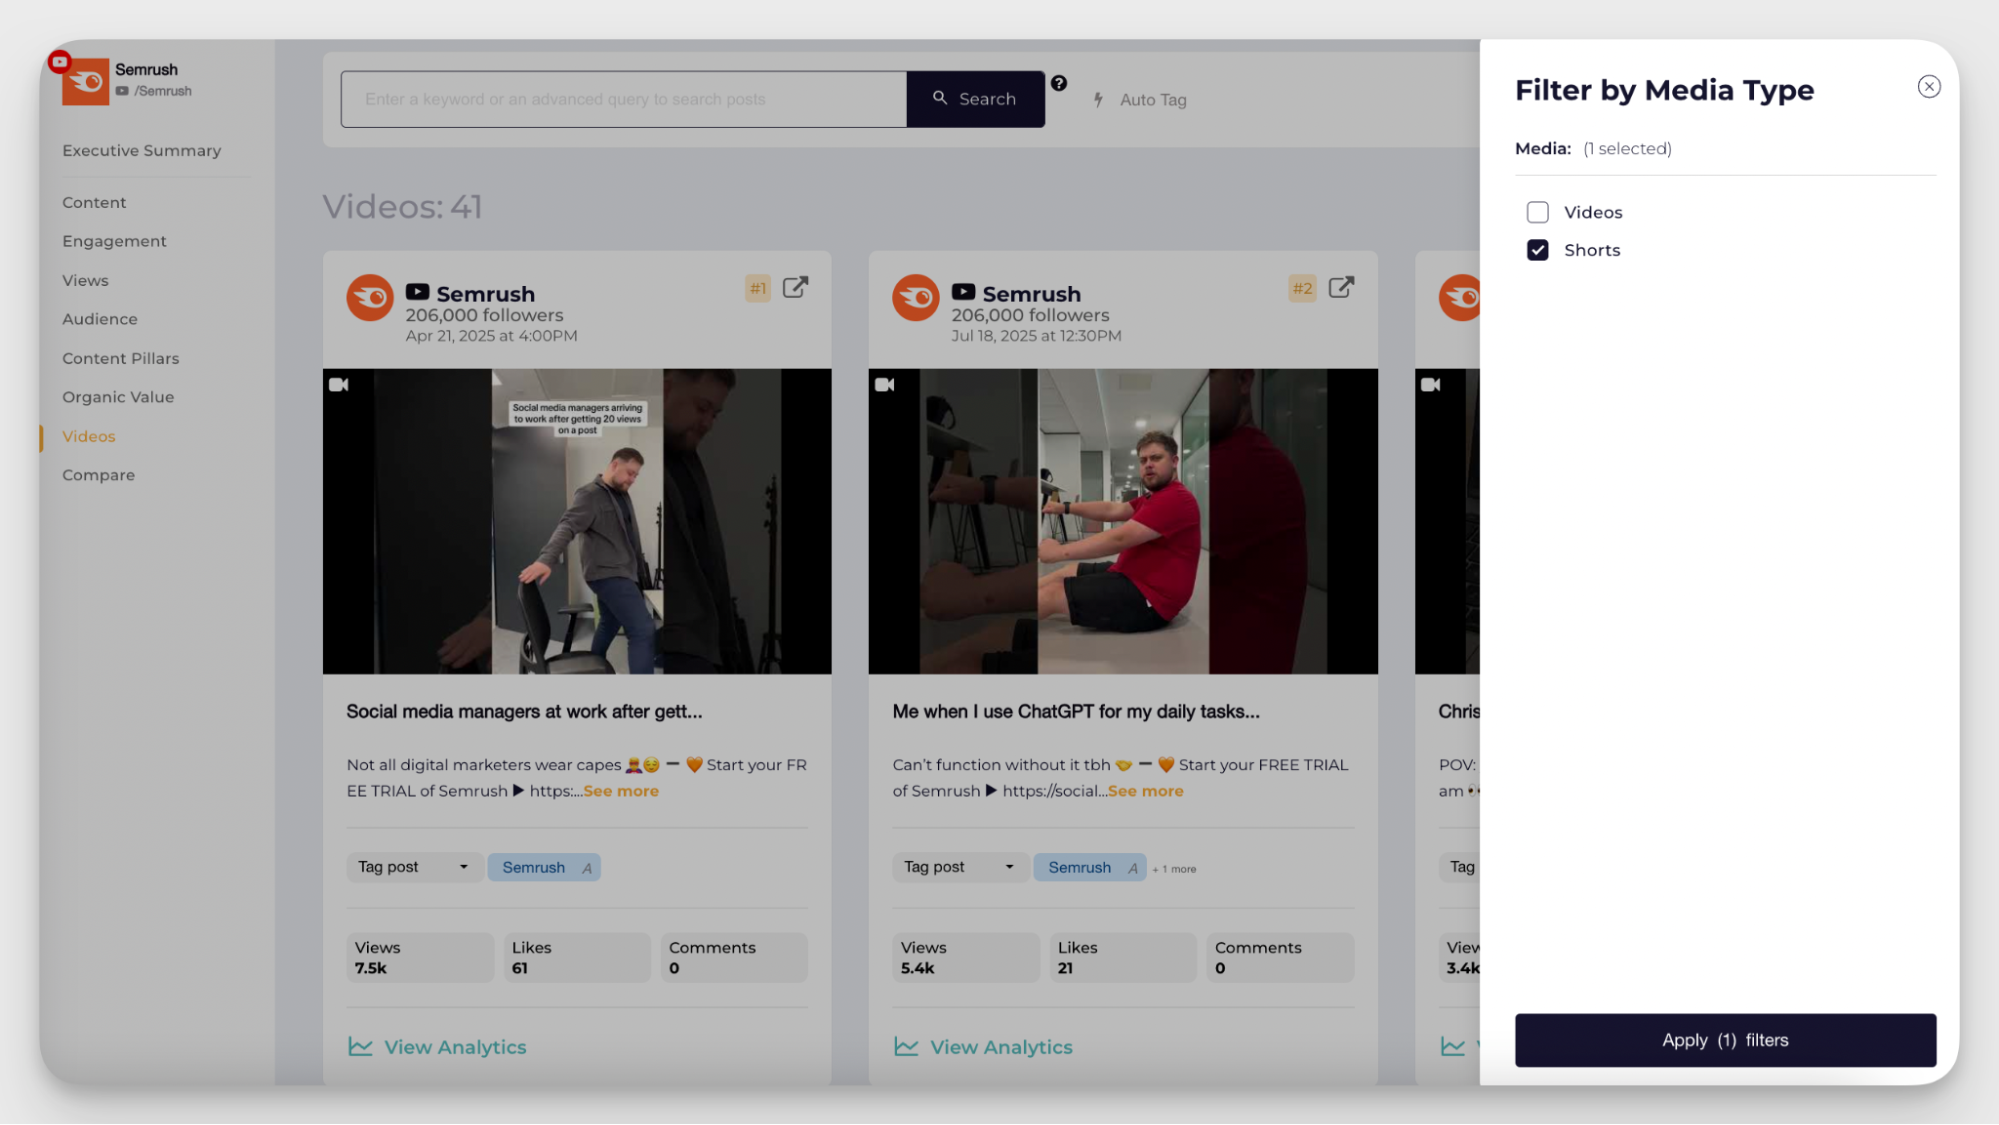
- Track detailed performance for each Short, including views, engagement trends, and organic value.
- Assign content pillars and see which content pillars gets you the most engagement in Shorts
- Analyze growth in subscribers for a specific period.
- Benchmark performance against competitors or industry averages.
I also use it for comparing cross-channel performance. For example, uploading similar content on Instagram Reel vs. YouTube Short and seeing what really strikes better with my audience.
How to use your Shorts analytics to optimize your strategy
Tracking the right data is only half the job, the real work is in acting on it. I start by breaking down my top performers and identifying repeatable patterns:
- Hook strength: Which openings get viewers past the 3-second mark? Use that to test variations to see what keeps them watching.
- Thumbnail appeal: Track which colors, text styles, and expressions drive higher click-through rates.
- Retention clues: Study the exact moments viewers drop off. Figure out whether it was pacing, repetitive answers, or a weaker segment?
Thom talked about tweaking the content based on retention graph
With my man-on-the-street interview videos, I noticed dips in retention when answers got repetitive. Almost everyone said ‘collaboration’ to one question, and by the fourth answer, viewers dropped off. On YouTube’s retention graph, I can see if a video is outperforming our normal retention. If it is, I know how to dial in on what worked, whether it’s the hook, the question, or the pacing, so I can iterate for the next Shorts.
Best practices for creating engaging YouTube Shorts
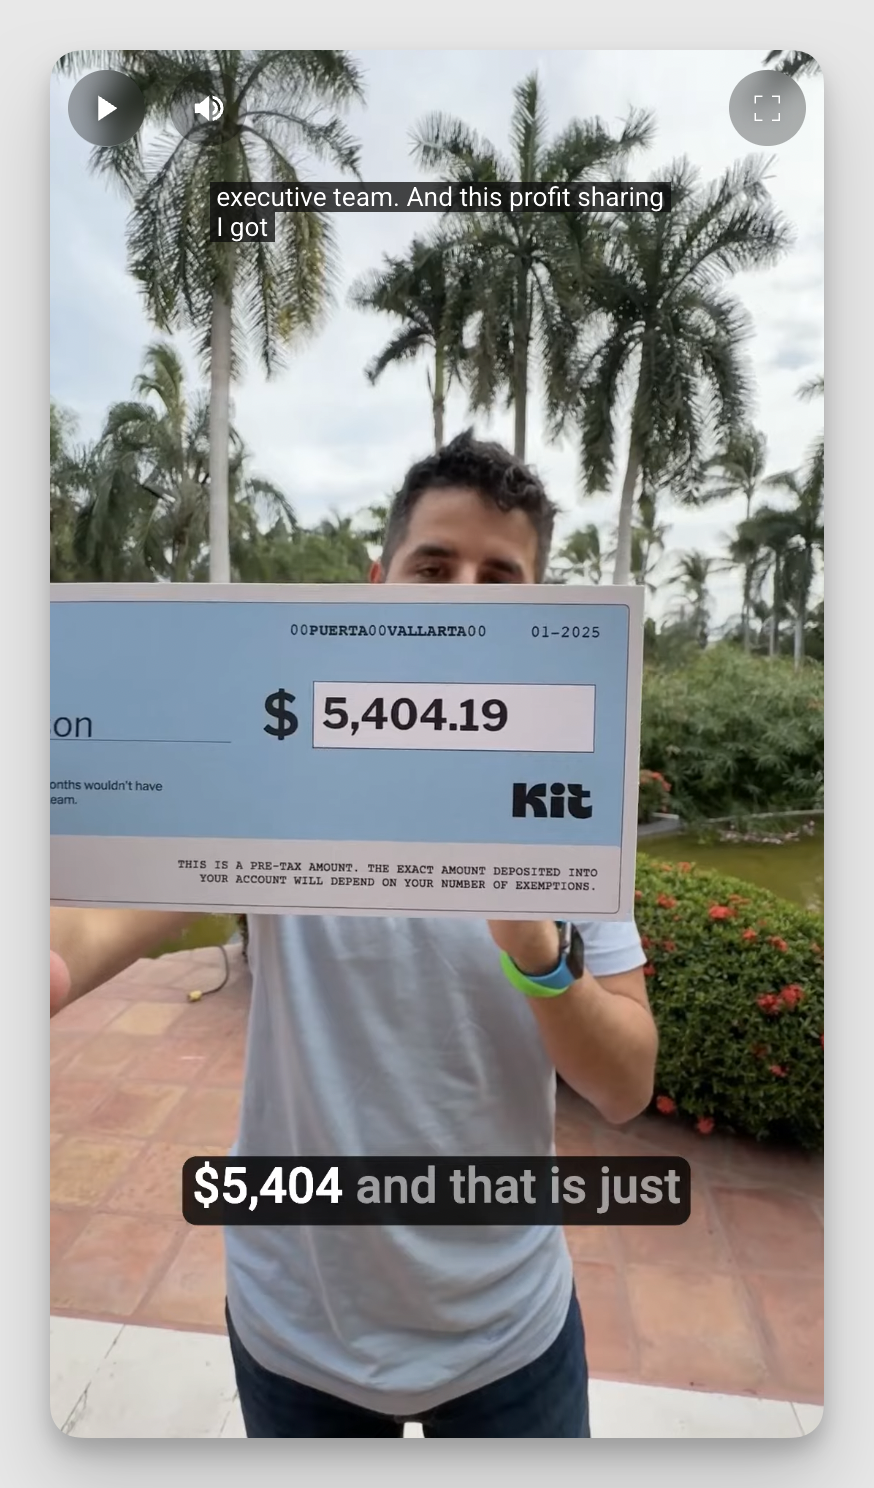
- Keep viewers hooked with suspense: Build curiosity by teasing a payoff early and making them wait for the reveal. Here’s how Thom did it for a profit sharing video for Kit.
When I made a video about our company’s profit sharing, I planned every detail to build curiosity. Picture this: palm trees, a pool in the background, me holding a sealed envelope with the text ‘What every Kit employee gets two times a year.’ In the video, I slowly open it to reveal the exact amount: $5,743. That moment was the payoff. Looking back, I should have ended right there for maximum retention. Your job is to make viewers stick around for the reveal and then cut when they’ve got what they came for.
Here’s the YouTube Short Thom is referring to.
- Use visual, audio, and text elements in the hook: Stack compelling visuals, sound design, and captions right from the start. Make sure the story is clear even if someone watches on mute.
- Deliver value quickly: Don’t drag the setup. Whether it’s a big reveal, a tip, or a punchline, get to it fast to keep momentum high.
- End with a strong call-to-action Direct viewers to the next step: subscribe, watch another Short, or click the link, before they swipe away.
Final thoughts
Think of every Short as a test. Some will flop, some will fly—but if you track the right metrics, you’ll always know why. That’s how you build not just fleeting views, but a channel that keeps growing. In a world where a few seconds can make or break your content, the smartest brands are the ones who measure, learn, and tweak—over and over again.
Nidhi Parikh
Nidhi Parikh is SaaS writer that believes scrolling through social media is research for work. When not working, find her binge watching the latest series or reading anything she can get her hands on.

Analyze your competitors in seconds
Track & analyze your competitors and get top social media metrics and more!
You might also like


Improve your social media strategy with Socialinsider!
Use in-depth data to measure your social accounts’ performance, analyze competitors, and gain insights to improve your strategy.