Social Media Reporting Best Practices to Impress the Upper Management During Meetings
Discover essential social media reporting best practices that will impress upper management and showcase your team's effectiveness and strategic value.


After hearing strategist after strategist complain that their social reports get ignored by leadership, I started digging into why.
Turns out, leaders do care about social. But we just need to speak their language in our reports. For example, while we’re busy showing engagement rates, they’re looking for business impact, not vanity metrics.
So, if your reports are met with polite nods and quick glances, don’t worry. I’ve rounded up 11 practical social media analytics reporting best practices that’ll help you turn those static social media analytics dashboards into stories leadership actually pays attention to.
Key takeaways
-
Link social metrics to business outcomes → Show leadership how social activity directly drives revenue, pipeline, or client results—not vanity metrics.
-
Align reporting cadence with decision moments → Deliver reports when leadership is actively making strategic decisions so your insights can influence them.
-
Integrate cross-platform benchmarks → Use competitor and industry benchmarks to give your numbers context and prove where you truly stand in the market.
-
Tell a cause-and-effect story → Connect your social actions to real business results through clear narrative chains and funnel visuals.
-
Use data visualization to build credibility → Keep visuals clean and simple so leadership can instantly grasp trends and their business meaning.
-
Simplify and automate reporting workflows → Automate data collection to free up time for analysis while maintaining consistent, insight-driven reporting.
-
Translate insights into strategic recommendations → Always pair your metrics with actionable next steps so decision-makers know what to do next.
-
Build a culture of data-driven teams → Make social insights visible across departments to strengthen alignment and drive smarter, scalable decisions.
-
Segment the analysis → Break performance down by platform, format, and audience to uncover what’s truly driving (or dragging) results.
-
Combine qualitative data → Add context by explaining why metrics moved, using sentiment and content insights to enrich the story.
-
Implement quality and consistency standards → Keep reports uniform in structure, definitions, and methodology so leadership can trust and easily navigate them.
Social media reporting best practices for effective upper management presentations
#1. Link social metrics to business-relevant outcomes
Across hundreds of customer interviews, one thing I heard in common was – “We need to prove social media value to leadership.”
But it’s not as simple as saying, “Hey, we clocked in 10% more engagement this quarter.” Because most execs don’t care that your engagement rate went up 10%. They care what that 10% actually did for the business.
Here’s what I recommend doing instead:
- Report social results in terms of pipeline or client outcomes. This could mean showing what the uptick in engagement resulted in. For example, our engagement uptick on LinkedIn correlated with a 15% lift in inbound demo requests.
I generally reverse-engineer this by understanding the business's goals and then creating the social media report by connecting social metrics to those goals.
Teddy Abdelnour, head of integrated marketing at TEAM LEWIS, talked about the same. He said:
Anything tied to impact matters — cost per engagement, lead quality, content efficiency. For instance, during the OPPO Find X9 launch, we measured how much reach we generated per dollar spent.

- Use UTM-tagged links and CRM integrations. Focus on whatever connects your campaigns to actual leads or conversions. Tools like HubSpot or Salesforce make it easy to map a social click all the way to a closed deal. When you can say, “LinkedIn generated $20K in new pipeline this quarter,” you’ve earned instant credibility.
- Flip how you frame your data. Ditch questions like “Which post performed best?” and start asking “Which post brought us the most qualified traffic?” or “Which channel contributed most to revenue?”
#2. Align reporting cadence with decision moments
Timing can make or break how your social reports land with leadership. You can have the sharpest insights and the slickest visuals, but if they hit inboxes when decisions have already been made, they’ll barely make a ripple.
The key is to sync your reporting cadence with decision moments. Think recurring checkpoints when budgets, campaigns, or client renewals are under review.
For example, many of our customers use Socialinsider dashboards during quarterly board reviews to back up spend and social media strategy.
Here’s how to make that happen:
- Align reports with core business cycles. Time your reports around quarterly revenue reviews, client retention meetings, or campaign ROI evaluations. That’s when leadership is actively looking for answers your data can provide.
For instance, if your Q2 LinkedIn engagement spike overlaps with a rise in demo bookings, showcase that in the quarterly revenue meeting.
- Automate freshness. Build recurring dashboards that auto-refresh right before review meetings. No one wants a Q3 report with Q2 data.
- Show social signals that predict sales. For example, highlight how spikes in brand mentions or engagement often precede upticks in signups or conversions. This shows social as a leading indicator instead of a lagging one.
#3. Integrate cross-platform data
Let’s get real — looking at your Instagram results in isolation only tells a piece of your brand’s story. If you want to see where your social presence truly stands, you need to integrate data from every channel — LinkedIn, Instagram, TikTok, YouTube, Facebook — for a unified, actionable view.
Here’s what that looks like in practice:
- Aggregate the data: Instead of separate reports, pull together numbers for total engagement, combined reach, and audience growth across platforms. This lets you answer big questions like, “How did our brand actually perform this quarter, everywhere we showed up?”
- Channel-specific breakdowns: Sure, overall results matter — but you’ll also want to know the details. For example, I track engagement rate per platform, followers gained per network, and post frequency by channel.
- Specific KPIs, side by side: I always compare essential metrics like engagement rate and and followers — broken down by channel. This highlights strengths (“TikTok reels get double the engagement of other formats”) and gaps that deserve attention.
#4. Leverage competitive benchmarks
Say you know how you’re doing on Instagram, but do you know how your content stacks up to your competitors—across every channel, all in one view? That’s where Socialinsider’s cross-channel competitive benchmarking comes in. It’s not just about counting likes and comments; it’s about understanding the bigger picture, fast.
Here’s how I put it to work:
- Benchmark basic metrics, side by side: I can pull engagement rates, number of posts, reach, impressions, and views for both my brand and any competitor—and do it across all major platforms. No more single-channel comparisons; I see, at a glance, if we’re leading on TikTok but getting outpaced on Instagram.
- Surface deeper content insights: Numbers are only the starting point. With Socialinsider, I dive straight into what’s actually performing for our competitors. Which posts are getting the most traction? What content formats—carousels, videos, stories—are cutting through the noise? These insights show me exactly where our creative approach is winning (or lagging).
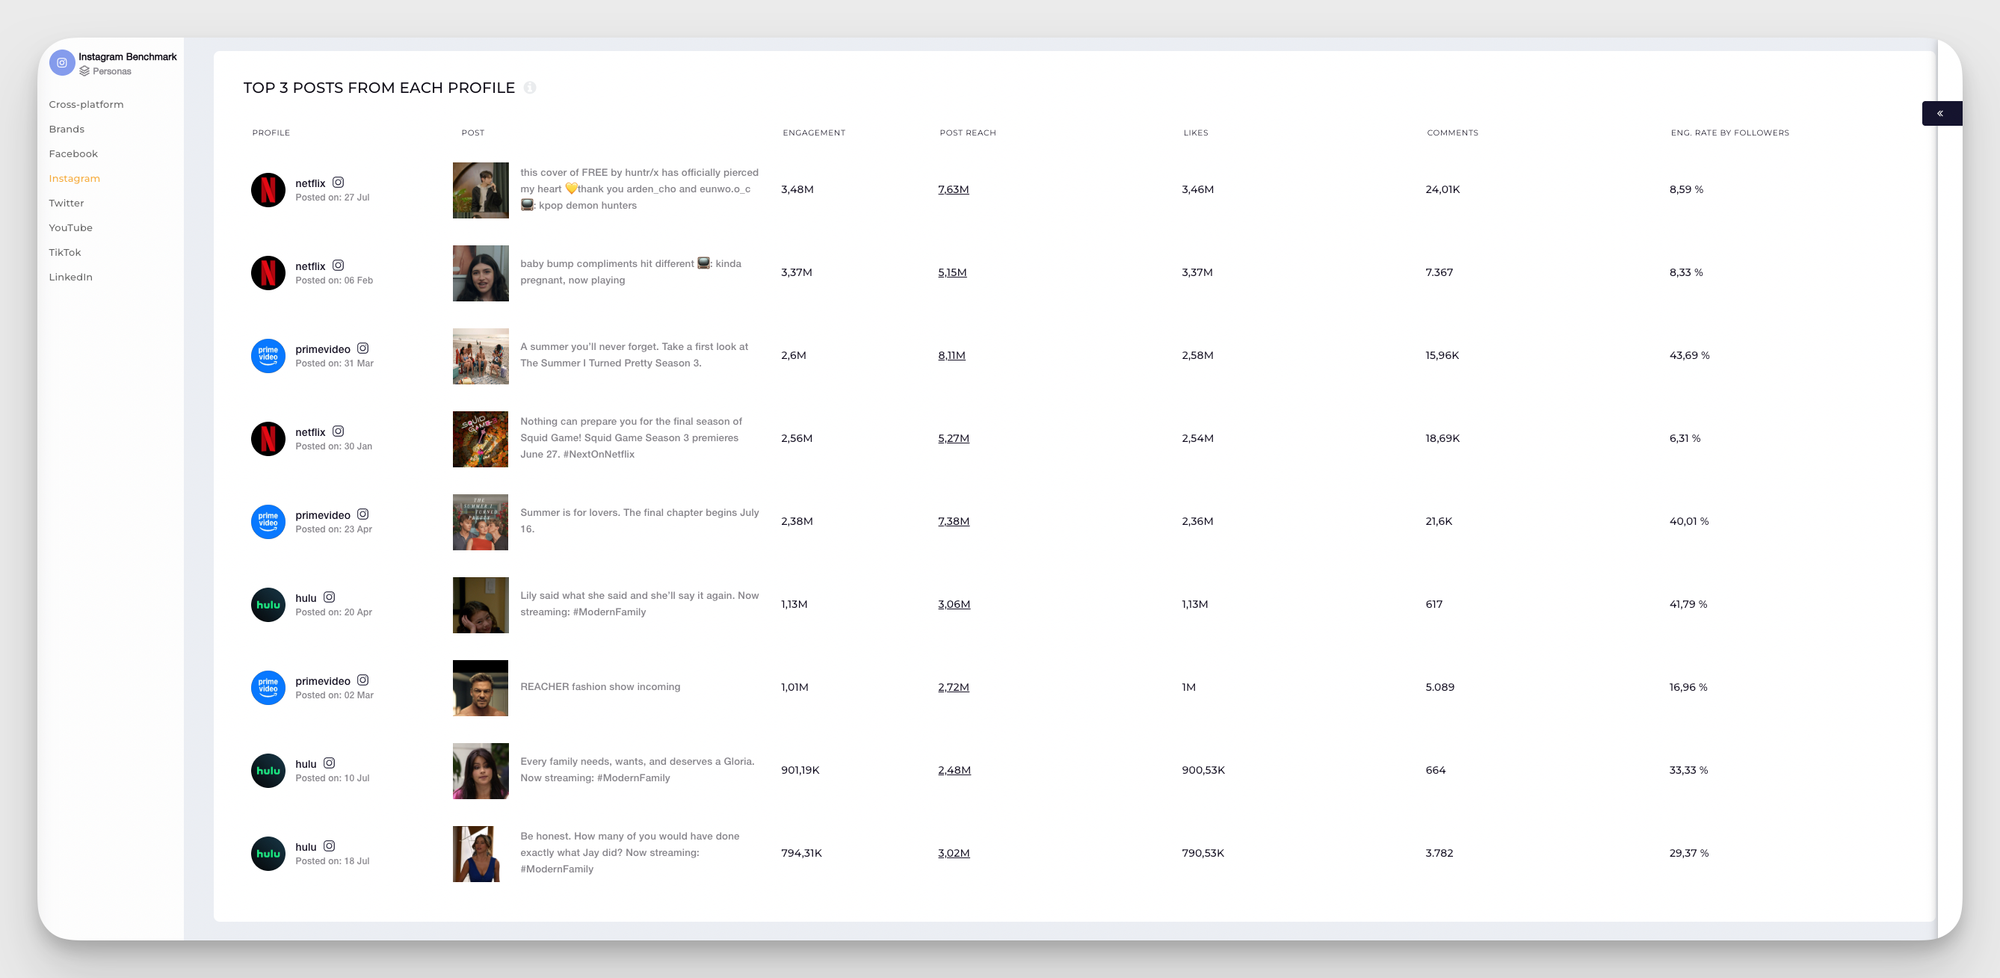
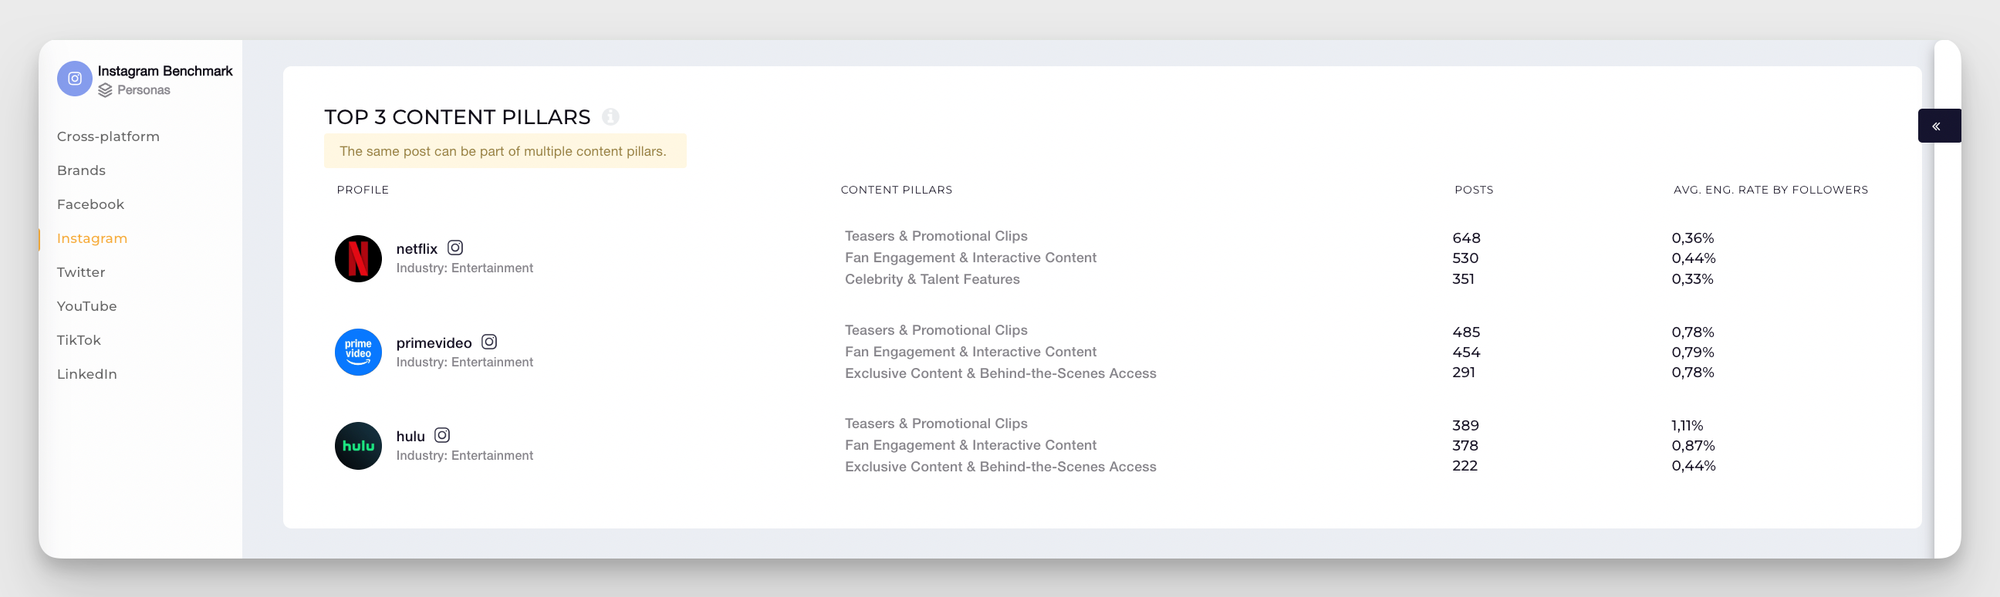
- Analyze content pillars across the board: It goes beyond ‘what works’; I can break down which content pillars—product launches, community stories, tips & tricks—move the needle for both us and our market rivals. This lets me see where competitors are doubling down, or where white space exists for our own brand voice to shine.
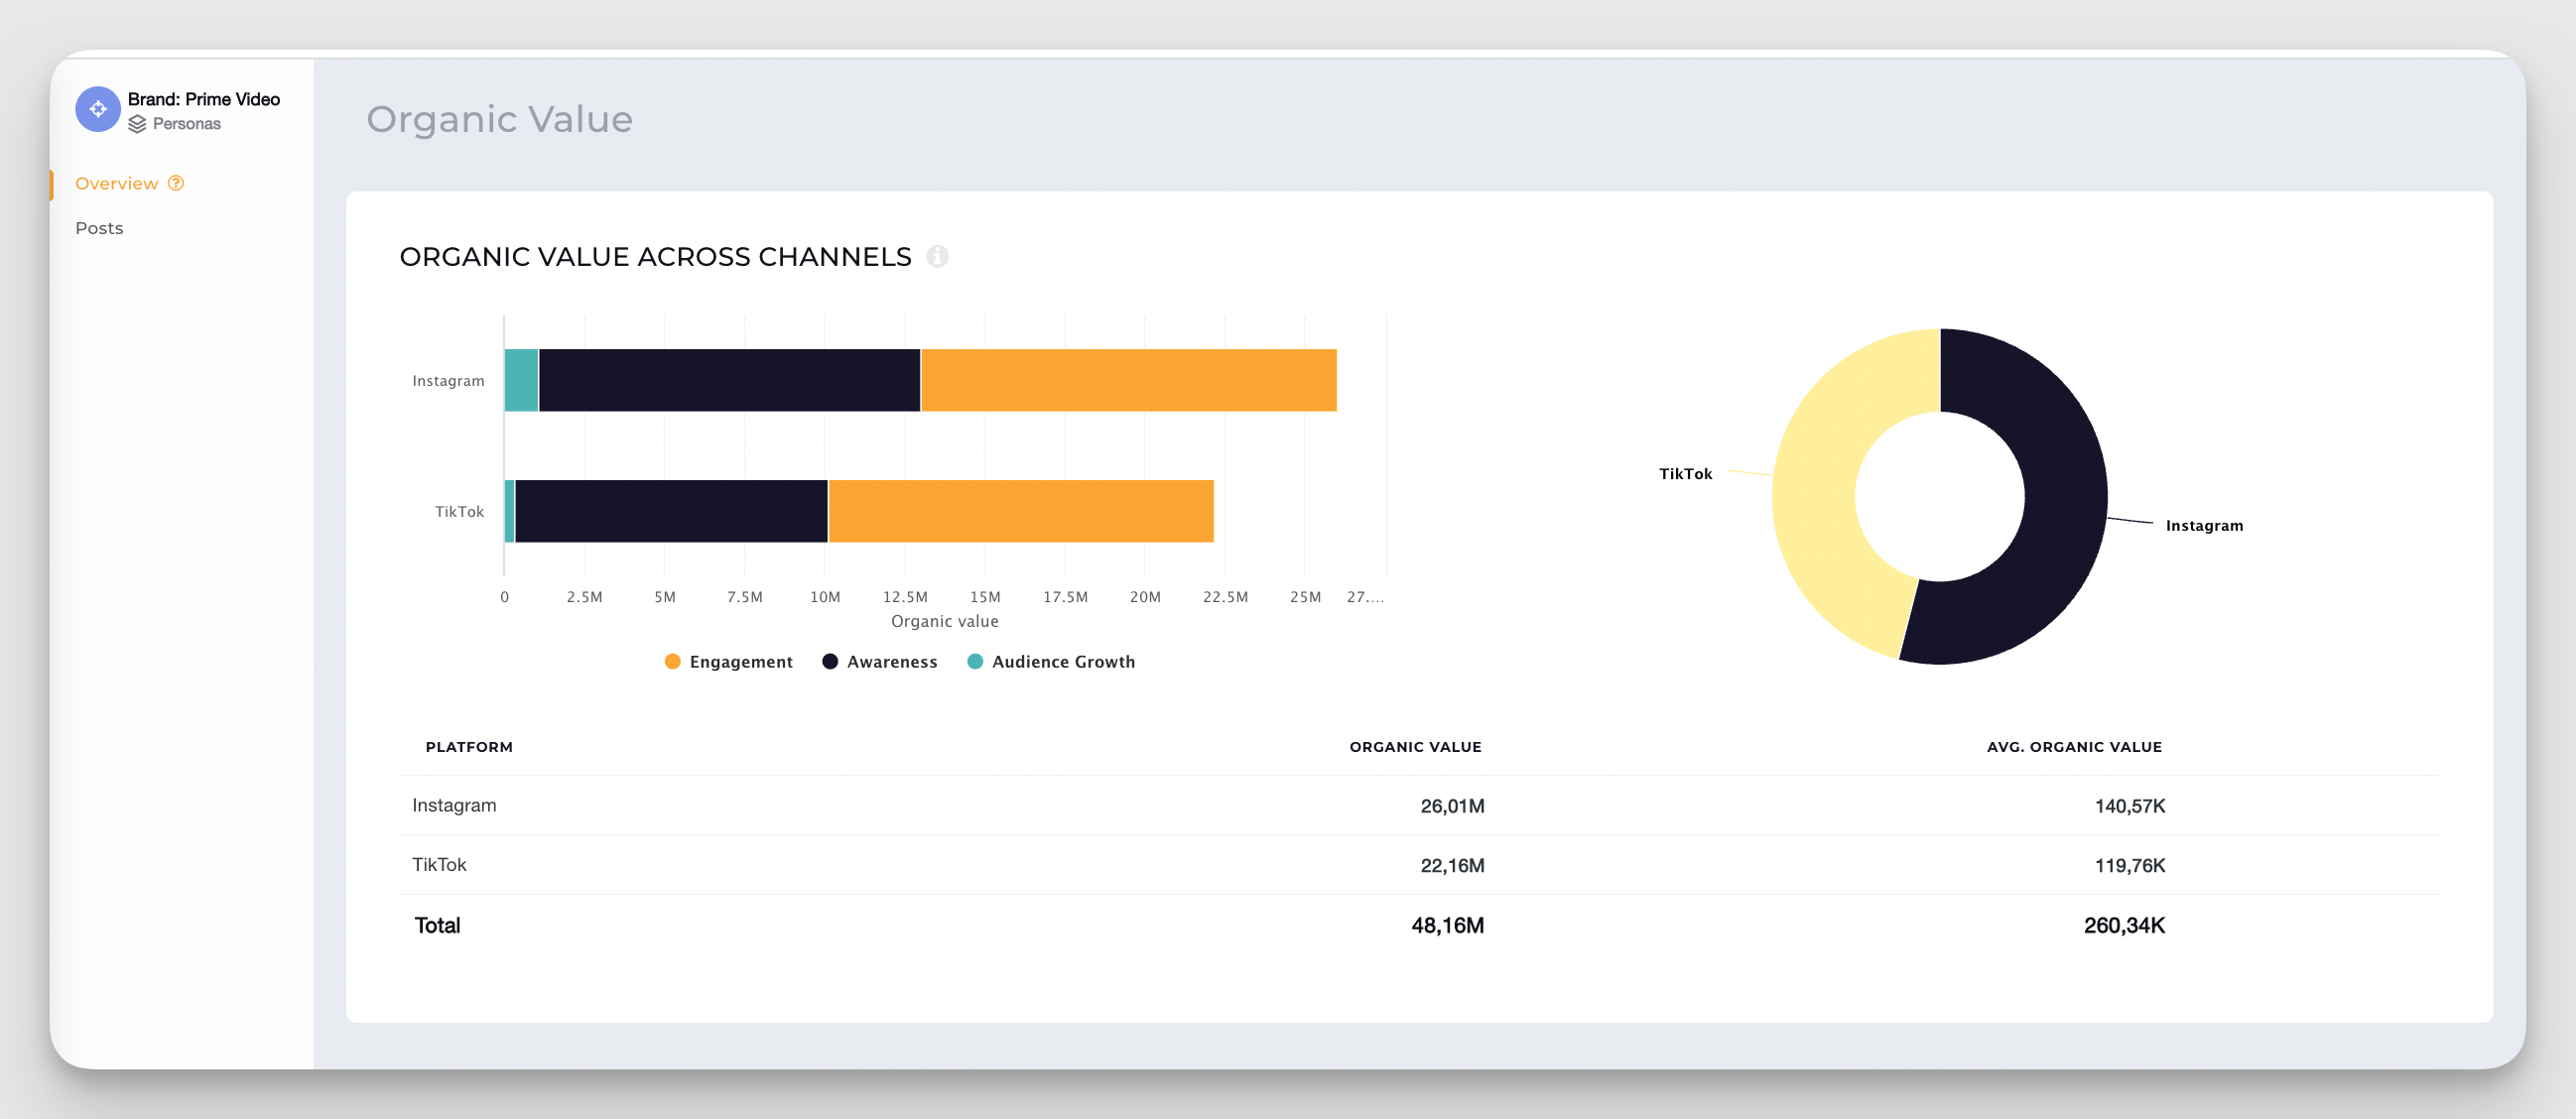
- Peek at your competitor’s social media value: Ever wonder what your competitor’s content is really worth? With Socialinsider, you can instantly see the estimated dollar value behind their organic social media efforts. This feature turns engagement, impressions and followerd into a tangible ROI—showing how much value they’re generating through their organic effort's.
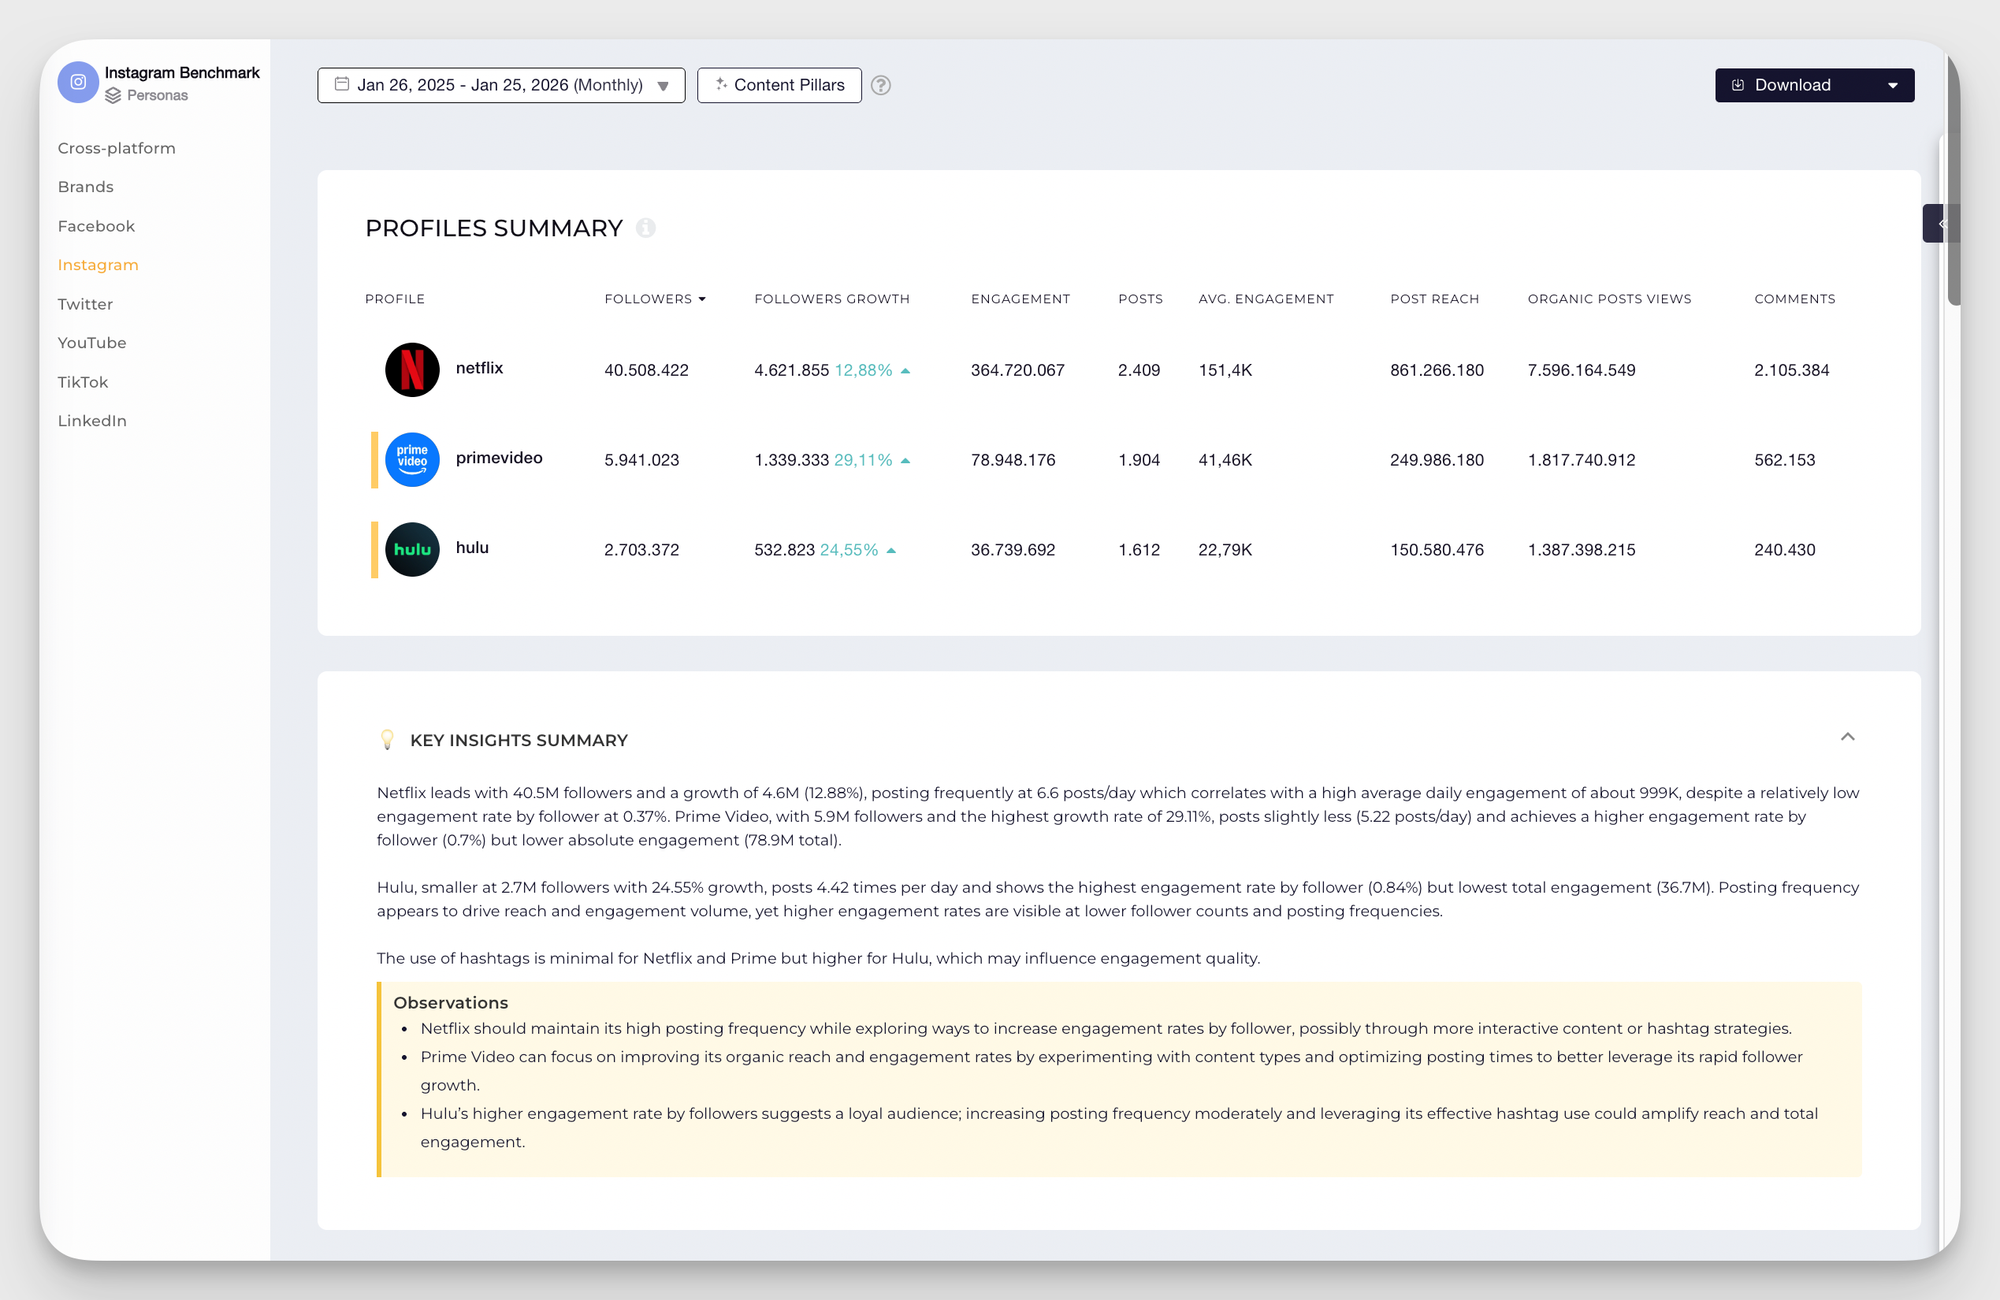
And speaking of industry insights, below you'll find, fully packed all the discoveries the latest Socialinsider social media benchmarks report has uncovered:
#5. Tell a ‘Cause-and-effect’ story
Take these two scenarios.
Scenario A: You share your social report: engagement up 15%, followers up 2,000. Leadership nods, checks their phones, and moves on. The numbers look good, but they don’t mean anything.
Scenario B: You lead with a story: “After switching to short-form video, engagement rose 40% and inbound leads grew 25%, generating $60K in new pipeline.” Suddenly, the room’s paying attention. Same data, different delivery.
That’s the power of cause-and-effect storytelling in reporting.
Below are two ways to implement this in your social media reporting:
- Build a narrative chain. Connect each major initiative to a measurable business result. For example, ‘We focused on thought-leadership carousels → boosted impressions by 30% → generated 12 new partnership inquiries.’
- Visualize the social-to-sales journey. Map engagement → traffic → conversions in a simple funnel view. This gives leadership a direct line of sight from post-performance to pipeline growth.
#6. Use data visualization to build credibility
Let’s be honest. Nothing kills a good insight faster than a messy spreadsheet. You could have the most compelling data story in the world, but if your slides look like an Excel nightmare, no one will remember it.
A clean chart showing a steady rise in engagement or a spike in conversions instantly communicates momentum. It says, “We’ve got this under control.”
Several execs in our interviews even admitted that presentation often shapes how seriously they take a report.
Three ways to make your social media reports visually easy to understand:
- Keep it simple. Use clean visuals that highlight trends. A single line chart showing engagement growth over time beats five tables of numbers.
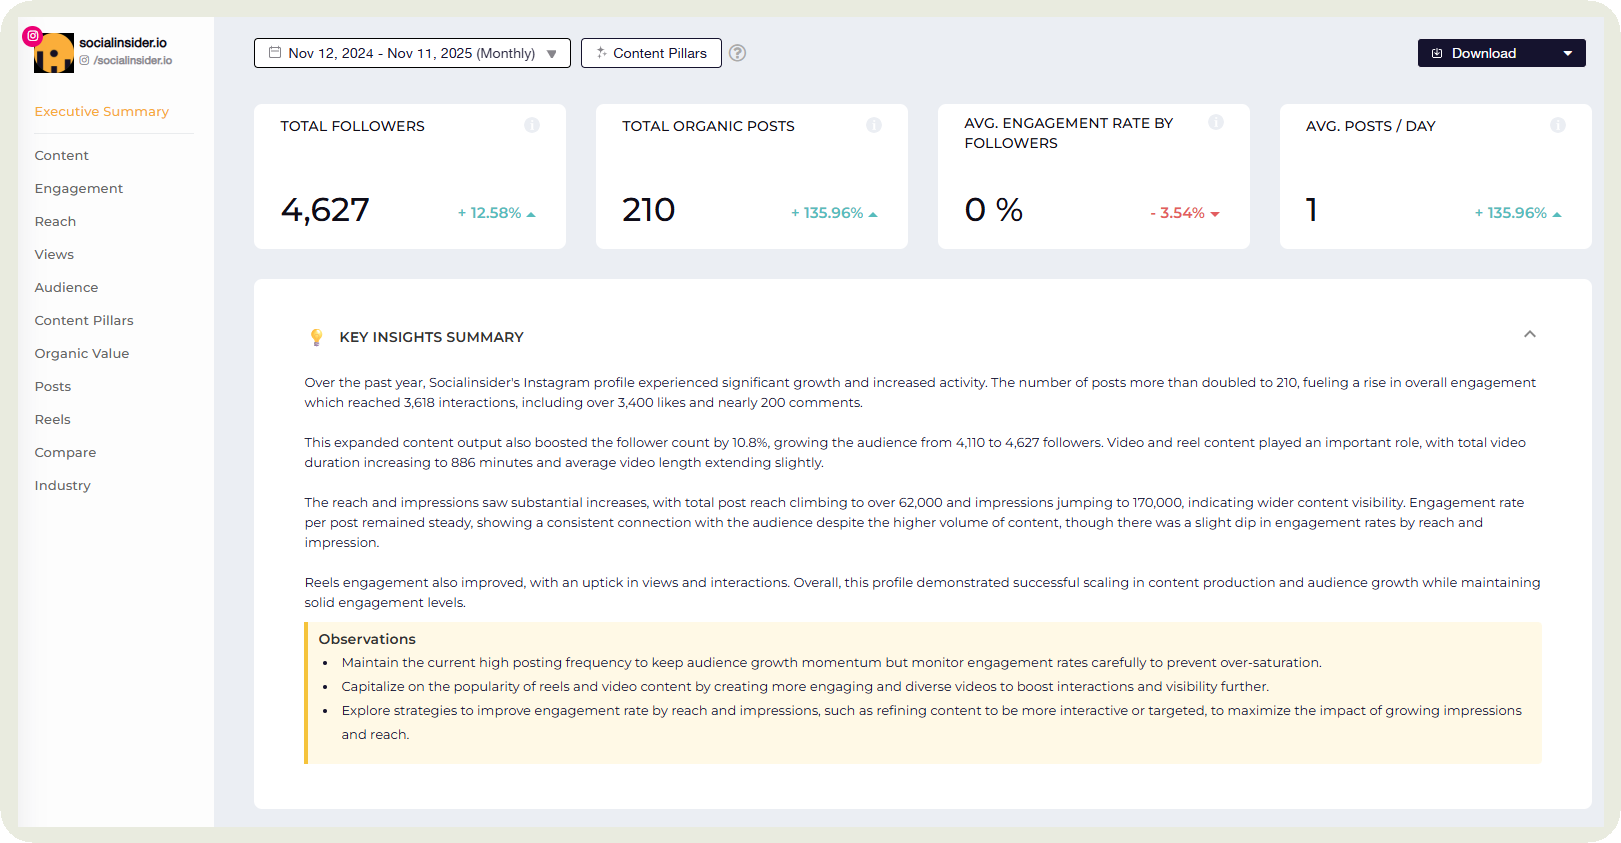
With Socialinsider, this becomes easy as most of the data is represented in graphs and easy-to-understand tabular formats.
Sometimes, I even share Socialinsider dashboards so the management can click on any point in the graphs and see the posts that led to those upticks or downfalls.
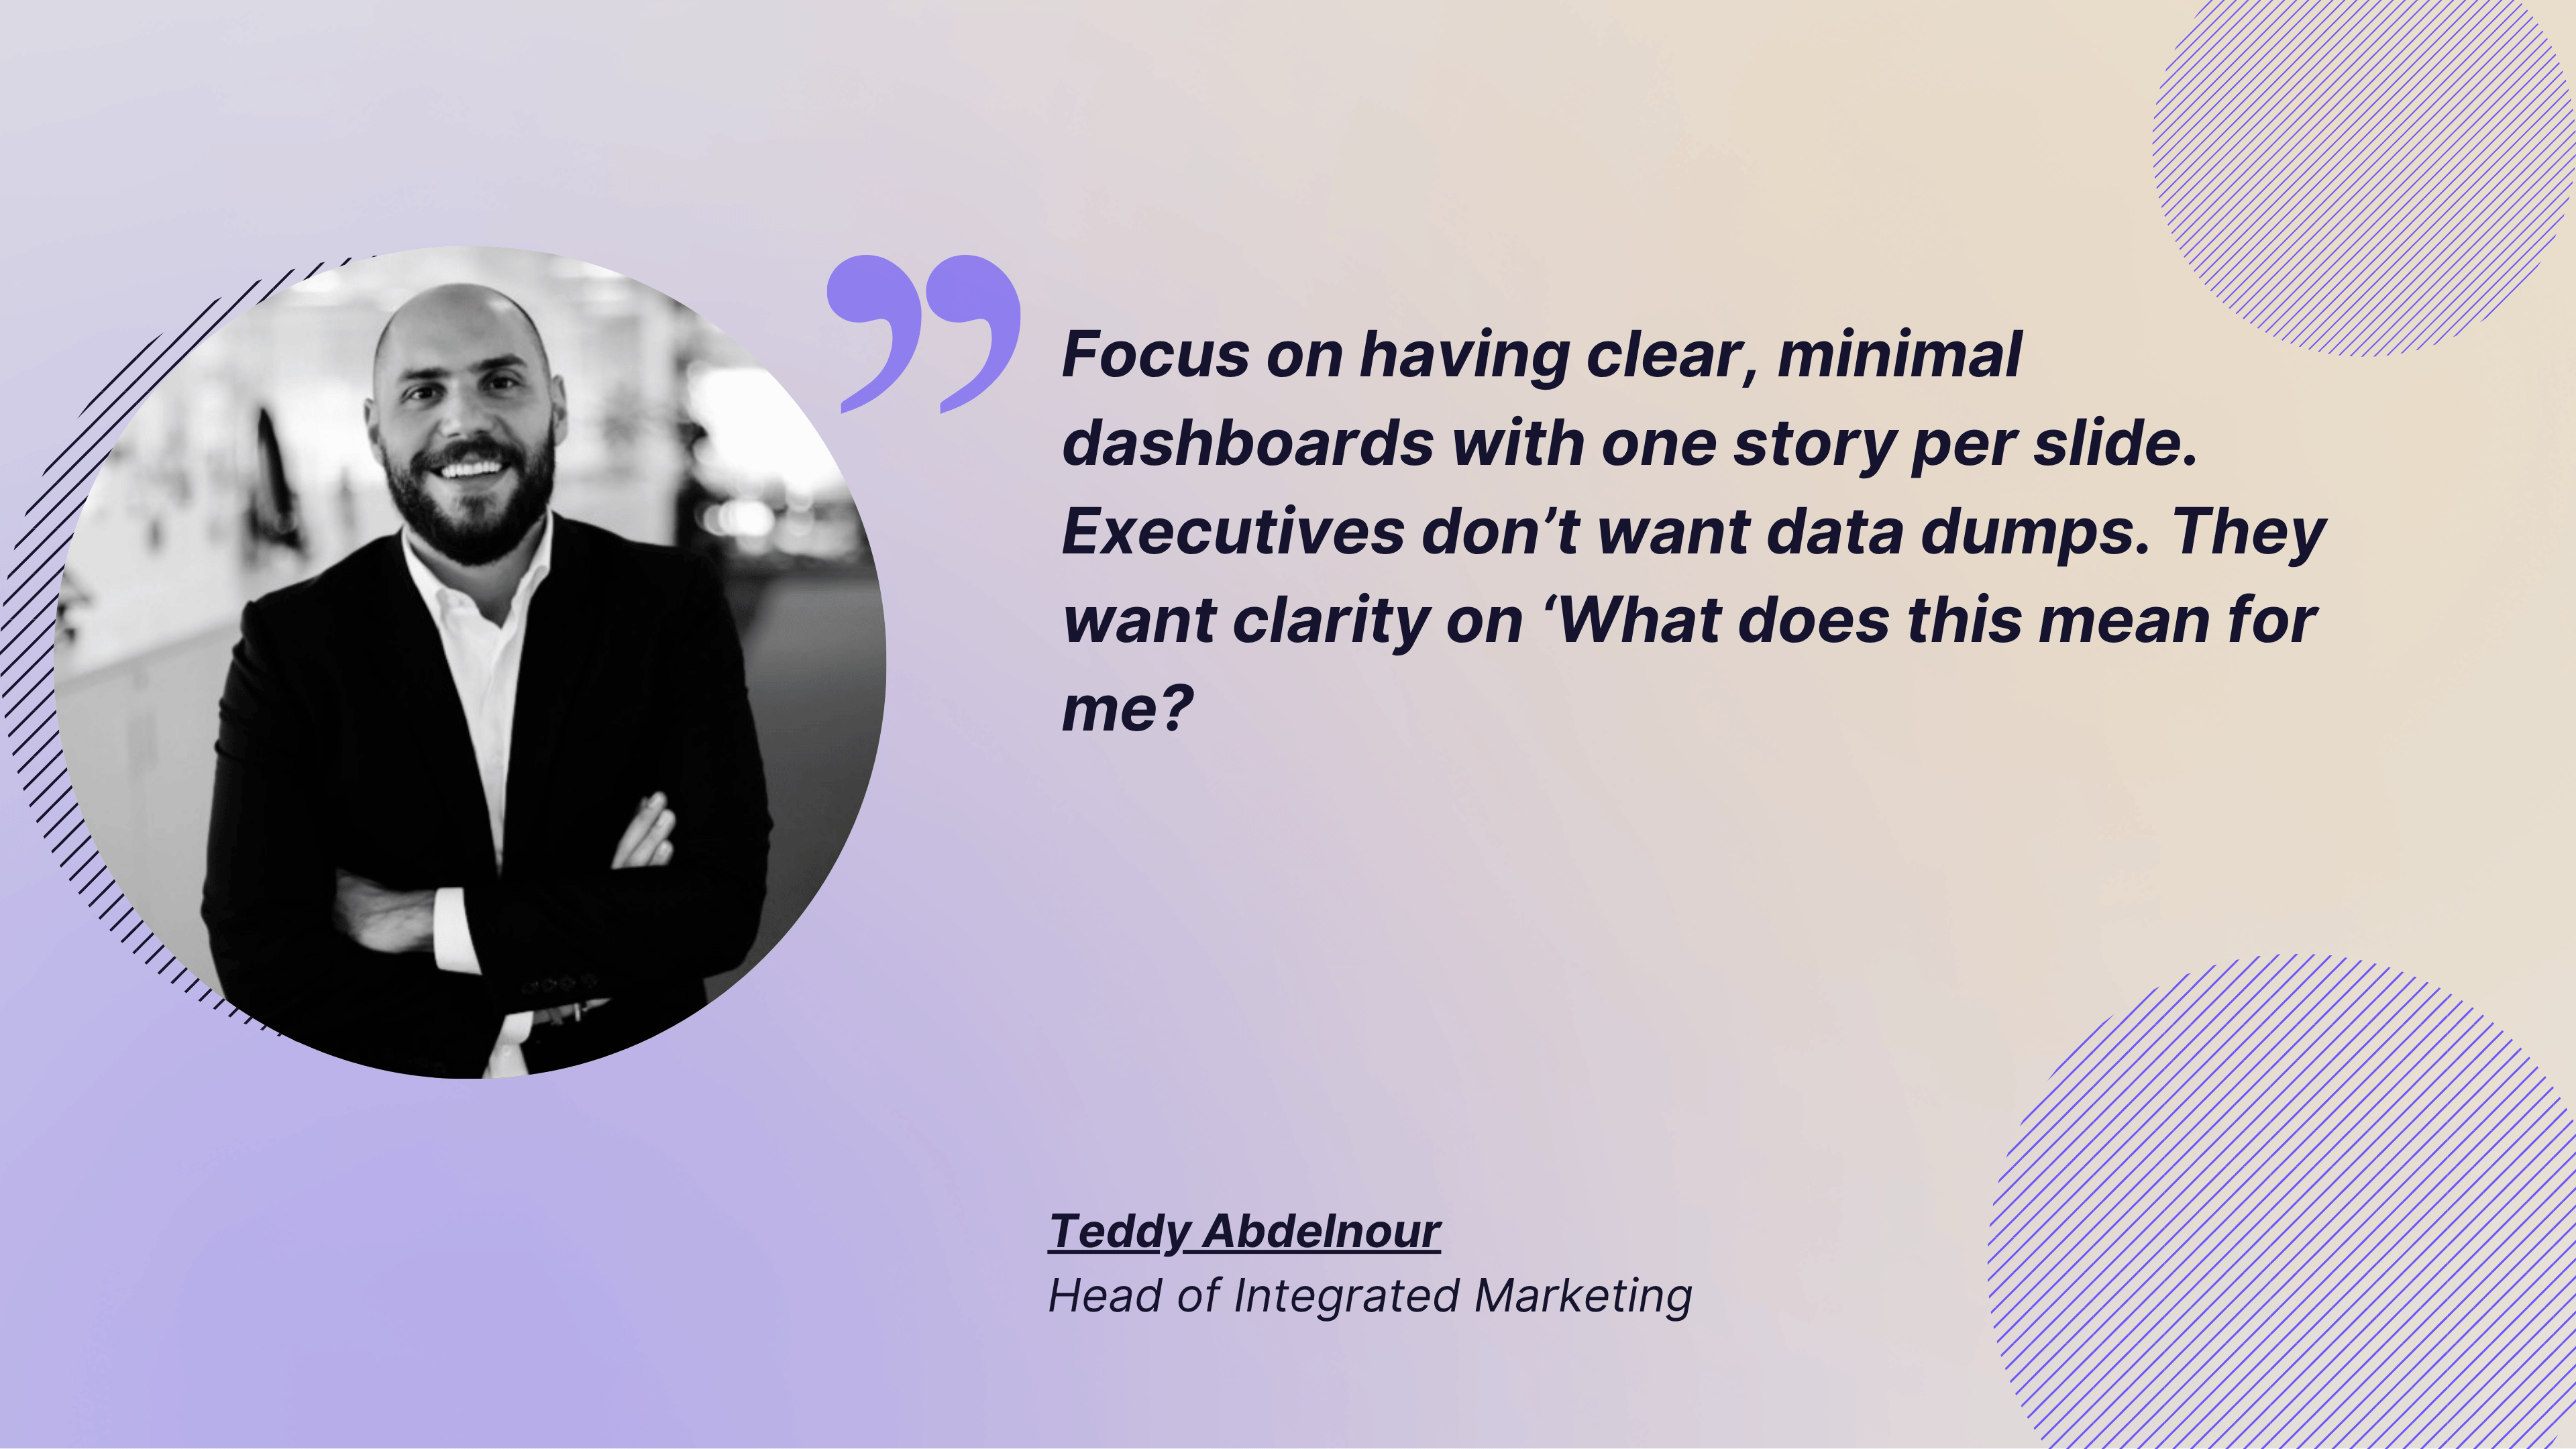
Teddy Abdelnour emphasized keeping the slides simple when he said:
Focus on having clear, minimal dashboards with one story per slide. Executives don’t want data dumps. They want clarity on ‘What does this mean for me?’
- Summarize the story. Create a one-slide overview connecting top-performing campaigns to key social media KPIs like leads, signups, or sales. For example, “Q3 LinkedIn campaigns drove 18% more conversions, contributing $45K in new revenue.”
You should ideally start the report with this slide so leadership sees the headline before the details. The ‘why it matters’ moment that hooks them in before you unpack the details.
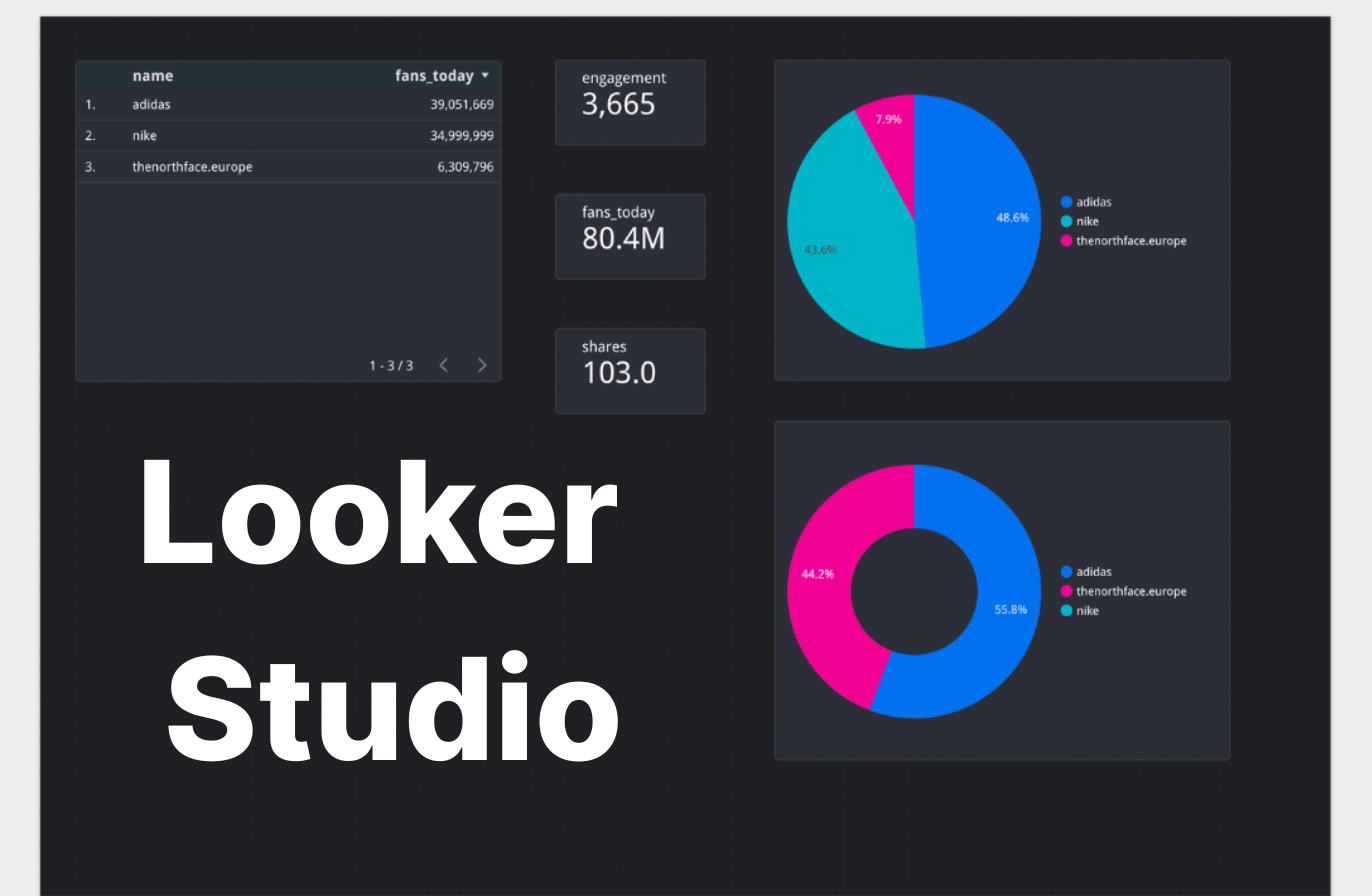
Centralize your data. Export your social metrics into Looker Studio or Power BI to create dashboards that merge social, web, and CRM data. One unified view signals strategic alignment.
#7. Simplify and automate reporting workflows
We’ve all been there: scrambling the night before a board meeting, juggling CSV exports, copy-pasting screenshots, and praying your formulas don’t break. By the time the report’s ready, you’re too exhausted to even present it.
The truth is, if your reporting process feels manual and messy, you’re spending time collecting data instead of interpreting it.
Here’s how I simplify reporting without losing depth:
- Automate the grunt work: Use API connections or Looker Studio connectors to pull data directly into your social media reports for clients or upper management.
Teddy mentioned that while you automate, you should not completely remove the human touch from your reporting —
We use Supermetrics and Looker Studio for data pulls. But insights stay human. Automation saves time; analysis adds value.
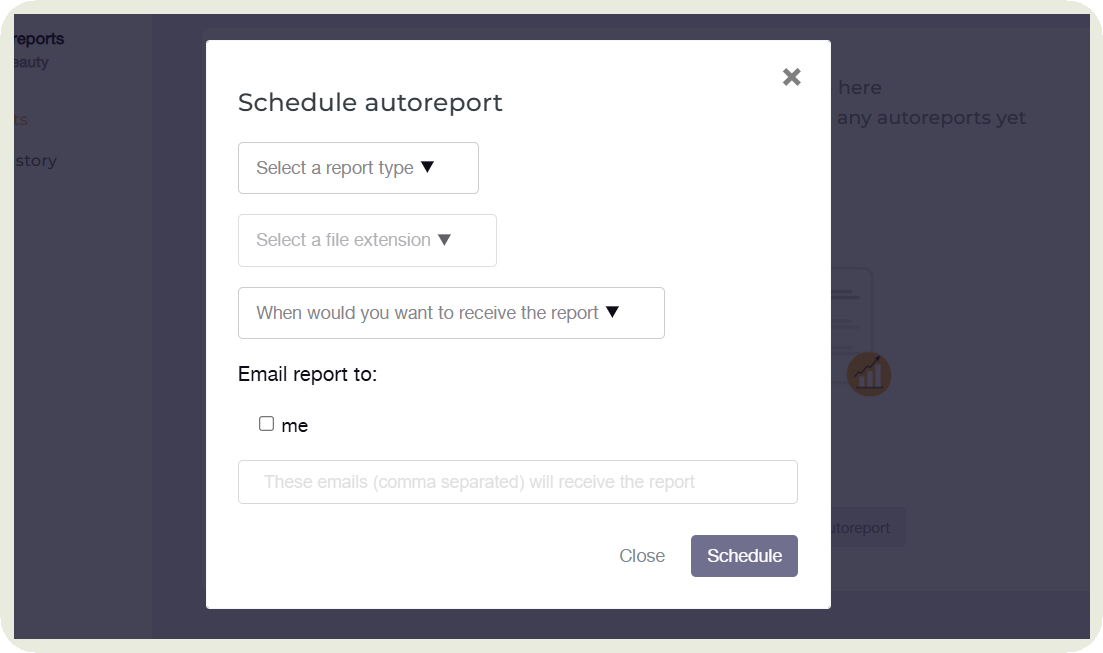
- Build smart templates: Set up reports that automatically calculate metrics such as conversion rate, ROI, or engagement growth. That way, every leadership deck is 90% done before you even open PowerPoint.
I do this by setting up autoreports in Socialinsider. This way, I receive the data I want on a weekly, monthly, quarterly, or yearly basis.
- Tag campaigns consistently: Do you run a lot of campaigns on social media? Instead of manually calculating their performance, I tag all the campaign posts in Socialinsider.
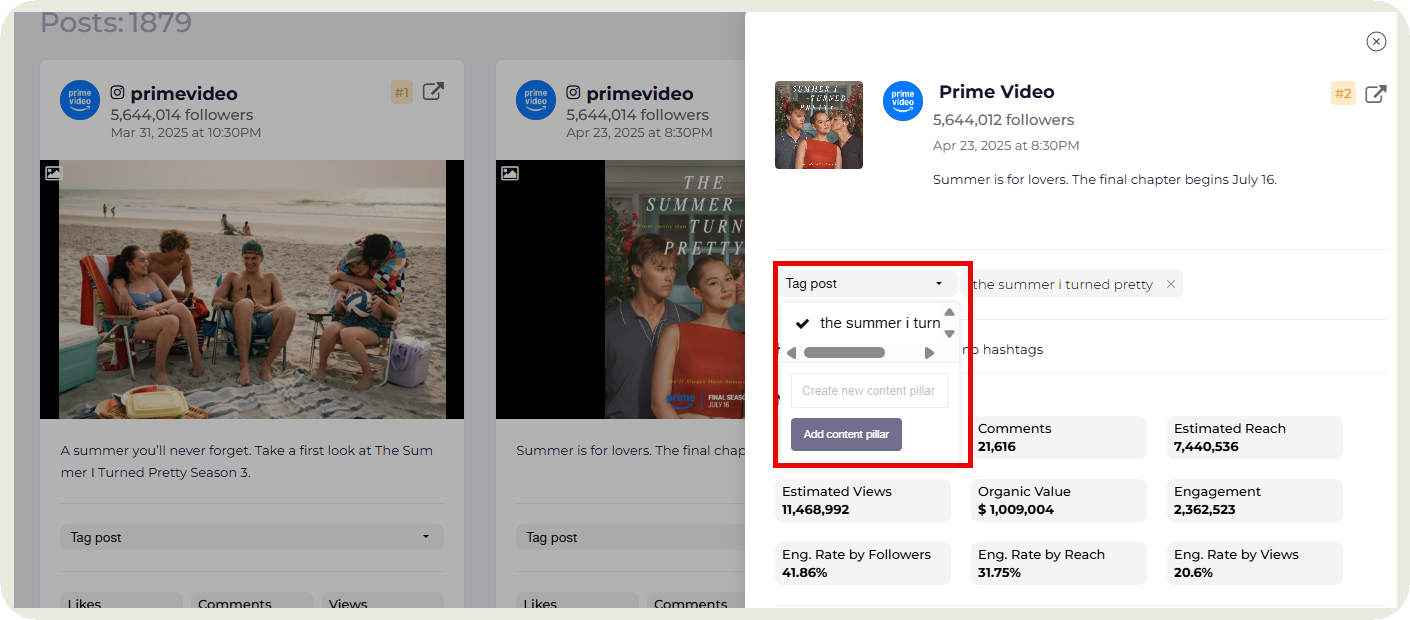
Once that is done, I can assess this pillar's (the campaign’s) performance in terms of engagement, views, and organic value and even compare it with other campaigns or content pillars.
#8. Translate insights into strategic recommendations
Imagine you’re in a leadership meeting and you’ve just finished walking everyone through your latest social results. The charts look solid. The numbers are green. You pause, expecting questions. But instead, the room moves on to the next agenda item without hesitation.
Not because the data wasn’t good, but because no one knew what to do with it.
And that’s the quickest way for your hard work to slip into the ‘nice-to-know’ bucket instead of the ‘must-act-on' one.
The same theme came across our customer interviews: decision-makers don’t want more numbers; they want a plan. They care less about how much data you surfaced and more about what that data tells them to do next.
To resolve this,
- End with recommendations. Wrap each report with clear next steps.
Example: “Double down on LinkedIn thought leadership. These posts delivered the highest conversion rate to demo requests.”
- Connect insights to sales enablement. Show sales how to use your data.
Example: “People loved our posts on the new AI feature. Emphasize them during sales calls and messaging.”
Shape future strategy. Summarize what the data means for coming campaigns: where to invest, what to pause, and which opportunities are emerging.
#9. Build a culture of data-driven teams
In our recent customer interviews, one thought came up again and again: teams didn’t adopt Socialinsider because they were excited about charts; they adopted it because consistent reporting became social proof of competence, alignment, and progress.
You can feel the difference between a team that guesses and a team that measures. One hopes plans will work; the other can show why they will.
One of our customers shared how his team used to piece together board reports with Excel files and screenshots. It worked until it didn’t. Because scaling became a huge problem.
Here’s how to build a culture of data and scale reporting:
- Normalize data visibility: Don’t hide social media insights in marketing silos. Share competitor data, trend shifts, and performance summaries with leadership. It builds credibility and strengthens cross-team alignment.
For example, your social media data can also guide marketing and sales teams in messaging alignment and better targeting.
- Integrate data into workflows: Move away from one-off spreadsheets and manual screenshots. Automate reporting and feed insights directly into the tools your team already uses: CRM, BI dashboards, and project management.
#10. Segment the analysis
You don’t want to throw in all the data in your report. I’ve seen teams present a single ‘overall engagement rate,’ only to realize later that one content type carried the whole quarter while everything else lagged. Without segmentation, you miss the story behind the metrics.
Instead, segment your data. Here’s how.
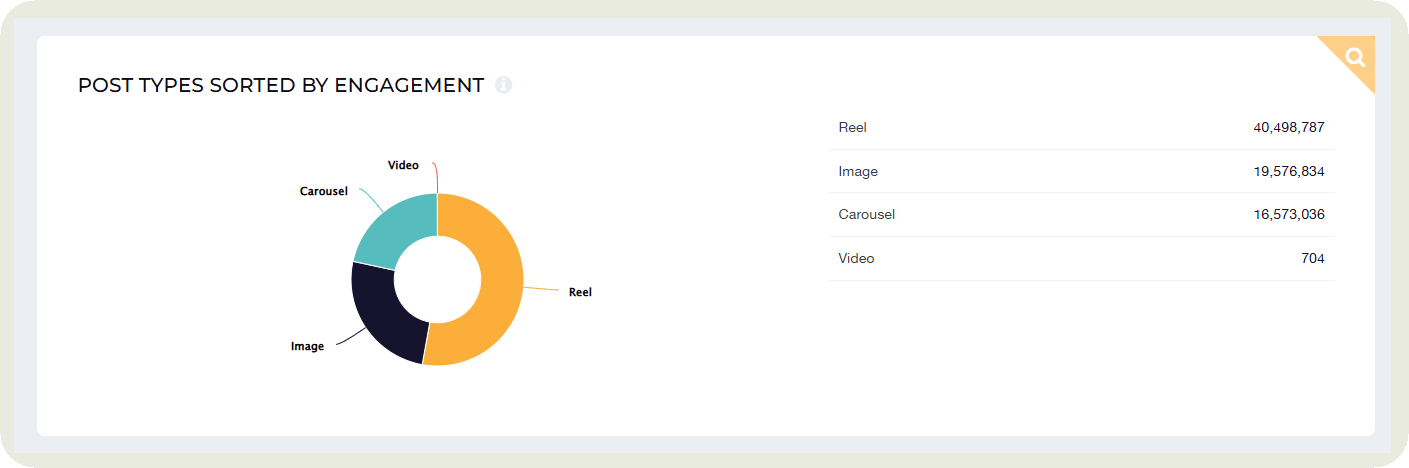
- Organize your analysis by different variables. Break down data by content type, posting cadence, channel, audience cohort, or whatever variables actually influence performance. This helps you isolate what’s driving outcomes.
For example, I also include metrics such as post types by engagement in my reports to inform management of which formats worked best.
- Segment by platform: If you’re reporting across Facebook and Instagram, treat them separately.
For example, a theme that performs brilliantly on Facebook Reels might flop on Instagram Reels.
Segmentation helps you uncover and explain these platform-level nuances.
#11. Combine qualitative data
Your brand mentions skyrocketed in the last 2 months. Engagement also seems high. You walk into the leadership meeting feeling victorious. Until someone asks, “Okay, but what were people actually saying?”
Suddenly, that beautiful spike feels a lot less meaningful. Because without context, those mentions could signal excitement or frustration. A surge in engagement isn’t automatically a win if half the comments were complaints about a new feature or a viral misunderstanding.
Here’s how to add qualitative insights to make your reports more powerful:
Go deeper on top performers. Don’t just report engagement. Look at tone, visuals, and messaging. Was it the humor? The storytelling? The new creative angle?
- Pair every data trend with a qualitative explanation. If comments jumped 40%, explain why. Maybe you introduced a new question-led CTA that invited responses, or your founder’s post struck an emotional chord.
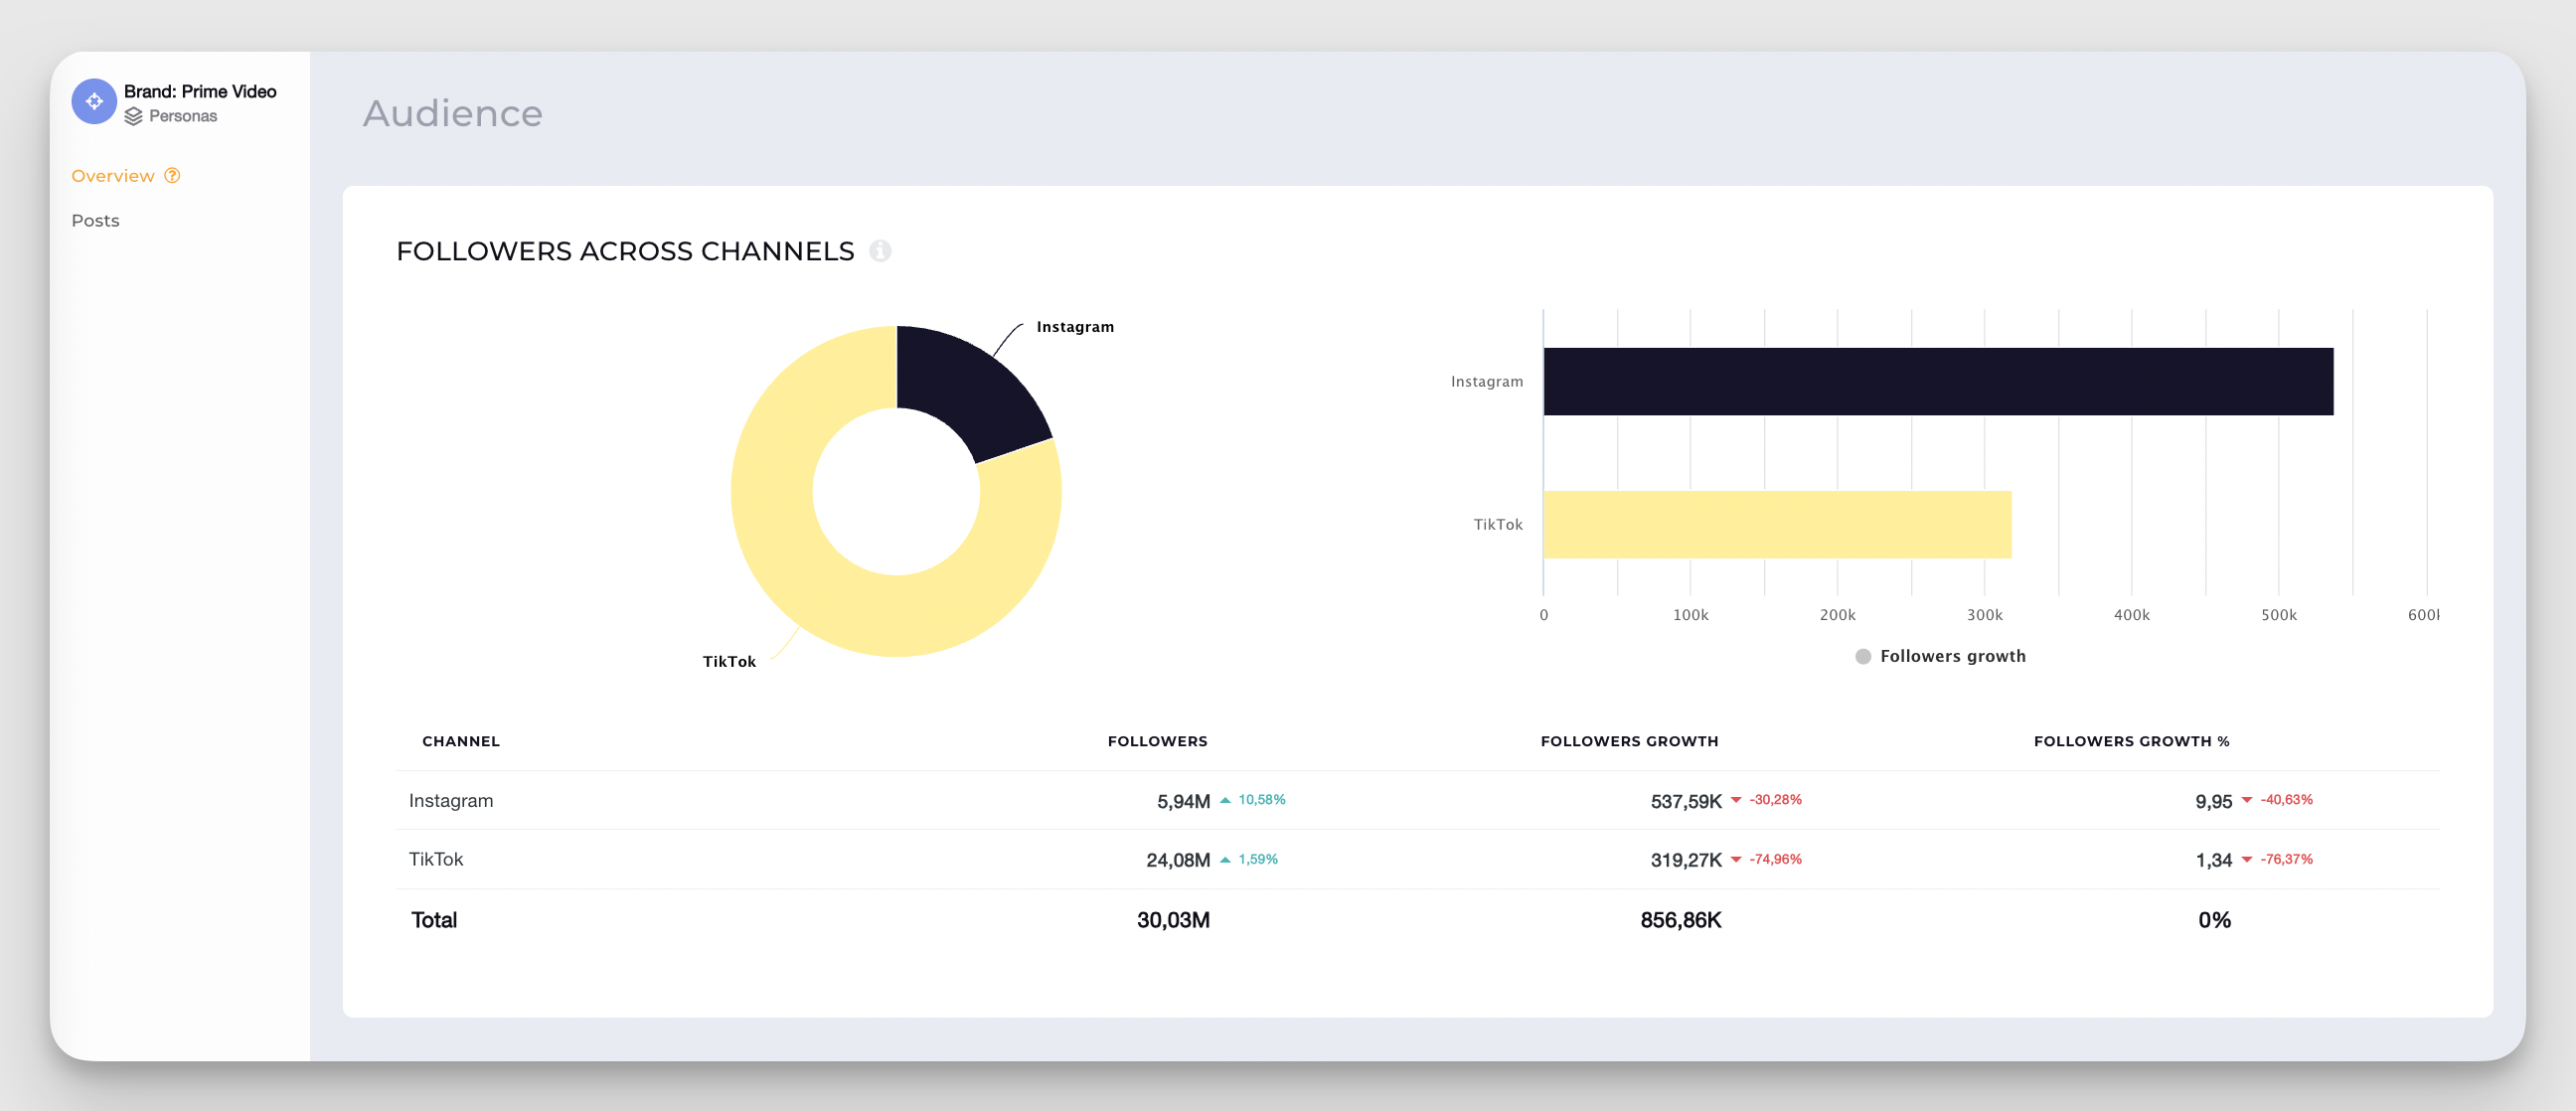
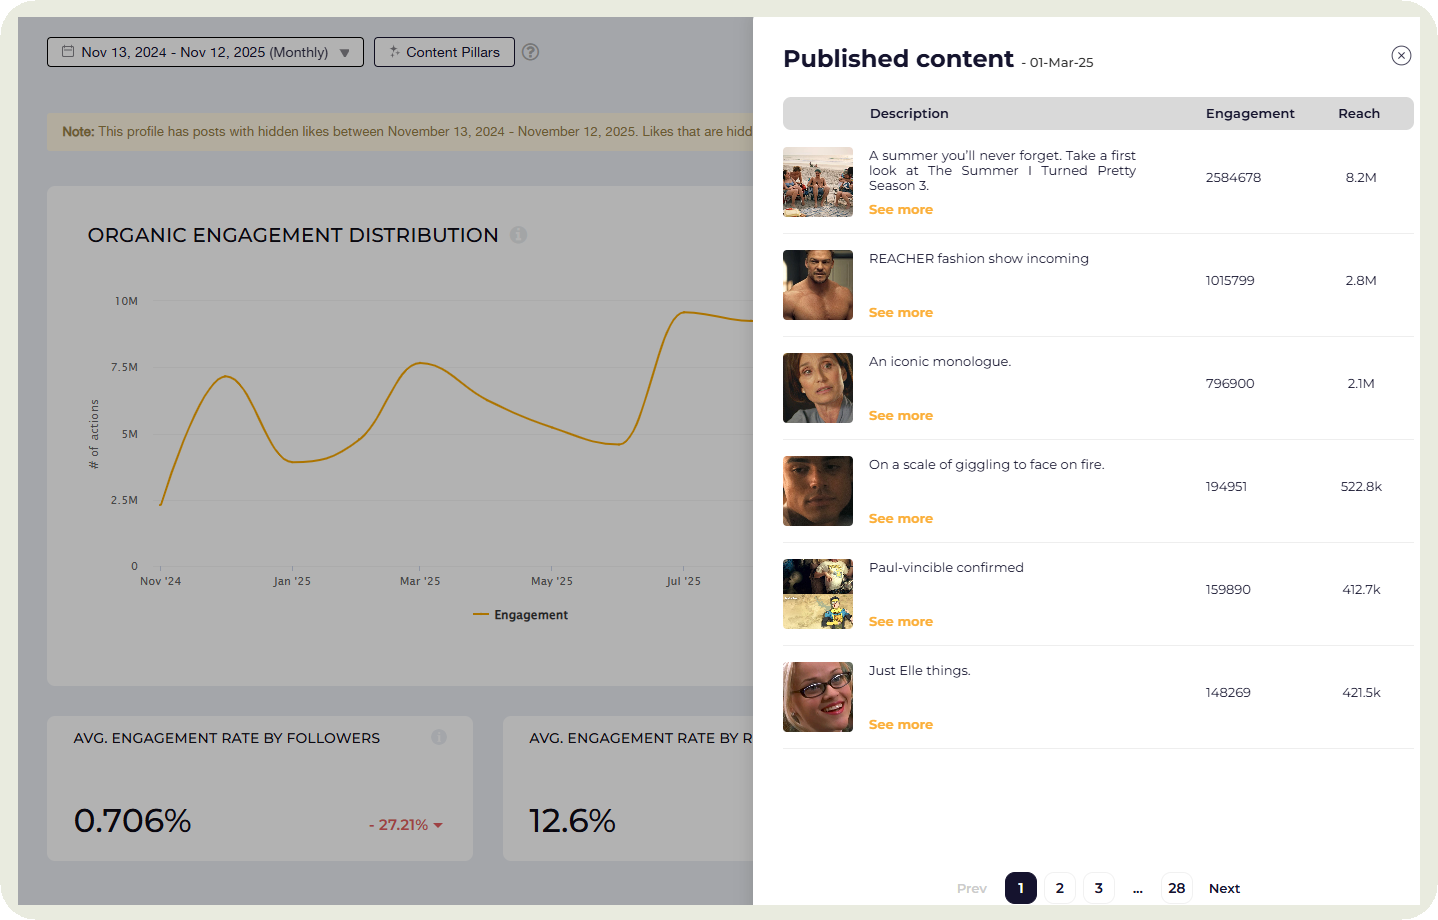
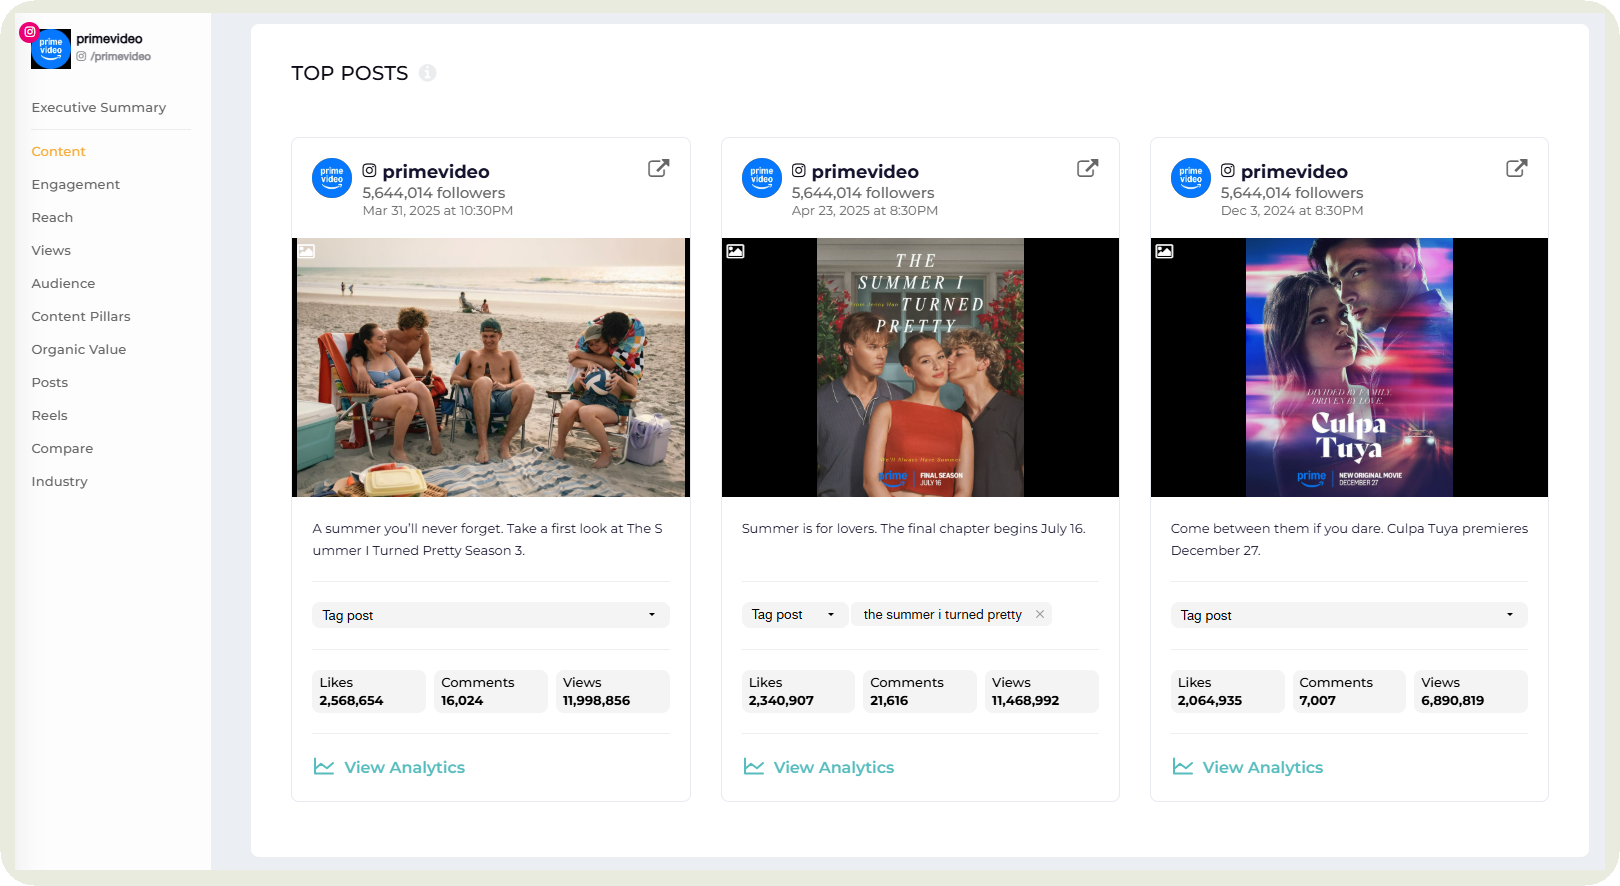
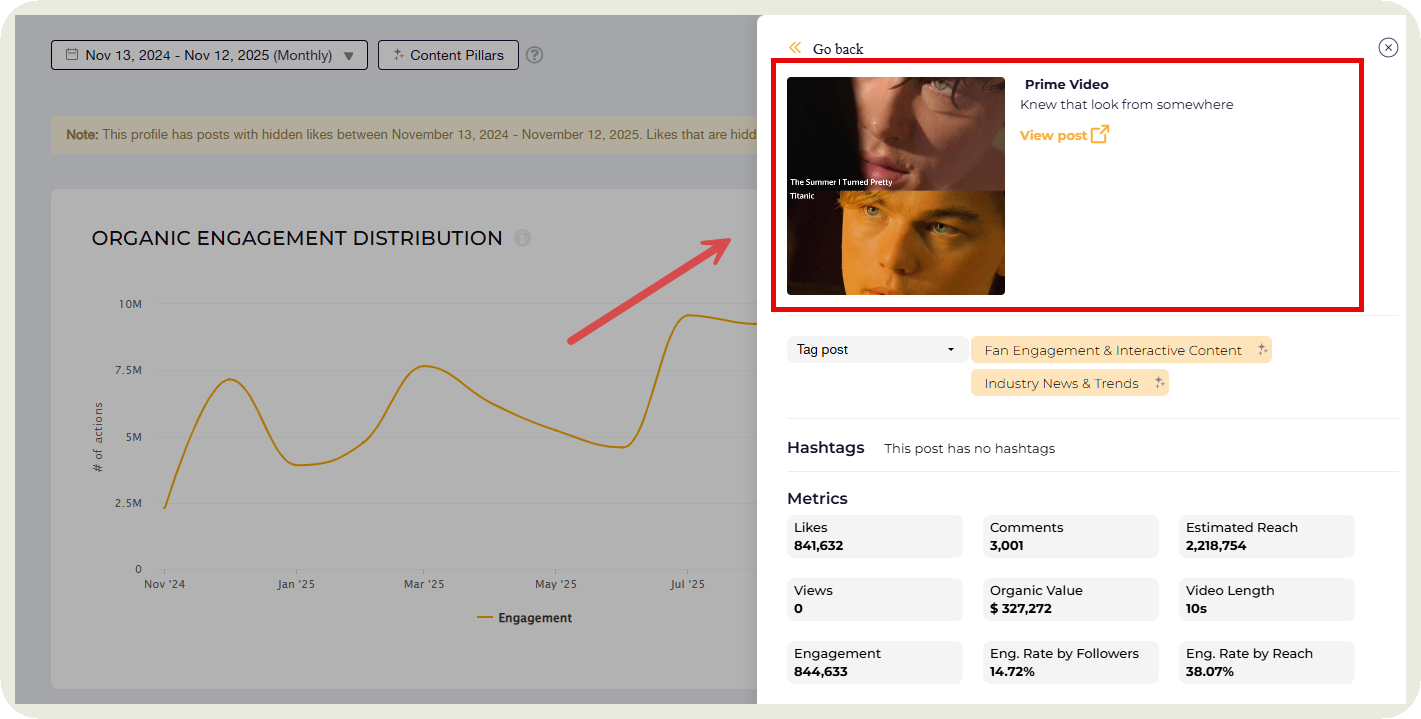
For example, when I checked the upticks in the engagement graph for Prime Video, I realized that their most engaging posts came from a specific series. And they also correlated it with some classic movies to increase engagement even further.
- Correlate sentiment with outcomes. A rise in positive sentiment before a surge in signups? A wave of ‘How do I get started?’ comments during a product launch? That’s narrative gold.
#12. Implement quality control and consistency standards
Imagine this: for eight straight months, leadership has seen the same clean, structured social report. Same flow, same slides, same KPI placement. Everyone knows exactly where to look.
Then a new team member joins. And suddenly the entire social media performance report looks like it went through a blender. The metric that’s always on slide two? Gone. The KPI definitions? Different.
Now, leadership spends more time searching for information than understanding it.
Here’s how to avoid that chaos:
- Stick to a consistent methodology: Keep formulas, tracking periods, and measurement logic the same across reports. If something changes, flag it clearly.
- Standardize KPI definitions: Add a simple glossary so everyone knows exactly how you calculate metrics like engagement rate or CTR.
- Use version control and approvals: Keep clean, labeled versions and run a quick internal review before anything reaches leadership.
Final thoughts
Every report you share should do three things: prove impact, inform timing, and spark action. That’s how you move from being the ‘social media person’ to being part of strategic decisions.
Start small. Tie one metric to a business goal, automate one recurring report, visualize one cause-and-effect story. Then keep building from there.
When leadership starts quoting your insights in meetings, you’ll know your reporting is spot-on. To get data for your reports quickly and easily, try Socialinsider’s free 14-day trial.
Nidhi Parikh
Nidhi Parikh is SaaS writer that believes scrolling through social media is research for work. When not working, find her binge watching the latest series or reading anything she can get her hands on.

Analyze your competitors in seconds
Track & analyze your competitors and get top social media metrics and more!
You might also like


Improve your social media strategy with Socialinsider!
Use in-depth data to measure your social accounts’ performance, analyze competitors, and gain insights to improve your strategy.