[What Data Says] How Many Social Media Interactions Does Every Platform Drive
Discover how to track and increase social media interactions — with 2026 benchmark data across TikTok, Instagram, LinkedIn, and Facebook.


Getting interactions on social media these days—the comments, shares, DMs, and saves that signal real audience interest—is one of the hardest parts of building a brand presence online. And the best way to do that is to match the right format to the right platform, then measure what people actually do.
Within this guide, I'll give you a clear breakdown of social media interaction types, platform-by-platform benchmark data from Socialinsider's data, a practical framework for tracking what's working, and six strategies to help you increase interactions on social media in a way that actually sticks. Are you ready?
Key takeaways
- Interactions on TikTok are declining by 30% YoY.
- On Instagram, Reels are more effective at generating interactions
such as likes and shares. - In LinkedIn's case, multi-image posts and native documents significantly
increase interactions. - On Facebook, Status posts and albums drive the most interactions.
What are social media interactions?
Social media interactions refer to any action a user takes that involves direct or indirect engagement with a brand's content or profile. This includes likes, comments, shares, saves, DMs, tags, story replies, and more.
It's a broader concept than most people realize. While most brands track likes and comments, interactions also include quieter signals—someone bookmarking a post, watching a story without replying, or clicking through to a profile after seeing a reel.
Interactions vs. engagement: what's the difference?
These two terms are often used interchangeably, but they're not the same thing.
Interactions on social media are direct, intentional actions: sending a DM, tagging your brand, replying to a story poll, or sharing a post. They indicate that someone actively chose to reach out or respond.
Engagement is the broader umbrella. It includes likes, shares, and comments, and is often used as a catch-all for how audiences respond to content. All interactions are a form of engagement, but not all engagement qualifies as a meaningful interaction.
If you want to build real relationships with your audience, the interactions worth prioritizing are the ones that involve intent—not just passive scrolling behavior.
Types of social media interactions
Understanding the different types of interactions helps you interpret your data correctly and build a strategy that targets the right behaviors. There are two main categories: active and passive.
Active interactions
Active interactions require deliberate effort from the user. They tend to carry more signal about audience interest and intent.
- Likes and reactions. The simplest form of engagement—a quick signal that content resonated. Platforms like Facebook and LinkedIn offer multiple reaction types (love, insightful, celebrate), giving you a richer read on how content landed.
- Comments and replies. Comments are one of the most valuable interaction types. They indicate that someone stopped, formed an opinion, and typed it out. A post with strong comment activity is one the algorithm tends to amplify. Brands that respond to comments extend those conversations—and give the algorithm more reason to keep the post in circulation.
- Shares and reposts. When someone shares your content to their own feed or sends it to a friend, they're endorsing it to an entirely new audience. This is organic amplification—and it costs you nothing.
- Saves. Saves indicate strong content value. A user bookmarking a post is essentially saying 'I want to come back to this.' Instagram's algorithm treats saves as a positive signal, making them an increasingly important metric.
- Story interactions. Polls, Q&A stickers, emoji sliders, and quiz stickers are lightweight but effective. Because they require almost no effort from users, they often generate the highest participation rates. They're also a genuine measure of audience opinion.
- Direct messages. DMs are the most direct form of audience interaction. Whether it's a product question, a support issue, or a compliment, someone sliding into your inbox is showing active interest. Fast, thoughtful responses here can meaningfully strengthen customer relationships.
- Follows. A follow is a commitment. Unlike a one-off like, it signals that someone wants to keep hearing from you—which makes followers your most receptive audience segment.
Passive interactions
Passive interactions don't require the user to do anything explicit. They're still useful signals, but they need to be read carefully.
- Profile visits. High profile visits with low follow-through usually means your bio or content grid isn't converting curiosity into commitment. Worth optimizing if you see a consistent gap.
- Impressions and views. These measure reach, not resonance. A post with huge impressions but no active interactions is a sign that something isn't landing—hook, visual, CTA, or relevance.
- Link clicks. Clicks signal intent to act. Whether it's a bio link, a story swipe-up, or a CTA button in a post, clicks are where passive interest converts into active behavior. Track them separately from general engagement.
Why track social media interactions?
Every interaction is data. Collectively, they tell you what your audience cares about, what content format is working, and whether your social presence is actually building relationships or just generating impressions.
- They reveal real audience interest. Views are surface-level. Interactions show intent. If people are repeatedly commenting, sharing, and DMing about a particular topic, that's a clear signal about what matters to your audience.
- They inform content strategy. Tracking interactions at the format and topic level tells you exactly what to do more of. Are carousels getting saved significantly more than single images? That's a content decision you can make with confidence.
- They identify audience needs and friction. Repeated DMs asking the same question means there's an information gap in your content. A spike in negative comments after a campaign launch means something missed the mark. Interactions are your fastest feedback loop.
- They measure cross-channel performance. If you're running the same campaign across Instagram, LinkedIn, and TikTok, interaction data tells you which platform is actually driving the response you want—so you can weight your effort accordingly.
- They support customer experience. Brands that respond to interactions—especially DMs and comments—consistently outperform those that don't. Audiences that feel heard are more likely to engage again, recommend the brand, and convert.
How to track social media interactions?
Knowing why to track interactions is only useful if you have a system for actually doing it. Here's a practical framework.
Know which metrics to monitor per platform
Not every platform surfaces the same interaction data, and the interactions that matter most differ by channel:
- Instagram: likes, comments, saves, shares, story replies, story poll responses, DMs, profile visits
- TikTok: likes, comments, shares, saves (favorites), duets/stitches, profile visits, follows from content
- LinkedIn: reactions, comments, shares, clicks on documents/links, poll votes, follows
- Facebook: reactions, comments, shares, link clicks, story replies
- X: likes, replies, reposts, quote posts, link clicks, bookmarks
Focus on interactions that align with your objectives. If you're trying to drive traffic, link clicks matter most. If you're building community, comments and DMs are your north star.
Set up a regular tracking workflow
Interactions only become useful when you track them consistently over time. A weekly or bi-weekly check-in beats a monthly deep-dive because it lets you catch trends and anomalies while you can still act on them.
A basic workflow looks like this:
- Pull interaction data at both the post level and the account level
- Compare against your own historical baseline and industry benchmarks
- Flag content that over- or under-performs relative to your averages

PS: This can be easily done through Socialinder's Posts analysis feature, which allows you to see your best or least performing posts depending on different metrics.
- Identify the format, topic, or posting time that correlates with stronger performance
- Feed those insights back into your content calendar
Use benchmarks to contextualize your numbers
Raw interaction counts don't mean much in isolation so, here's where benchmark data becomes essential. Comparing your interactions against industry averages—by platform and by content format—tells you whether you're overperforming, on par, or leaving opportunity on the table.
By the way, Socialinsider's analytics platform lets you pull your own interaction data alongside competitor benchmarks, so you can see exactly where you stand relative to your space—not just generic averages.
Social media interactions by platform
Every platform drives interactions differently, and understanding those differences helps you set realistic targets and allocate effort where it will have the most impact.
Understanding benchmark interaction metrics across channels lets you set realistic expectations and do social media optimization effectively.
In 2026, the interactions for organic content on social media across platforms are:
- TiTok - 570 median interactions
- Instagram - 140 median interactions
- LinkedIn - 60 median interactions
- Facebook - 20 median interactions

TikTok median interactions
While TikTok has historically been the highest-interaction platform by a significant margin, with the numbers narrowing down by 30% YoY, the increasing competition for feed attention as the platform matures and more brands enter the space becomes more obvious than ever.
I'd say the takeaway from this is pretty straightforward: standing out in an increasingly crowded feed requires stronger hooks, more native formats, and a more deliberate content strategy than it did a year ago.

TikTok interactions include:
- Likes;
- Comments;
- Shares;
- Saves (favorites);
- Duets and stitches;
- Profile visits and follows.
Based on Socialinsider data, we track the median interactions on TikTok for the most active pages, with followers between 1k and 1M. Through the API, when measuring the interactions on LinkedIn, we included the following data:
- likes
- comments
- shares
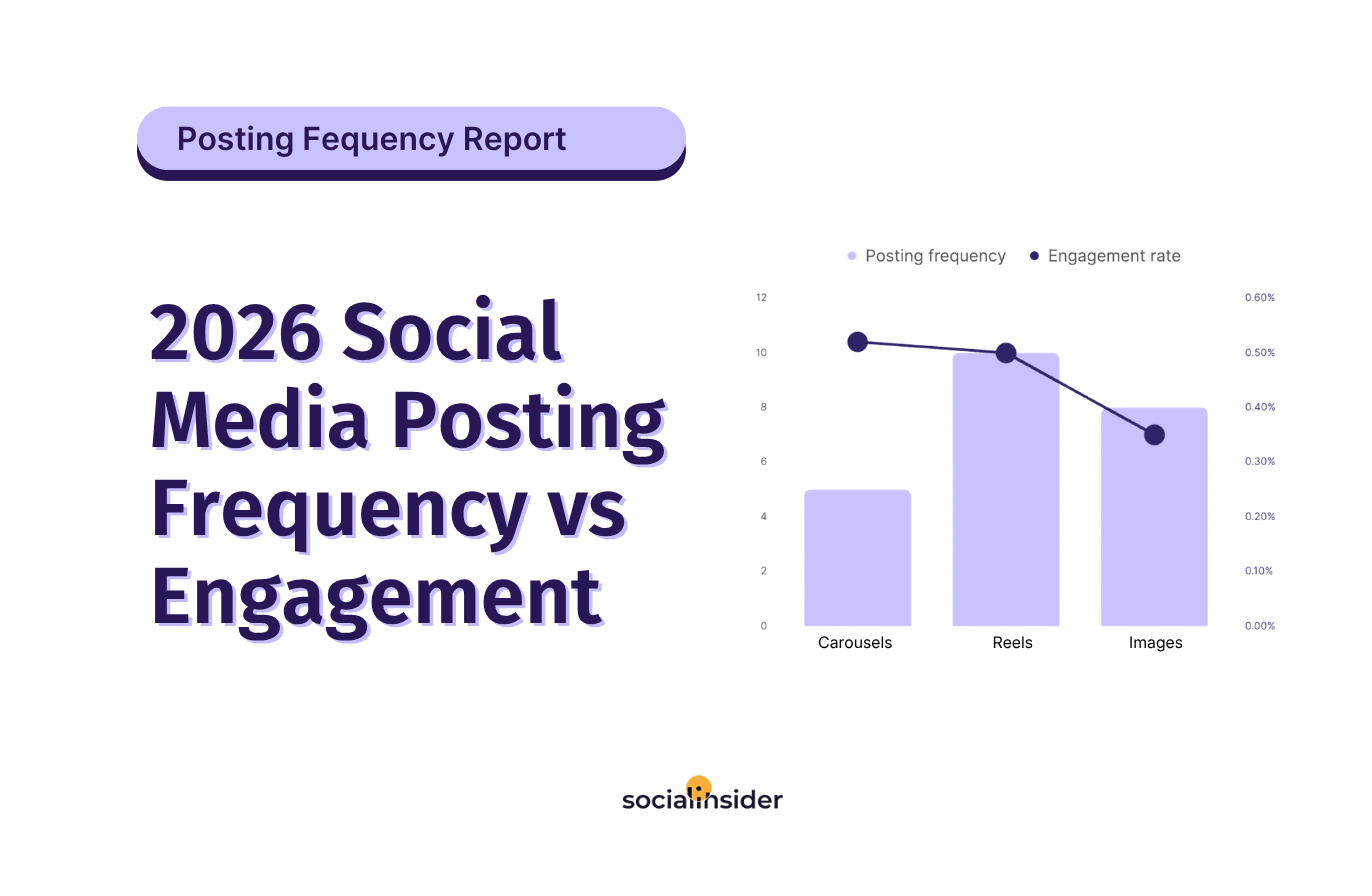
Instagram median interactions
A few things stand out in this data.
Reels consistently lead for interactions, driven primarily by likes and shares, while Carousels follow closely. Single-image posts are a distant third at 80 interactions on average, and have remained broadly flat throughout the period.

Median interactions on Instagram
Instagram interactions include:
- Likes;
- Comments;
- Shares;
- Saves;
- Profile visits and follows;
- Story replies and poll interactions.
Based on Socialinsider data, we track the median interactions on Instagram for the most active pages, with followers between 1k and 1M. Through the API, when measuring the interactions on LinkedIn, we included the following data:
- likes
- comments
Median interactions on LinkedIn
When it comes to generating audience interactions, multi-image posts and native documents are the two dominant formats, outperforming every other content type by a significant margin. Together they consistently generate 2–4x the interactions of a standard image post, and up to 7x more than a link post.

LinkedIn interactions include:
- Reactions (Like, Celebrate, Support, Love, Insightful, Curious);
- Comments;
- Shares;
- Poll votes;
- Clicks on links and documents;
- Follows and connection requests.
Based on Socialinsider data, we track the median interactions on LinkedIn for the most active pages, with followers between 1k and 1M. Through the API, when measuring the interactions on LinkedIn, we included the following data:
- likes
- comments
- shares
Median interactions on Facebook
From what I've seen, for most social media teams, Facebook has become a secondary channel, and the Socialinsider interactions benchmarks support that prioritization. That said, the format-level picture reveals where interaction potential still exists, and it's worth understanding before writing the platform off entirely.
For brands maintaining a Facebook presence, a leaner content approach focused on albums and community-oriented text posts will outperform a high-volume strategy across mixed formats.

Facebook interactions include:
- Reactions (Like, Love, Haha, Wow, Sad, Angry);
- Comments;
- Shares;
- Link clicks;
- Photo/Album views;
- Reels views;
- Status replies.
Based on Socialinsider data, we track the median interactions on Facebook for the most active pages, with followers between 1k and 1M. Through the API, when measuring the interactions on LinkedIn, we included the following data:
- likes
- other reactions
- comments
- shares
How to increase interactions on social media?
Growing interactions on social media isn't about hacking the algorithm. It's about consistently giving your audience a reason to respond. Here are four strategies that work across platforms.
Build community moments around UGC and shared experiences
Some of the highest-interaction content brands publish isn't content they created—it's content their audience created about them.
User-generated content works because it triggers social proof and recognition simultaneously. When someone sees their own content reshared by a brand, they interact. When their followers see it, they interact too.
- Run campaigns with a branded hashtag that invites participation (challenges, before/afters, community spotlights)
- Reshare customer tags, reviews, and testimonials to your stories and feed
- Create 'community round-up' posts that feature audience responses to a previous question
- Acknowledge repeat commenters by name—it signals that your community is being watched and valued
The brands that generate the most interactions on social media tend to be the ones that have made their audience feel like participants rather than spectators.
Use platform-native interactive features
Every major platform has built-in features designed specifically to drive interactions. They work because they lower the effort required to respond—users can tap rather than type.
- Instagram & Facebook: polls, question stickers, emoji sliders, quiz stickers in Stories.
- LinkedIn: native polls perform exceptionally well for B2B audiences—use them to surface professional opinions.
- TikTok: Stitch and Duet features turn your content into a conversation starter.
- X: polls and reply-thread prompts remain effective for opinion-gathering.
These formats also tend to be algorithmically favored. Platforms want users to stay engaged, so content that generates native interactions often gets wider distribution.
Create content that invites a response
The single biggest driver of interactions on social media is whether the content gives someone a reason to engage. Most branded content doesn't. It announces, informs, or promotes—but doesn't ask anything of the audience.
- Ask open-ended questions. Instead of 'We just launched a new feature,' try 'What's the one thing you wish [your tool] did better?' The second version invites a real answer.
- Use polls and quick-vote formats. "This or That" and "Agree or Disagree" posts require almost no effort from users, which means higher participation rates. The lower the barrier, the more people will engage.
- Take a position. Neutral content rarely generates comments. Content that makes a clear argument, challenges a common assumption, or takes an honest stance gives people something to react to—even if they disagree.
Analyze what's working and replicate it
Most brands track interactions. Far fewer use that data to make deliberate content decisions. The gap between the two is where competitive advantage lives.
Here's a practical approach:
- Every month, pull your top 10 posts by interactions on each platform.
- Look for patterns: format (carousel, video, single image), topic, caption length, posting time.
- Identify the 1–2 variables most correlated with strong performance.
- Build those patterns into your content calendar deliberately.
- Compare your interaction rates against competitor benchmarks to see whether strong performance for you is actually strong for your industry.
This last step is where benchmark data earns its keep. A 10% month-over-month increase in interactions looks good in isolation—but if competitors are averaging twice your rate, it's a signal to dig deeper.
Socialinsider's competitive analysis features let you pull interaction data across your own profiles and benchmark it against competitors in your industry, so you're always comparing against the right baseline.
Final thoughts
Social media interactions are one of the clearest signals you have about whether your content is actually working. Not just reaching people — but moving them to respond.
The 2026 benchmark data tells a story that's worth sitting with: TikTok still leads by a wide margin but is losing ground fast, Instagram rewards format discipline over volume, LinkedIn is more format-sensitive than any other platform, and Facebook's organic interaction potential has narrowed significantly.
Across all of them, the brands that consistently generate the most interactions aren't posting more — they're posting smarter, tracking what works, and responding to their audiences like real people rather than broadcast channels.
Elena Cucu
Content & SEO Manager @ Socialinsider with 8 years of experience in marketing. I like to describe myself as a social butterfly with a curious mind, passionate about dancing and psychology.

Know what your competitors do — before your manager asks
Get instant social benchmarks & reports without manual work.