[What Data Says] Instagram Reels Statistics For 2026
Instagram Reels statistics: reach by account size, skip rate, reposts, and engagement by industry — benchmark your strategy with real data.


Every social media professional posting Reels has the same questions: Is my reach rate normal? Am I posting too much — or not enough? And why do some Reels get reshared while others barely move?
The problem is that most Instagram Reels statistics stay surface-level — average engagement rates, broad posting tips — without ever getting into the numbers that actually help you calibrate your strategy and give context to your own performance.
So I dug into the data.
This study covers the Reels metrics that rarely get talked about in benchmarks: reach rate by account size, how video length affects reach, optimal posting frequency, the industries where Reels are genuinely working, skip rates, and reposts. All of it backed by Socialinsider data.
If you've ever wondered whether your Reels are actually performing — or just existing — this is the article for you.
Key takeaways
- Reels are the top-performing format for reach, but only up to 50K followers — beyond that, Carousels take the lead.
- Reels between 30 and 60 seconds generate the highest reach rate, with performance dropping consistently as video length increases.
- Hotels & Accommodation, Restaurants & Cafes, and Travel represnt the top 3 indusries where Reels make for the most engaging content format.
- The larger the account, the lower the skip rate, which is a reflection of stronger brand recognition and more established audience trust.
- Reels generate more reposts than any other content format across all account sizes.
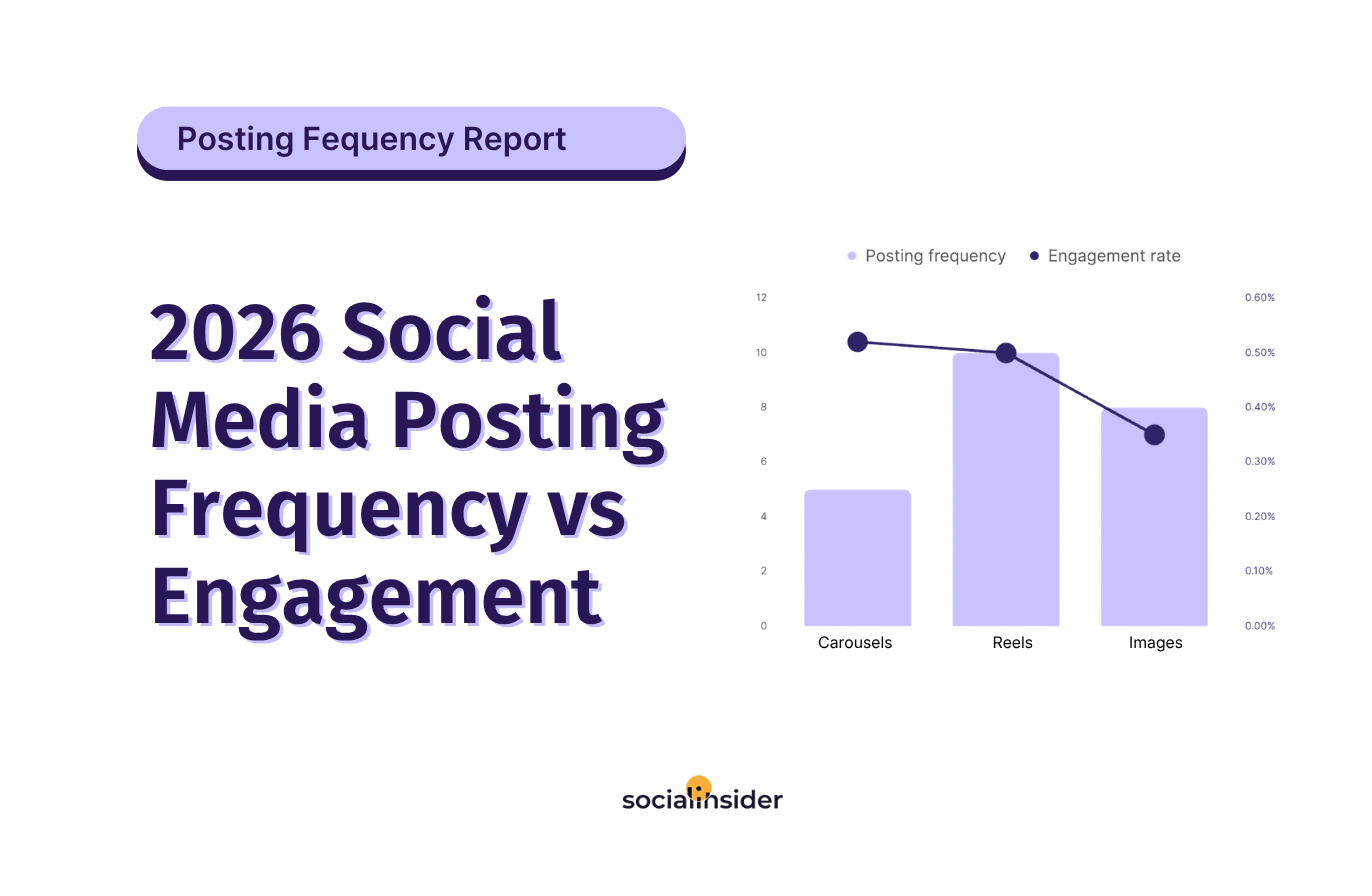
- Posting frequency scales with account size, ranging from 8 monthly Reels for the smallest accounts to 20 for the largest.
Instagram Reels reach statistics
Reach is one of those Instagram Reels performance metrics worth looking at from multiple angles. And here's what I mean by that: while the raw reach number is valuable for understanding how successful your strategy is for gaining extended visibility — a core goal for any brand on social media, it only tells you part of the story— the what happened, but not how to improve it even further.
To help you put your own data into context and give you insights into how to increase your audience, I'll dive into Instagram Reels reach statistics broken down by brand size and also by video length.
Instagram Reels reach by brand size
Word is on the internet that when it comes to reach, Reels are the best-performing content format. But is it true? Well, kind of. Here's what the data tells us: Reels are indeed the content format generating the highest reach rate, but only for accounts below 50 K followers. Exceeding that brand size, Carousels seem to take the lead.

The takeaway: the smaller the account, the harder Reels work for your Instagram Reels reach.
Instagram Reels reach by Reel length
If you've ever debated how long your Reels should be, these Instagram Reels reach statistics by video length give you a pretty clear answer — at least from a reach perspective.
What's most important for you to know: Reels between 30 and 60 seconds generate the highest reach rate, of 5.60% on average. After that, the drop-off is noticeable, with anything beyond two minutes falling to 3.50%, almost half the value of the top.

So, next time you're mapping out your Reels content, keep this in mind: the ones that travel furthest tend to be the ones that respect your audience's time without shortchanging the message.
Instagram Reels engagement rate by industry
With engagement being one of the key performance metrics for social teams, I couldn't keep it out of this analysis. But before diving into the insights, I must remember that engagement numbers vary from industry to industry, which means that not all industries get the same return from Reels.
And if you've ever looked at your Instagram Reels engagement statistics and wondered whether your numbers are actually good or just average for your space, this is the data you need.

At the top of the list, Hospitality & Hotels leads by a significant margin with a 0.38% Reels engagement rate — nearly double that of Restaurants & Cafes in second place. Visually rich, aspirational industries tend to thrive with Reels, and hospitality is a prime example of that. Travel follows closely, rounding out the top three industries where the format is genuinely delivering.
Instagram Reels skip rate by brand size
One of the newest Instagram Reels KPIs, it is arguably one of the most honest Instagram Reels performance metrics out there. Measuring the percentage of people that skipped your Reel within the first 3 seconds of playback, this metric shows you who actively decided yourn content wasn't worth their time. And that's a number I wouldn't ignore if I were you.
As for some benchmarks, the Socialinsider data shows a clear pattern: the larger the account, the lower the skip rate. Brands in the 100K–1M follower range see a 60.50% skip rate on Reels, while accounts in the 1–5K bracket sit at 65.50%.
And while the gap isn't dramatic, the direction is consistent — and the reasoning behind it makes sense. Larger accounts tend to have more established audiences, stronger brand recognition, and more refined content production. People are more likely to stop scrolling when they already know and trust who they're watching.

For smaller accounts, a higher skip rate isn't a red flag so much as a reality of building an audience from scratch. The focus should be on the first few seconds of every Reel — that's where the skip decision gets made, and that's where the work is.
Reels reposts by brand size
Newer on Instagram, reposts represent an effective way to measure brand affinity, given that for this metric a user must relate to brand's content so much to publicly want to be associated with it — beyond the message, with the values it stands for.
And let's not forget that when someone reposts your Reels, beyond vouching for your content and emphasizing your brand's image, the Reels get put it in front of an entirely new audience. That's organic amplification you can't buy. Implicitly, that further translates into increased reach and potential new followers. That's why I advise, when reporting on your Instagram performance during reporting time, to take a look at this new metric as well, and try to understand how it impacts other.
Now back to the data, which indicates that when it comes to reposts, Reels outperform the other content formats across all brand sizes. And it seems that reposts actually scale with account size, with the largest accounts getting up to 10 reposts per Reel.

For brands thinking about how to extend their content's reach beyond their existing followers, this is a compelling case for making Reels a core part of the content mix — not just for algorithm distribution, but for the peer-to-peer amplification that comes with it.
Instagram Reels posting patterns by brand size
Posting frequency, while not a performance metric on its own, it's valuable information when brands are doing competitor research and making correlations between this data point and other Instagram Reels performance metrics, such as reach or engagement.
And here's something interesting I've found out: how often brands post Reels varies significantly depending on account size — and understanding that pattern can help you optimize your content calendar to make sure you're not losing ground in your industry.
So before starting chasing a number that was never built for your situation, take a look at what the current posting frequency data looks like across different brand sizes.

In a nutshell, the larger the account, the higher the Reels posting volume. And that's probably because larger brands typically have bigger content teams and more resources to sustain a higher output — so if you're a smaller account posting 8 Reels a month, you're not falling behind. You're right where brands your size tend to be.
What matters more than hitting a specific number is consistency. Showing up regularly — whatever that looks like for your team — is what keeps the algorithm working in your favor and your audience engaged over time.
Methodology
The findigs of this study are based on the analysis of 140K Instagram Reels, publsihed by business pages between January-June 2026.
The average reach rate is calculated by dividing the total reach by the total number of followers and multiplying the result by 100.
The average engagement rate per post (by followers) on Instagram is calculated as the total engagement (the sum of likes and comments) of the posts published within an established timeframe divided by the total number of followers that a profile has. The result is then multiplied by 100.
Average reposts per post represents the number of reposts a post receives on average.
Average posts per month stands for the average number of Reels posted, on average.
Elena Cucu
Content & SEO Manager @ Socialinsider with 8 years of experience in marketing. I like to describe myself as a social butterfly with a curious mind, passionate about dancing and psychology.

Know what your competitors do — before your manager asks
Get instant social benchmarks & reports without manual work.