23 Social Media Metrics to Track and Analyze for a Powerful Strategy
Discover the 23 essential social media metrics you need to track, what each one means, and how to analyze them for smarter, data-driven decisions.


For a long time, I focused on only a handful of social media metrics. I used to check them one by one, and convince myself I had the full picture. Spoiler: I did not.
Everything changed when I started cross-analyzing metrics. Suddenly, engagement made more sense when paired with reach. Saves and shares revealed what clicks alone couldn’t. Patterns started showing up that I never noticed before.
In this guide, I not only present 23 essential social media metrics that you should measure, but also how you can analyze them in a holistic way.
Let’s improve how you track your social media marketing strategy.
Key takeaways
-
Awareness metrics– Show how many people discover and see your content, helping you understand your brand’s overall visibility.
-
Audience metrics – Reveal who your audience is and how their behavior changes over time, ensuring you attract the right people.
-
Engagement metrics – Measure how actively people interact with your content, showing whether it resonates and sparks action.
-
Content performance metrics – Highlight which content themes and formats perform best so you can refine your strategy with clarity.
-
Video performance metrics – Show how well your videos capture and hold attention, from the hook to the final frame.
-
Competitor metrics – Help you understand where you stand in your industry by comparing your visibility and momentum with others.
-
Conversion metrics – Track how effectively your social content turns attention into meaningful actions that impact business results.
What are social media metrics?
Social media metrics are the measurable data points that show how your overall strategy is performing across content, visibility, audience behavior, and impact. They help you understand what people notice, what they interact with, and what actually drives results.
It helps you answer questions like:
- How is my content performing?
- Are people engaging the way I expect?
- What topics or formats resonate most?
- Is my visibility growing?
- Are we getting any conversions from paid media?
- Are we hitting our social media goals in terms of follower growth, reach, or engagement?
23 social media metrics that matter for effective strategy evaluation (and how to analyze them)
According to our recent Socialinsider survey, which included over 140 social media marketers, the top three metrics measured came out to be engagement, reach, and follower growth.
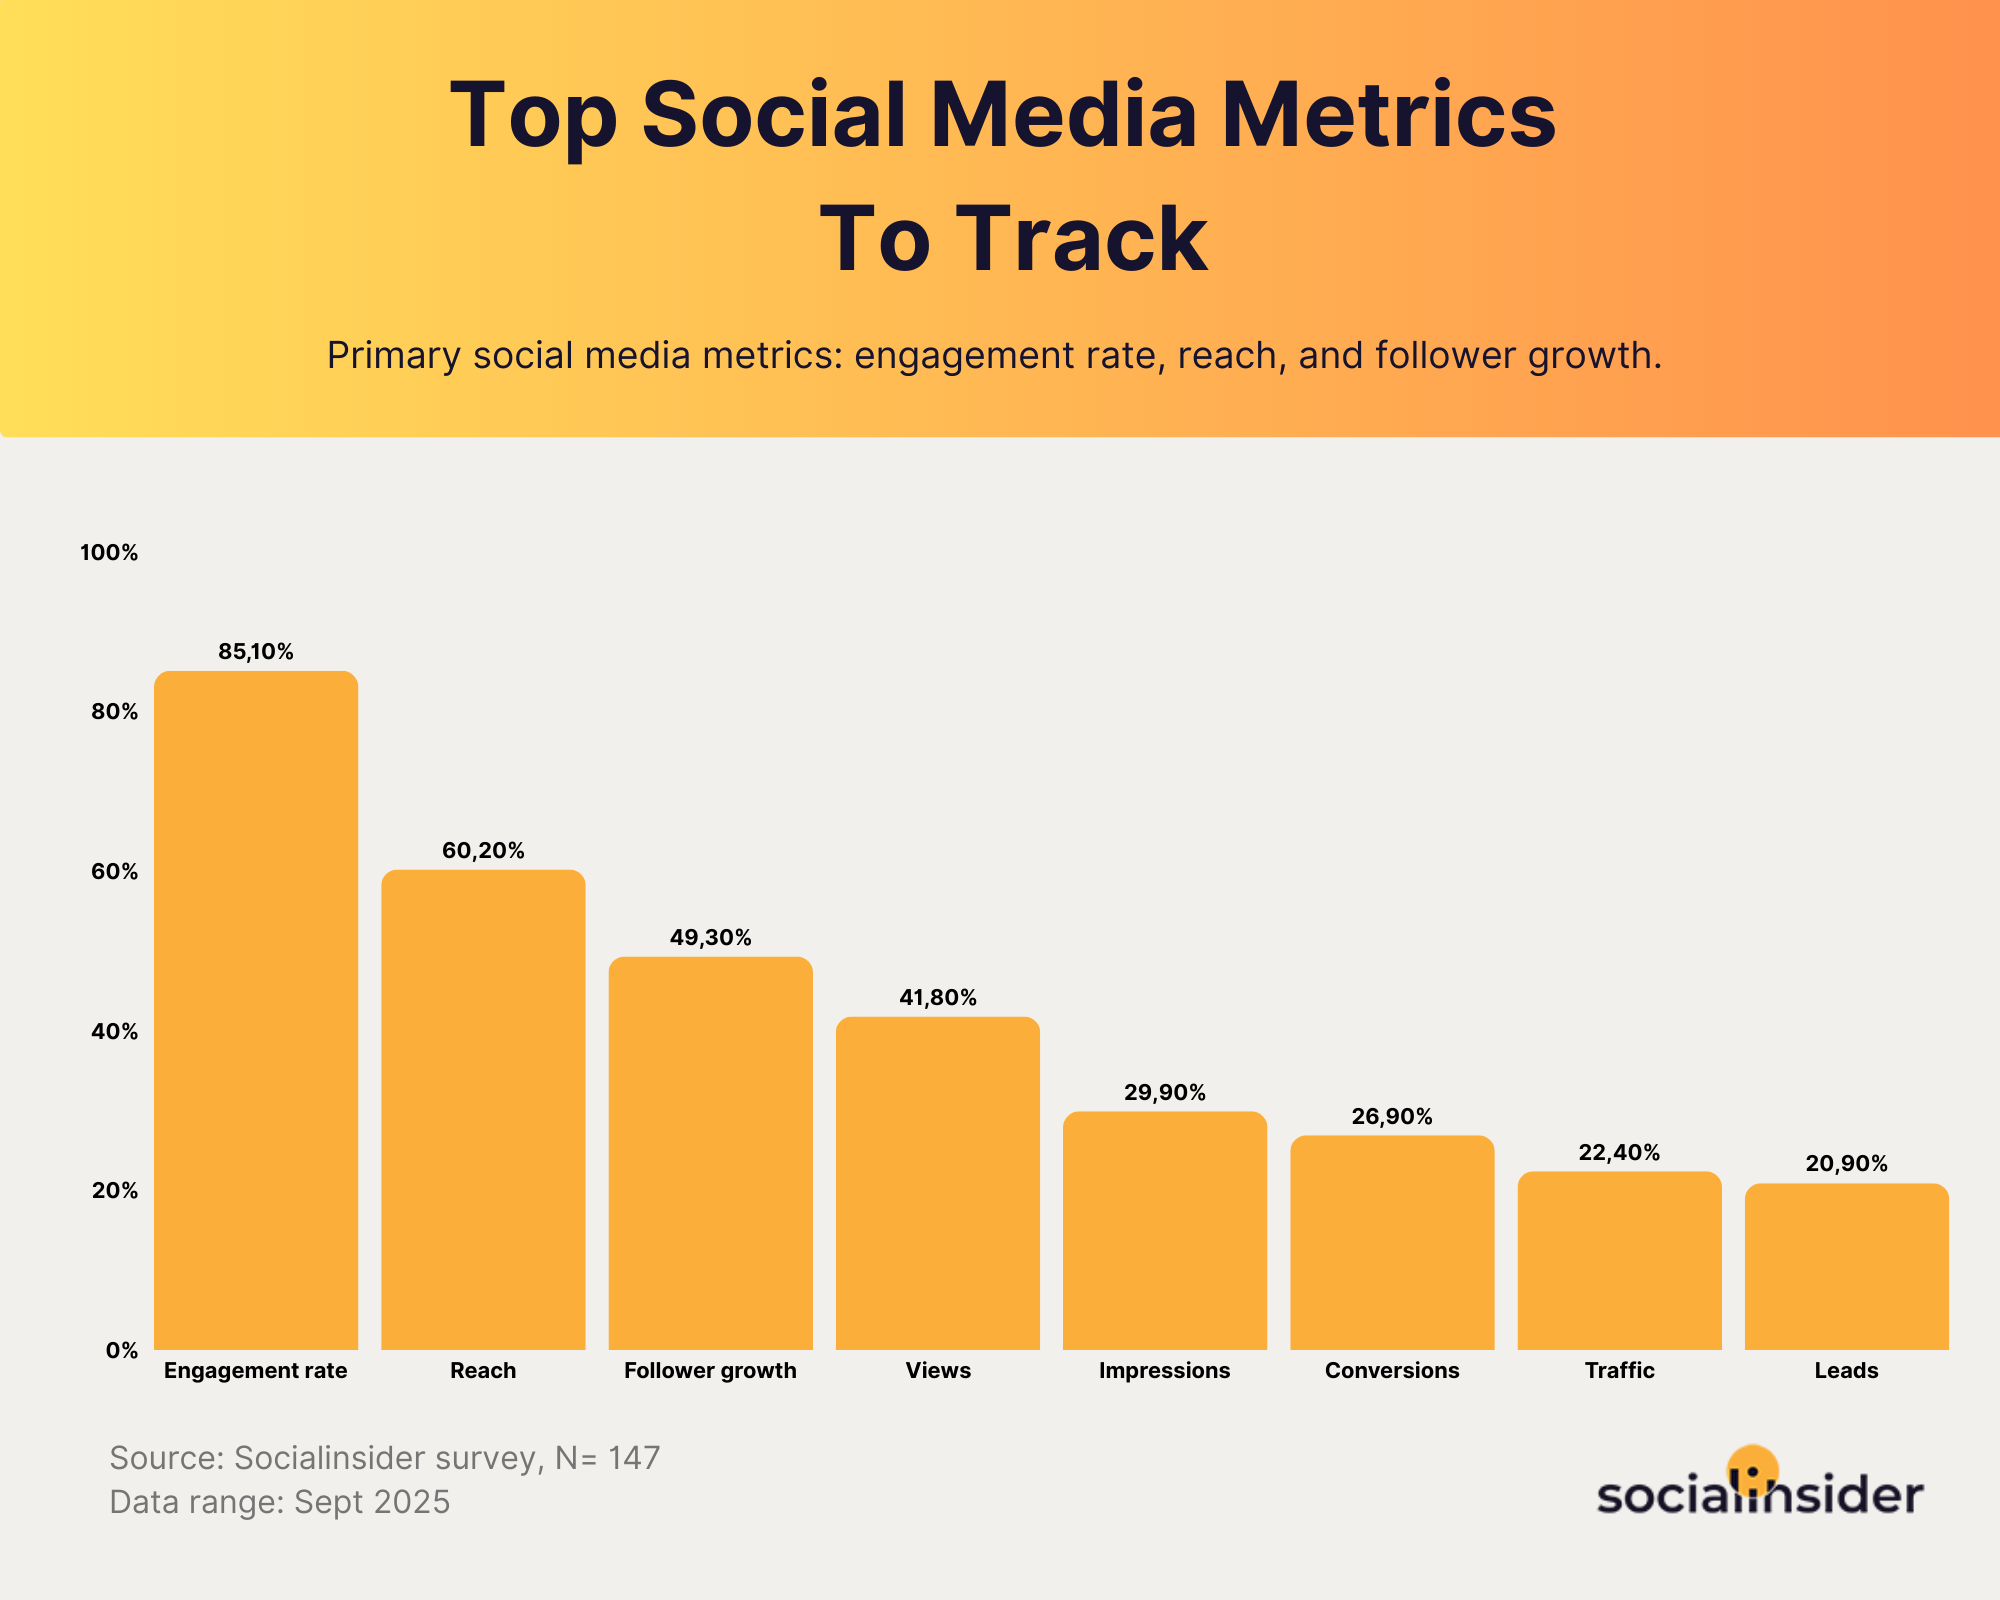
While these three are the top social media marketing metrics every marketer measures, you also need to include those that align specifically with your business goals.
To make this easier, I’ve grouped the key social media metrics into seven categories, allowing you to select the ones that matter most to your business.
Awareness metrics
Awareness metrics show how many people are discovering your brand and how visible your content really is.
They help you understand your overall reach, how far your message is spreading, and whether you’re consistently getting in front of the right audience.
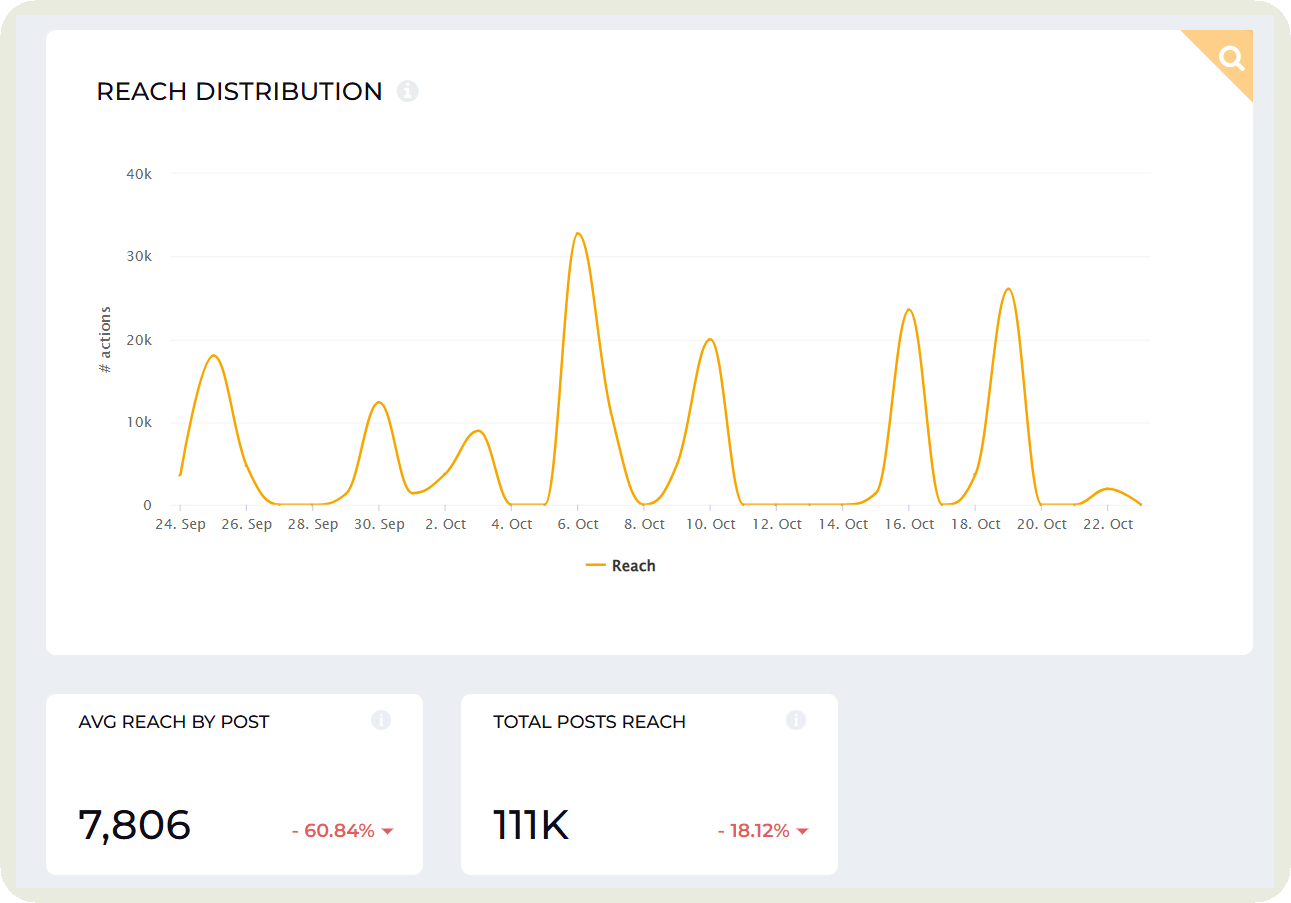
#1. Reach
Reach shows how many unique people saw your content. It is your visibility meter. Higher reach means more eyes on your posts and a greater chance for your message to land.
One of our customers put it perfectly: “When I’m new and need visible wins fast, reach helps me show our brand’s growing footprint.”
How to analyze it:
- Watch for steady, upward movement over time since that signals healthy visibility.
- Consistent reach usually means the algorithm is backing your content and your topics are landing well.
- Notice any sudden dips, as they often indicate weak timing, low relevance, or content that needs refreshing. I use Socialinsider’s anomaly analysis for this. I just click on the dips on the graph, and I can see the content that led to it.
How to analyze reach with other metrics?
#2. Impressions
Impressions show how many times your content was viewed in total. Every view counts, even if the same person sees your post multiple times.
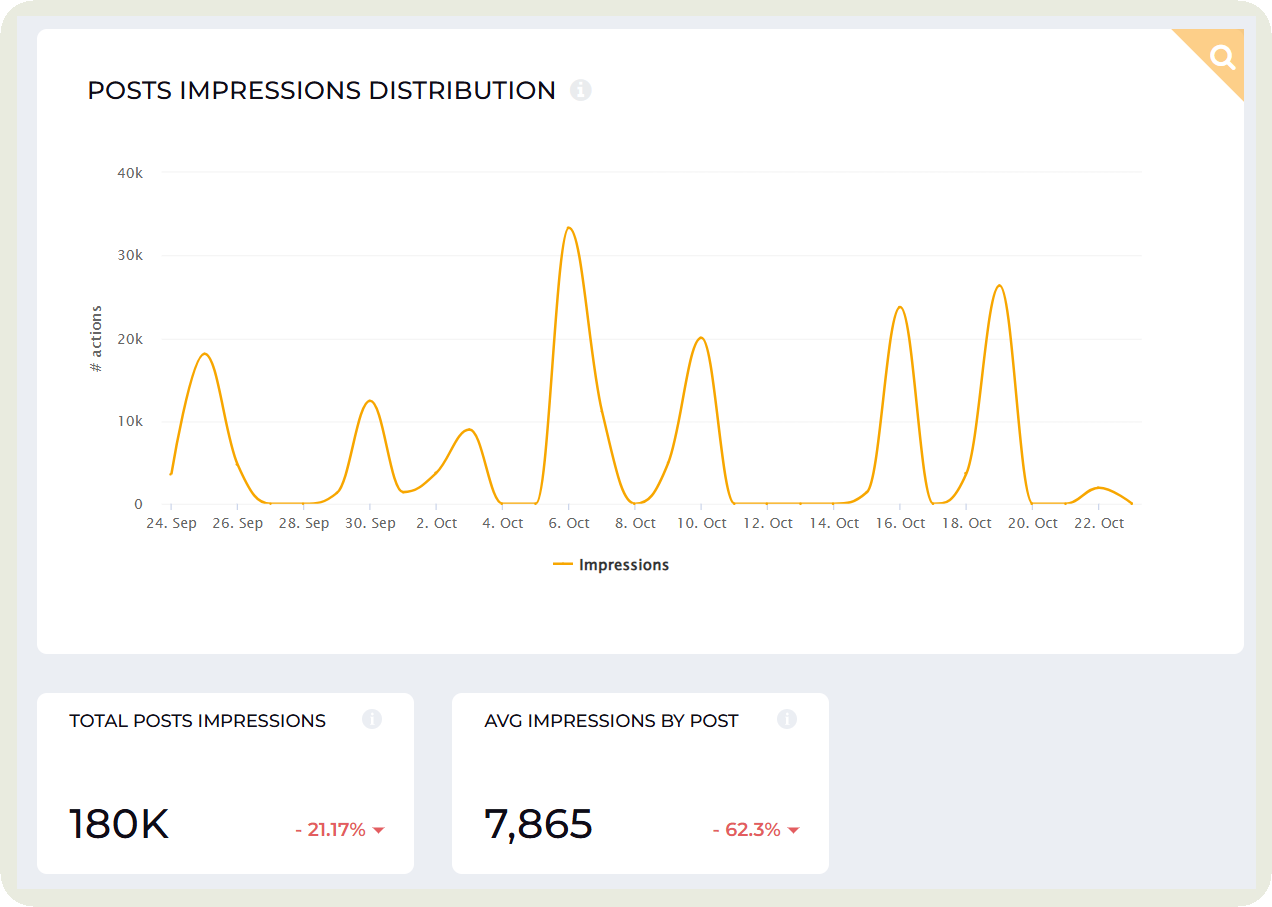
This metric helps you understand how often your content is being surfaced and how present your brand is in someone’s feed.
How to analyze it:
- Good impressions come from strong relevance, high posting consistency, and content that stays visible longer. Look for patterns where impressions rise steadily across posts. That usually means the algorithm keeps pushing your content forward.
- Very low impressions can signal weak hooks, poor timing, or content that gets skipped too quickly.
How to analyze impressions with other metrics
Audience metrics
Audience metrics show who your viewers and followers actually are and how their behavior shifts over time.
They help you understand whether you’re attracting the right people and whether your audience is growing, staying engaged, or quietly slipping away.
#3. Follower growth rate
Follower growth rate shows how quickly your audience is expanding.
It measures the percentage increase in followers over a specific time period, giving you a clearer view of momentum than raw follower counts.
How to analyze it:
- Start by tracking growth week over week or month over month to spot clear trends.
- A good rate depends on your industry and platform, but steady upward movement signals healthy audience interest.
- Look for growth spikes right after high-performing content or campaigns. Those usually confirm that you posted something that resonated.
- Watch for plateaus or dips. These can suggest content fatigue, irregular posting, or targeting that misses the mark.
- You can even analyze your historical follower growth over a period of 2 or 3 years, depending on your plan in Socialinsider.
How to analyze follower growth rate with other metrics
#4. Demographics
Demographics show the makeup of your audience. You get insights into age groups, gender distribution, locations, and sometimes languages.
I use this metric to help understand who I am actually reaching and whether my audience matches the people I want to attract.
How to analyze it:
- Start by comparing your demographic breakdown with your ideal customer profile. Alignment signals you are reaching the right people.
- Look for shifts over time. A sudden change in age group or location may hint at new content themes pulling in fresh segments.
- Check whether your top demographic is the one engaging most often. If they match, your messaging is landing well.
- Watch for large gaps. If certain age groups or locations underperform, you may need targeted posts to reach them.
How to analyze demographics with other metrics:
#5. Audience sentiment
Audience sentiment shows how people feel when they talk about your brand. It classifies conversations and reactions into positive, neutral, or negative tones.
This metric helps you understand emotional response and brand perception.
How to analyze it:
- Start by tracking the ratio of positive, neutral, and negative mentions over time. A healthy sentiment trend leans positive with minimal volatility.
- Look at context, not just volume. A few strong negative comments can outweigh dozens of neutral mentions.
- Watch for sudden shifts in tone. Sharp rises in negative sentiment often signal product issues, confusing messaging, or misaligned content.
- Analyse sentiment after major posts or launches. Strong positive sentiment confirms that your messaging is landing well.
How to analyze audience sentiment with other metrics:
Engagement metrics
Social media engagement metrics show how actively people interact with your content.
They reveal whether your posts spark interest, conversation, or action.
In many of our customer interviews, engagement metrics consistently surfaced as the fastest path to credibility as they combine emotional proof (‘people care’) with functional proof (‘it’s working’).
#6. Engagement rate per post by followers
Engagement rate by followers measures how many of your followers actively interact with your content.
It tells you how involved your existing audience is and how well your posts hit the mark for the people who already chose to follow you.
I also like how this metric provides a fair basis for comparing engagement with competitors, regardless of the difference in followers.
How to analyze it:
- Start by comparing your engagement rate against your industry average. Stronger performance shows your content is resonating.
- Track how your rate moves over time. I take consistent growth to be a signal of a healthy, connected audience.
- Watch how different content types perform. Some formats naturally get higher engagement, which helps you refine your mix. I use Socialinsider to get this data.
- A good engagement rate by followers is one that stays stable even as your follower count grows. When followers rise and engagement stays high, your content strategy is working.
How to analyze engagement rate per post by followers with other metrics:
#7. Engagement rate per post by reach
Engagement rate by reach shows what percentage of people who actually saw your post decided to interact with it.

This metric helps you understand how compelling your content is for viewers, not just followers.
How to analyze it:
- Look for stability as reach increases. A good engagement rate by reach stays steady even when new, unfamiliar viewers enter the mix.
- A good engagement rate by reach varies by platform, but anything consistently above your account baseline signals solid social media performance.
How to analyze engagement rate per post by reach with other metrics:
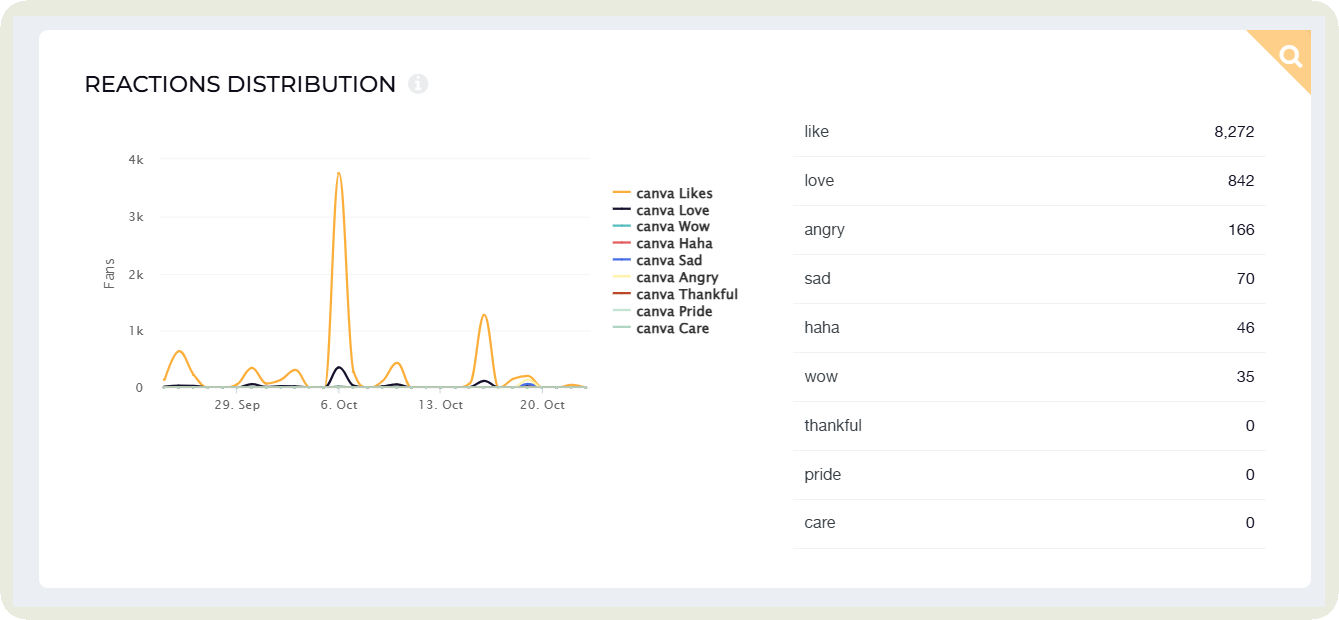
#8. Likes and reactions
Likes and reactions measure how many people tapped a quick signal of approval on your post. They show instant interest and are often the first indicator that your content resonates at a basic level.
How to analyze it:
- Start by comparing likes and reactions to your average performance. Higher numbers signal strong initial resonance.
- Track which types of posts consistently gather more reactions. These patterns point to topics and formats your audience prefers.
- Pay attention to low-performing posts. Drops may indicate weak visuals, unclear messaging, or topics that did not connect.
How to analyze likes and reactions with other metrics:
#9. Comments, shares, and saves
Comments, shares, and saves represent deeper layers of engagement. Comments show conversation. Shares show your content has enough value to be distributed. Saves show long-term usefulness.
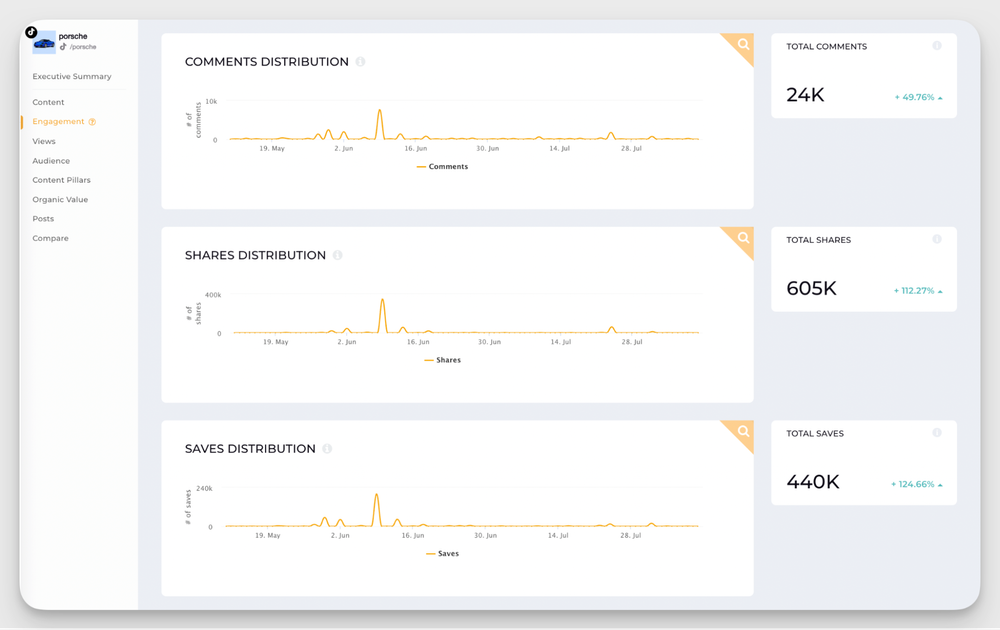
Together, they highlight how strongly your audience connects with your content beyond quick likes.
How to analyze it:
- Look at the quality of interactions. Thoughtful comments, repeat shares, and consistent saves signal real content value.
- Track patterns. I have generally seen educational posts earn saves, relatable posts drive shares, and bold or opinion-based posts bring comments.
- Watch for drops. Low activity across all three usually means the post lacked depth, clarity, or emotional pull.
How to analyze comments, shares, and saves with other metrics:
#10. UGC mentions
UGC mentions track how often people create content that includes your brand. This can be tags, mentions, captions, or posts that feature your product.
Here’s an example of Clinique getting UGC mentions.

It shows that people love your brand or product so much that they are willing to create content around it.
How to analyze it:
- Start by monitoring how frequently your brand gets mentioned across platforms. Steady growth signals rising brand love.
- Look at who is mentioning you. Mentions from loyal customers or niche communities often carry stronger influence.
- Evaluate the relevance and authenticity of each piece. Honest experiences and real use cases perform better than staged content.
- Spot spikes and dips. Spikes usually come from campaigns, good news, or product excitement. Dips may hint at reduced momentum.
How to analyze UGC mentions with other metrics:
Content performance metrics
How did my last posts perform on Instagram? Did my audience accept the new content pillar I introduced last week?
Content performance metrics help answer these questions and more.
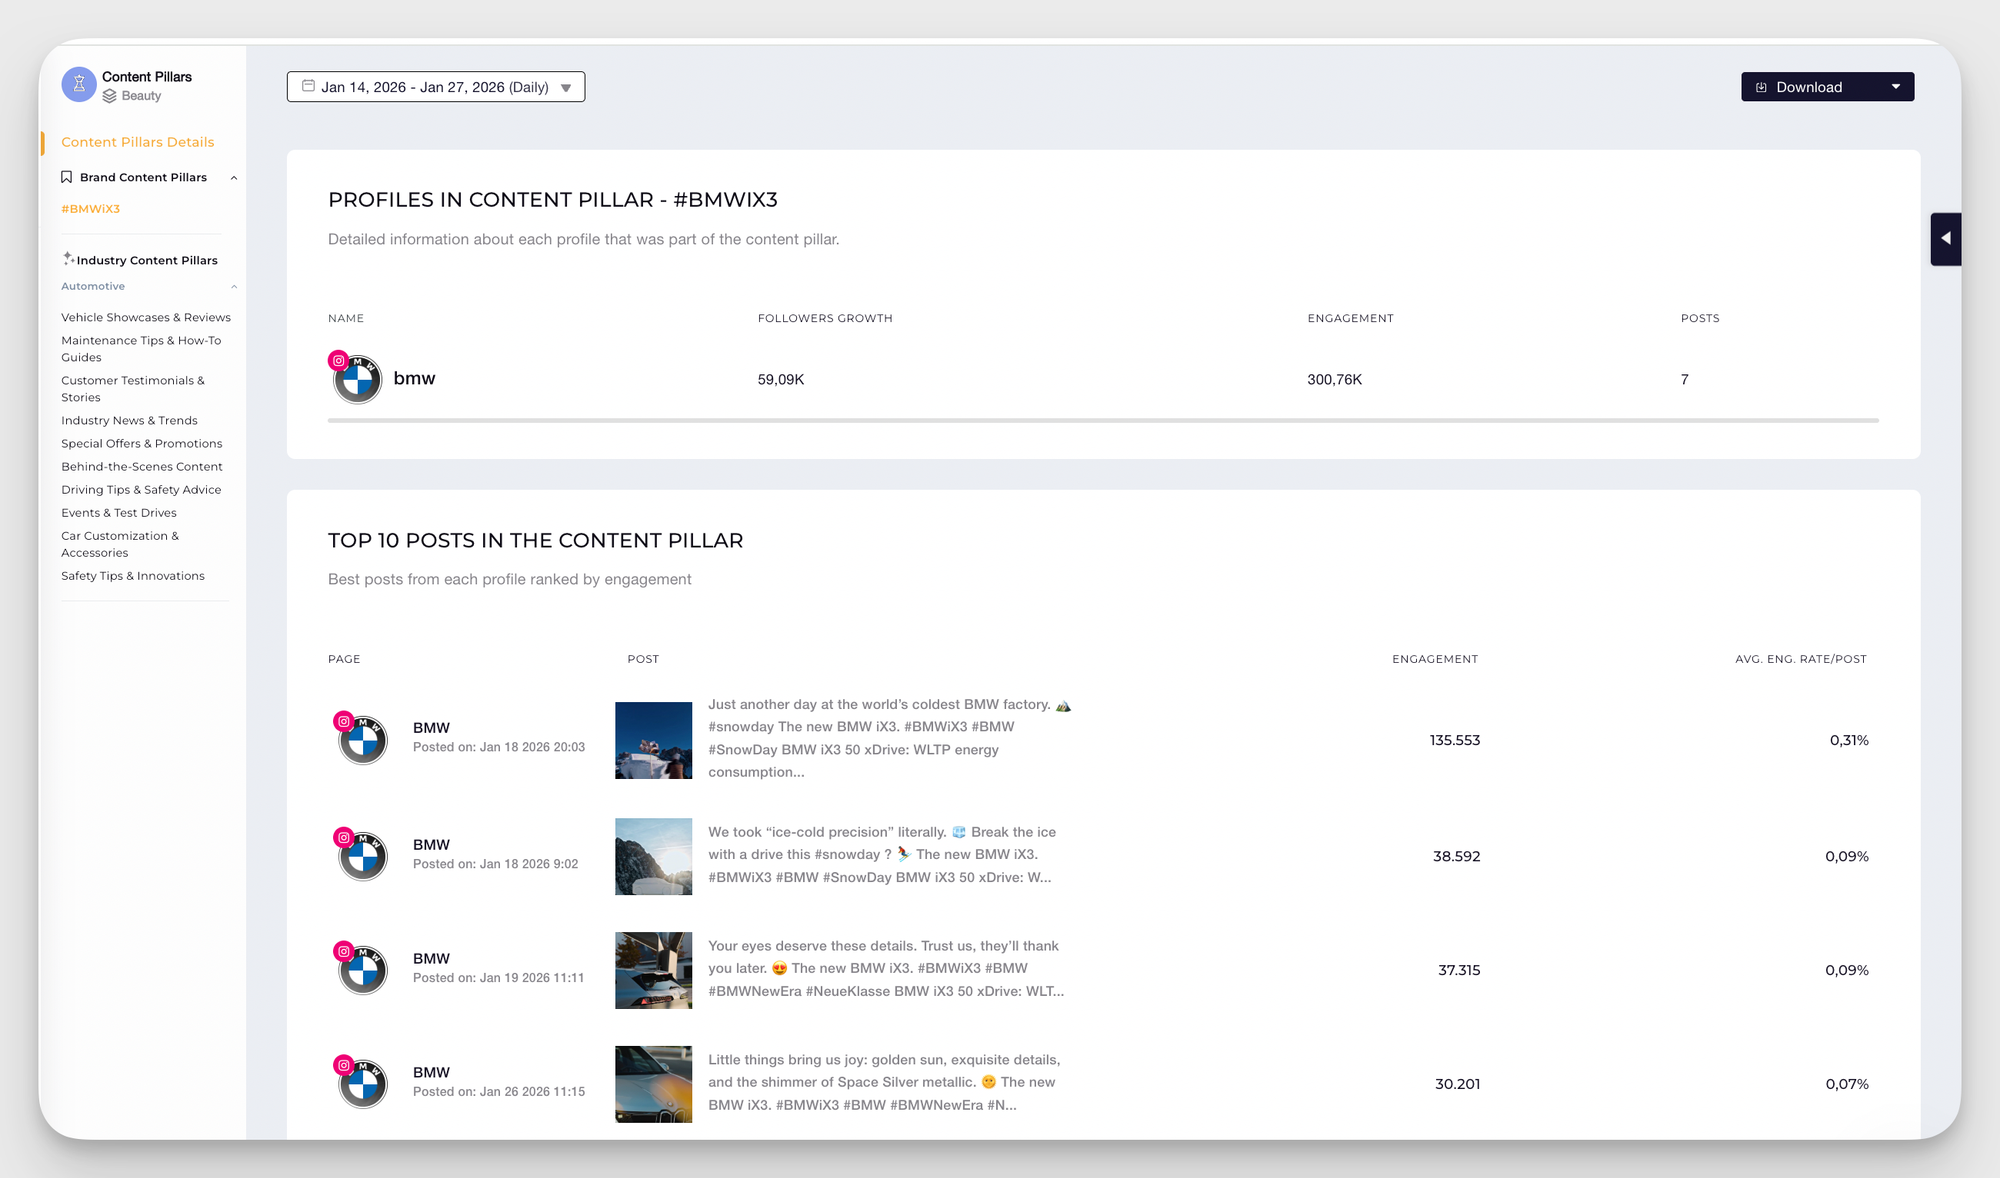
#11. Content pillar engagement
Content pillar engagement measures how well each of your core themes performs.
This is especially helpful if you work on different pillars or are experimenting with new ones, such as humour and employee-featured content.
How to analyze it:
- Begin by comparing engagement across each content pillar to see which themes naturally pull more interest. I use Socialinsider to get this data instead of manual sorting, which takes hours of time.
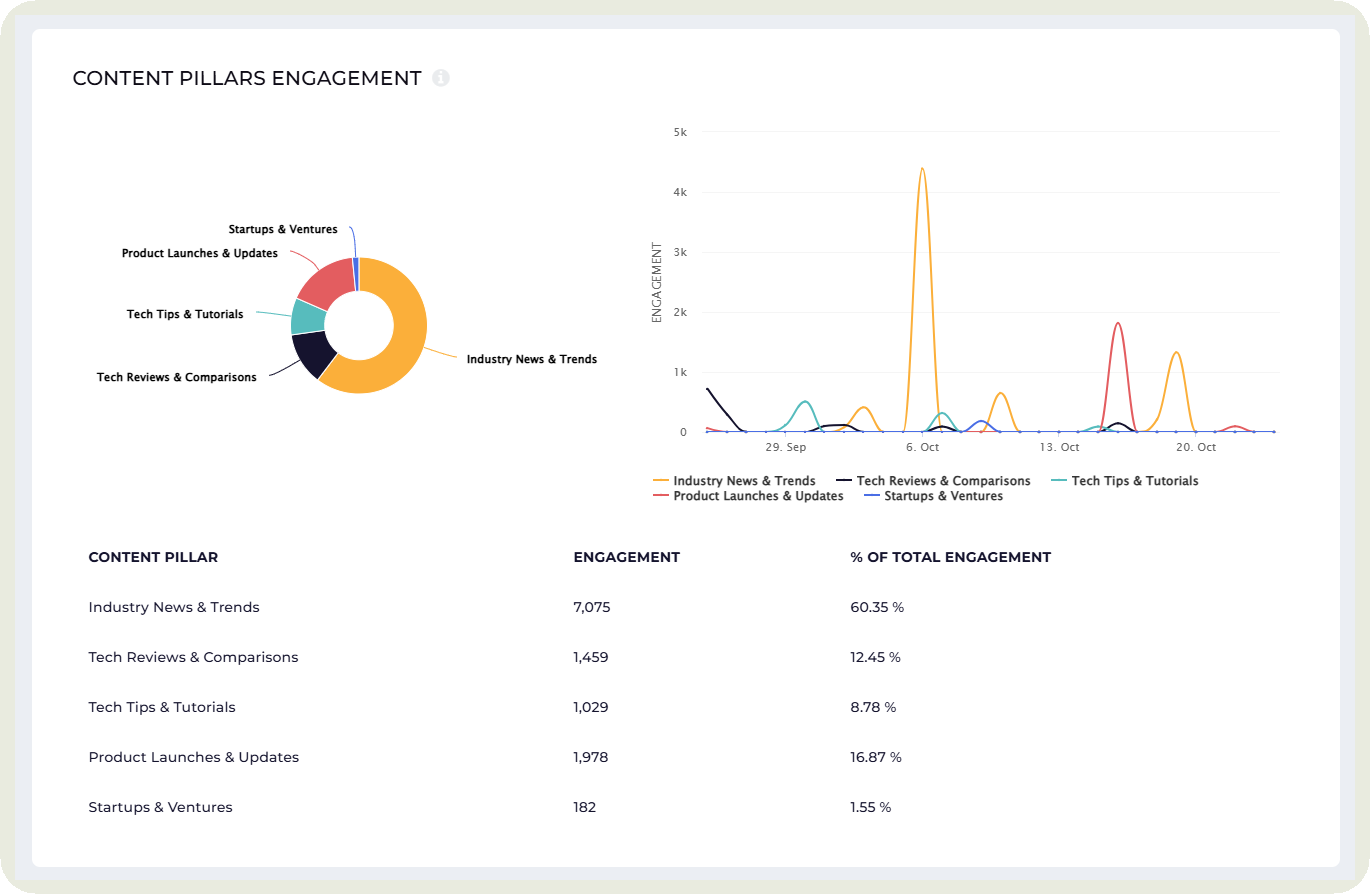
- Look at the depth of engagement. Saves, shares, and comments reveal pillars that drive real value, not just quick reactions.
- Watch for pillars that underperform repeatedly. This typically indicates weak relevance or a content approach that requires reevaluation. Make plans to optimize or revamp how you approach that pillar.
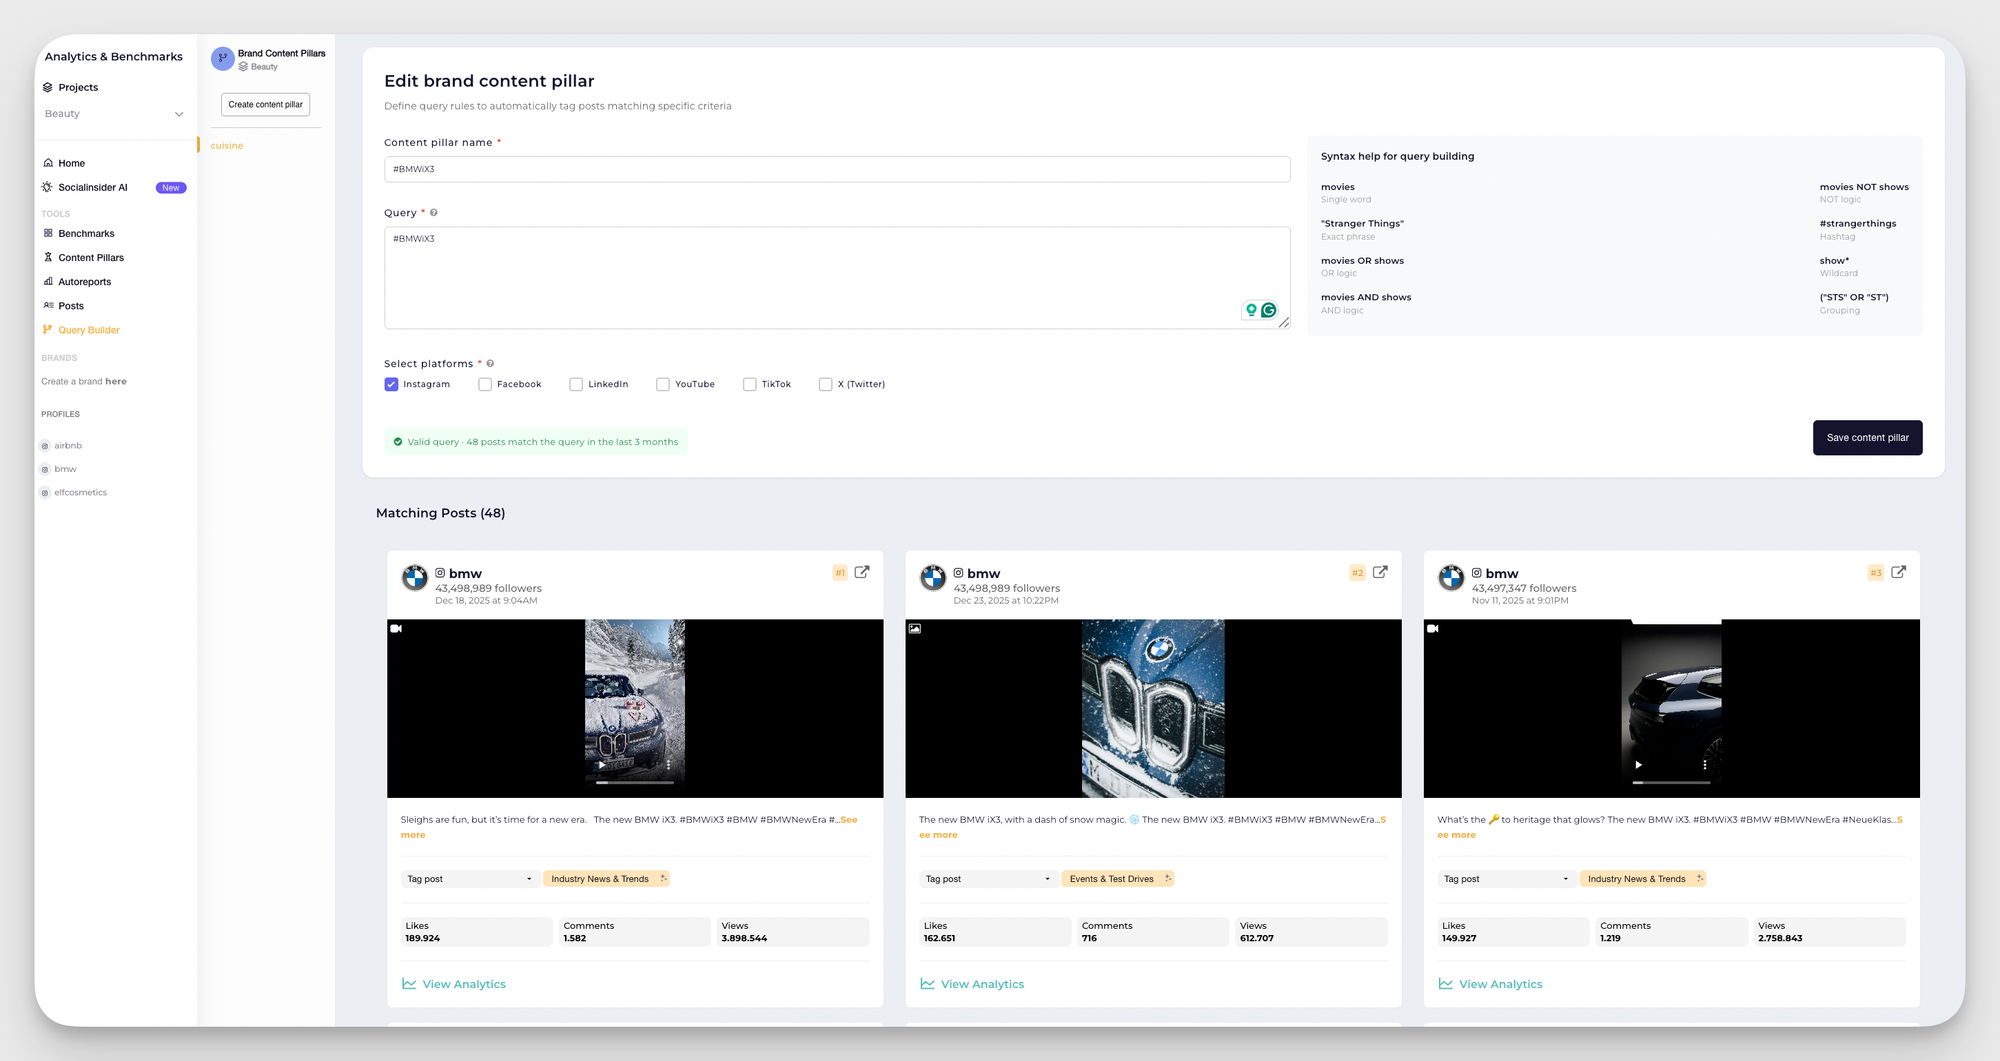
This enables you to monitor results for each branded content pillar you define.
How to analyze content pillar engagement with other metrics:
#12. Content format performance
Working on Reels, carousels, and static images? Which is landing better with your audience?
Content format performance measures how well different creative formats perform across your social channels.
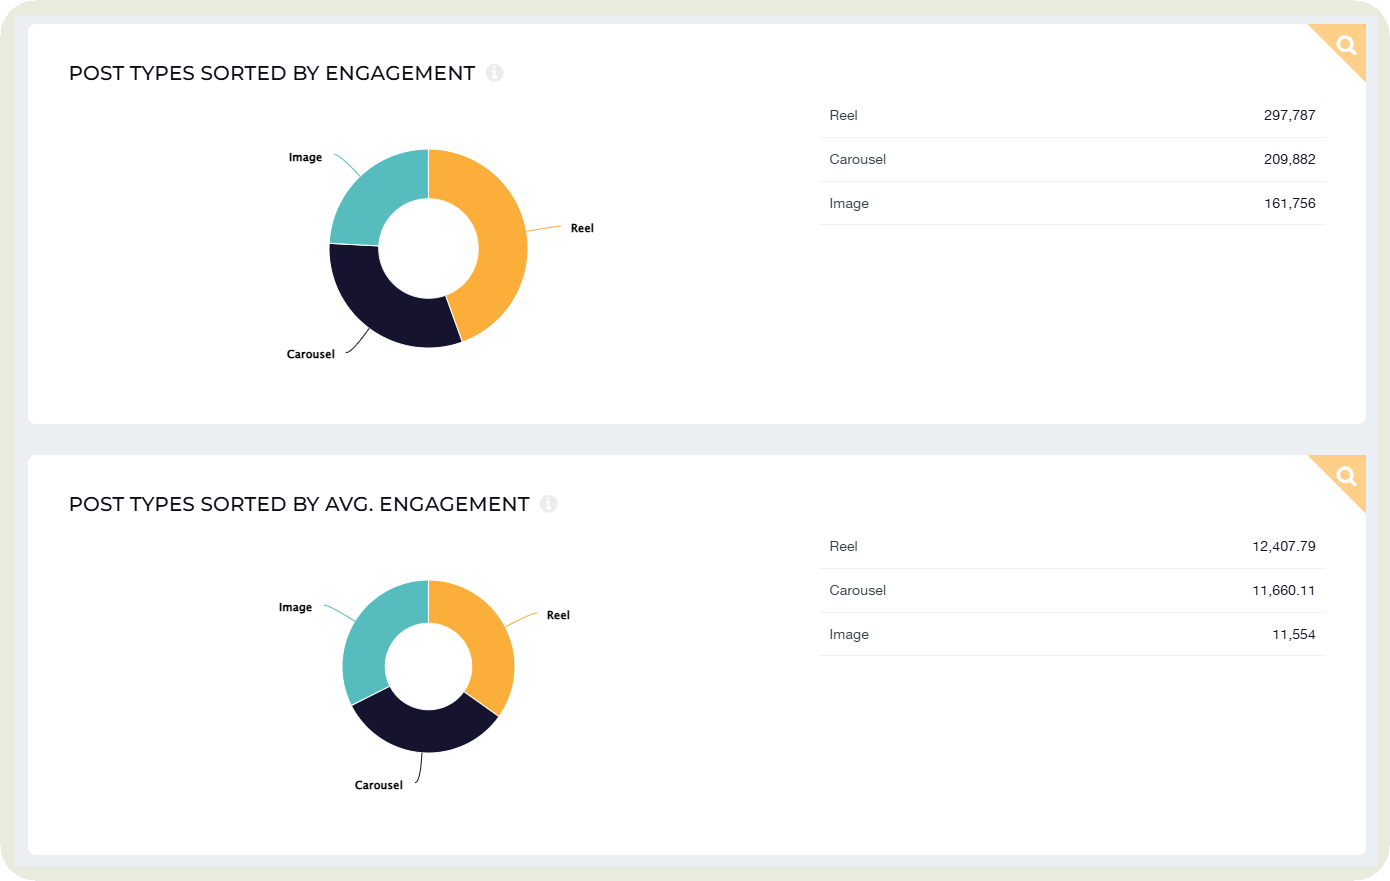
How to analyze it:
- Start by comparing engagement across all formats to identify clear winners and weak performers.
- Track consistency. A high-performing format should deliver strong results across multiple posts, not just one viral outlier.
- Look at the intent behind each format. While educational formats may not bring in a lot of likes, they may drive saves.
- Watch for patterns tied to platform behaviour. Some formats naturally perform better on specific platforms, which can guide distribution.
How to analyze content format performance with other metrics:
Video performance metrics
Video performance metrics show how effectively your videos capture attention and keep viewers watching.
They help you understand whether your hooks work, your pacing holds interest, and your content delivers enough value for viewers to stay or take action.
#13. Video views
Video views show how many times your video was watched.
It shows how well your content captures attention in the first few seconds and whether your hook is strong enough to stop the scroll.
How to analyze:
- Start by comparing view counts across your videos to identify which hooks and formats attract the most watchers.
- Track how quickly views accumulate. Fast early growth signals a strong opening, good timing, or high relevance.
- Look for consistency. Videos that repeatedly earn solid view counts show a working formula.
- Watch for sharp drops. Low views often point to weak thumbnails, poor hooks, or misaligned topics.
How to analyze video views with other metrics:
#14. Video completion rate
Video completion rate shows the percentage of viewers who watched your video from start to finish.
It’s one of my favorite video metrics as it shows me how well my pacing, structure, and message hold attention.
How to analyze it:
- Begin by comparing completion rates across your videos to see which formats and story flows keep people watching.
- I also look at where viewers tend to drop off. Early drop-offs usually point to weak hooks, unclear openings, or slow intros.
- Track stability over time. A strong video theme or style often delivers consistently high completion rates.
How to analyze video completion rate with other metrics:
#15. Watch time
Watch time measures the total amount of time viewers spend watching your video.
It shows how effectively your content holds attention beyond the first few seconds.
How to analyze it:
- Start by comparing watch time across videos to see which topics and formats keep people watching longer. For example, you may notice that videos featuring people tend to be watched more.
- Look at how watch time aligns with video length. Longer videos should deliver proportionally higher watch time to be considered successful.
- If you want to check if your watch time is good, see if it’s climbing steadily and remains above your baseline relative to video length and platform norms.
How to analyze video watch time with other metrics:
#16. Average percentage viewed
Average percentage viewed shows how much of your video people actually watch on average.
While watch time measures total minutes consumed, this metric tells you how far viewers make it through your video. It gives cleaner insight into retention because it removes the influence of video length and focuses purely on viewing progress.
How to analyze it:
- Compare average percentage viewed across your videos to see which ones keep viewers watching the longest.
- Track recurring patterns. Videos that consistently retain a high percentage show strong pacing and relevance.
How to analyze average percentage viewed with other metrics:
Competitor metrics
Ever wondered how your social performance stacks up against others in your industry?
Competitor metrics show where you lead, where you lag, and what strategies competitors use to capture attention.
#18. Share of voice/ranking vs competitors
Share of Voice shows how much of the overall industry conversation your brand owns compared to competitors.
It highlights how visible you are in your niche and where you stand in the competitive ranking.
How to analyze it:
- Track how your SOV moves over time. Rising SOV signals growing influence or improved content performance.
- Examine the platforms on which you win and those on which your competitors dominate. This helps you decide where to focus your effort.
- Watch for dips. A sudden drop in SOV often means competitors have launched campaigns or increased content output.
How to analyze share of voice vs competitors with other metrics:
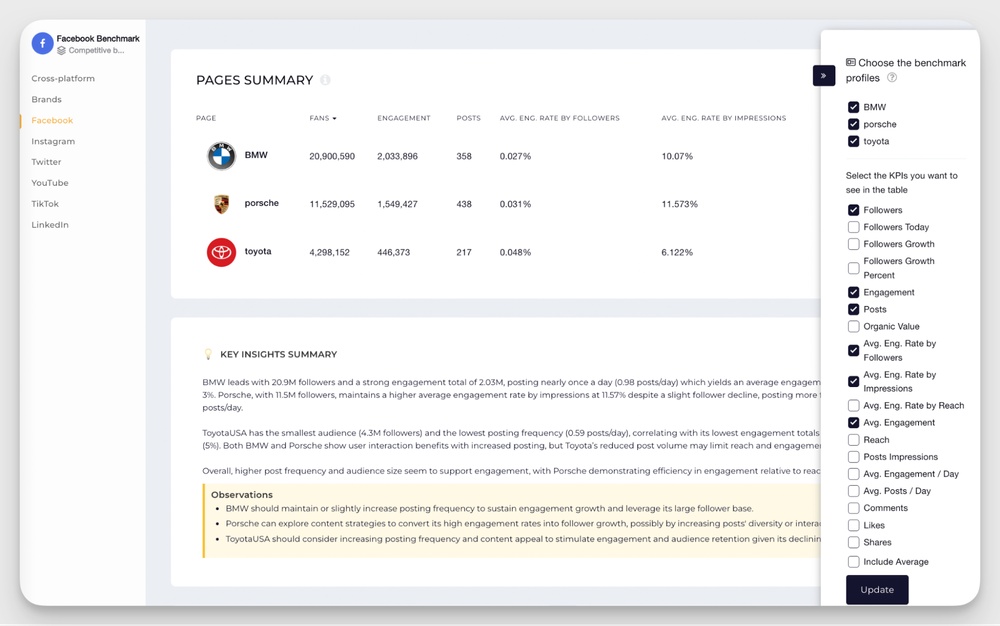
#19. Competitor growth
Competitor growth tracks how quickly your competitors gain followers, engagement, or visibility over time.
It highlights their momentum and helps you understand whether they are expanding faster than you.
How to analyze it:
- Start by comparing competitor growth rates with your own to see who is accelerating. I do this using Socialinsider’s benchmarking feature.
- Look at spikes in their growth. These often link to campaigns, viral posts, or new content formats.
- Track the consistency of their growth. Steady increases usually signal a strong social media strategy rather than luck.
- Watch for slowdowns or plateaus. These can hint at content fatigue or shifting audience interest.
- I also like to check qualitative competitor insights. For example, the tone and style they follow for their Reels. I use this insight to guide my content strategies.
How to analyze competitor growth with other metrics:
Conversion metrics
Conversion metrics show how effectively your social content turns viewers into action takers.
They help you understand whether your posts or even paid media drive meaningful outcomes like clicks, sign-ups, or purchases.
#20. Conversion rate
Conversion rate measures the percentage of people who took a desired action after viewing your content.
This could be clicking a link, signing up, downloading something, or making a purchase.
How to analyze it:
- Begin by comparing conversion rates across posts and ads to see which messages, visuals, or CTAs drive action.
- Look at where conversions come from. Certain platforms or formats often convert better than others.
How to analyze conversion rate with other metrics:
#21. Click-through rate (CTR)
Click-through rate (CTR) measures the percentage of people who clicked on your link after seeing your post or ad.
A strong CTR signals that your message and CTA work together smoothly.
How to analyze it:
- Compare CTR across posts to identify which hooks, captions, and visuals drive the most interest.
- Track how CTR shifts with different CTAs. I also like to test different styles of CTAs to figure out what my audience likes the best.
- Look at CTR by platform. Some platforms naturally generate more clicks based on user behavior.
How to analyze click-through rate with other metrics:
#22. Increase in website traffic
Increase in website traffic measures how many visitors arrive on your site from social media.
I track this often when I am running a campaign or content series to bring people to my website or online store.
How to analyze it:
- Compare traffic spikes with the posts you published to see which ones drive the most visits.
- Look at traffic quality. Time on site and pages per session reveal whether visitors found value after clicking.
- Track platform differences. Some channels send high volumes, while others send fewer but more qualified visitors.
How to analyze an increase in website traffic with other metrics:
#23. Return on ad spend (ROAS)
Return on Ad Spend shows how much revenue you generate for every dollar spent on ads.
It helps you understand whether your paid campaigns actually produce profitable outcomes or simply burn budget.
How to analyze it:
- Look at ROAS by platform. Some channels drive cheaper clicks but weaker conversions, which lowers overall return.
- A good ROAS is one that remains above break-even, outperforms your past campaigns, and supports your profitability targets.
How to analyze return on ad spend with other metrics:
How to align social media metrics to your goals?
As a social media professional, it may be tempting to include all of these social media success metrics in your report. But let me break it to you: it’s not a good idea. Two reasons why:
- You have limited time on your hands. In such a case, you need to focus on metrics that actually matter to your business.
- If you are presenting that report to upper management, it’s best to prioritize your social media reporting metrics so they don’t lose interest by the time you reach your key metrics.
Here are two real-life examples of how to select metrics based on specific goals:
- Situation: You need to prove yourself in a new role.
Metrics to focus on: reach, engagement rate by reach, follower growth
Reason: These are fast credibility wins
- Situation: You need to respond to your client or top management on social media ROI
Metrics to focus on: conversions, increase in website traffic, share of voice, competitor growth
Reason: These metrics reassure executives that social media is making an impact on bottom line goals.
Best practices to use when tracking social media metrics
- Create a consistent calculation for each metric: Some social media performance metrics like conversion rates may have different interpretations and calculations. Some may define conversion as a purchase. Others may define it as an intent to buy.
To prevent misunderstandings, include a short ‘metrics glossary’ in your report so everyone on the team interprets and calculates it in the same way.
- Educate on what the metric shows: Help stakeholders understand what each metric actually represents, not just what it measures.
One of the social media strategists in our survey mentioned, “My number one tip is to focus on context, not just numbers. Metrics on their own can look impressive or concerning, but they don’t mean much until you explain why they happened and what to do next.”
- Track trends over time instead of focusing on absolute numbers: Use MoM (month-over-month) or QoQ (quarter-over-quarter) views to spot improvement or fatigue.
This helps you see if you are growing steadily or if there are dips in your performance.
- Review and refine your metrics when strategies change: Social algorithms, campaign goals, and platform analytics evolve. Revisit your tracked social media KPIs quarterly and remove metrics that no longer offer insight or add new ones that reflect changing goals.
Final thoughts
Picture this: you open your analytics dashboard and, instead of feeling lost, you instantly know what needs your attention. A dip here means your hook needs work. A spike there tells you a content pillar is finally clicking. That is the power of understanding your metrics.
Once you know what each number is trying to say, your decisions feel easier and your results start scaling with far less guesswork.
And if you want all of this without wrestling with spreadsheets, Socialinsider brings every metric and insight together for you. Opt for a free trial to make metric monitoring and calculation easier.
FAQs on social media metrics
How are social media metrics and social media goals related?
Social media goals and social media metrics are two sides of the same coin. Goals give you the direction, set the destination, while metrics act as your GPS, showing you how fast you're moving and how far you’ve come.
For any one goal you set on social media, there’s a set of metrics you should focus on to reach that goal.
For instance, if you intend to build a loyal, active community around your brand, then you should look at metrics such as follower growth and engagement to gauge how fast your audience is expanding and how invested your followers are in your brand’s content.
Nidhi Parikh
Nidhi Parikh is SaaS writer that believes scrolling through social media is research for work. When not working, find her binge watching the latest series or reading anything she can get her hands on.

Analyze your competitors in seconds
Track & analyze your competitors and get top social media metrics and more!
You might also like


Improve your social media strategy with Socialinsider!
Use in-depth data to measure your social accounts’ performance, analyze competitors, and gain insights to improve your strategy.