Instagram Stories Analytics: How To Track And Use The Data?
Take a deep dive into our guide on how to track and use your Instagram Stories analytics to create better-performing Stories and improve results.


When you first take on a new social media leadership role, you quickly realize that Instagram Stories analytics aren’t just “nice to have”—they’re essential for building credibility and driving results from day one. Understandably, you'll need more than just a surface-level look at who viewed your brand's Stories or how many replied.
In this guide, I’m sharing the key Instagram Stories metrics that I track and how I use analytics to shape a successful Stories strategy—even when I’m starting from scratch or navigating a complex brand transition.
If you’re responsible for delivering results, making data-driven decisions, or proving the ROI of your Instagram efforts, this approach will help you move faster, report smarter, and make every story count.
Key takeaways
-
What are Instagram Stories analytics? Instagram Stories analytics are the performance data and insights that show how audiences interact with your Stories, helping you understand what’s working and how to refine your content.
-
Why is it important to track your Stories' analytics? Tracking your Stories' analytics is important because it lets you move beyond guesswork and make informed decisions to optimize reach, retention, and engagement.
-
What are some key Instagram Stories analytic metrics that should be tracked? Key Instagram Stories analytics metrics to track include reach, impressions, taps forward/back, exits, sticker interactions, link clicks, replies, shares, and story completion rate.
-
What are some Roadblocks users encounter when it comes to Instagram Stories analytics? Some roadblocks users encounter with Instagram Stories analytics include limited access to competitor data, missing historical insights, metric inconsistencies, API restrictions, limited sorting, and reporting challenges.
What are Instagram Stories analytics?
Instagram Stories analytics refer to the performance data and insights you can access after posting Stories on your account. These analytics show you how people are interacting with your content—how many are watching, tapping forward, exiting early, or engaging with stickers and links.
If you’re serious about growing your presence, these numbers matter. They help you understand what’s working, what isn’t, and what to do next to keep your audience engaged.
Why is it important to track your Stories' analytics?
Without tracking analytics for Instagram Stories, you’re essentially guessing what your audience wants. With them, you get clarity on:
- which Stories hold attention and which get skipped
- the best times to post
- which interactive elements (like polls, questions, or links) actually drive engagement
Over time, these insights let you optimize your Stories strategy for higher reach, retention, and results.
What analytics data is available for Instagram Stories?
Native Instagram Stories analytics capabilities
If you have a business or creator account, Instagram provides built-in analytics via the Insights tab. You can view:
- Impressions & reach: how many people saw your Story
- Forward & back taps: indicate how engaging or skippable it was
- Exits & next story: shows where users lost interest
- Sticker taps & link clicks: track interaction with elements
These metrics are updated in real-time and remain available for 14 days after publication.
While Instagram provides basic analytics, tools like Socialinsider can help you track these metrics more comprehensively and over longer periods. Socialinsider’s dashboard also makes tracking insights easier, allowing you to spot trends across weeks and months that Instagram’s native analytics might miss.
How to access Instagram Stories analytics
Tracking Instagram analytics for Stories is easier than you think. If you have a business or creator account, here’s how to check your Story performance.
Requirements for accessing Stories insights
To view Instagram Stories analytics, make sure:
- You have a business or creator account (not personal)
- Your account is connected to a Facebook Page (optional, but unlocks more insights)
- You’re posting content using the Instagram mobile app
For teams managing multiple accounts or needing historical data beyond 28 days, Socialinsider eliminates these limitations by storing your analytics for up to 12 months (need more? Reach out to us).
Step-by-step access guide
Via mobile app:
- Open the Instagram app
- Go to your profile
- Tap the Insights button (or use Menu > Insights)
- Under Content You Shared, tap Stories
- Select a time range and view detailed metrics for each Story
Via desktop (Meta Business Suite):
- Visit business.facebook.com
- Select your connected Instagram account
- Navigate to Insights > Content > Stories
- Review performance for past Stories (available for up to 28 days)
Stories archive and insights timeline limitations
Instagram Stories disappear from public view after 24 hours, and native Instagram analytics Stories are only available for up to 14 days in-app and 28 days via Meta Business Suite. This makes long-term tracking and performance comparison difficult, especially if you manage multiple accounts or want to analyze trends.
That’s where a third-party Instagram Stories analytics tool like Socialinsider becomes valuable.
With Socialinsider, you can:
- Access your Stories archive beyond Instagram’s time limits
- View total Stories reach over custom date ranges
- Identify the best day and time for Story engagement
- Sort Stories by reach or impressions to find top performers
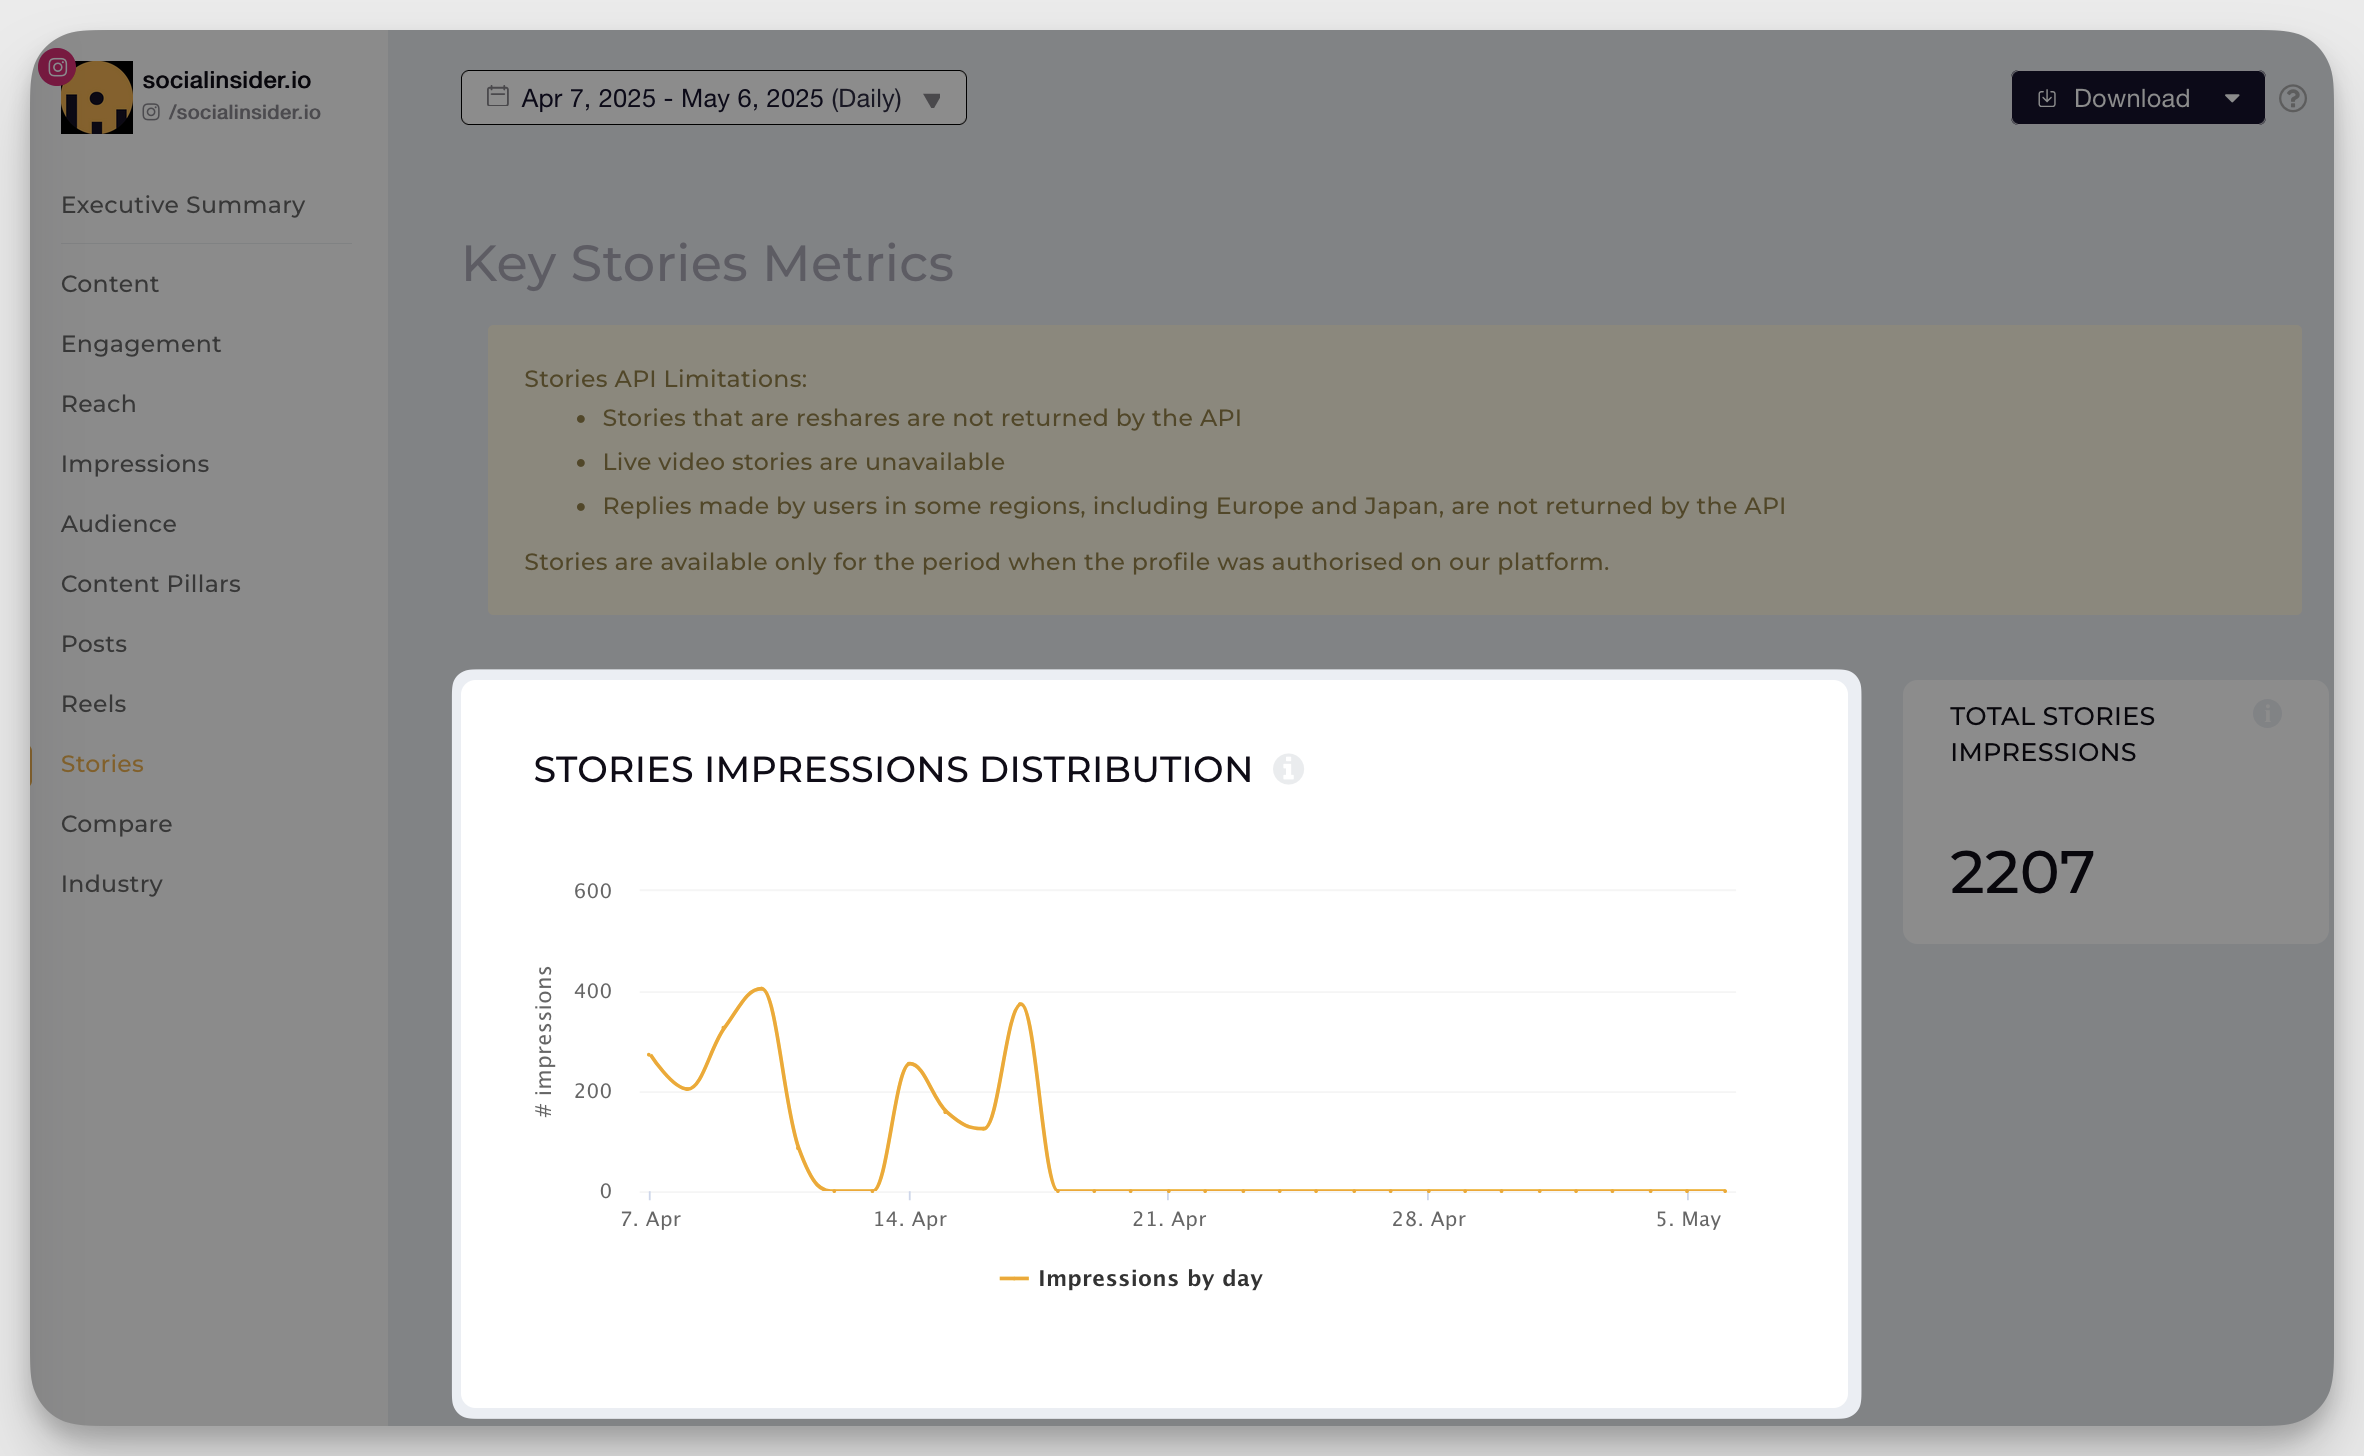
Stories API limitations when using a 3rd party social media analytics tool
While third-party social media analytics tools offer deeper insights into Instagram Stories than what is provided natively, there are still important limitations due to Instagram’s API policies.
Here’s what you need to know when analyzing Stories via external tools:
- Stories that are reshares won’t show up: The API does not return Stories that are reposted from feed posts or other accounts.
- Live video Stories are not supported: If you share a live video as a Story, it won’t appear in your analytics data via third-party platforms.
- Replies from users in certain regions are excluded: Due to privacy regulations, the API does not capture replies to Stories from users in Europe, Japan, and a few other regions.
- Limited access window: Instagram Stories data is only available since the Instagram profile was authorized on the third-party tool. You won’t get access to past Story data prior to that authorization.
These restrictions mean that while third-party Instagram analytics Stories tools like Socialinsider offer advanced reporting, they can only analyze a subset of data defined by what Instagram’s API makes available.
Understanding key Instagram Stories metrics
Instagram Stories performance isn’t just about views—it’s about how people interact with your content. Understanding the right metrics helps you make informed decisions through better audience analysis and the use of Instagram insights.
Reach and impressions for Stories
Reach is the number of unique accounts that viewed your Story.
Impressions represent the total number of times your Story was viewed, including multiple views from the same user.
These metrics help with:
- Evaluating how many unique viewers you’re attracting
- Identifying repeat viewers and content stickiness
- Performing time-based audience analysis to uncover peak engagement hours
How to get reach and impressions in Socialinsider:
- Log in to your Socialinsider dashboard
- Select the Instagram profile you manage
- Navigate to the Stories section
- View reach & impressions for each individual Story
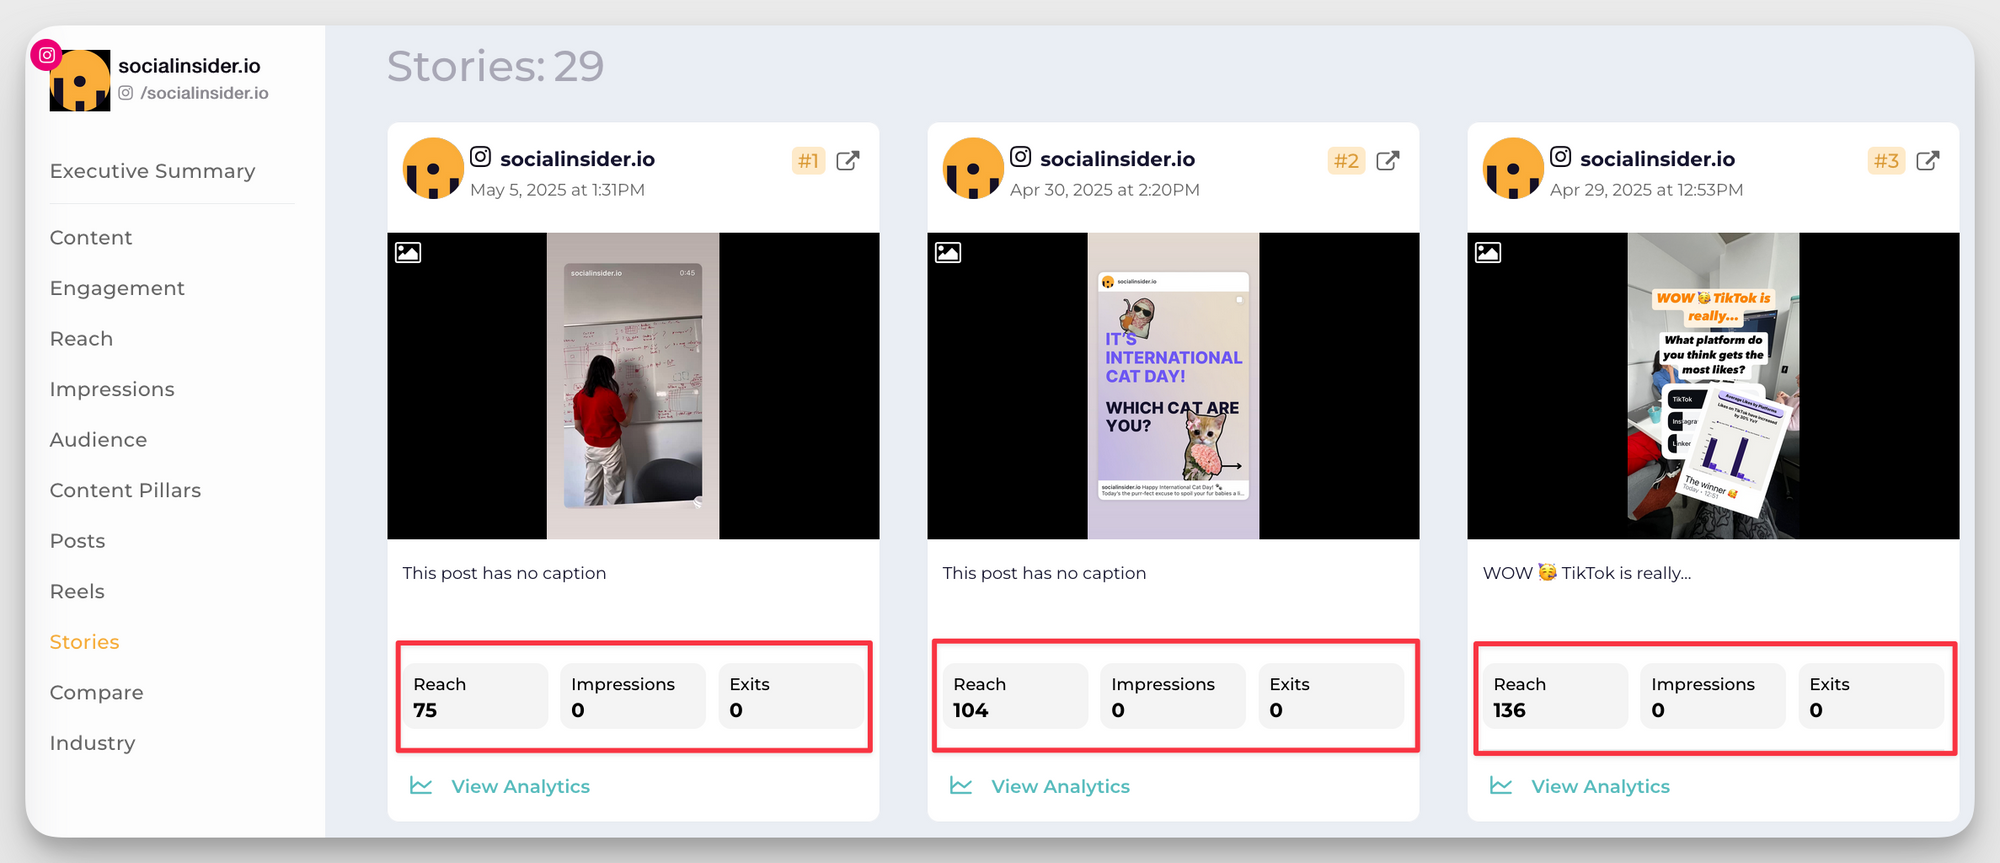
- To analyze performance over time: select a custom time range & see total reach and impressions across all Stories within that window
Navigation metrics explained
Navigation metrics give insight into how users move through your Stories:
- Taps forward: Indicates a skip—your content may not be holding attention
- Taps backward: Signals interest or rewatching
- Exits: Viewers drop off entirely, often tied to disinterest or overload
These actions help decode viewer behavior and improve Instagram insights for future Story content.
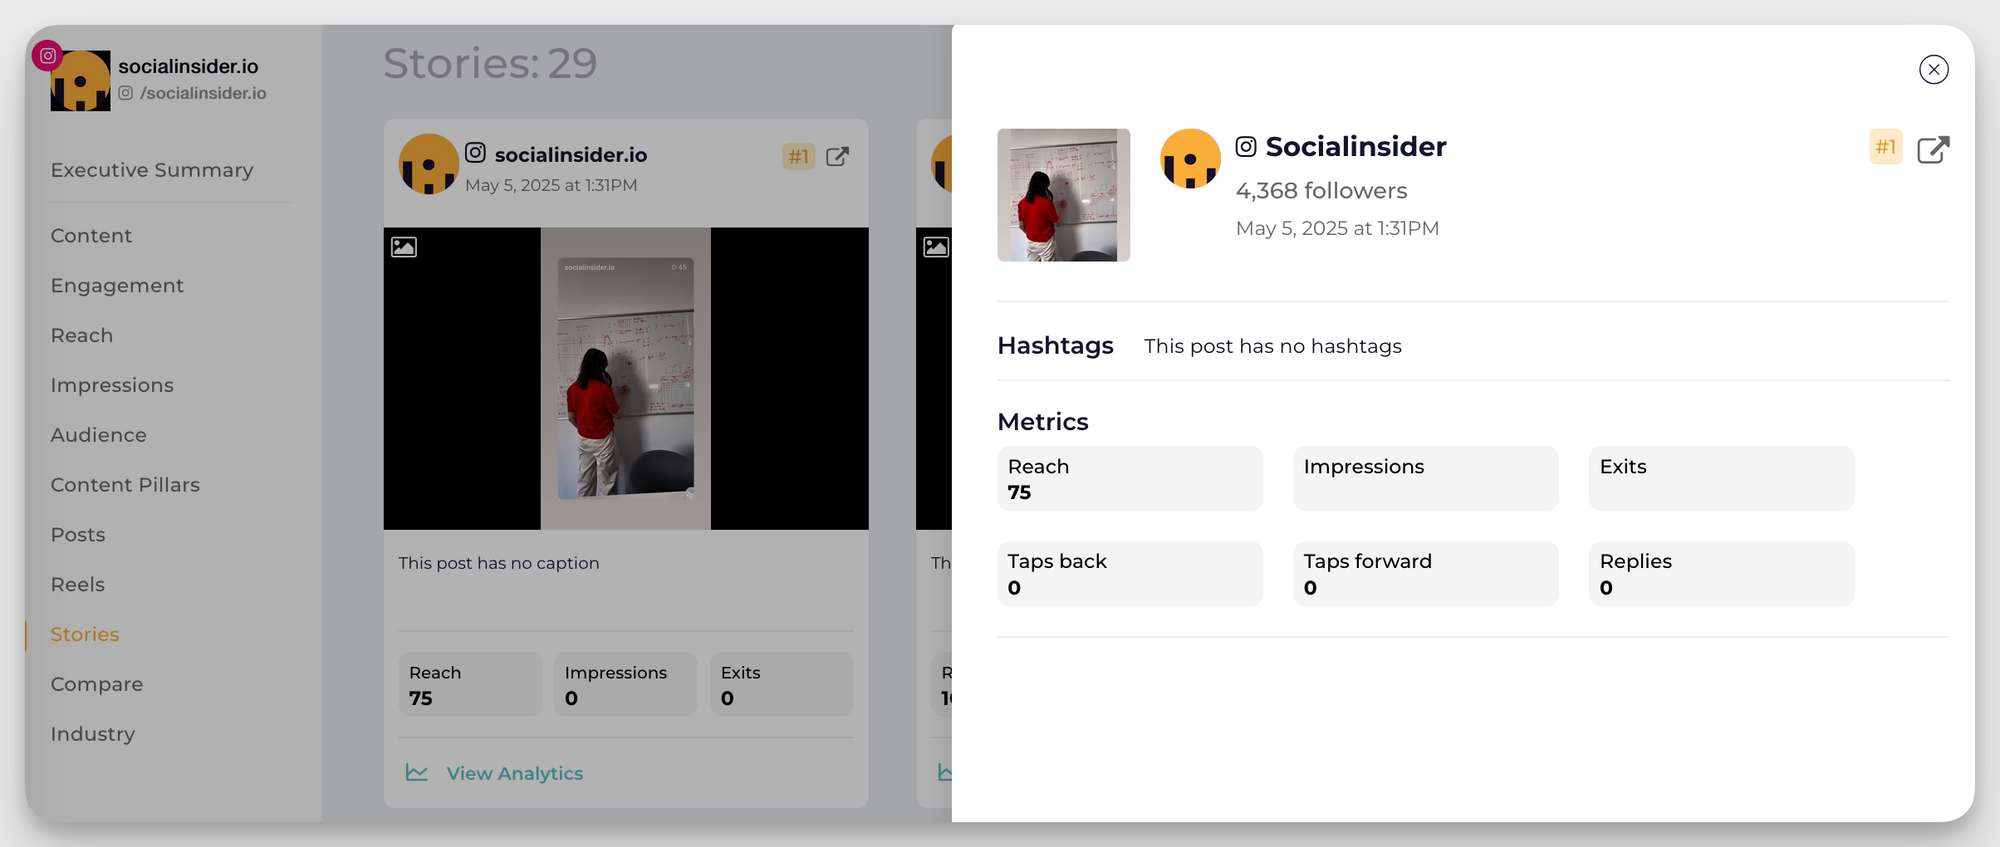
How to get navigation metrics in Socialinsider:
- Go to the Instagram Stories analytics section
- Select the relevant date range or story
- Select the Story you want to see the analytics for
- View taps forward, backward, and exits
- Use this for audience analysis and to identify which Stories encourage or lose Instagram engagement
Engagement metrics
Engagement metrics help you understand which Stories spark interaction:
- Replies: Private messages in response to your Story (available in Socialinsider only for owned accounts based in the US and Canada)
- Shares: Users sharing your Story with others
- Sticker interactions: Engagement with polls, quizzes, sliders, etc.
- Link clicks or swipe-ups: Useful for measuring direct action
These are some of the most valuable Instagram insights when evaluating content effectiveness.
Story completion rate
Completion rate = (Viewers who reached the last frame ÷ Viewers of the first frame) × 100
It measures how engaging your Stories are from start to finish, which is key for building strong narrative arcs or converting viewers.
How to get the completion rate in Socialinsider:
- Step 1: Select the day or custom time period you want to analyze
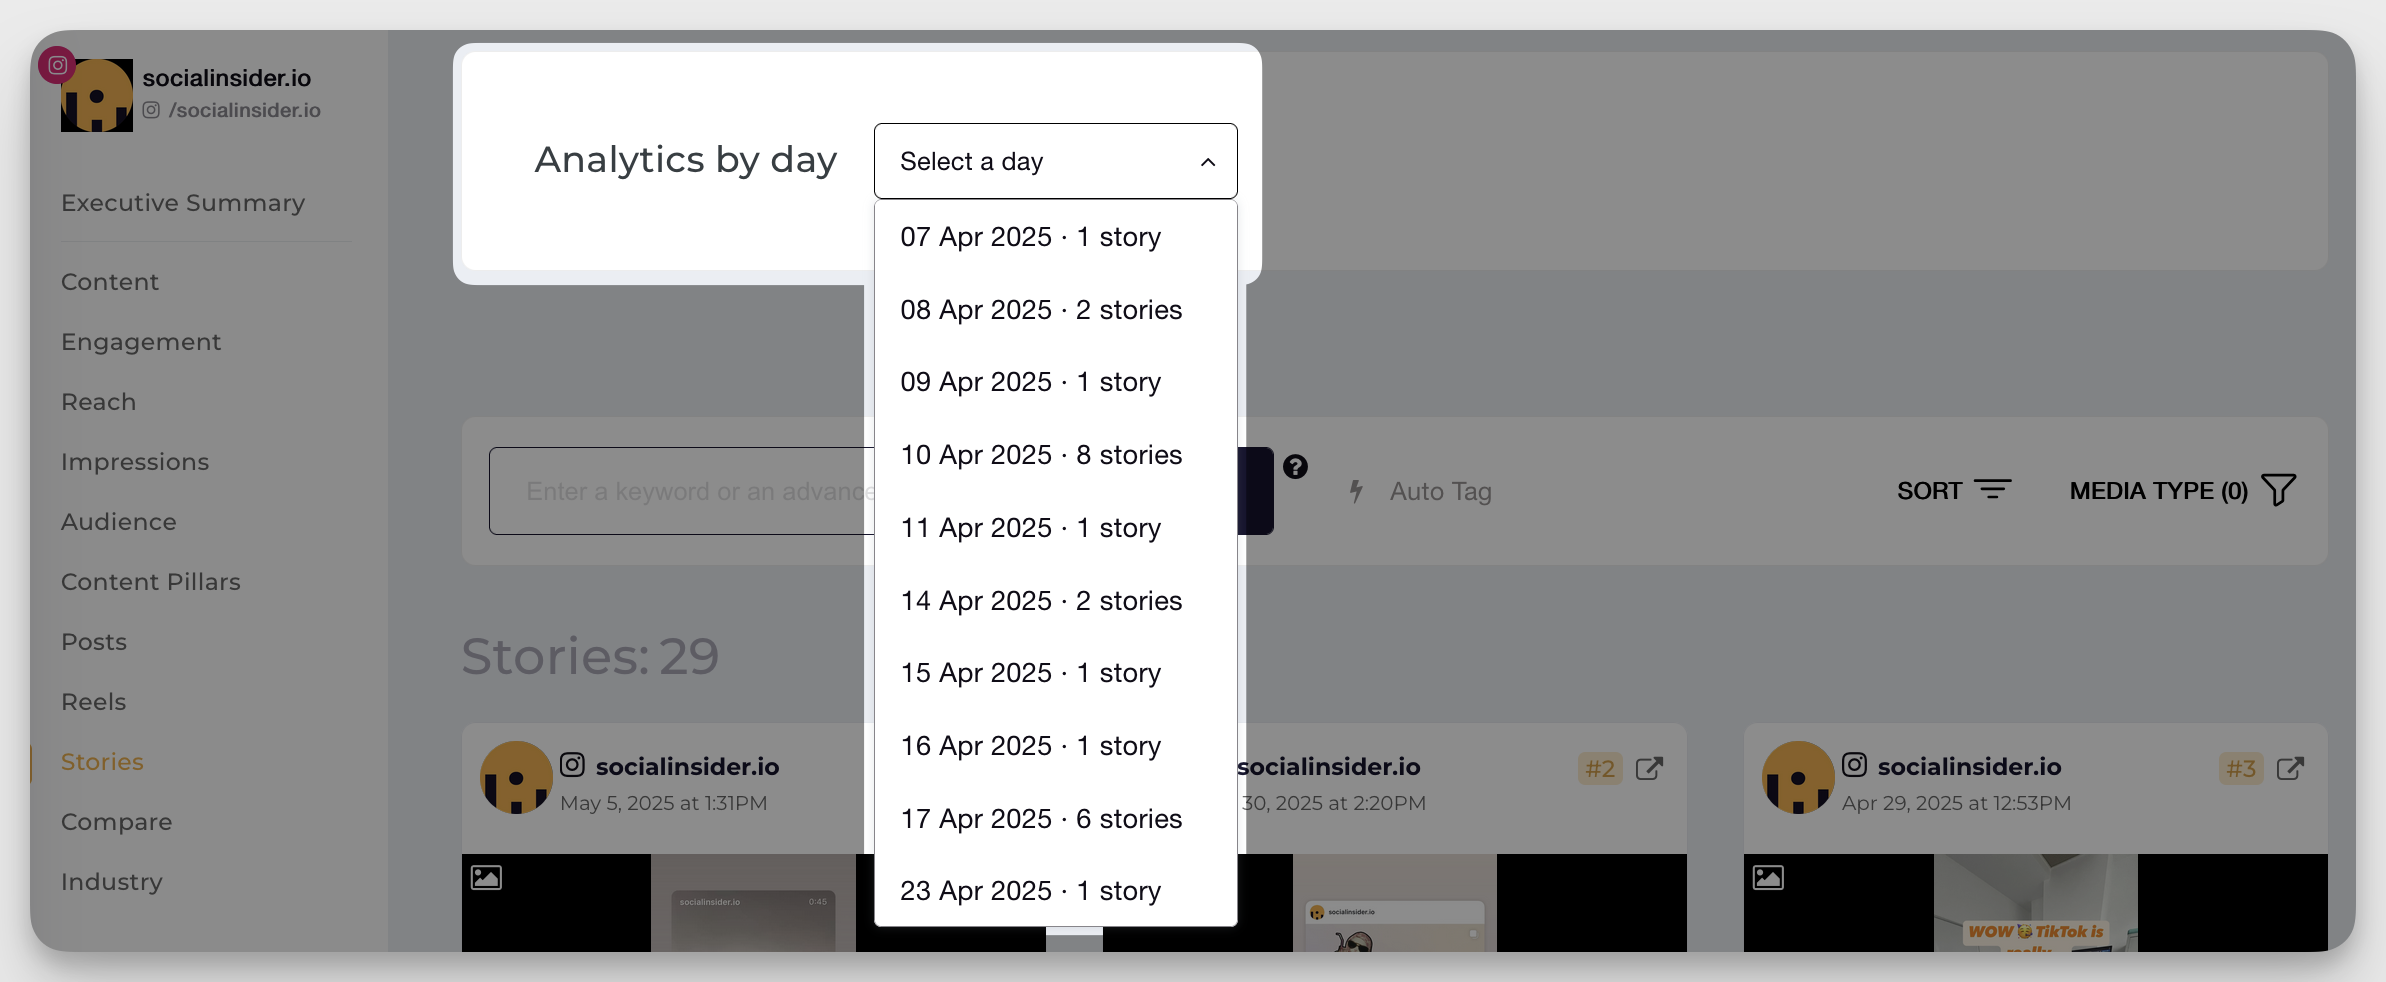
- Step 2: Go to the Stories overview section
- Step 3: Analyze retention metrics from the first to the last frame
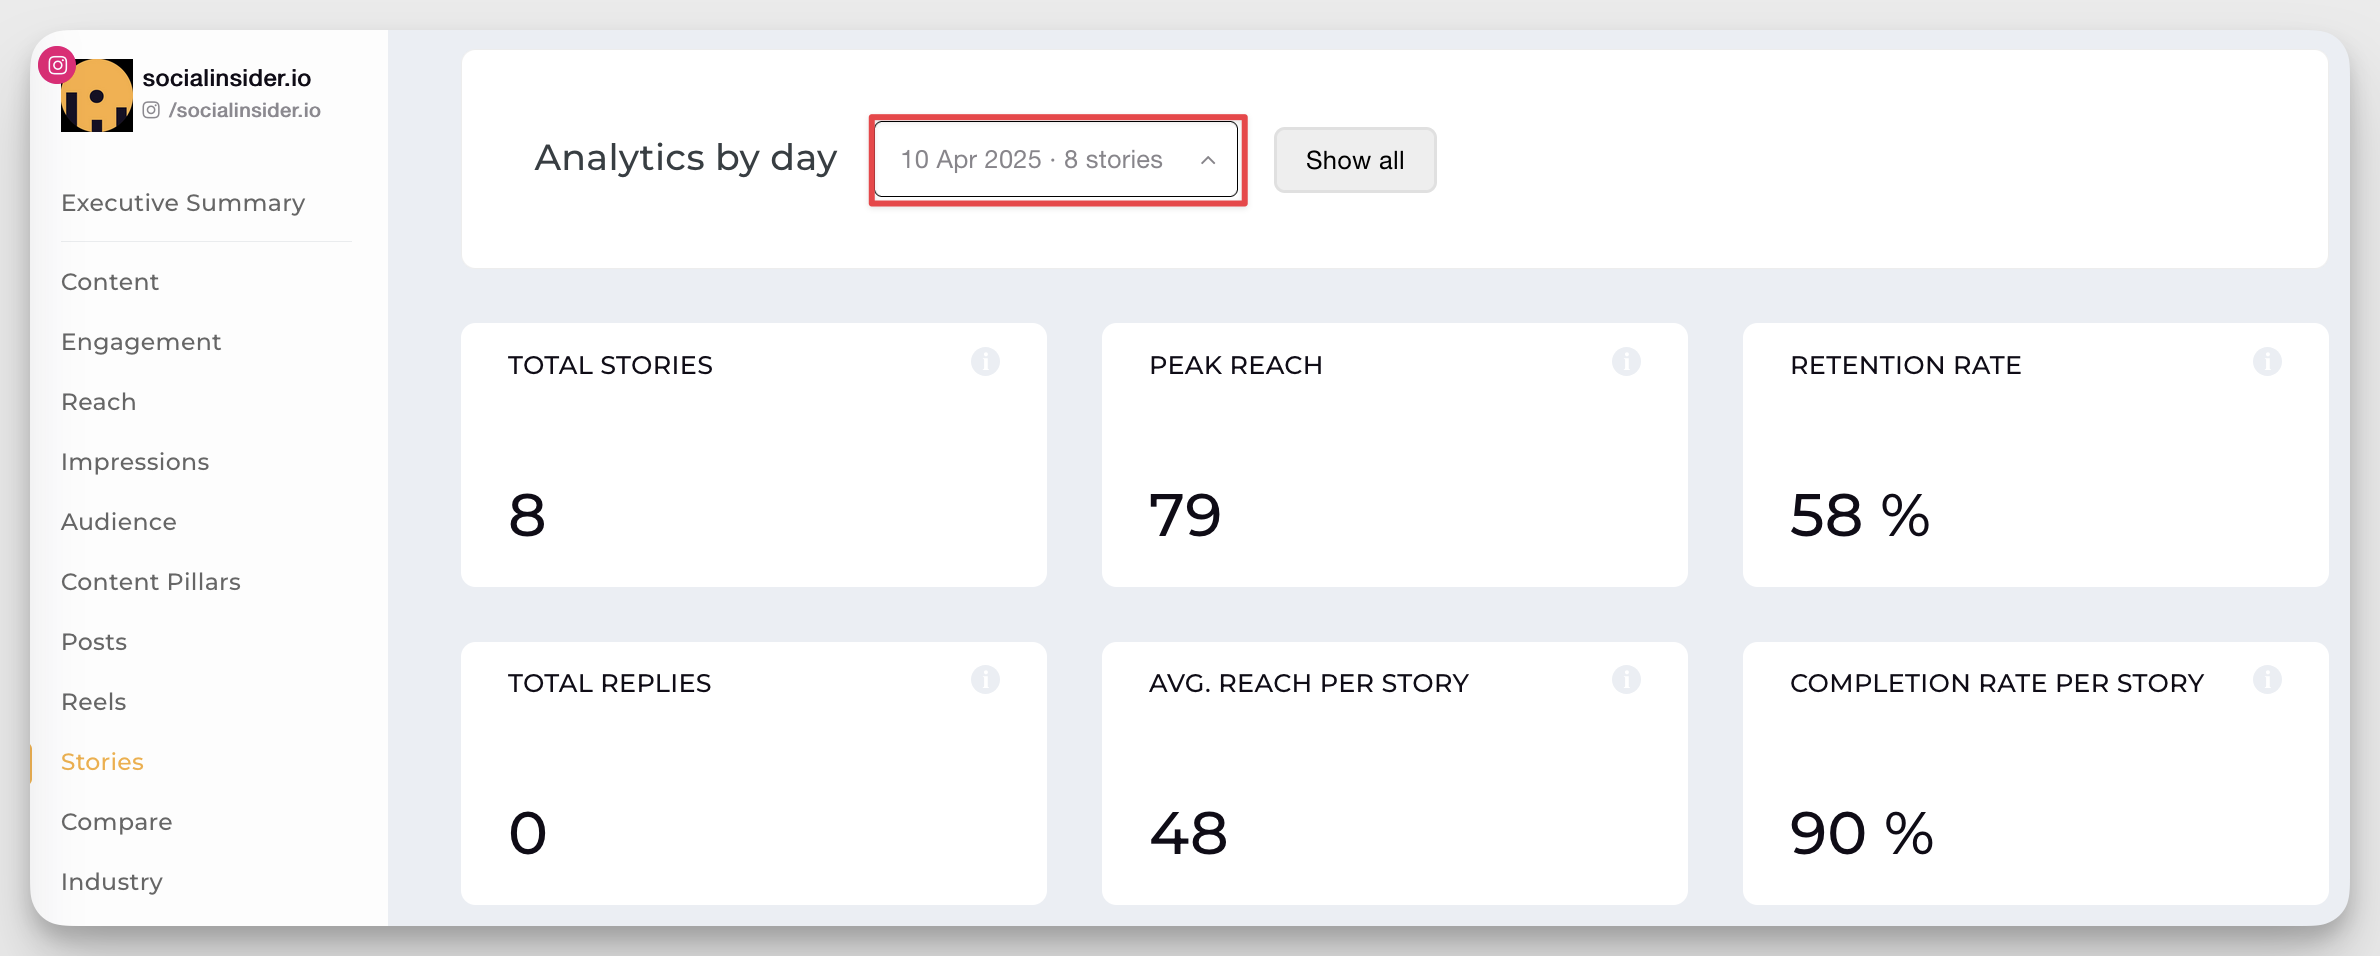
- Step 4: Use this audience analysis to understand drop-off points and refine your storytelling strategy
What audience insights can your get from you Instagram Stories analytics?
Understanding who’s viewing and engaging with your Stories is just as important as understanding the content itself. Proper audience analysis helps you tailor content, improve engagement, and identify potential brand advocates—all using built-in Instagram insights and behavior patterns.
Viewer list
Every time you post a Story, Instagram shows you a list of people who viewed it—but that list isn’t just chronological.
Here’s what to know:
- Instagram ranks story viewers based on engagement—people who interact with your profile the most (likes, DMs, visits) often appear near the top.
- If someone consistently shows up at the top, it may mean they frequently engage with your content.
- This ranking is dynamic and changes based on both recent and long-term interaction patterns.
Repeat viewers and superfans
Noticing familiar names in your viewer list? That’s a good sign.
You can identify repeat viewers and potential superfans by:
- Watching for users who consistently appear across multiple Story view lists
- Noting those who frequently reply to Stories or interact with stickers
- Using third-party tools (like Socialinsider) to track engagement trends over time across your owned accounts
Engaging these viewers directly can help build loyalty and boost organic reach through DMs, polls, and shoutouts.
Content insights from Stories audience data
Instagram Stories are designed to engage your existing followers, so they’re a goldmine for behavioral insights.
Here’s what you can extract:
- Content preferences: Which formats (video vs. image), topics, or tones resonate most
- Optimal posting times: Based on when Stories get the most views or replies
- Values alignment: Stories that showcase your company culture, behind-the-scenes moments, or team highlights reveal how well your audience connects with your brand identity.
By combining native Instagram insights with third-party tools, you can develop a sharper content strategy that strengthens your connection with followers and fans.
Advanced analytics techniques for Instagram Stories
Once you’ve mastered basic Instagram insights, it’s time to go deeper. These advanced techniques can help you uncover behavioral trends, refine your strategy, and drive better results from your Instagram Stories.
Cohort analysis for Stories viewers
Cohort analysis means grouping your viewers based on shared behaviors or characteristics—like new followers, engaged followers, or silent viewers—and analyzing how each group interacts with your Stories.
For example:
- At Socialinsider, our Stories strategy focuses on relationship building.
- We use polls for guessing games based on our research findings.
- We also share authentic, everyday moments from our team’s office life.
These types of posts don’t necessarily attract new viewers, but they perform best with our existing followers, helping us strengthen long-term connections.
Using cohort analysis helps you:
- Understand what content resonates with specific audience segments.
- Personalize your Stories approach (e.g., more interactive content for loyal viewers).
- Track how different types of viewers engage over time.
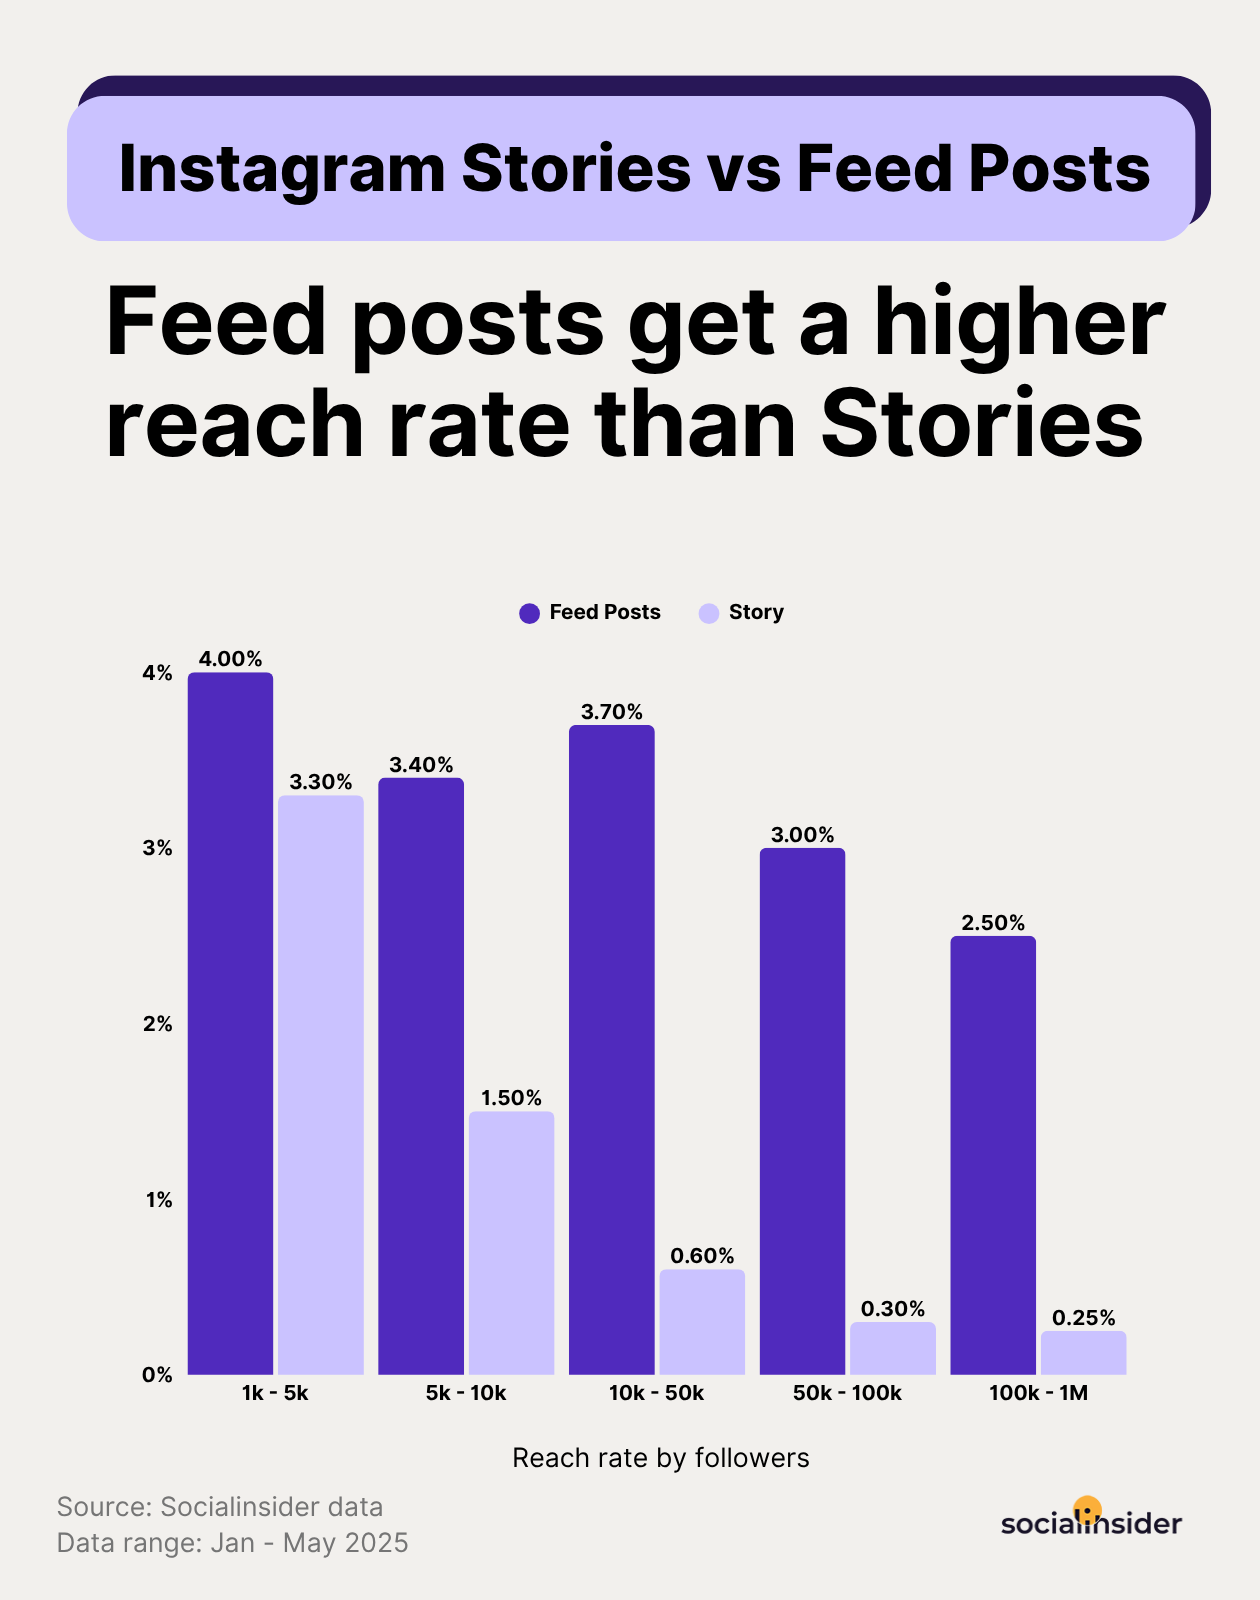
Cross-format performance comparison
Not all content belongs in the same place. Comparing performance across formats—especially Stories vs. Feed posts—can tell you where your audience prefers to engage.
Example approach:
- Share a product teaser as a Feed post.
- Reshare that same post to Stories with added context or interactivity (like a poll or question).
- Compare metrics such as reach, link taps, and engagement.
This helps you decide:
- Where to focus your messaging.
- How to repurpose content across formats without losing effectiveness.
Content type performance analysis
Sharing the same message across different content types—Stories, Reels, and Feed posts—is a great way to identify what format performs best for your audience.
Here’s how:
- Post a quick tip or announcement using all three formats.
- Track performance metrics like impressions, reach, sticker interactions, link clicks, and replies.
- Use Instagram insights and third-party tools like Socialinsider to compare results.
You’ll often find that Reels reach a broader audience, while Stories drive more intimate engagement from your existing followers.
Conversion tracking from Stories
At the end of the day, you want to know if your Stories are actually converting.
Conversions can include:
- A product purchase
- An event registration
- A newsletter signup
- A giveaway entry
To track conversions from Stories:
- Use link stickers or swipe-ups (if eligible).
- Add UTM parameters to track traffic in Google Analytics.
- In Socialinsider or Meta’s Insights, monitor link taps and Story retention to see how far viewers go.
Advanced tracking can help you optimize call-to-actions and Story placement, ensuring your most important Stories drive real business outcomes.
Roadblocks users encounter when it comes to Instagram Stories analytics
Despite the growing importance of Instagram Stories for engagement and brand-building, users often hit several frustrating roadblocks when trying to analyze their performance. Based on insights from client and prospect interviews, here are the most common challenges:
1. Limited access to Stories data
Stories analytics are private by design. Users can only access data when they connect their own Instagram account to an analytics platform. For competitor accounts/competitive analytics or profiles they don’t manage, Stories data is completely unavailable.
2. No historical backfill
Unlike regular posts, Stories data cannot be retroactively pulled. If an account wasn’t connected to an analytics tool at the time the Story was published, that data is gone, making long-term analysis and trend tracking difficult.
3. Metric inconsistencies
Users often notice discrepancies between Instagram reach metrics, such as mismatched numbers between the dashboard overview and individual Story data. This inconsistency makes it harder to trust or report performance accurately.
4. API limitations and changes
Instagram’s API imposes several restrictions:
- Replies aren’t available from some regions (e.g., Europe and Japan).
- Reshares and live video Stories are excluded.
- Frequent changes and metric deprecations by Meta lead to confusion and inconsistent tracking.
5. Sorting limitations
Unlike feed posts, Stories can’t be sorted by performance metrics like reach, impressions, or replies within Instagram’s native tools. This limits the ability to quickly identify top-performing content.
6. Reporting challenges
For teams creating reports for executives or clients, inconsistent metrics and a lack of historical context make storytelling with data much harder. It’s difficult to show progress over time or benchmark performance without a stable data foundation.
These roadblocks underline the need for robust Instagram Stories analytics tools that can store data over time, offer exportable reports, and simplify the process of turning ephemeral content into long-term strategic insights.
How to use Socialinsider for deeper Instagram Stories analysis?
While Instagram’s native Insights are helpful for a quick performance check, they come with limitations, especially if you’re managing multiple accounts or reporting to clients. Native tools offer a narrow time window, limited data retention, and no way to compare content types or create shareable reports.
That’s where Socialinsider steps in as a powerful solution for Instagram for business users who need more than just surface-level insights.
What native Instagram analytics miss
Socialinsider offers advanced capabilities that go beyond native tools:
- Story distribution visualizations: See how often and consistently you’re posting Stories.
- Replies distribution: Understand when and how followers are engaging via replies.
- Retention rate metrics:
- Retention rate based on the number of Stories posted per day.
- Average retention rate across your content.
- Best time to post: Identify top-performing time slots by reach and peak reach rate.
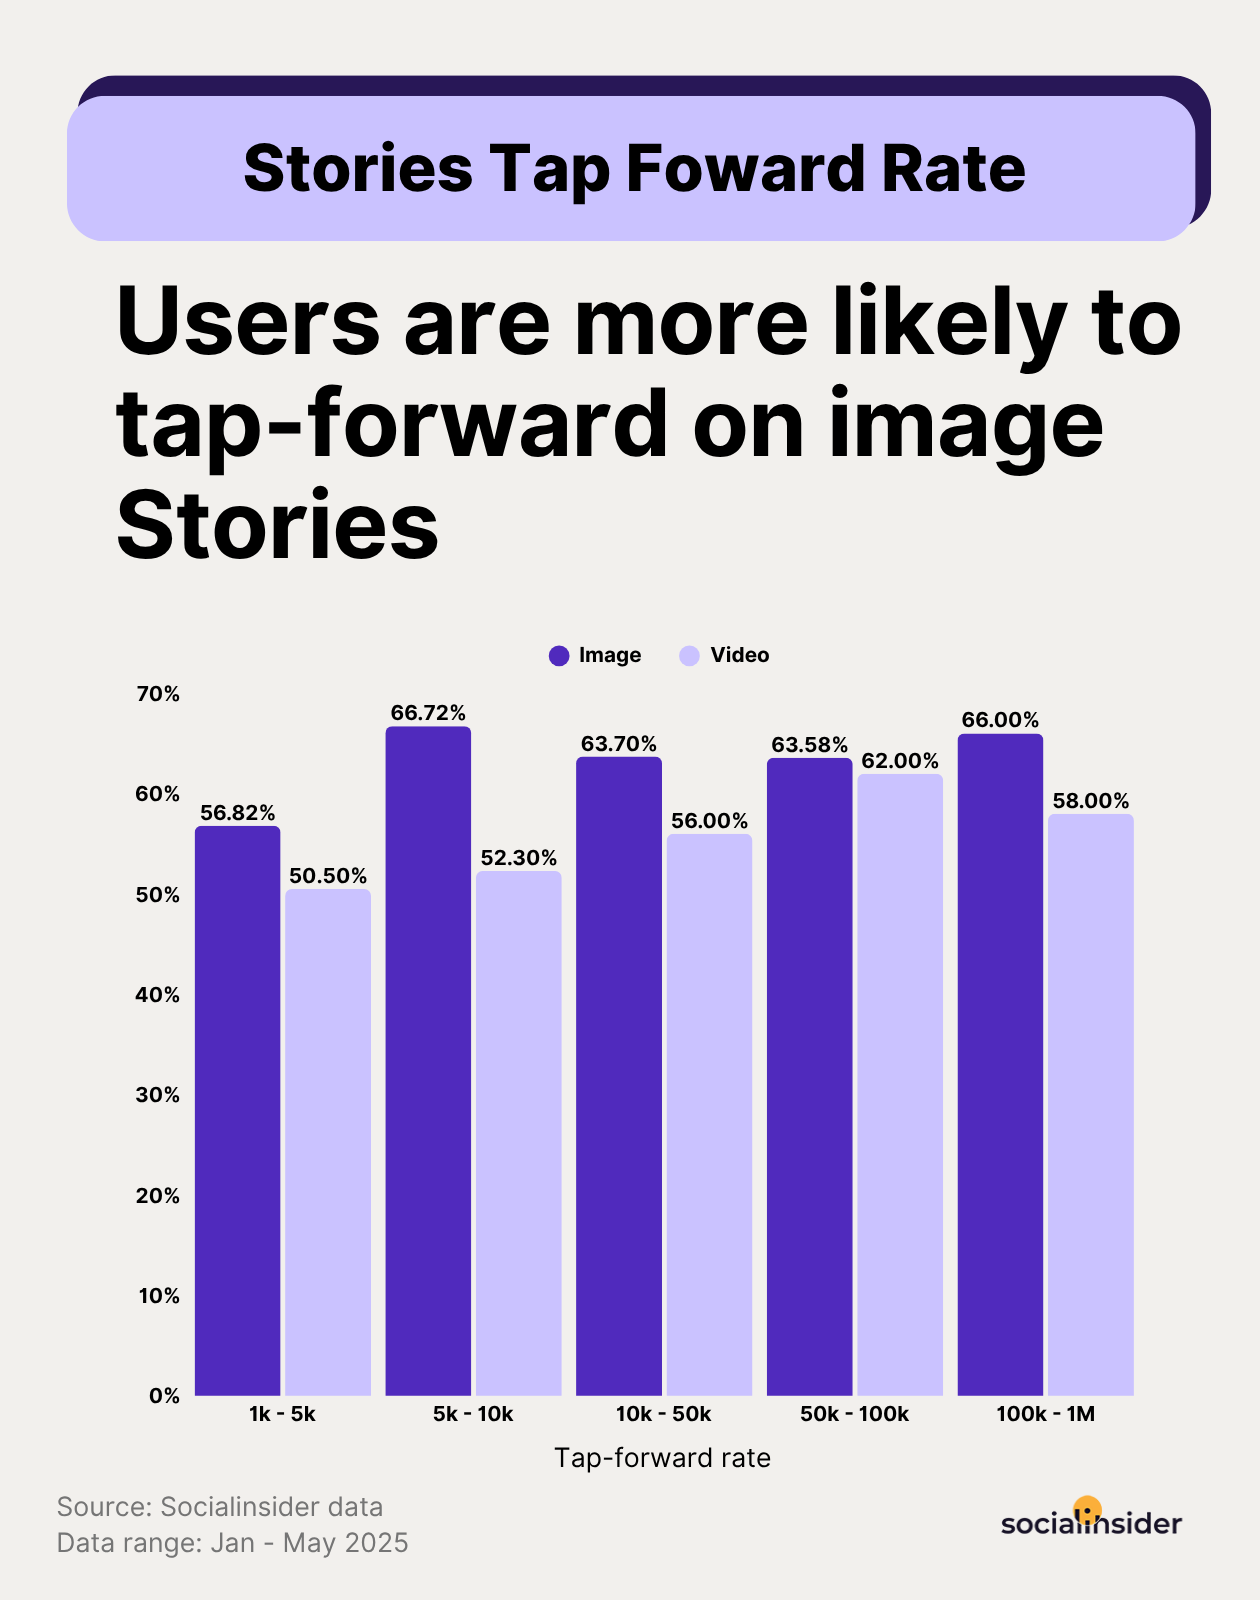
- Content format insights: Compare performance between image Stories and video Stories.
- Sorting and filtering options: Rank Stories by reach, impressions, or replies to find your highest-performing content types.
These features make Socialinsider ideal for brands and agencies looking to scale their Instagram analytics strategy.
Data exports and custom reporting
For teams that need to present findings to stakeholders or clients, Socialinsider offers:
- One-click export to PDF, CSV, or Excel.
- Custom reports tailored with your brand logo, annotations, and filters.
This makes it easier to translate raw Instagram stats into actionable reports that tell a story, perfect for internal reviews or external presentations.
Whether you’re building a reporting workflow or refining your Instagram for business strategy, Socialinsider provides the flexibility and depth that native analytics simply can’t.
What are some common Instagram Stories analytics mistakes you should avoid?
- Ignoring completion rate: Completion rate (the percentage of users who watch your story from start to finish) is critical for measuring content relevance and sequencing. Ignoring this can result in misjudging user interest or message clarity.
- Overlooking Story drop-offs and exits: High exit or drop-off rates at certain frames can signal issues with content structure or timing. Ignoring these patterns means missing clear opportunities to improve storytelling.
- Neglecting to track interactivity metrics: Polls, quizzes, and sticker interactions offer deeper engagement signals than passive viewing. Failing to track these underestimates audience involvement.
- Not benchmarking against industry standards: Operating in a vacuum—without context on how your Stories compare to peers—can lead to missed opportunities. Use benchmarks and competitive analytics to set realistic goals and spot gaps.
Final thoughts
Harnessing Instagram Stories analytics isn’t just about tracking numbers—it’s about equipping yourself with actionable insights that drive real business outcomes. When you move beyond vanity metrics and manual processes, you gain a reliable foundation for reporting, benchmarking, and optimizing your strategy at every level.
By focusing on meaningful data and integrating Stories analytics into broader performance reviews, you can confidently demonstrate the impact of your efforts to leadership and stakeholders. With the right approach, Instagram Stories transform from a tactical channel into a strategic asset—helping you stand out, justify investments, and make informed decisions that move the needle for your brand.
FAQs on Instagram Stories analytics
Can you get analytics on Instagram Stories?
Yes, but only if you have a business or creator account. Instagram provides basic analytics like reach, impressions, replies, exits, and more through its Insights tab. For deeper insights, especially over time, you’ll need a third-party analytics tool.
How long are Instagram Stories insights available?
Insights for Stories are available for up to 14 days in the Instagram app and 28 days via Meta Business Suite. After that, they disappear unless you’re using a third-party analytics platform that tracks them in real-time.
Charu Mitra Dubey
Content Marketing Lead at GetPhyllo with 6+ years of digital marketing experience. Founder of CopyStash, a weekly newsletter on marketing.

Analyze your competitors in seconds
Track & analyze your competitors and get top social media metrics and more!
You might also like


Improve your social media strategy with Socialinsider!
Use in-depth data to measure your social accounts’ performance, analyze competitors, and gain insights to improve your strategy.