2025 Social Media Video Performance Statistics
Dive into key social media video performance statistics. Understand viewer behavior and enhance your video strategy for better engagement and results.


If I were to ask you where you first go to search for something - either for a product recommendation, a tutorial on how to solve a specific problem, or just to catch up with the latest news, which would it be? YouTube? Or maybe TikTok?
Regardless of the platform itself, my first bet would be on video content. Am I right?
After all, there’s no secret that video content dominates the searches nowadays. However, while more appealing in general, there are times when a simple picture may be worth a thousand words. If you think about the moments when you need a quick snapshot, a single-frame solution for your struggles, how effective is video content then?
Don’t get me wrong, it surely has its perks. But falling into the trap of relying solely on videos is dangerous for brands, especially if you think about the specifics of different audiences.
Read along with this video engagement research across Instagram, Facebook, TikTok, and LinkedIn across different page sizes, and you’ll see what I mean. Ready?
Executive summary
LinkedIn video stats:
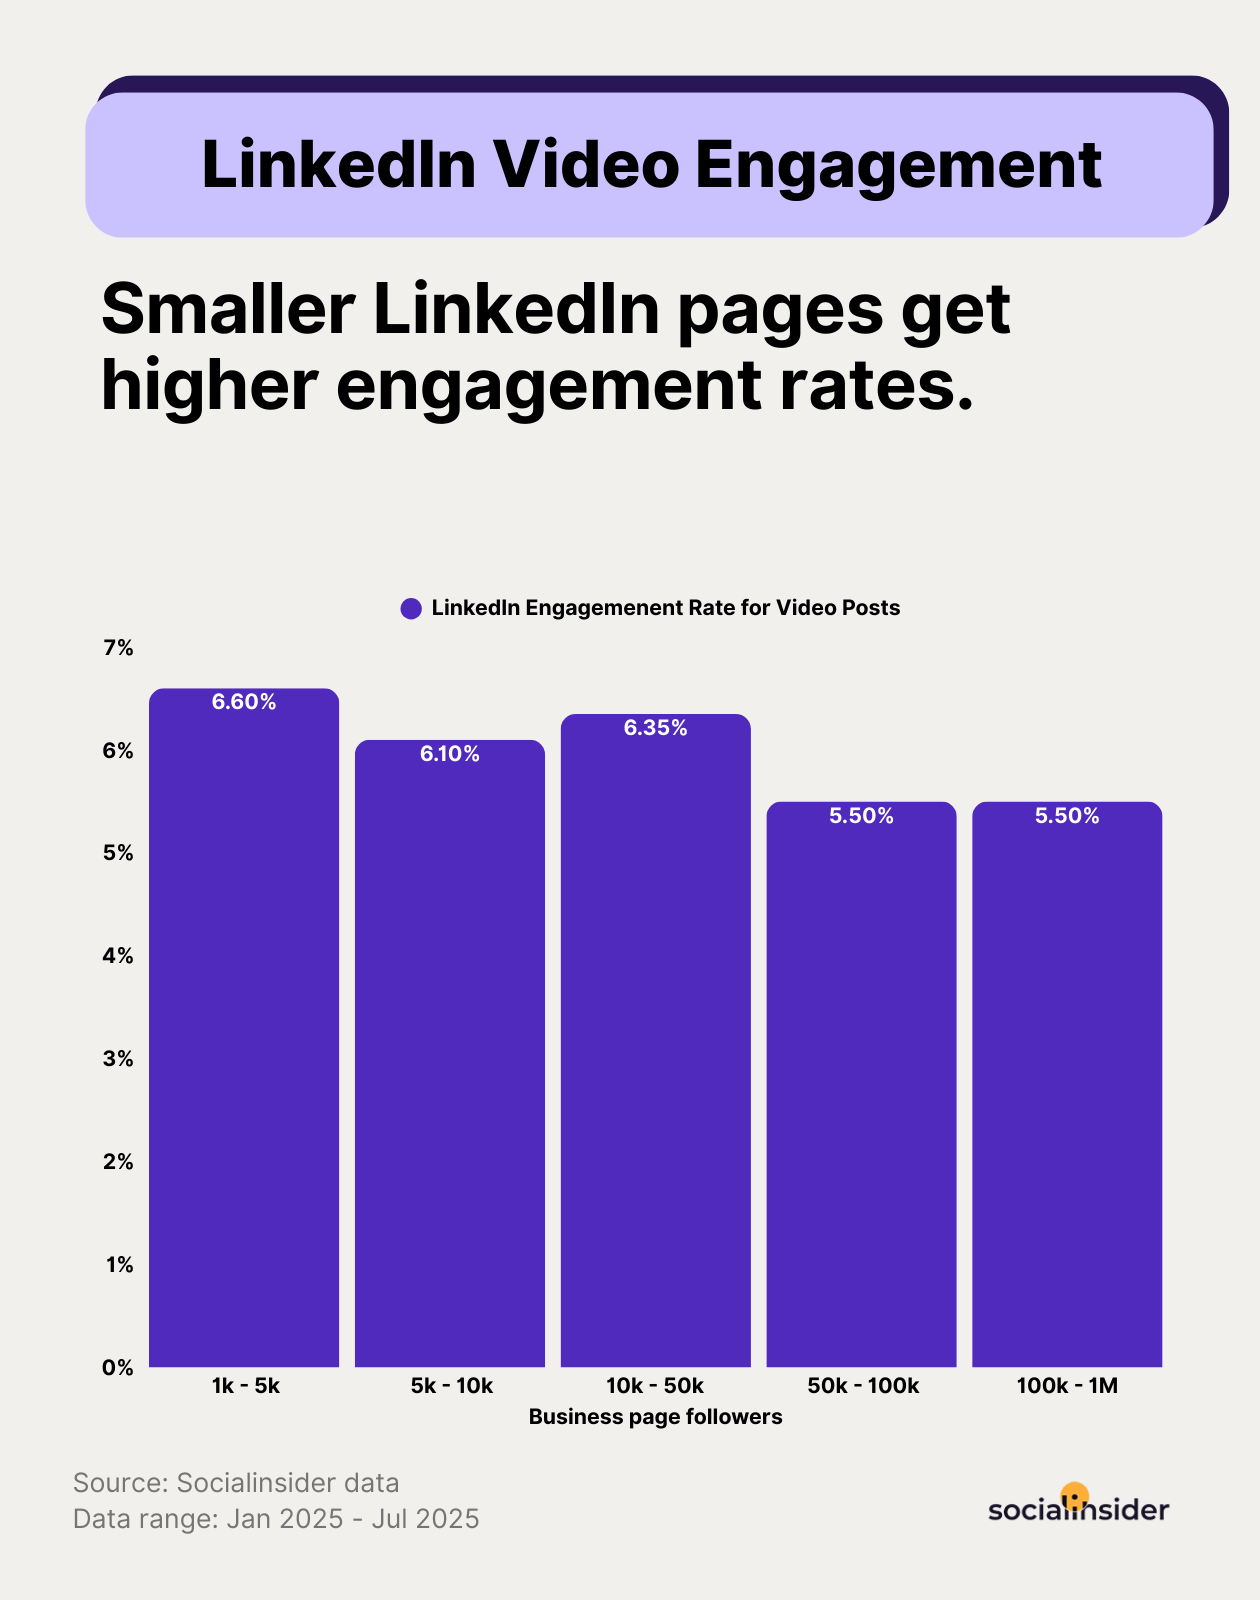
- Smaller LinkedIn pages get higher engagement rates.
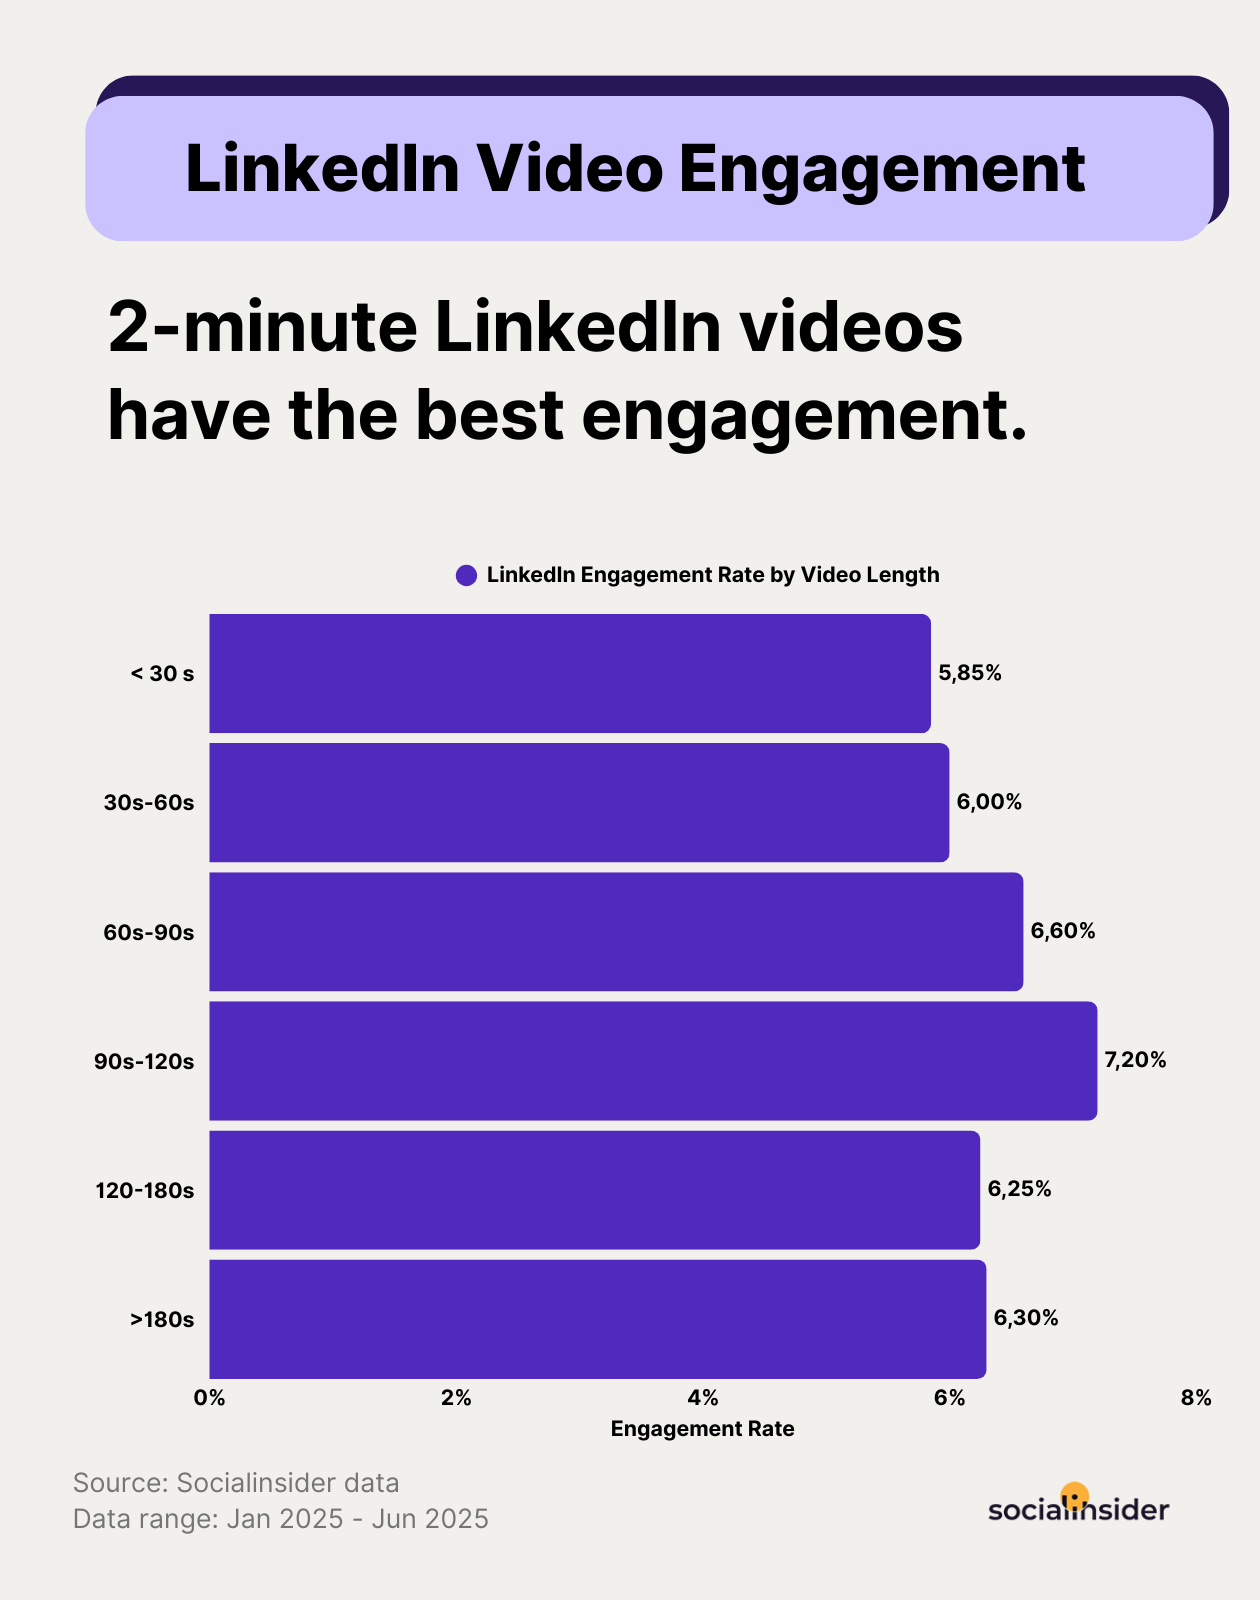
- 2-minute LinkedIn videos have the best engagement.
- 3 minute LinkedIn videos get the most views.
Instagram Reels stats:
- Smaller accounts have the highest engagement on Instagram Reels.
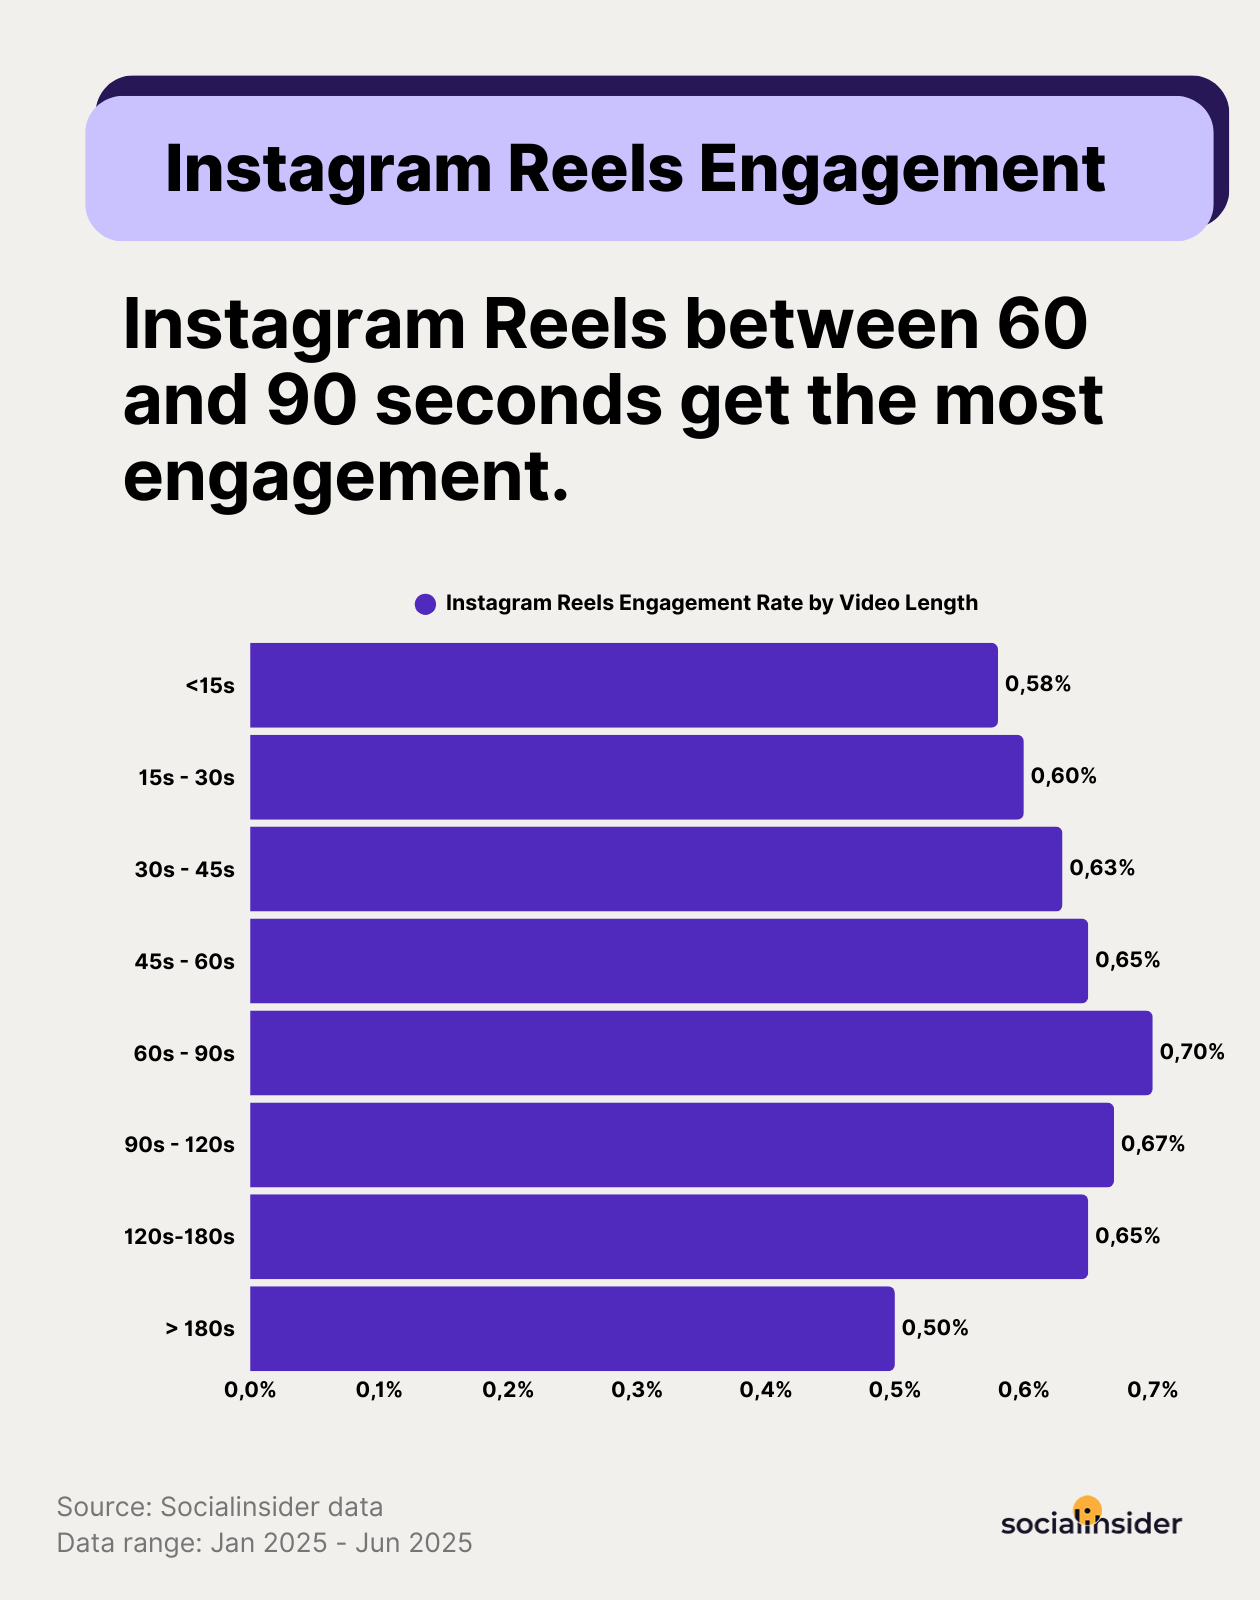
- Instagram Reels between 60 and 90 seconds get the most engagement and views.
Facebook video stats
- Smaller accounts have the highest engagement rates on Facebook Reels.
- Facebook Reels between 90 and 120 seconds get the most engagement.
- 1-minute Facebook Reels drive the most views.
- Larger pages receive more views on Facebook Reels.
- 30-40 minute live videos on Facebook are the most engaging.
TikTok stats
- Smaller TikTok accounts get higher engagement rates.
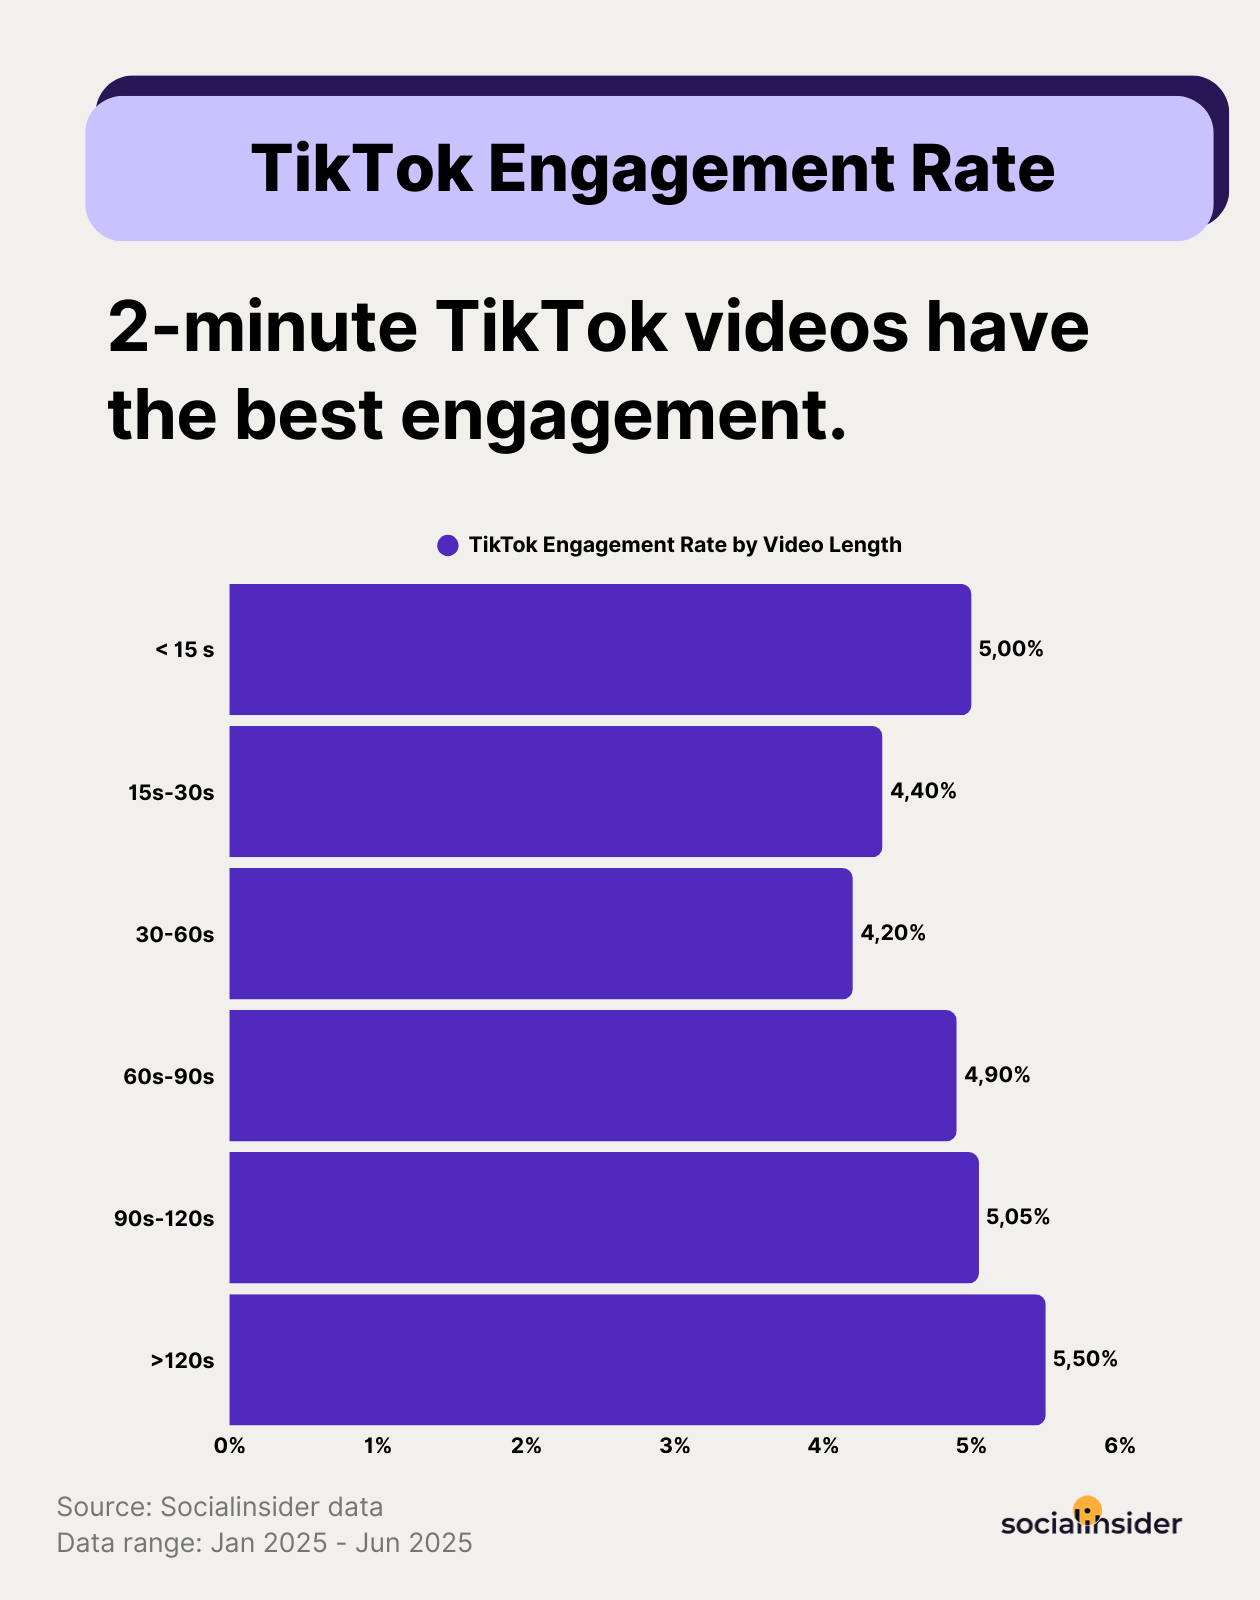
- 2-minute TikTok videos have the best engagement and views.
Social media video engagement statistics
Instagram Reels engagement statistics
Instagram Reels performance statistics by account size
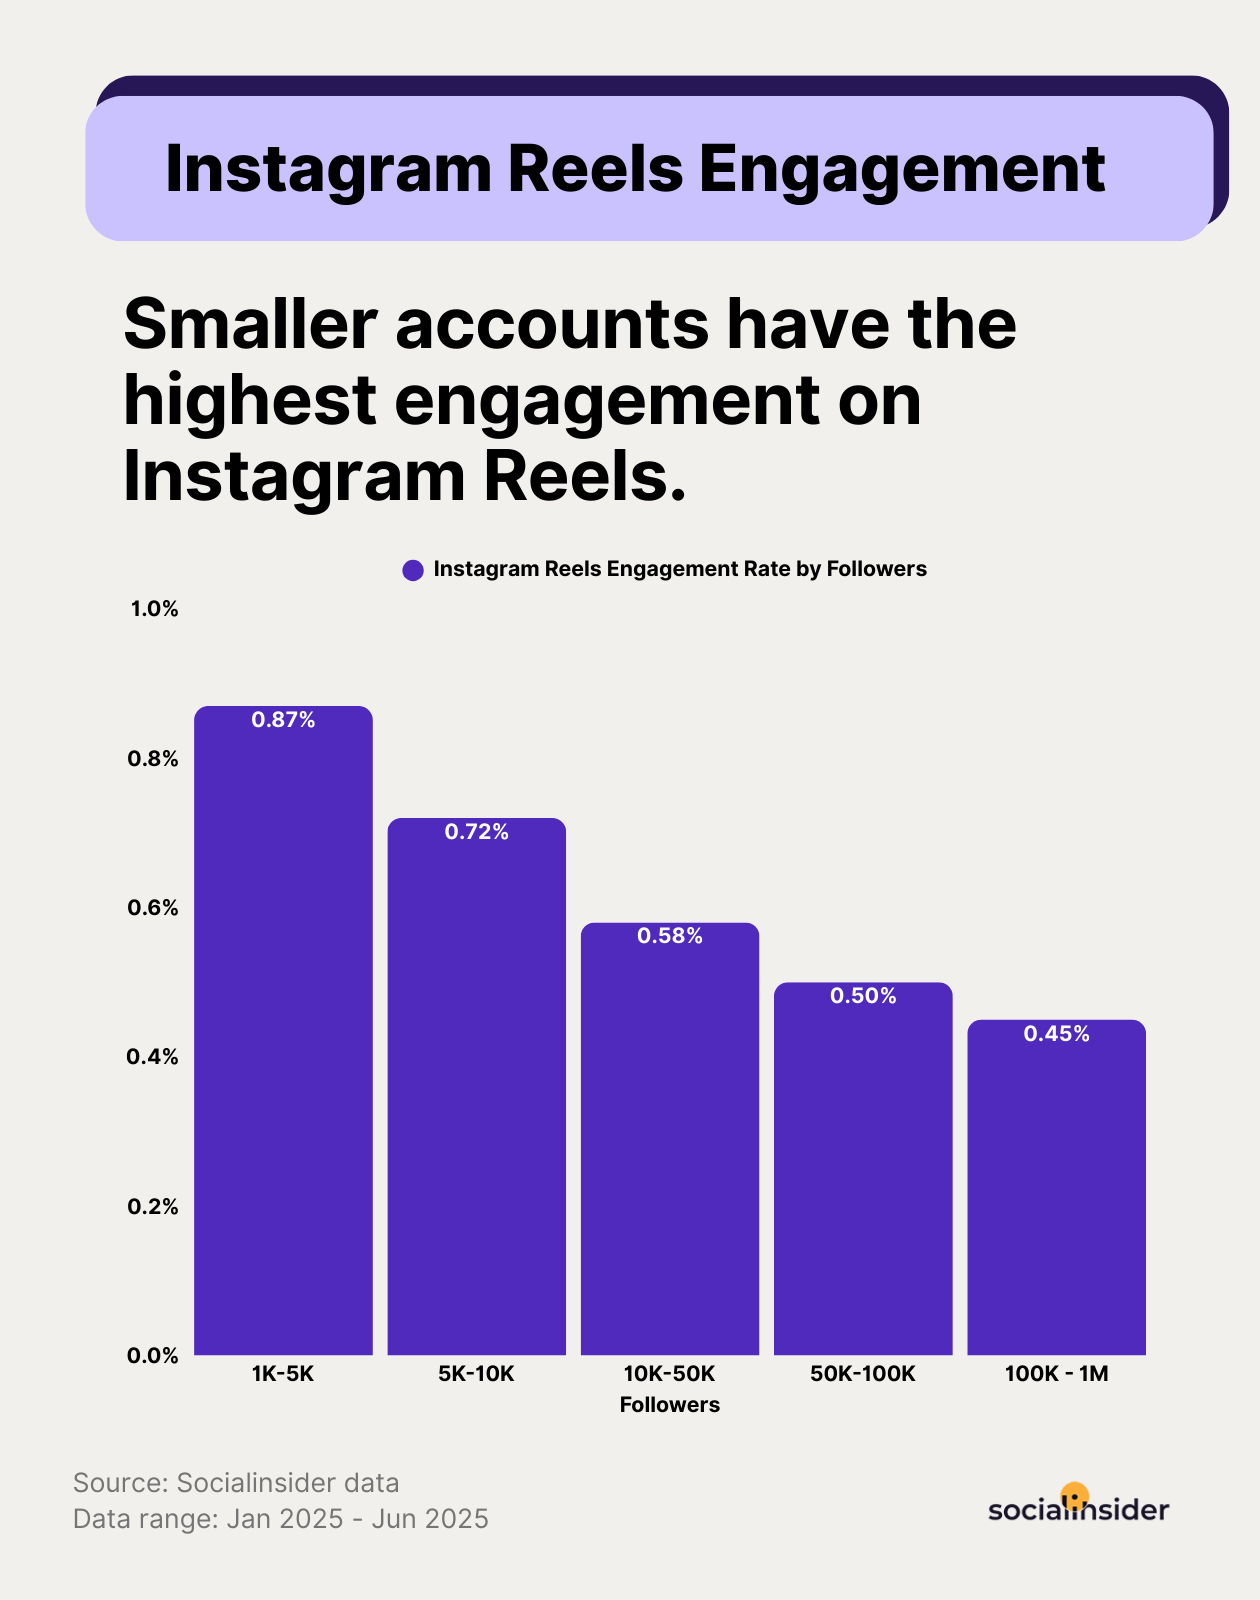
Let’s be honest. Chasing big follower counts feels good. But when it comes to video engagement on social media, especially on Instagram, the numbers tell a different story. As your audience grows, your Instagram Reels engagement tends to shrink.
Here’s how Instagram Reels engagement data shakes out for Instagram business accounts:
- 1K-5K followers – 0.87%
- 5K-10K followers – 0.72%
- 10K-50K followers – 0.58%
- 50K-100K followers – 0.50%
- 100K-1M followers – 0.45%
That’s nearly a 50% drop in engagement from small to large accounts. And yeah - we felt that pain running video content across multiple tiers. You hit 50K, and suddenly, it’s like the algorithm turns the volume down on your audience. Smaller audiences show up. They watch. They care. They engage.
Instagram Reels performance statistics by video length
You’ve heard it everywhere: “Keep your Reels short. No one has time anymore.” But based on the latest video engagement data, that advice is… dated.
Short Reels still perform decently, but the real surprise? Reels between 60 and 90 seconds consistently deliver the highest engagement rates. The longer the video (up to a point), the more likely your audience is to stick around, engage, and interact.
This shift tells us something important: Instagram audiences aren’t just tapping through anymore. They’re willing to stick around if the content has depth. Storytelling, education, and behind-the-scenes content all benefit from a little more breathing room.
Strategic tactics on how to increase your Reel’s engagement
- Use sequenced content to create binge behavior. Instead of dropping random one-offs, plan sequenced content. Break your message into ‘Part 1,’ ‘Part 2,’ etc., or use daily video tips to build momentum. Viewers are far more likely to come back for more and hit that ‘Follow’ button when they know there’s more coming. This approach works especially well for educational, how-to, and behind-the-scenes content.
Meta for Business often does this by creating a series of content on ‘Performance Talks’ and ‘20 20-second tips’.
- Edit your videos to loop seamlessly. Ever hit replay on a Reel because the ending flowed right back into the start? That loop keeps people watching longer. Structure your video so the last shot or message ties seamlessly to the beginning. The smoother the replay, the higher your total watch time. And more watch time means the algorithm is far more likely to push your video further.
- Design your thumbnail to grab attention, not just look on-brand. Choose a bold, high-contrast image with a real person’s face (ideally making eye contact), and layer it with a short, emotional hook like “This nearly failed…” or “What went wrong?” These kinds of covers stop the scroll and give your video a better shot at engagement from the first second.
Here’s an example from our profile.
- Post teaser + payoff videos back to back. Start with a short video that teases a problem, question, or moment of tension. Then follow it with the solution or outcome in the next video. When we used this tactic, viewers were more likely to save both videos, comment, and follow to see the follow-up. You’re not just sharing a story—you’re building anticipation.
- Lead with the result, then rewind to the how. Flip the script by showing the final result in the first 1-2 seconds, then explain how you got there. This reverse structure hooks people early and keeps them engaged longer, especially on business accounts where people often scroll past anything that feels too ‘salesy.’
Here’s how Shopify does this for showcasing their customer stories.
- Use the 60-90 second window to shift format. This is a sweet spot for product demos, tutorials, and mini case studies. Content that might’ve felt rushed in 30 seconds finally has room to land and as per our data, we have already seen audiences responding to that.
Facebook Reels engagement statistics
Facebook Reels performance statistics by account size
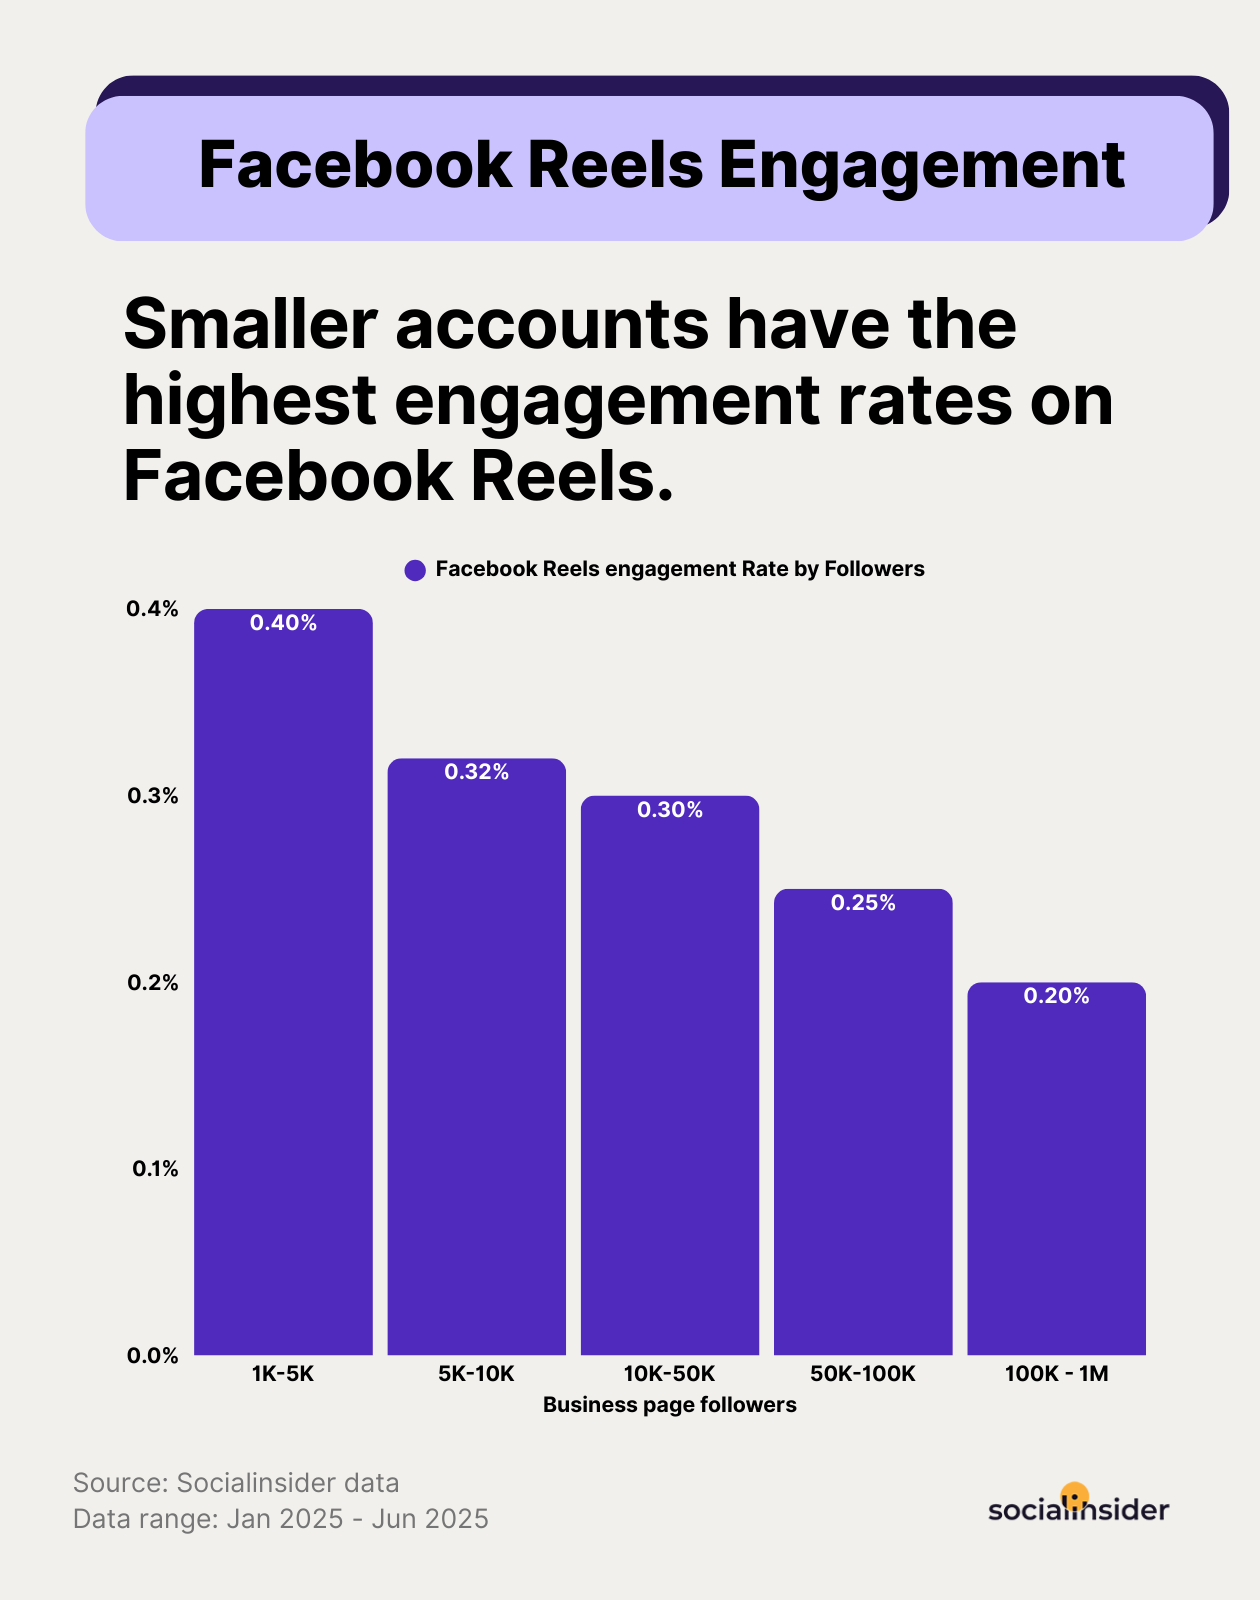
If you're relying on organic video engagement on social media, Facebook might feel like quicksand. You post, you wait... and sometimes, it’s just crickets, especially for business accounts, where Facebook Reels’ engagement has been trending downward for a while.
But here’s the thing: the decline isn’t random. It follows a clear pattern that points straight to where the friction lies.
Here’s the breakdown of Facebook Reels engagement data for Facebook business profiles, based on follower count:
- 1K-5K followers: 0.40%
- 5K-10K followers: 0.32%
- 10K-50K followers: 0.30%
- 50K-100K followers: 0.25%
- 100K-1M followers: 0.20%
Compared to Instagram, these rates are noticeably lower across the board. And they drop even faster as accounts scale. By the time you hit 100K followers, you're averaging just 0.20% engagement.
The underlying issue? Passive viewing. Facebook’s feed isn’t built for discovery the way Reels are. Video sits in a stream of links, shares, and memes. So if your content doesn’t instantly spark interaction or feel native to a user’s experience, it gets buried fast.
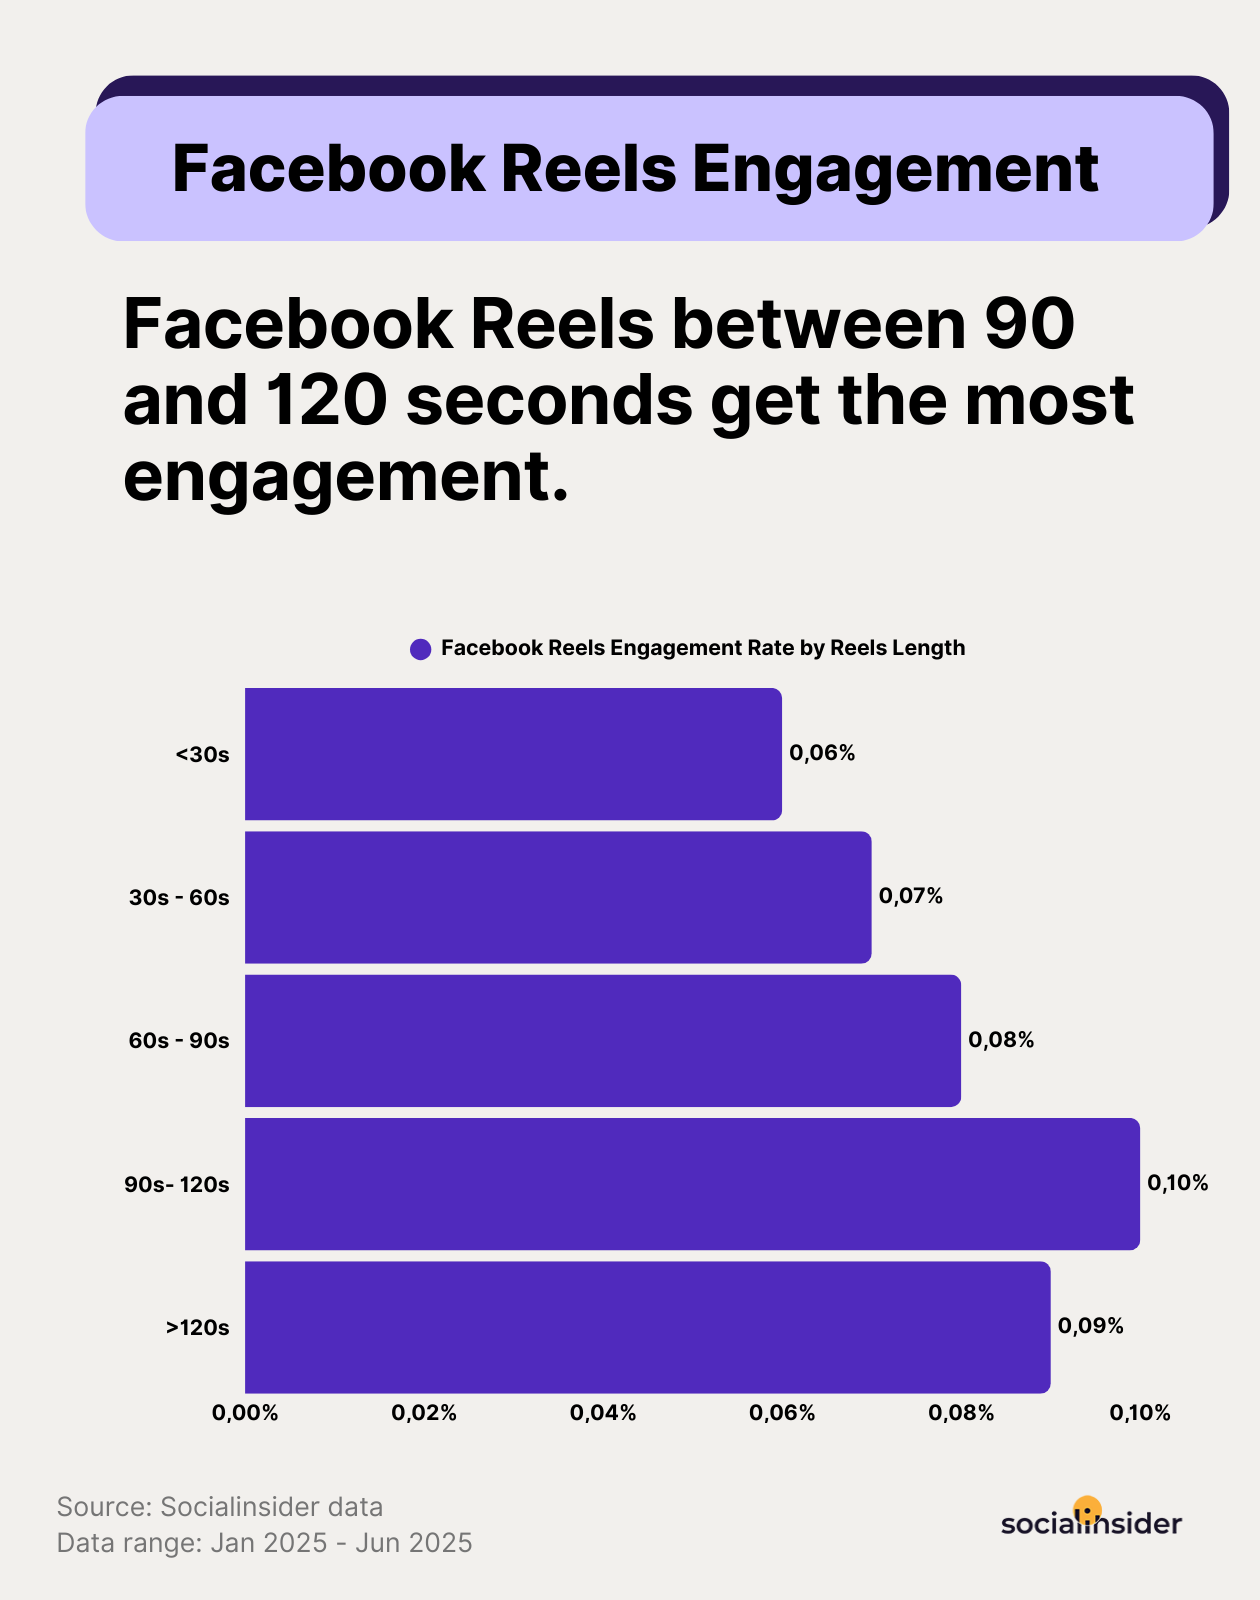
Facebook Reels performance statistics by video length
While the engagement rates on Facebook Reels are lower overall compared to Instagram, one trend is surprisingly similar — longer Reels are driving higher engagement, at least up to the two-minute mark.
The sweet spot here is clearly between 90 and 120 seconds, which means there’s enough room to tell a story, build trust, or explain a concept without losing your viewer.
Strategic tactics on how to increase your Facebook Reel’s engagement
- Ask for engagement in-context, not in captions. Instead of saying “Like and share!” in the post copy, add CTAs right into the video visuals. We have seen a quick mid-roll prompt like “Tag someone who’d relate” or an end-frame question like “Which would you choose?” drive more comments because viewers were already invested when the prompt appeared.
- Prioritize shares over likes. Shares are the real currency of video engagement on Facebook. A like is passive, but a share means someone found your video valuable enough to put it in front of their own network. I’ve found that videos with emotional pull, a relatable story, or a practical tip spark far more shares.
- Lean into nostalgia, story arcs, or opinions. Facebook’s user base skews older, and videos that tap into memory, strong viewpoints, or a mini-drama perform better than trend-based content.
Here’s how Starbucks showed the evolution of its holiday cup from 1997 to 2021.
- Repurpose community comments into new video scripts. Ever run out of ideas for your next video? We turn to our own community. Comments and questions on past posts are a goldmine. We will grab a thoughtful comment or a common FAQ and build a short video around it. Not only does it show people that we are actually listening, it makes the content feel super relevant.
- Use longer Reels to build emotional or educational depth. On Facebook, fast entertainment content doesn’t grab people the same way. Instead, we’ve seen better results from slower storytelling, relatable insights, or soft-sell education.
Facebook Live videos engagement statistics
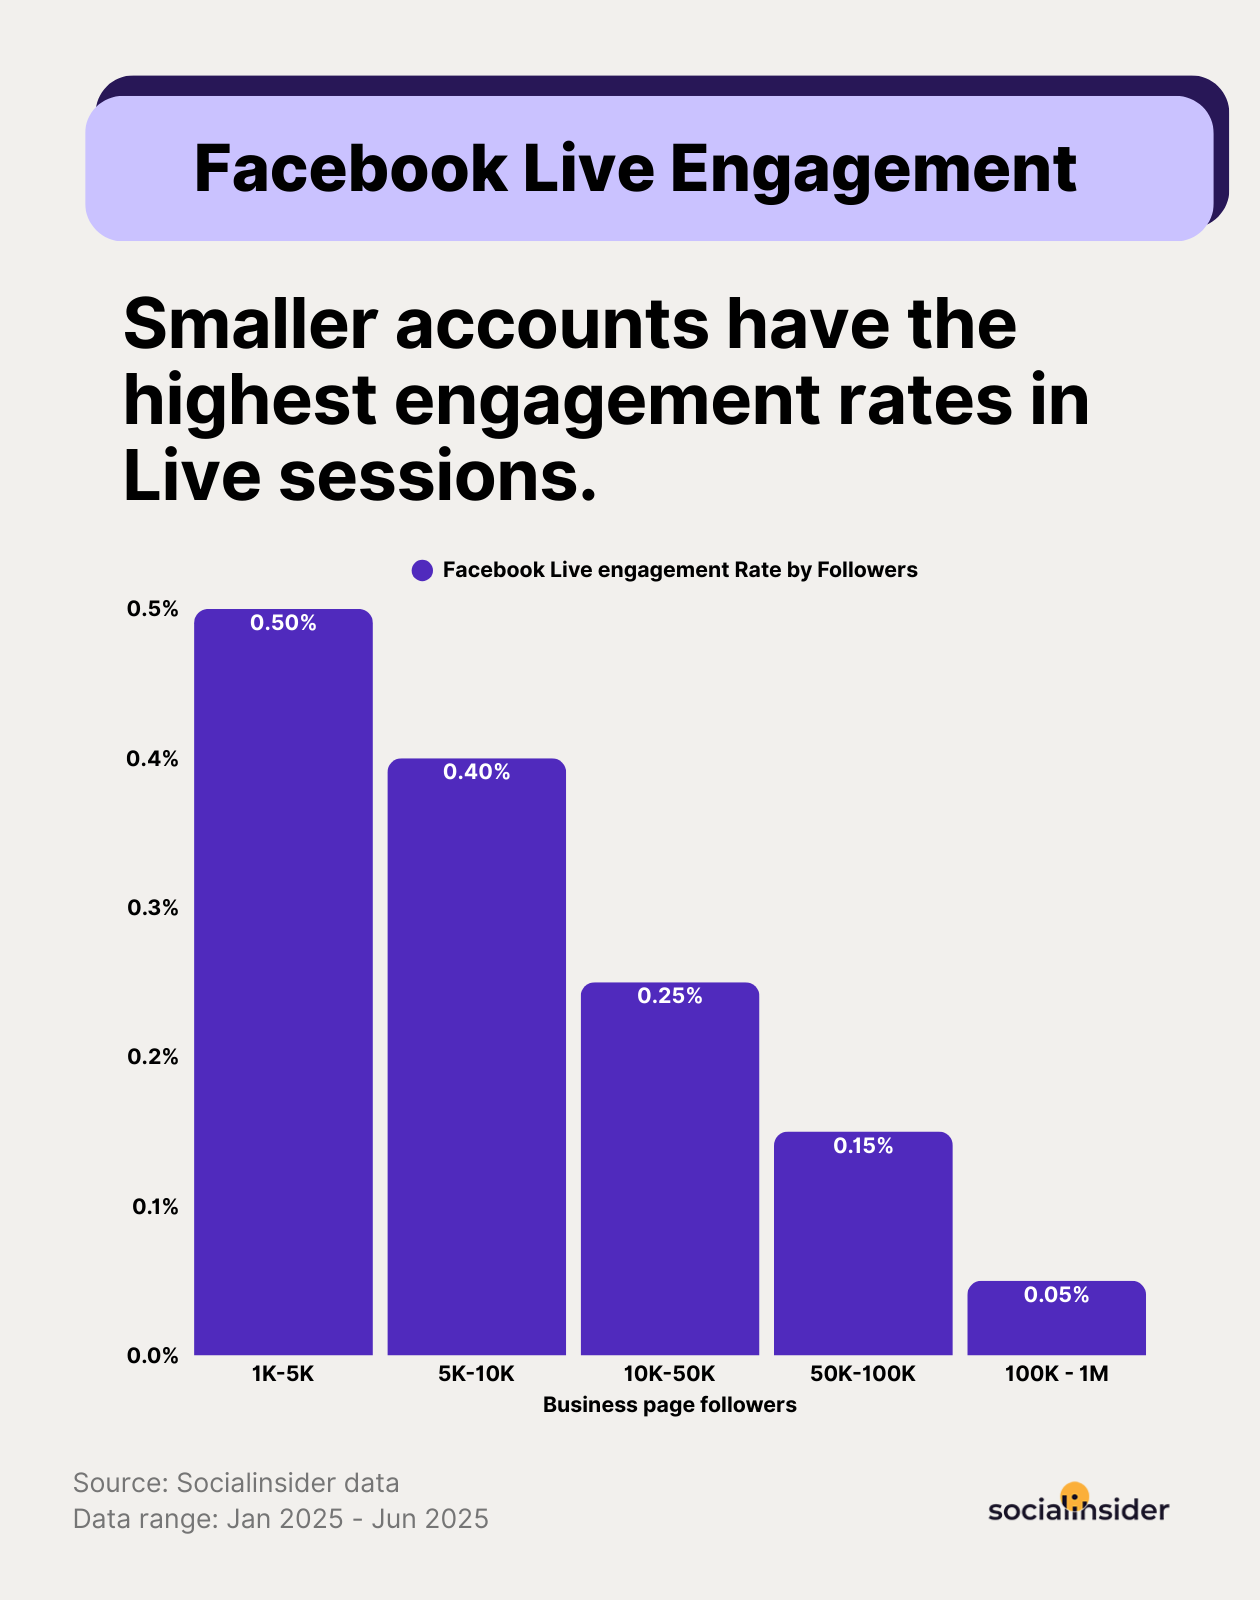
Facebook Live video performance statistics by page size
Facebook Live has never been the easiest format to crack, and the numbers show it. If you’re not being intentional, it’s easy to go live… and watch your audience vanish before you’ve said a word.
That said, when you do it right, especially with a smaller, more engaged following, Live still has legs. But it doesn’t scale the same way other video formats do.
Here’s what the video engagement data tells us about Facebook Live performance by page size:
- 1K-5K followers: 0.50%
- 5K-10K followers: 0.40%
- 10K-50K followers: 0.25%
- 50K-100K followers: 0.15%
- 100K-1M followers: 0.05%
That’s a clear trend: the more followers you have, the harder it is to keep them tuned in during a live session. Why? Because Live thrives on connection and immediacy. When your audience feels like you’re speaking with them, not just at them, that’s when engagement shows up. With a larger, more passive following, that real-time connection becomes harder to maintain.
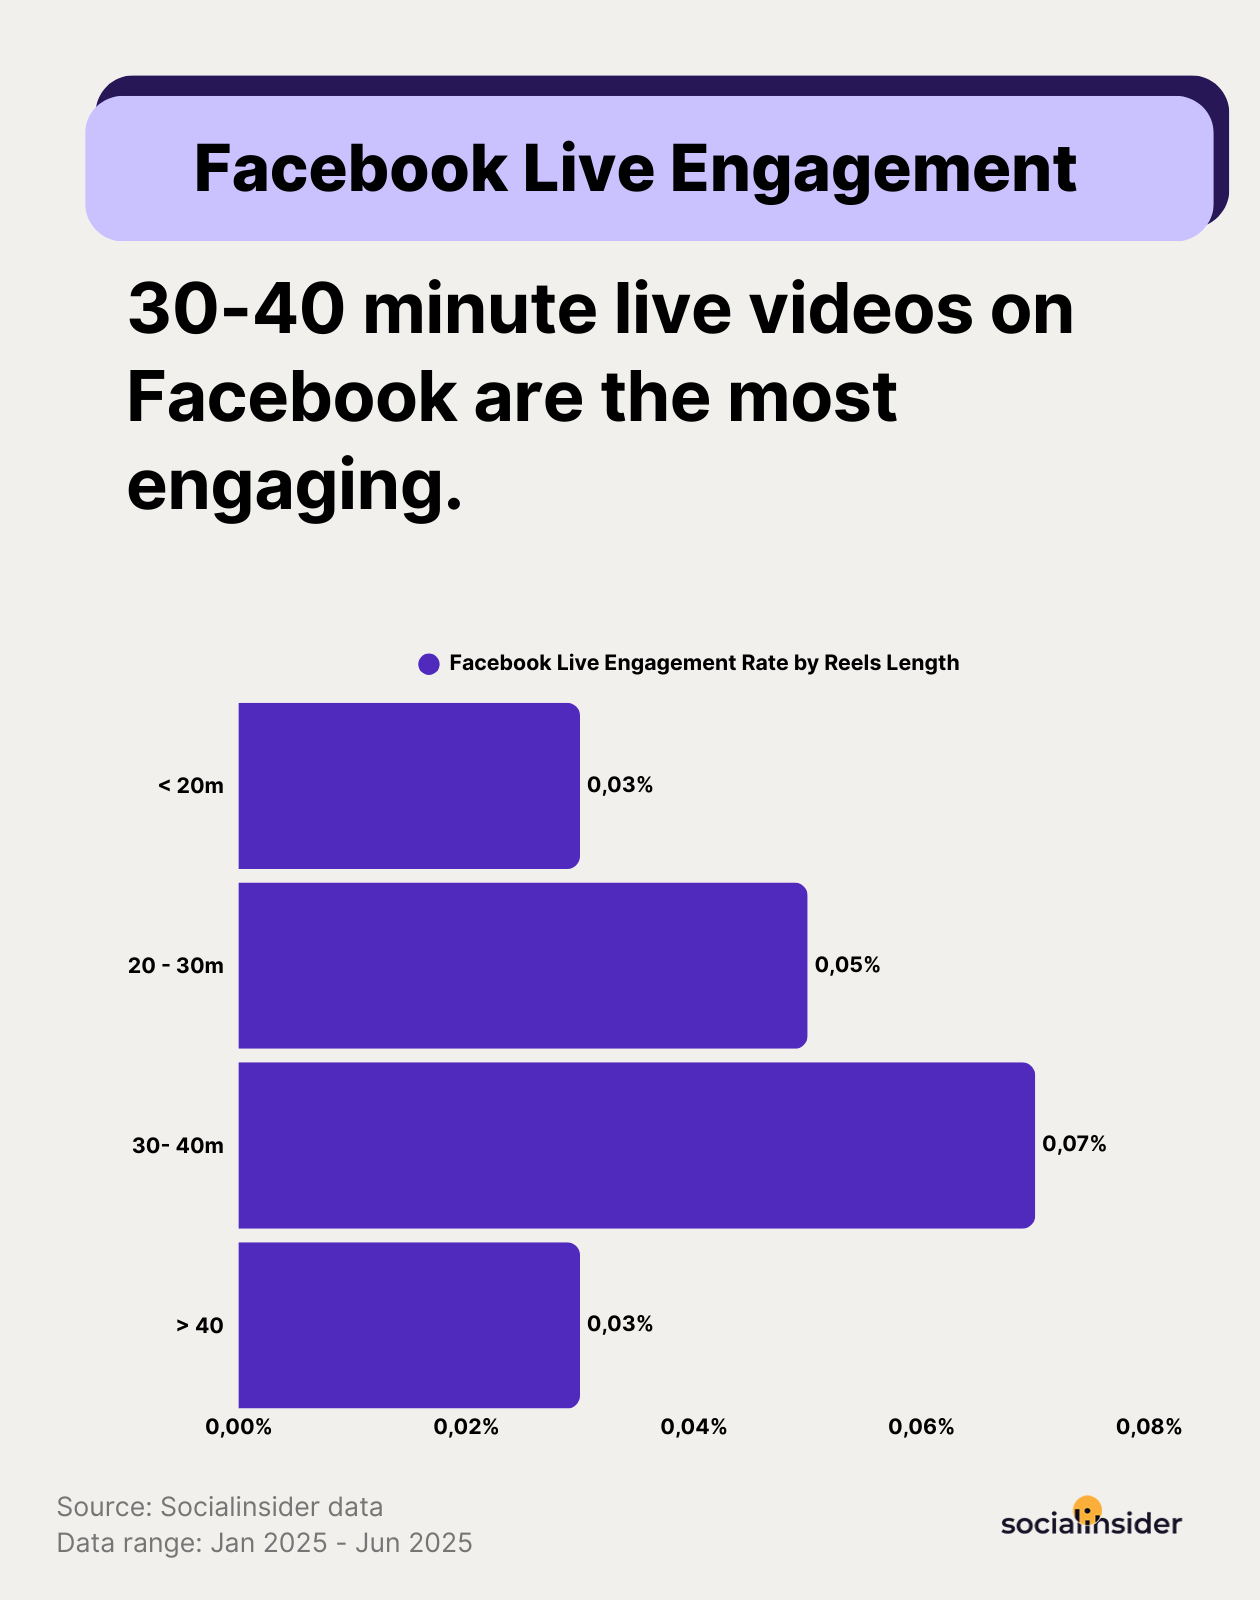
Facebook Live video performance statistics by video length
Engagement on Facebook Live peaks between 30 and 40 minutes, with lower rates both before and after that sweet spot. That’s a big shift from what many brands expect and a valuable insight when planning Live content.
Interestingly, Lives longer than 40 minutes perform just as poorly as ultra-short ones. That tells us viewer fatigue is real, and even engaged audiences have a limit.
Strategic tactics on how to keep your audience hooked during live sessions
- Narrow your focus. Broad Lives feel forgettable. Instead, run hyper-specific sessions. For example, “5 tips for new customers,” “Behind-the-scenes of our next product,” or “Live Q&A with our skincare formulator.” Specificity sparks attention.
- Start engaging immediately. Ask a question. Greet people by name. Acknowledge the chat. That first minute sets the tone. Ensure you make the Live feel like a conversation, not a speech.
- Segment the session to keep energy high. Break your Live into clear parts: intro → main content → audience Q&A → closing CTA. It keeps things structured and gives people reasons to stay engaged all the way through.
- Plan for a 30-40 minute format. As we have seen through our data, this is the sweet spot for Lives on Facebook. They should be long enough to create interaction and deliver value, and short enough to avoid drop-off.
TikTok videos' engagement statistics
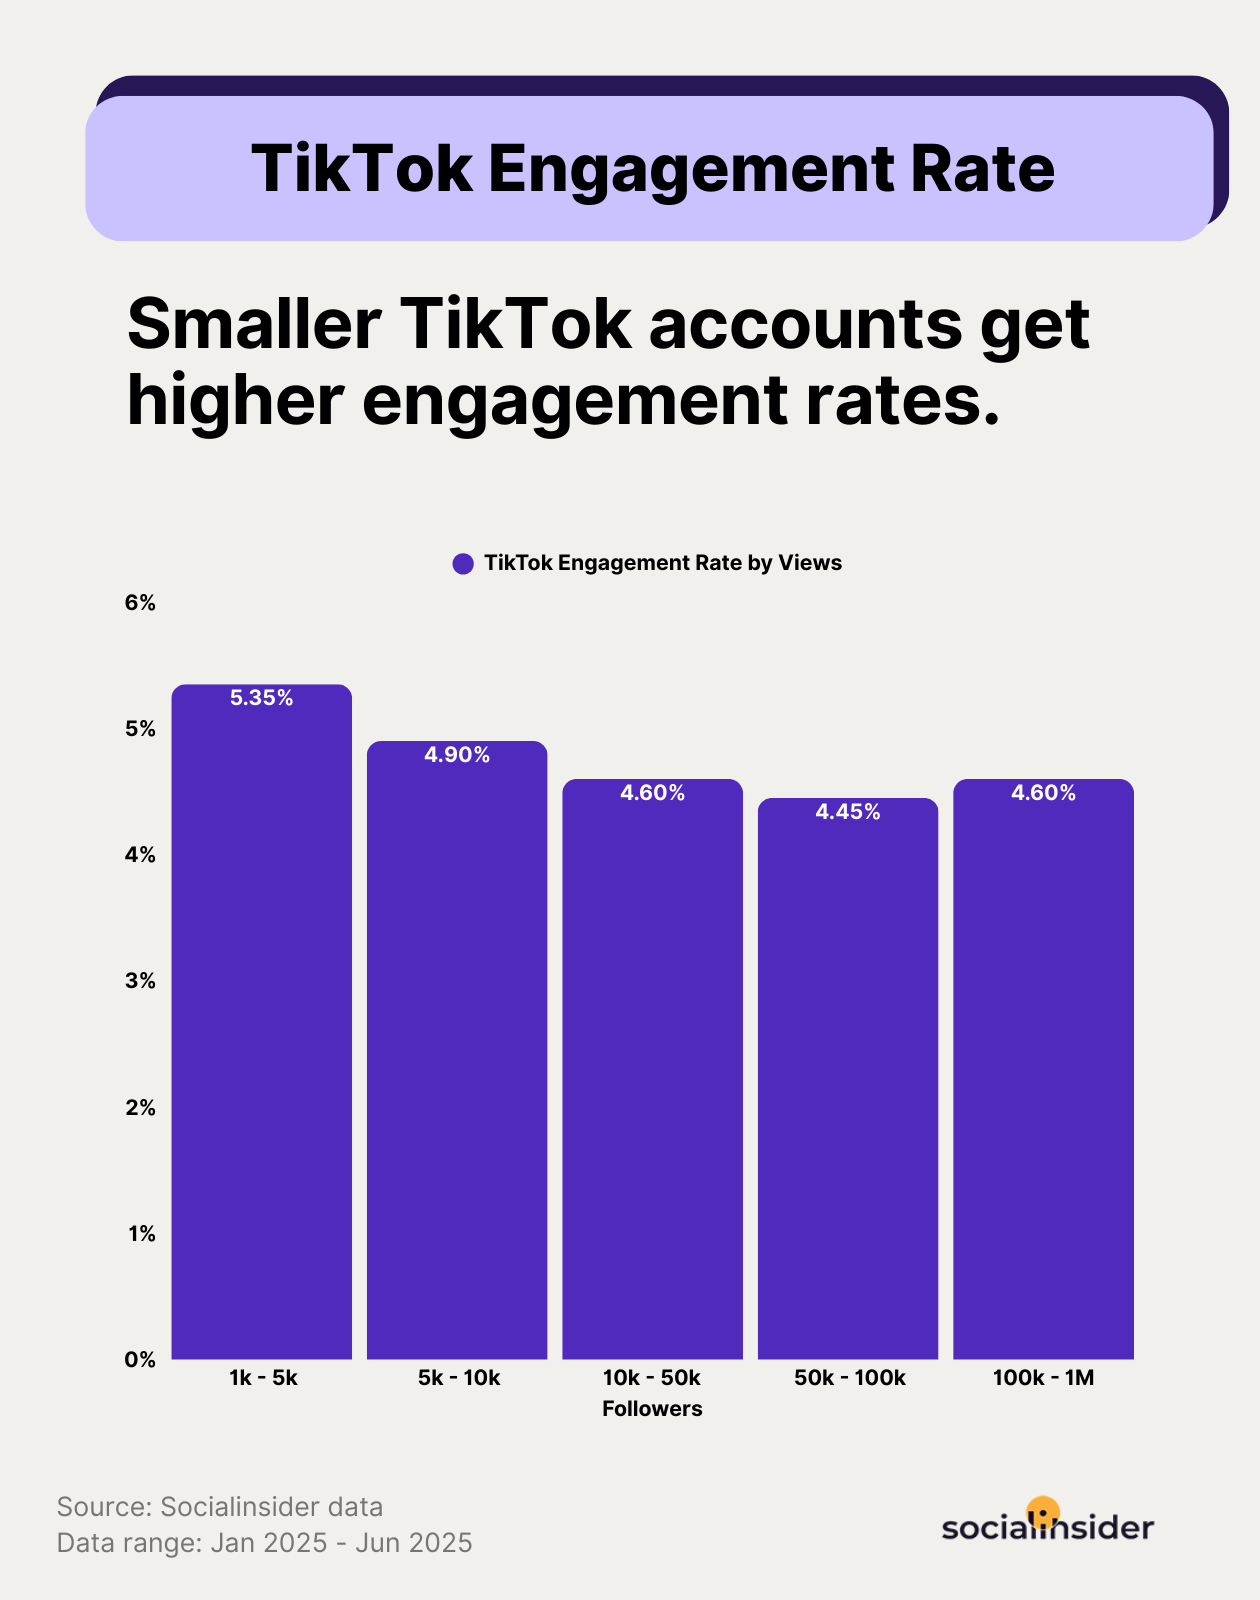
TikTok video performance statistics by account size
For brands trying to make sense of TikTok, the big question is always the same: Is this platform actually worth the effort?
The short answer? Yes, if you know what to measure.
TikTok’s video engagement isn’t about followers. It’s not about views either. What actually matters is engagement per view — the ratio that tells you if your content is just being seen… or truly working.
And that’s where this data gets interesting:
- 1K-5K followers: 5.35%
- 5K-10K followers: 4.90%
- 10K-50K followers: 4.60%
- 50K-100K followers: 4.45%
- 100K-1M followers: 4.60%
TikTok video performance statistics by video length
When TikTok first exploded, the winning formula was simple: keep it short, punchy, and packed with energy. But now? The numbers are showing a shift.
While engagement rates across the board are notably higher than other platforms, there’s a clear pattern of increased engagement as video length grows, with the highest rates showing up just beyond the 2-minute mark.
Strategic tactics on how to increase your TikTok’s engagement
- Use longer videos to tell a full story. Whether it’s a mini case study, a how-to, or a product transformation, longer TikToks give you space to build intrigue, deliver value, and land the payoff, all in one video.
- Leverage duet prompts to turn passive viewers into participants. Instead of just creating content for your audience, invite them in. Phrases like “What would you do here?” or “Stitch your version” directly encourage interaction and video replies, both of which are weighted heavily in TikTok’s engagement algorithm.
- Hook with a visual problem, not just words. Picture this: a spreadsheet full of messy data, a tool that suddenly breaks, or someone staring blankly at a screen. That visual instantly pulls viewers in before a single word is spoken. I’ve found that starting with the problem makes people curious to see the fix. The tension grabs attention, and the solution keeps them watching.
- Use retention analytics to reverse-engineer content success. If you’re consistently seeing drop-off around the 3-5 second mark, your intros are the problem.
LinkedIn videos engagement statistics
TikTok video performance statistics by page size
If you’re thinking about expanding your video marketing strategy, LinkedIn is where consistency quietly wins. It doesn’t offer the virality of TikTok or the pace of Instagram, but what it does offer is a professional, focused audience and engagement rates that actually scale.
Unlike most platforms where growth often leads to a steep drop in performance, LinkedIn shows a unique pattern: a stable curve. That alone makes it one of the most underrated channels for high-quality video engagement on social media.
- 1K-5K followers: 6.60%
- 5K-10K followers: 6.10%
- 10K-50K followers: 6.35%
- 50K-100K followers: 5.50%
- 100K-1M followers: 5.05%
That slight dip at 50K impressions is expected. But unlike Instagram or Facebook, the drop-off isn’t dramatic. Even at 100K+ followers, video content performance benchmarks remain strong.
Why? Because LinkedIn users don’t scroll for entertainment, they scroll for value. If your video delivers knowledge, insight, or expertise that feels relevant to their work, they’ll watch. And they’ll engage.
LinkedIn video performance statistics by video length
LinkedIn used to be all about text and static content. But those days are long gone. Today, video content engagement on LinkedIn is climbing fast, and the data shows something surprising: the longer your video, the stronger the response.
Not only does LinkedIn tolerate longer videos, but it rewards them.
That 90-120 second zone? That’s your gold mine. Engagement peaks here - 7.2%, the highest of any range. But even beyond the 3-minute mark, performance holds strong.
Unlike platforms that thrive on short attention spans, LinkedIn audiences are primed for content that teaches, informs, and explains. If you’re delivering real value, they’ll watch.
Strategic tactics on how to increase your video’s engagement on LinkedIn
- Focus on educational, not promotional content. Think about the last time you actually stopped to watch a company’s promotional video. Probably rare, right? What people really stick around for are videos that teach them something. When the focus is on helping instead of pitching, viewers not only watch longer but also trust the brand more.
Here’s how we reached out to an expert for insights on social media trends.
- Post at the right time. Engagement in the first 90 minutes after posting plays a major role in how far your video travels. Post when your network is active (weekday mornings and mid-afternoons) and consider tagging collaborators to drive early interaction.
- Introduce a repeatable format. Capitalize on a content pillar your audience can rely on. A weekly tip series, a recurring Q&A with your team, or regular commentary on industry news creates rhythm and expectation. This signals consistency to both the algorithm and your audience.
For example, Notion had a founder Friday series going on where they invited founders to share their learnings.
- Leverage storytelling or insight-driven content in the 90-120 second window. This range allows enough time to deliver a full idea. Think thought leadership, micro case studies, behind-the-scenes breakdowns, or industry commentary.
- Front-load value, not hype. Hook viewers in the first few seconds with substance. Skip the long intros and fluff. Start with a powerful line, insight, or problem statement that gets attention and sets the tone.
Video views statistics
Instagram Reels views performance statistics
Instagram Reels views performance statistics by account size
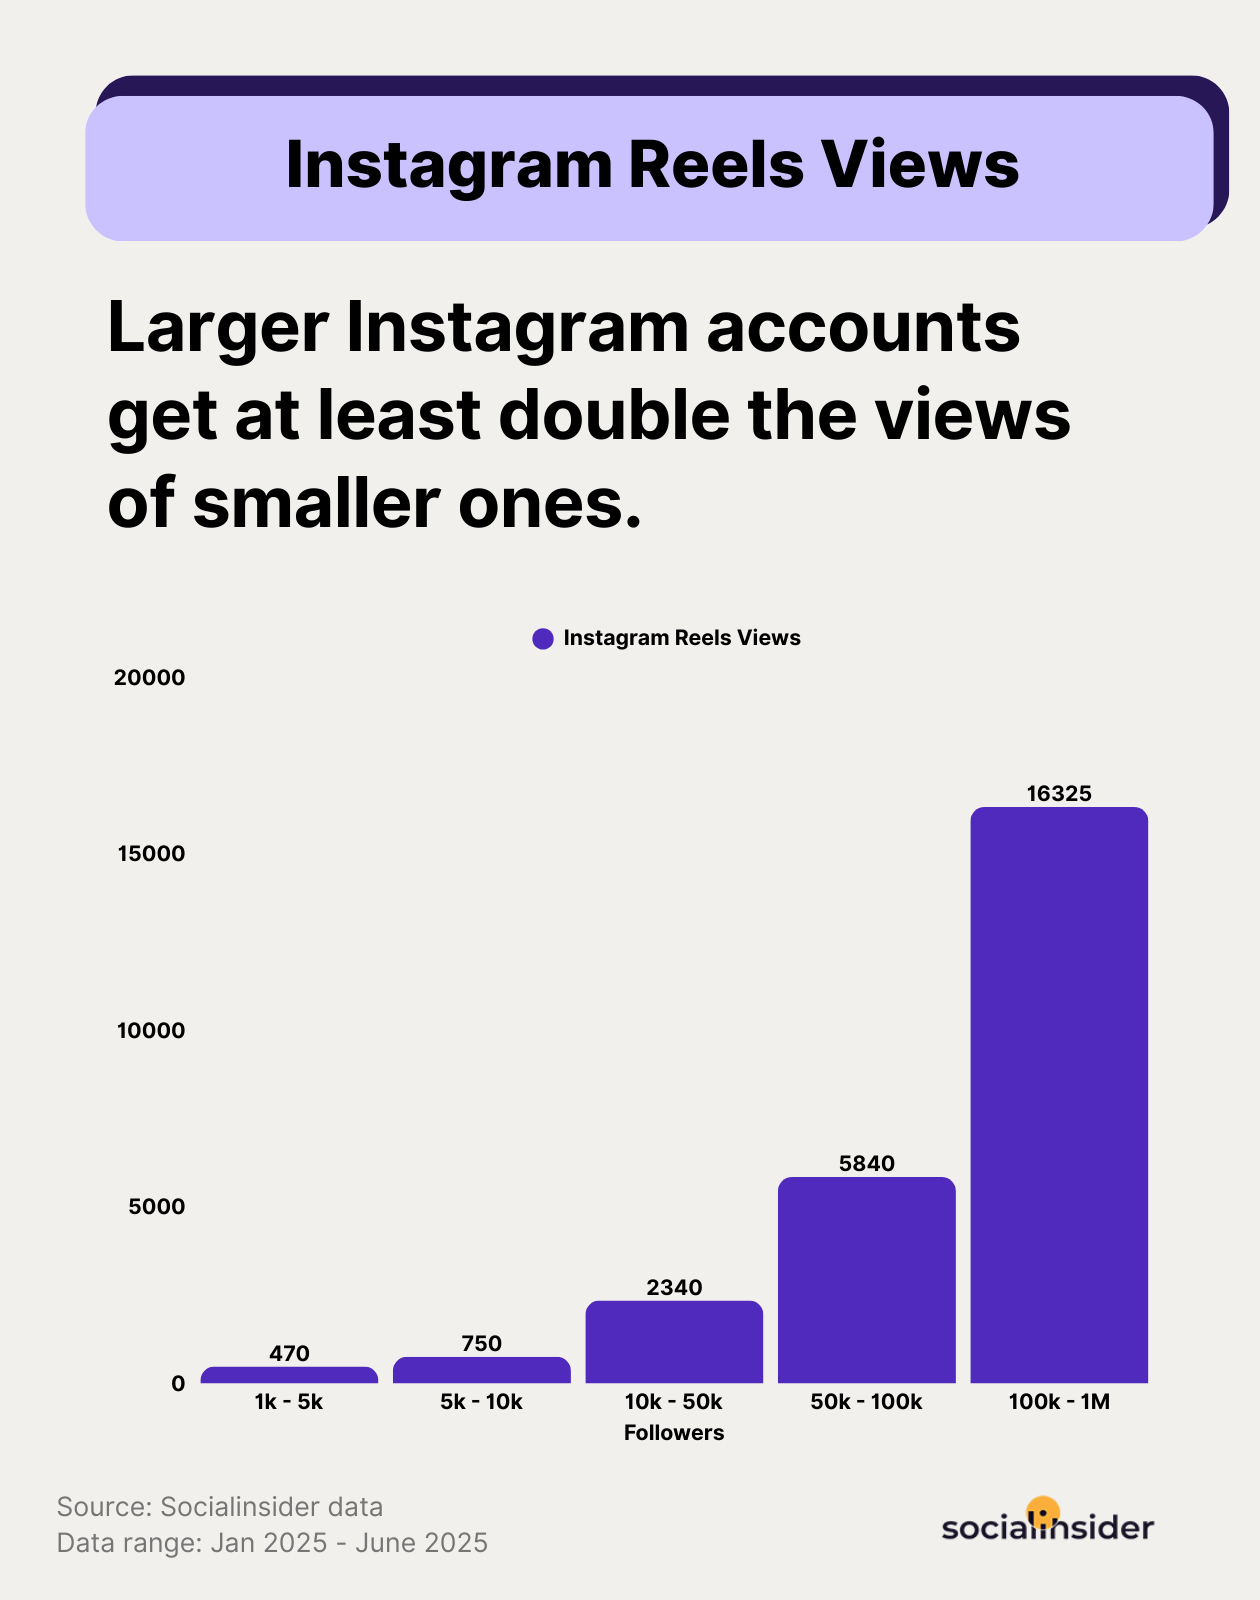
Reels are everywhere. They’ve gone from “cool experiment” to a permanent fixture in almost every content calendar. But the better question isn’t whether you should post Reels. It’s what the view data actually reveals about your audience.
When we studied how Reels perform across business accounts of different sizes, the numbers told an interesting story.
Views do grow with audience size, but the real twist happens once you cross that 50K mark. That’s when traction accelerates. It suggests Reels don’t just scale with reach. They thrive when consistent engagement and platform signals amplify the content.
In other words, Reels aren’t just about hitting publish. They’re about building momentum that feeds itself as your audience grows.
Instagram Reels views performance statistics by length
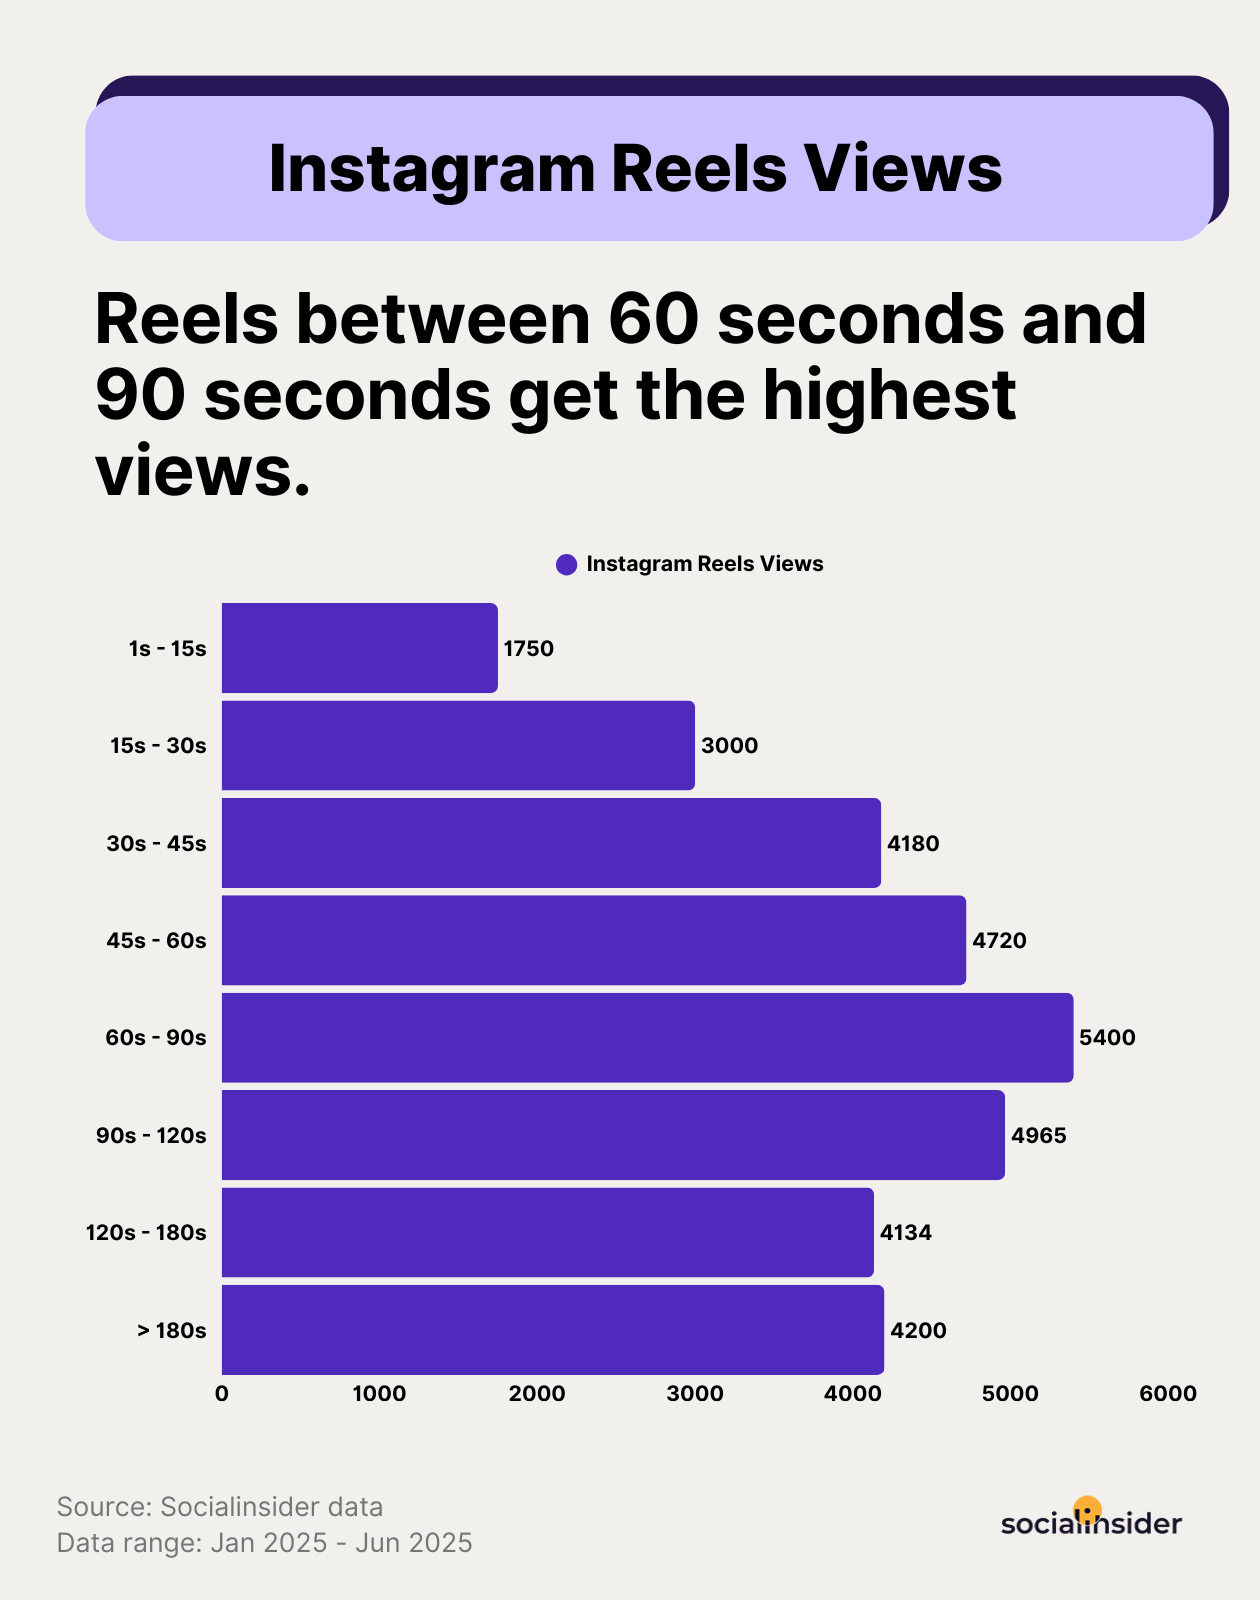
We’ve all heard the advice: “Keep your Reels short or you’ll lose your audience.” But the latest video engagement data paints a more nuanced picture. Short Reels still get views, but the real momentum builds in the 60-90 second range.
In other words? You’ve got more room to work with than you think, if you use it wisely.
Here’s how Instagram Reels view counts break down by video length:
- 1-15 seconds: 1,750 views
- 15-30 seconds: 3,000 views
- 30-45 seconds: 4,180 views
- 45-60 seconds: 4,720 views
- 60-90 seconds: 5,400 views
- 90-120 seconds: 4,965 views
- 120-180 seconds: 4,134 views
- >180 seconds: 4,200 views
But the drop-off after 90 seconds also matters. Once you cross the 2-minute mark, views decline consistently, even if not dramatically.
This dataset makes one thing clear: audiences are willing to stick around, but only if your video earns it.
Strategic tactics on how to increase your Instagram Reels’views
- Treat Reels as a feedback loop. The views tell you something about your content-market fit. If your Reels aren’t getting traction, even with a solid follower base, it might be a signal to revisit your format, pacing, or topics.
- Use pacing, not length, to keep people watching. A two-minute clip can fly by if the energy stays high. Trim the dead air, keep things moving, and layer in text, audio shifts, or quick transitions that signal there’s more to come. When the flow is tight, viewers stick around no matter the length.
- Treat the first 5 seconds like the trailer. The hook still matters more than anything. Whether you’re at 15 seconds or 90, making video content for social media always starts with one question: “Will they stop scrolling?”
Facebook Reels views performance statistics
Facebook Reels views performance statistics by page size
Facebook Reels might not get the same hype as TikTok or Instagram, but they’re quietly becoming a major growth lever, especially as your page grows.
The data shows that view counts scale sharply with audience size, meaning creators and brands who are playing the long game are sitting on real visibility potential.
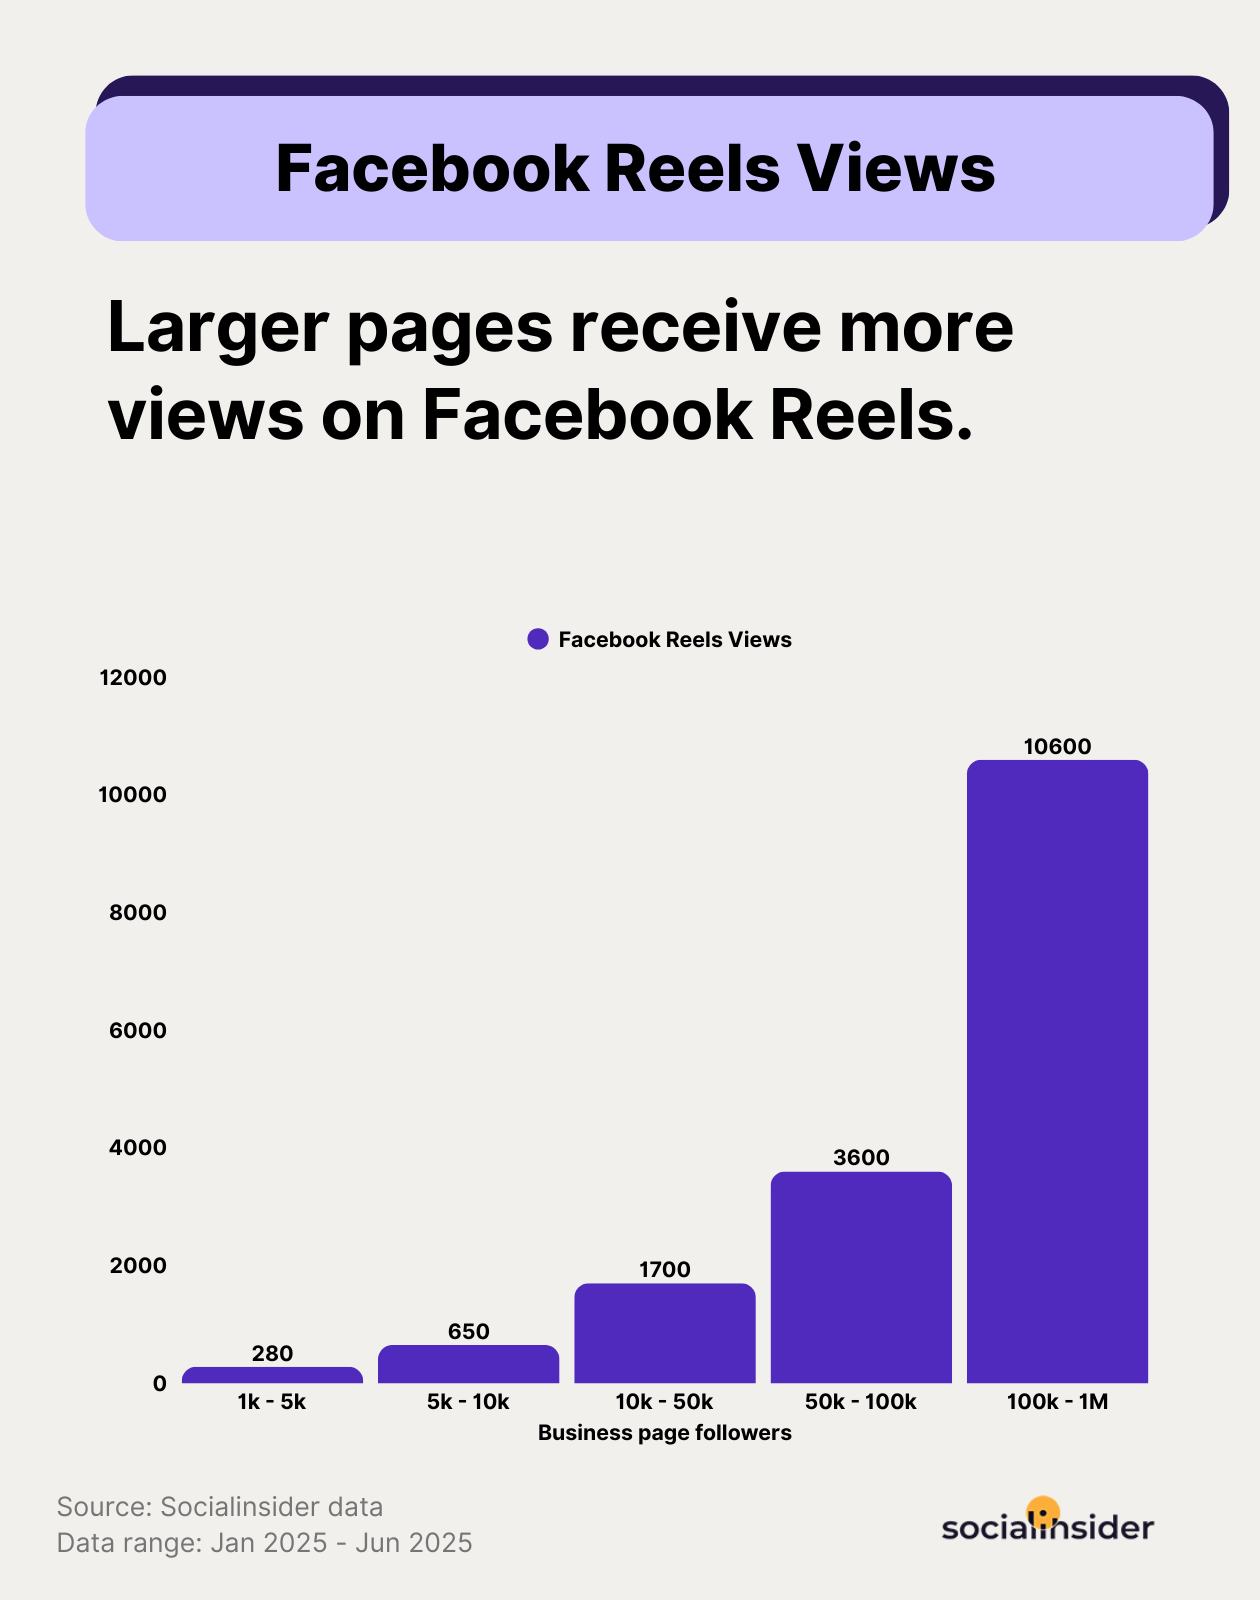
Here’s how average Facebook Reels views increase by account size:
- 1K-5K followers: 280 views
- 5K-10K followers: 650 views
- 10K-50K followers: 1,700 views
- 50K-100K followers: 3,600 views
- 100K-1M followers: 10,600 views
This is one of the cleanest growth patterns across any platform. Views more than triple between 5K and 50K followers and nearly triple again between 50K and 100 K. The takeaway? Once your account builds traction, Facebook rewards consistency and scale with serious visibility.
Facebook Reels views performance statistics by video length
It’s not enough to say ‘make your Reels 60-90 seconds long.’ The better question is why that length drives higher views, and how to use it as a creative advantage. The numbers show a very specific pattern, and it’s telling us more than just ‘cut the fluff.’
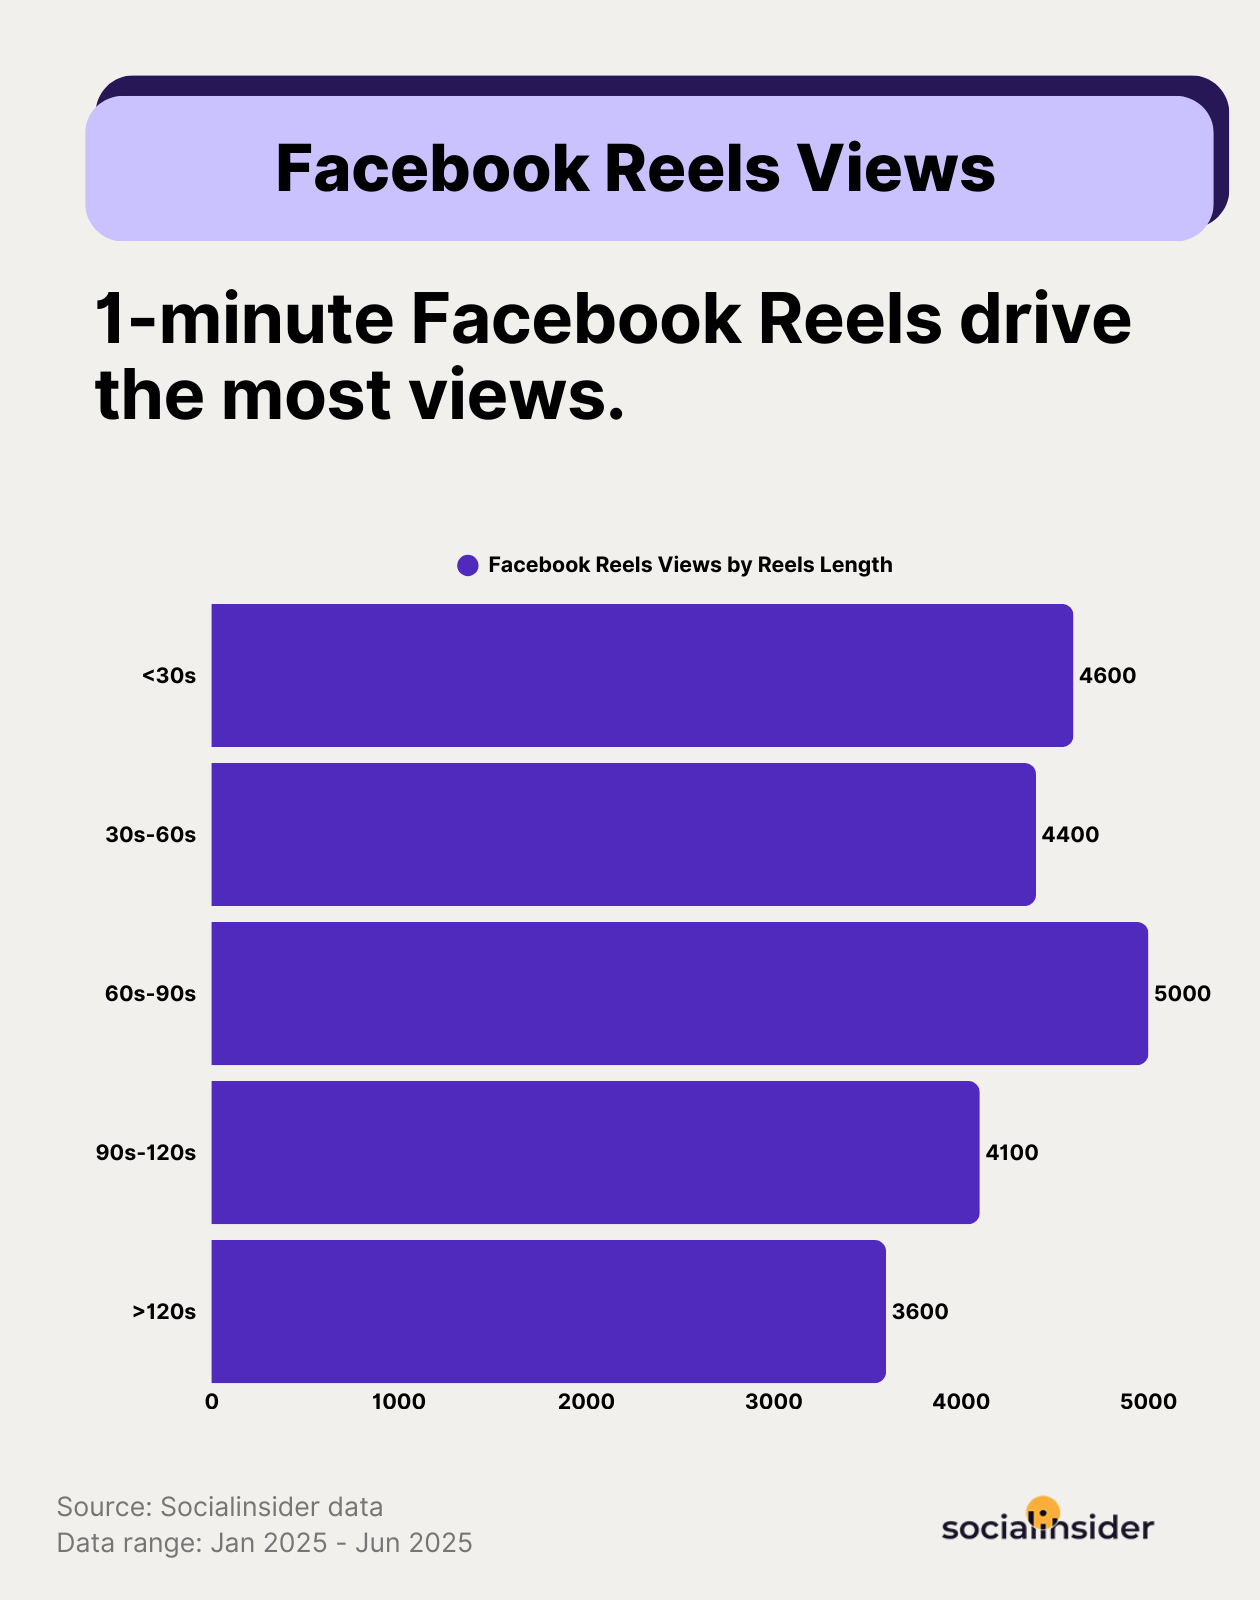
Here’s what we saw when breaking down average views by Reel length:
- Under 30s: 4,600 views
- 30s-60s: 4,400 views
- 60s-90s: 5,000 views
- 90s-120s: 4,100 views
- Over 120s: 3,600 views
Videos in the 60-90 second range perform best, with both shorter and longer formats trailing behind. There’s a visible drop once you cross the 90-second mark and while <30s still hold up, they’re not the top performer.
This pattern suggests a key behavior: Facebook rewards brands who deliver full value without exhausting attention. You’ve got roughly a minute to prove your point, and the brands that build for that window win the feed.
Strategic insights on how to increase your views on Facebook Reels
- Plan content for scale, not just today’s audience. Facebook’s Reels algorithm favors creators/brands who deliver predictable, high-quality content on repeat. Pick 2-3 content pillars that actually resonate with your audience and rotate them consistently. This is how viewers get around to recognizing your brand and staying tuned to your Reels.
- Focus on simplicity to make your content instantly digestible. Many Facebook users watch Reels without switching on the voice. This is why you need to use big text, clear context, and minimal clutter. Ensure your videos work with or without sound, and preferably lead with your key idea in the first 1-2 seconds.
For example, this Reel by HubSpot gets every element right to make content easily understandable, with or without voice.
- Use longer Reels for retention testing. The drop past 90 seconds isn’t just about attention, it’s about endurance.When you do go long, use it intentionally — to test storytelling, deeper education, or series content. Make every second work harder.
TikTok views performance statistics
TikTok video views performance statistics by account size
TikTok flips the traditional growth model upside down. On most platforms, your audience size defines your visibility. But here? Your content defines your views, regardless of how big your account is.
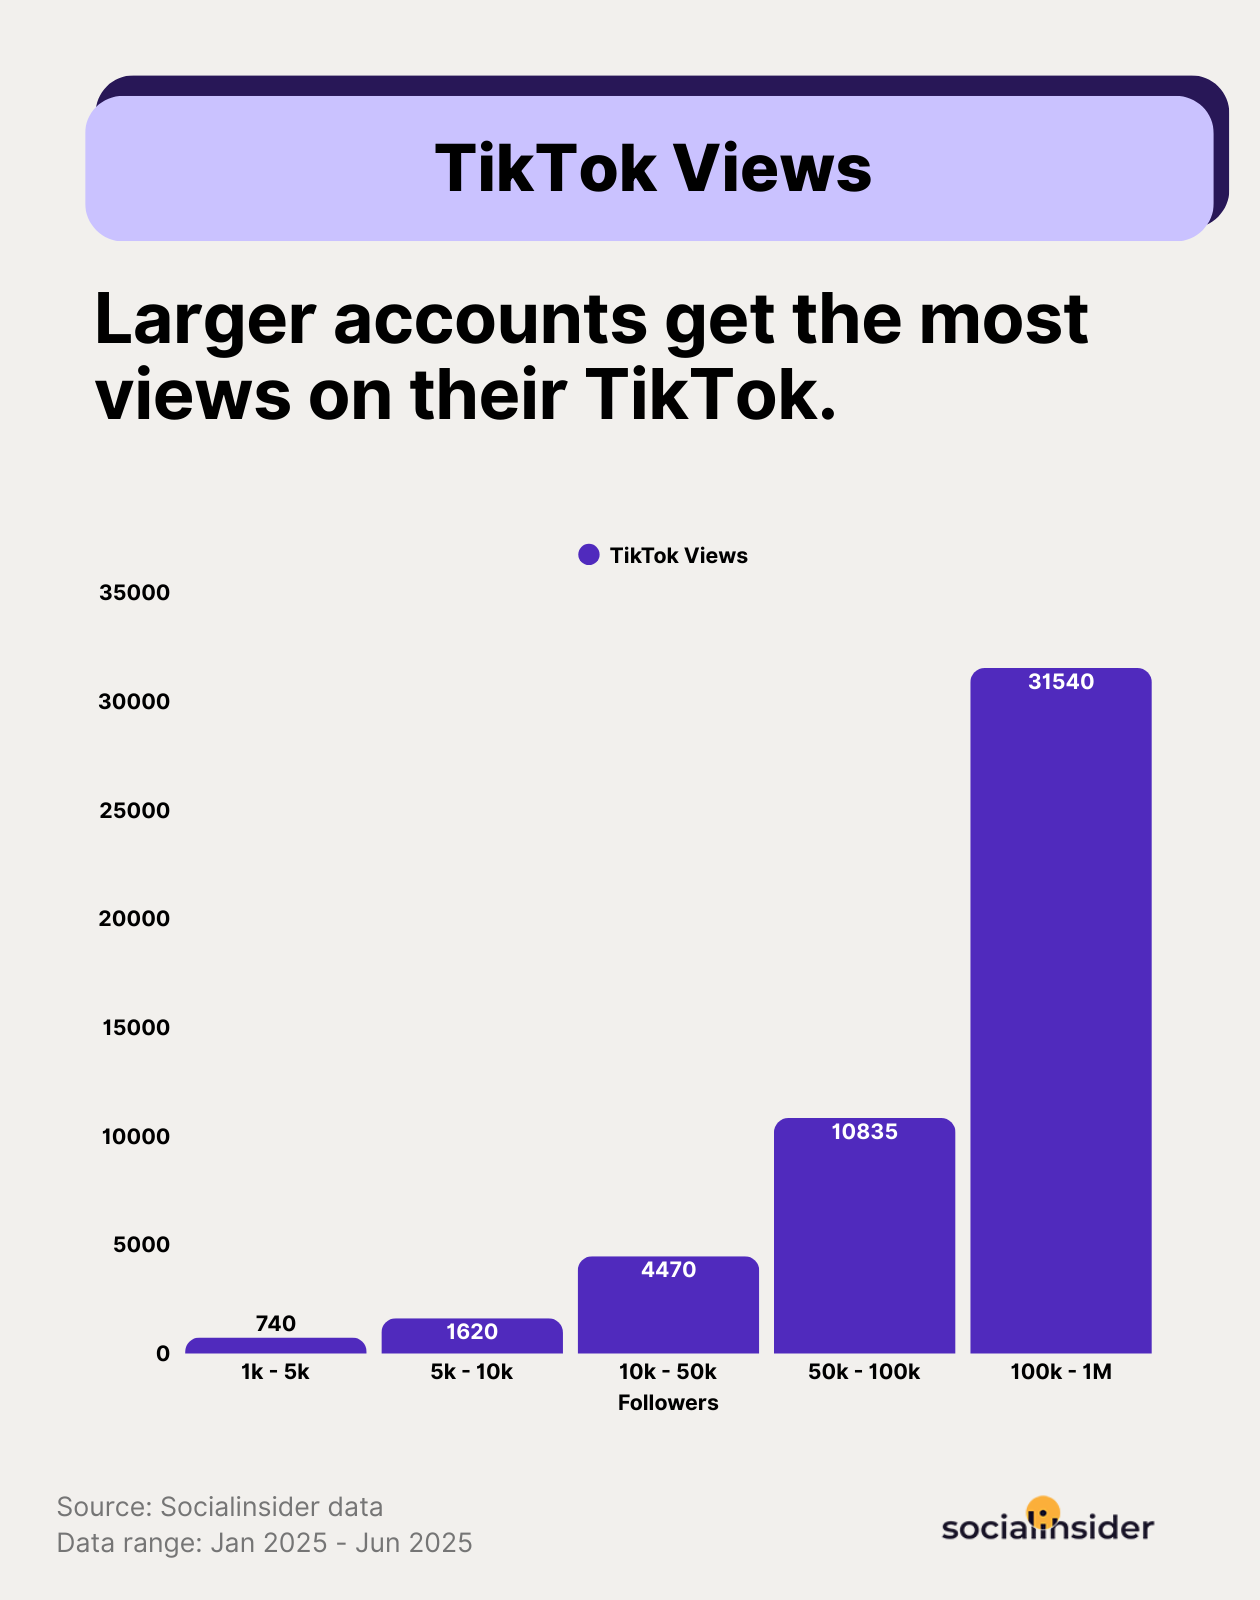
But when we looked at the data, one thing stood out: the bigger the account, the bigger the boost in views.
Smaller accounts, let’s say under 10K followers, have to “prove” every piece of content. The algorithm tests their videos with a small audience first, and if engagement isn’t strong, the video never goes wider.
But as accounts grow, that testing pool also grows. A video from an account with 100K followers gets shown to more people, faster. If it performs well right away, the algorithm pushes it harder.
More followers mean more initial reach, and when that initial group reacts positively, TikTok sees that as a strong signal to keep distributing the content.
That’s why we see such a sharp difference in the numbers. From 10K to 100K, the average views jump from about 4.4K to 10.8K. From 100K onward, it leaps again to over 31K. The system trusts that content more because it’s seen that account perform again and again.
So yes, great content still drives views, but once you’ve built a strong audience, TikTok lets your content travel faster, further, and with less resistance.
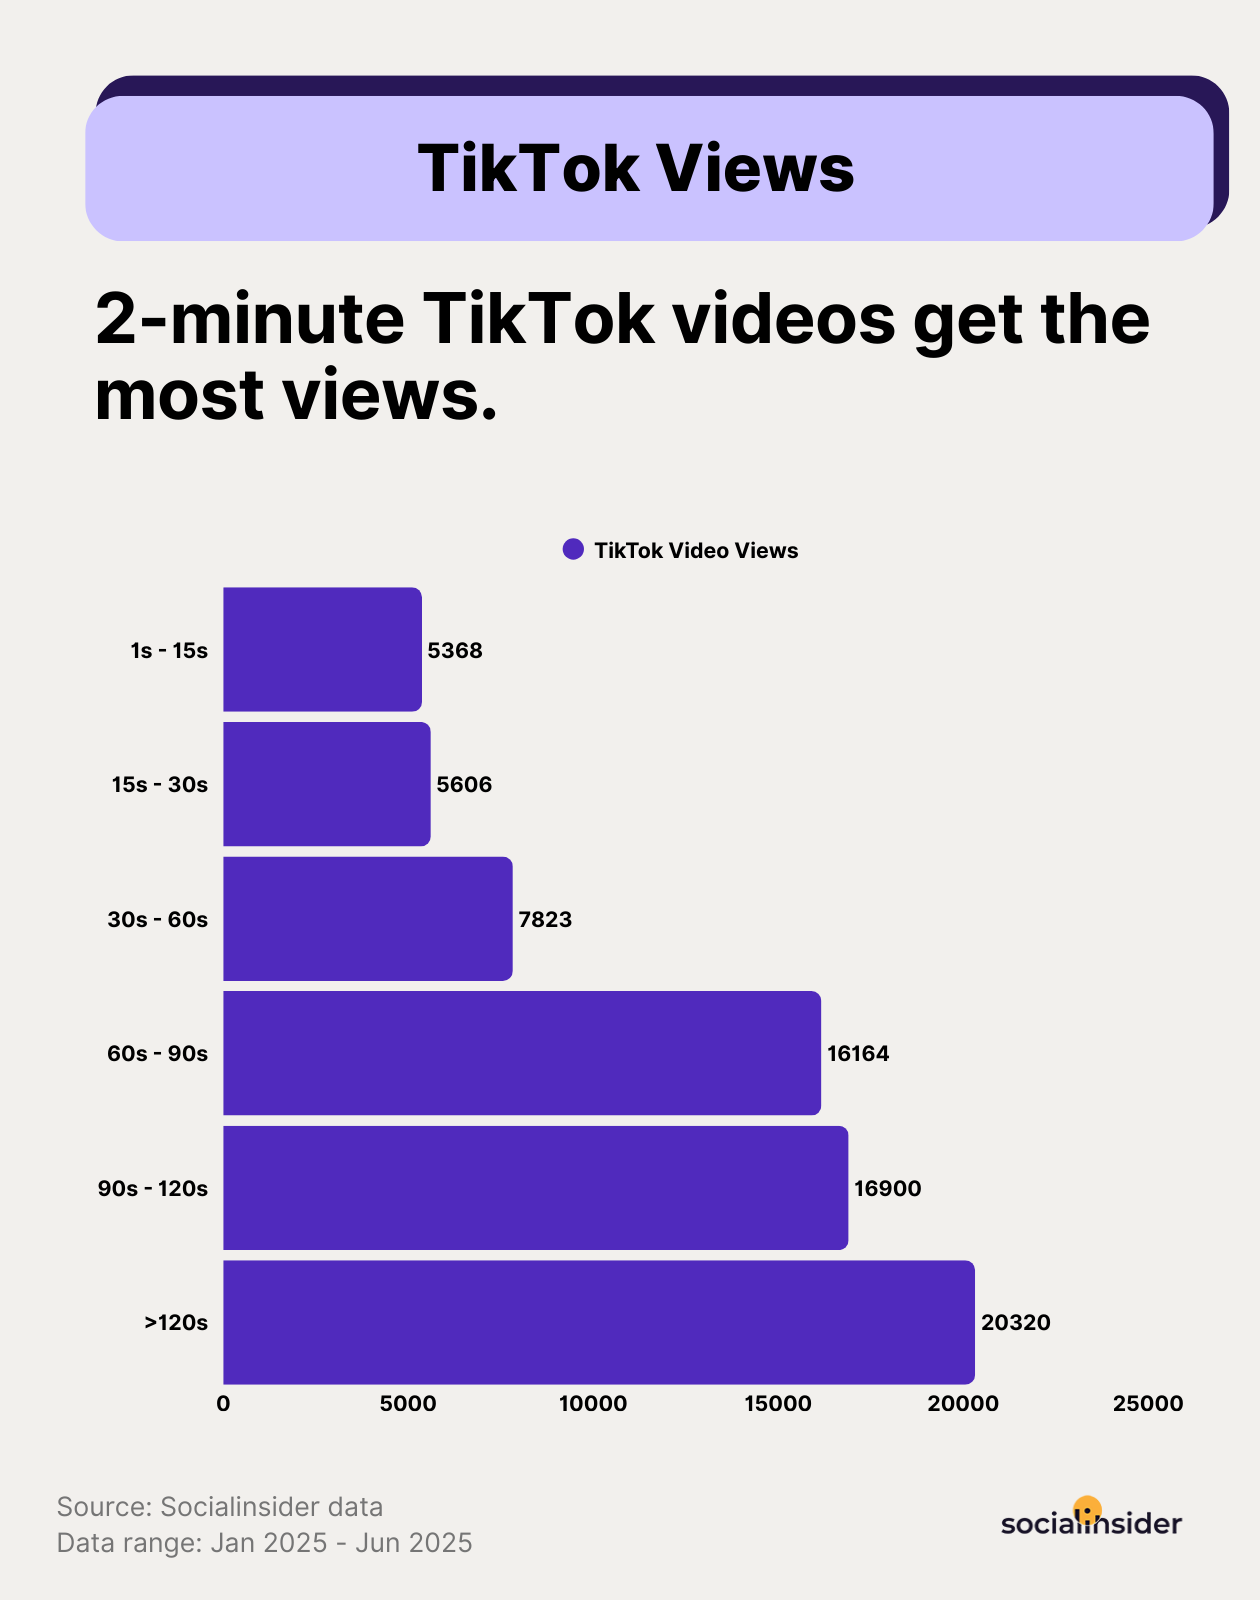
TikTok video views performance statistics by video length
TikTok made its name on quick, snappy videos. But the platform has changed, and so has viewer behavior.
Here’s how average views stack up across different video lengths:
- 1s-15s: 5,368 views
- 15s-30s: 5,606 views
- 30s-60s: 7,823 views
- 60s-90s: 16,164 views
- 90s-120s: 16,900 views
- 120s+: 20,320 views
Our data shows that longer videos are now consistently outperforming short ones, with average views climbing sharply as video length increases. And if you’re still capping everything at 15-30 seconds, you’re likely leaving reach on the table.
There’s a clear shift after the one-minute mark. Videos that run longer than 60 seconds attract more than double the views of shorter formats, and that trend continues past two minutes.
Strategic tactics on how to increase your views on TikTok
- Test beyond your comfort zone. If you always post 15-30 second videos, it’s time to try something new. Take a short that already worked and expand it into a 60-second version with extra detail or a stronger story arc. Then check the numbers. You’ll often see a lift that proves longer can hook just as hard when the content earns it.
- Lean into formats with natural progression. Longer videos do work, but only when you plan them strategically. You don’t want them to get impatient. One hack we have seen work is using process-driven or time-based content. For example, use formats that mention “watch this happen over 60 seconds” or “here’s what changed in a minute” to reward the viewer for sticking around.
- Give long content a purpose beyond performance. Not every long video needs to go viral. Some can anchor a campaign, test a message, or show depth. Use longer videos to test storytelling, product education, or new positioning, then turn the best-performing ideas into snappier, ad-ready versions.
LinkedIn video views performance statistics
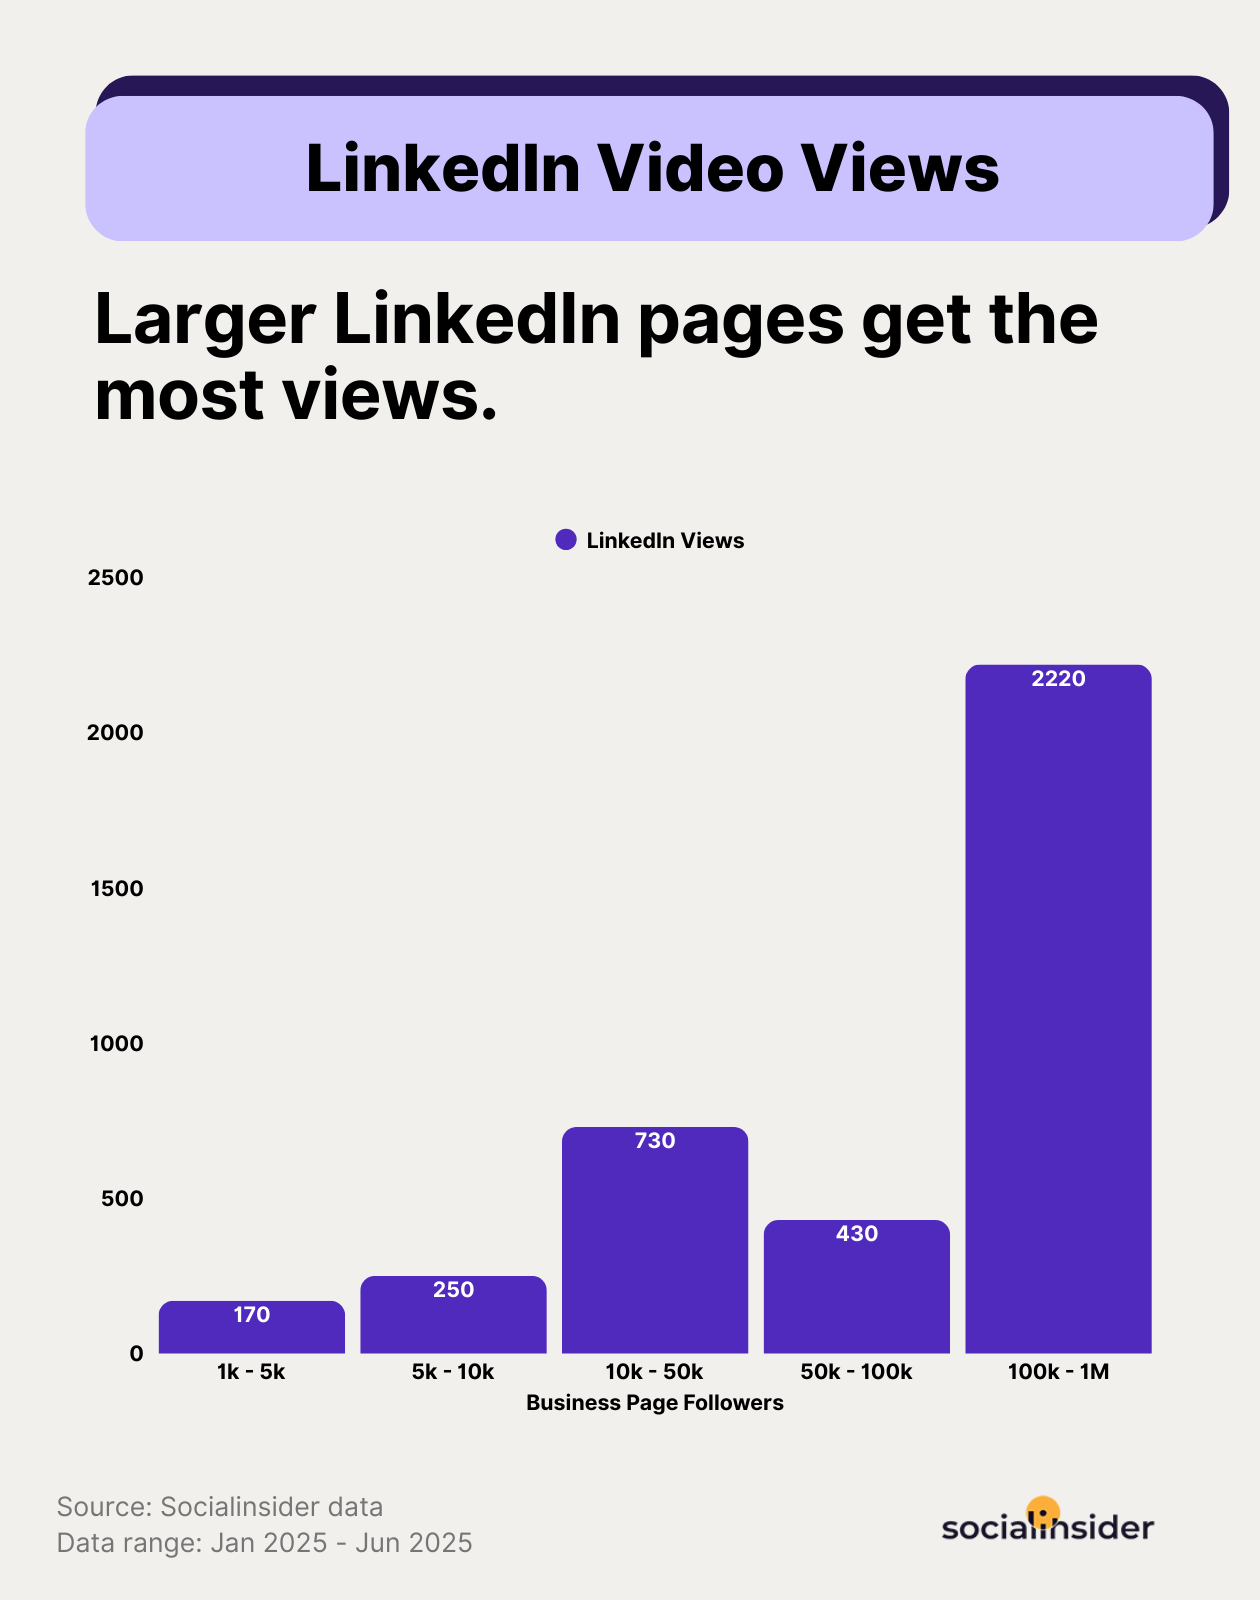
LinkedIn video views performance statistics by page size
LinkedIn video views don’t scale as neatly as you might expect. While you’d think more followers automatically means more visibility, the data shows a more complex story, one that every B2B marketer should be paying attention to.
At first, views grow steadily. But between 50K and 100K, the curve dips before jumping dramatically once an account crosses 100K. That signals a common visibility plateau on LinkedIn. The algorithm isn’t just scaling views based on size; it’s waiting for signals of consistency, authority, and value.
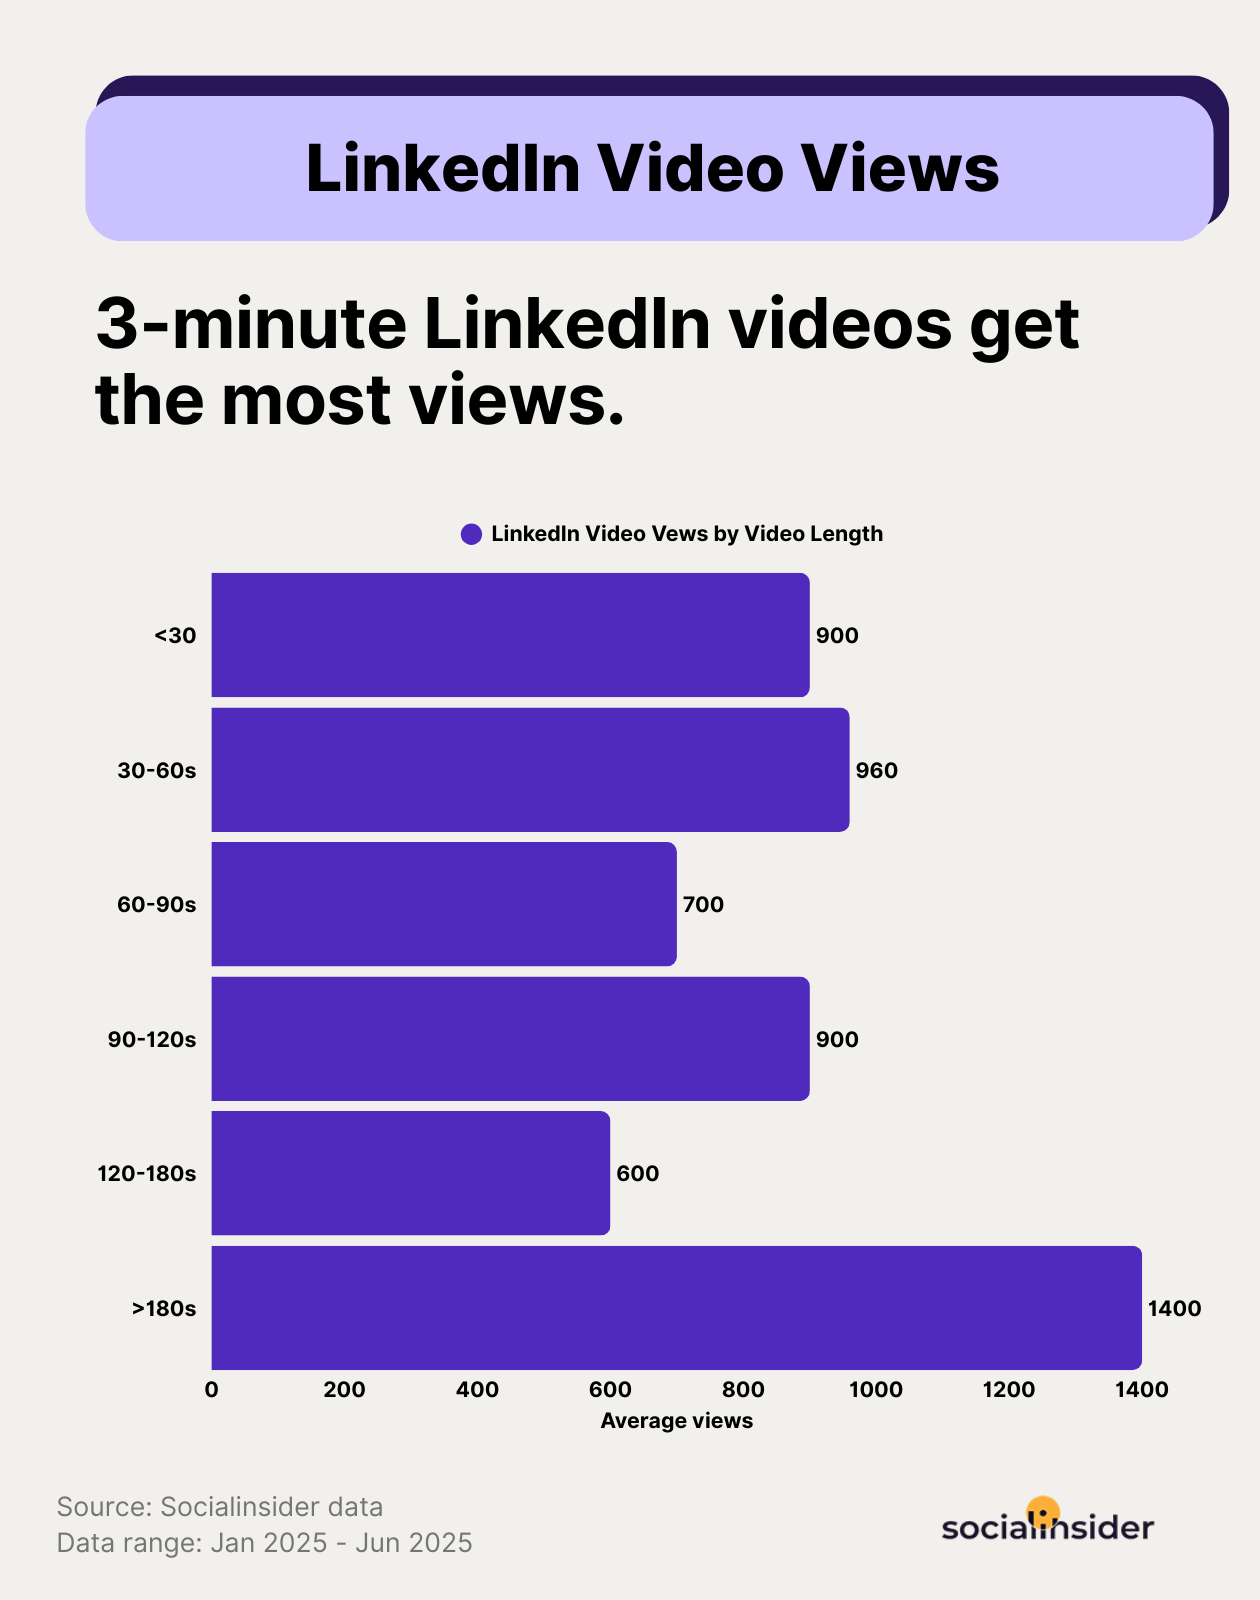
LinkedIn video views performance statistics by video length
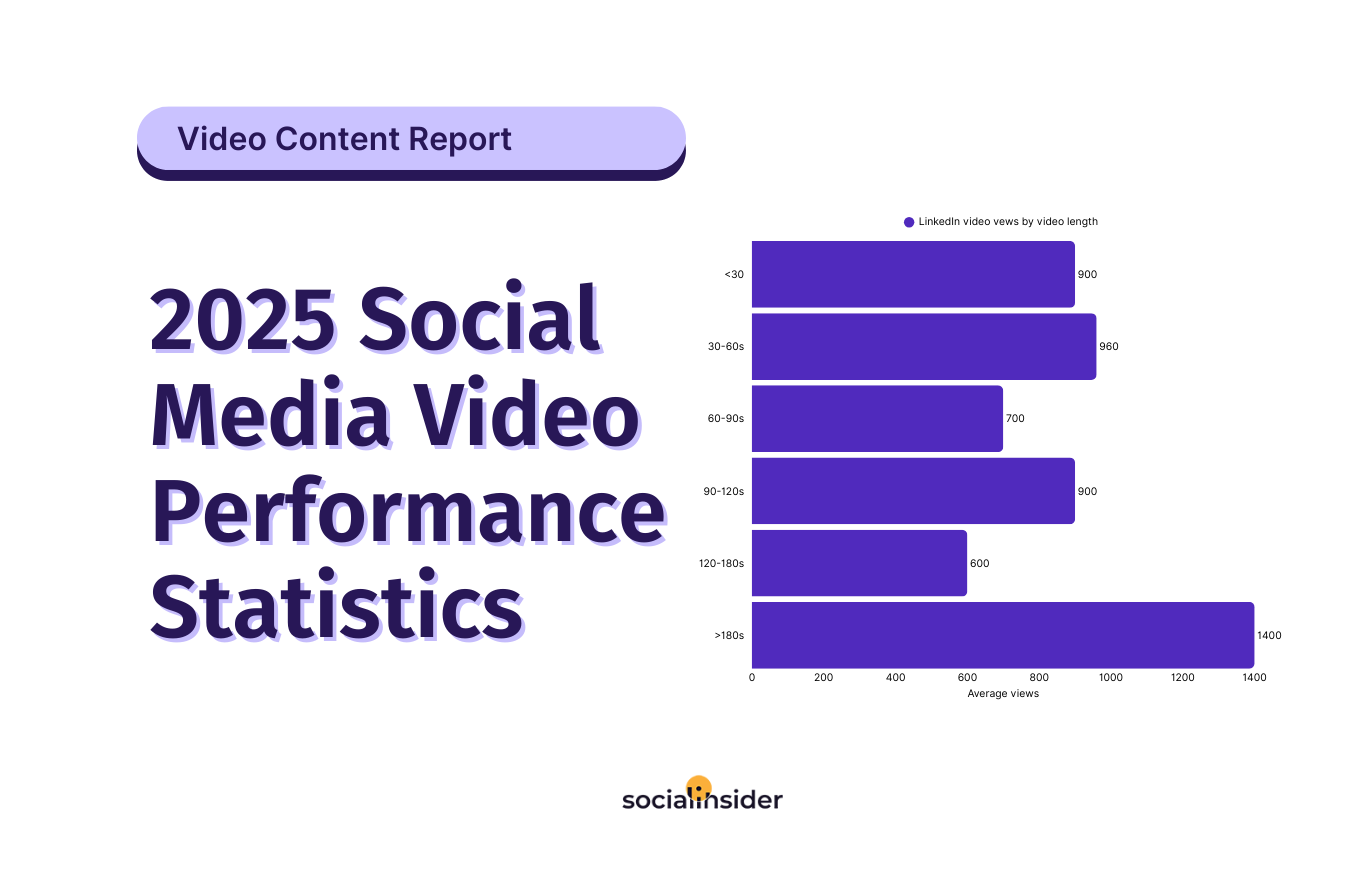
LinkedIn doesn’t reward video length the way you might expect. This data shows that views don’t follow a linear path. Some short videos perform well, some mid-length ones drop off, and then, surprisingly, videos longer than 3 minutes jump to the top.
The focus here is on intent. And if you’re not tailoring your content length to match the message, you're likely leaving views on the table.
Average video views based on length:
- Under 30s: 900 views
- 30s-60s: 960 views
- 60s-90s: 700 views
- 90s-120s: 900 views
- 120s-180s: 600 views
- Over 180s: 1,400 views
What stands out is the drop-off in the middle. Videos between 60s and 180s underperform. But once content crosses the 3-minute mark, it pulls in more than double the views of videos in the 2-minute range. That tells us: LinkedIn either wants quick hits or depth, but not in between.
Strategic tactics to increase your video views on LinkedIn
- Lean into educational content to boost visibility. The platform rewards content with utility, not fluff. I’ve noticed that whenever views dip, it’s usually because the post drifted into promotion instead of value. A video that breaks down a single stat, a quick framework, or one clear idea always travels further.
- Rebuild momentum when growth stalls. Hitting 50K followers is often where LinkedIn stops doing you favors, unless you’re actively showing up. Reset your posting rhythm. Publish video consistently for at least 3-4 weeks. The algorithm needs signals that your content is still active, relevant, and worth distributing.
- Double down on your best-performing formats. Chasing 100K? Don’t reinvent the wheel. First, teach the platform what you’re about. Look at your analytics and spot the format that’s already working (quick tips, stories, behind-the-scenes). Then double down. Turn that format into a series your audience can recognize instantly. When the content feels familiar, both viewers and the algorithm know exactly what to do with it, and that’s when growth snowballs.
Methodology
For Instagram and Facebook, the average video engagement rate is calculated by followers. The research included the analysis of 11M Instagram posts and 3M Facebook posts)
For TikTok, the average video engagement rate is calculated by views. The research included the analysis of 2M TikTok videos)
For LinkedIn, the average video engagement rate is calculated by impressions. The research included the analysis of 67K LinkedIn videos).
Get insightful video performance metrics
Run a powerful video content analysis and discover best practices for strategy optimization!
Ready to improve your social media strategy with real-time insights?
Get strategic insights, analyze the social performance across all channels, compare metrics from different periods and download reports in seconds.