Original Social Media Research & Reports
Stay on top of social media trends and insights through original research and studies. Here are the latest data-backed resources.
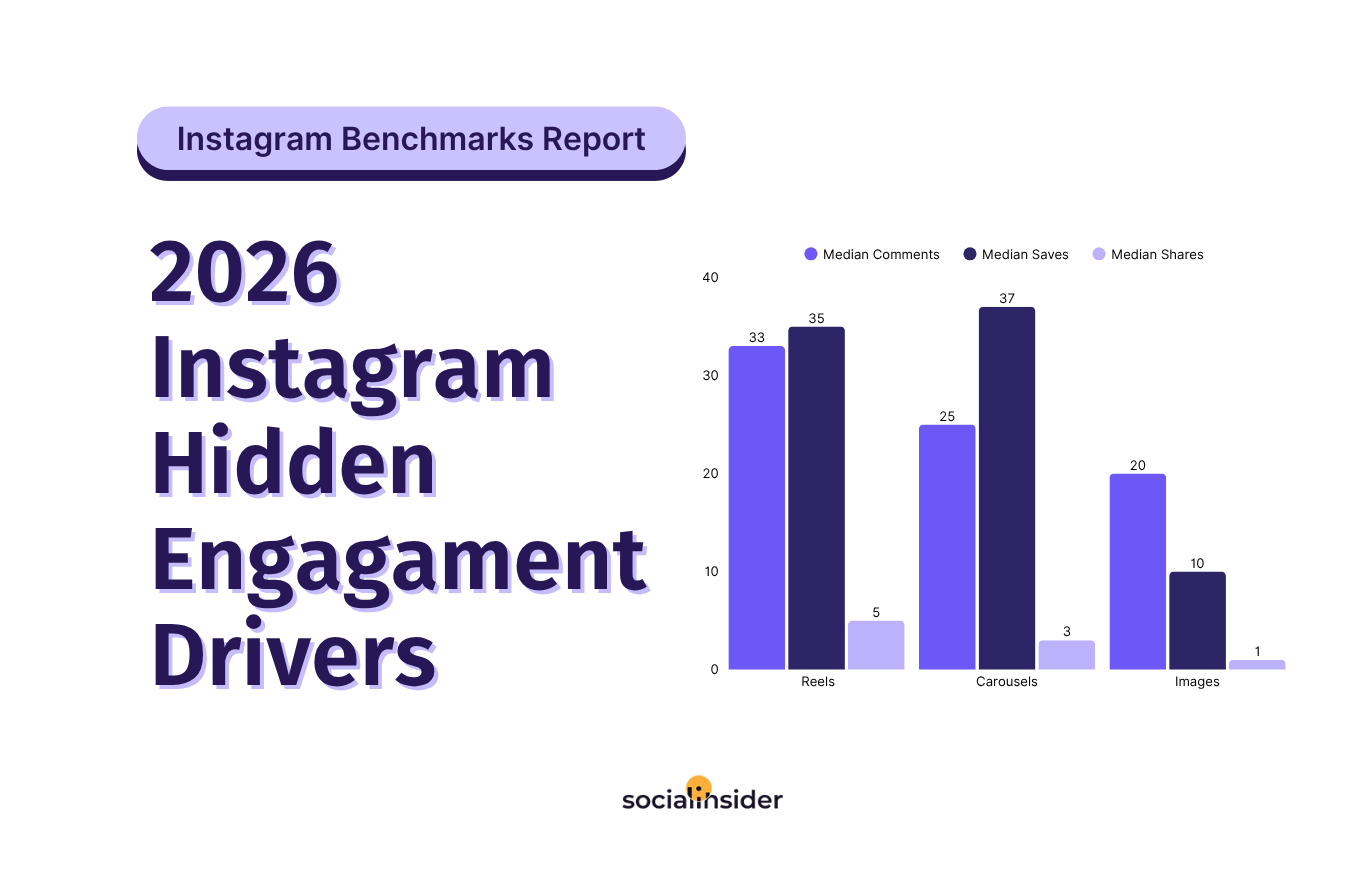
Instagram Engagement Report: The Hidden Engagement Drivers
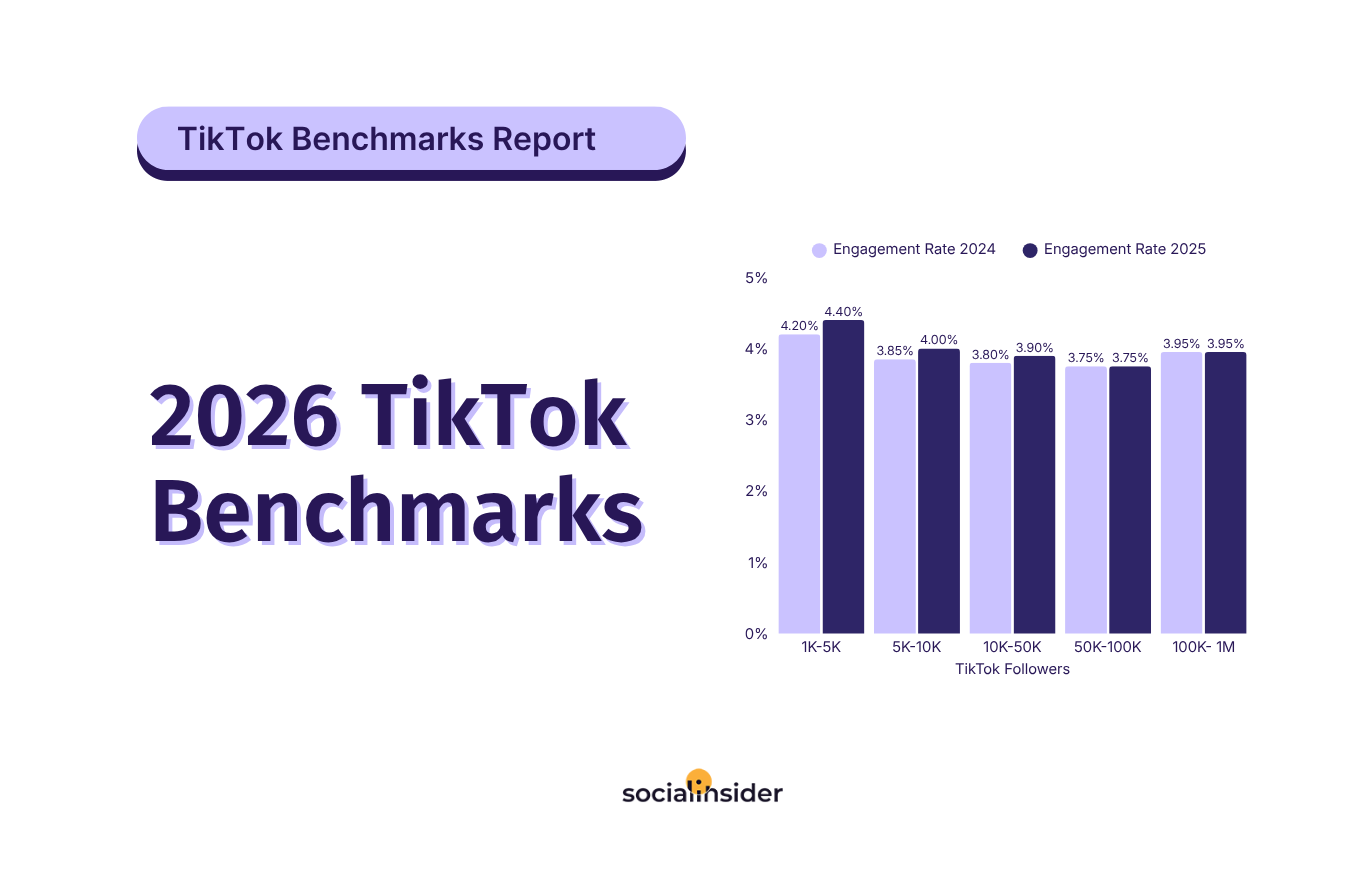
2026 TikTok Benchmarks
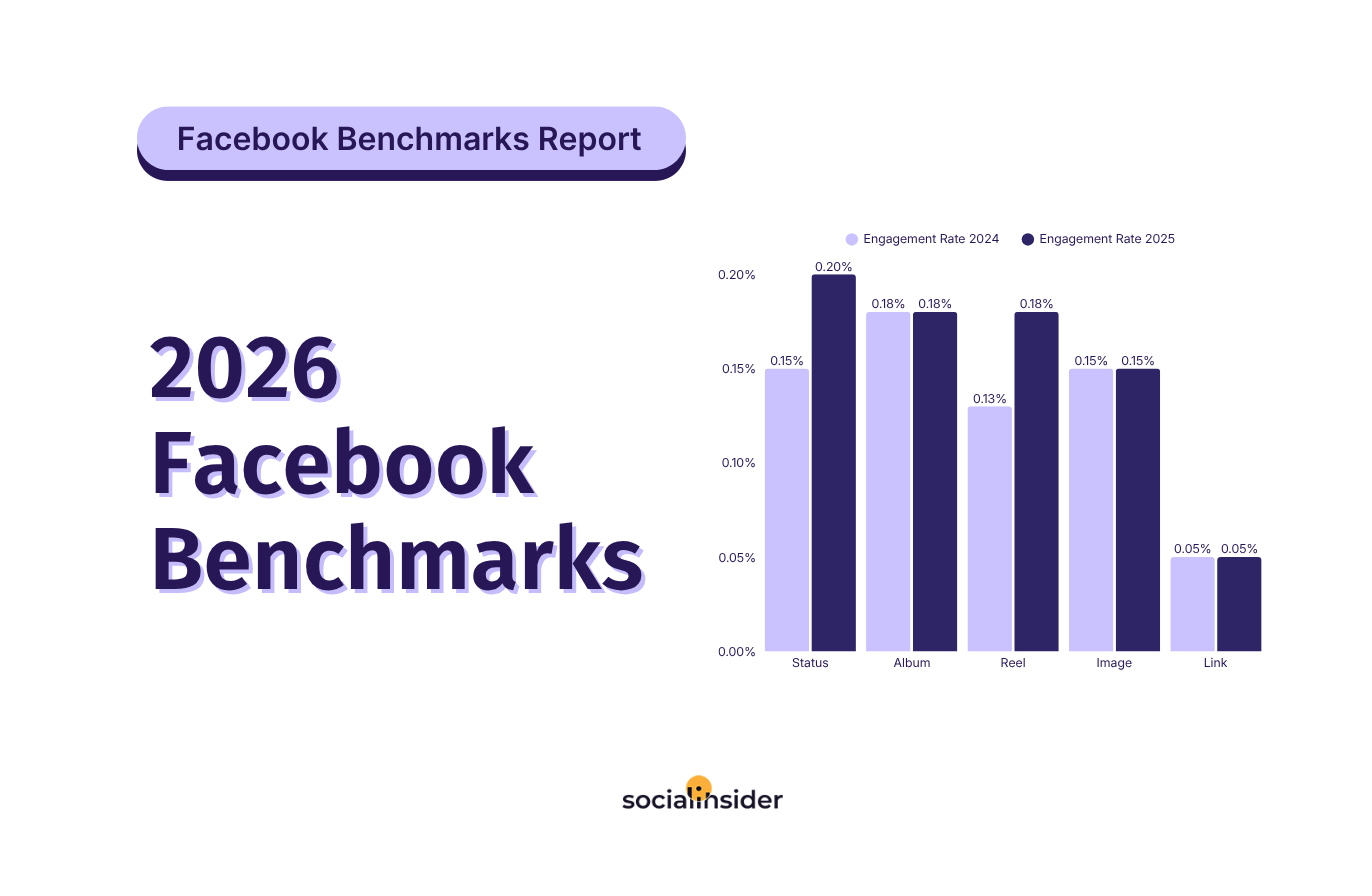
2026 Organic Facebook Engagement Benchmarks
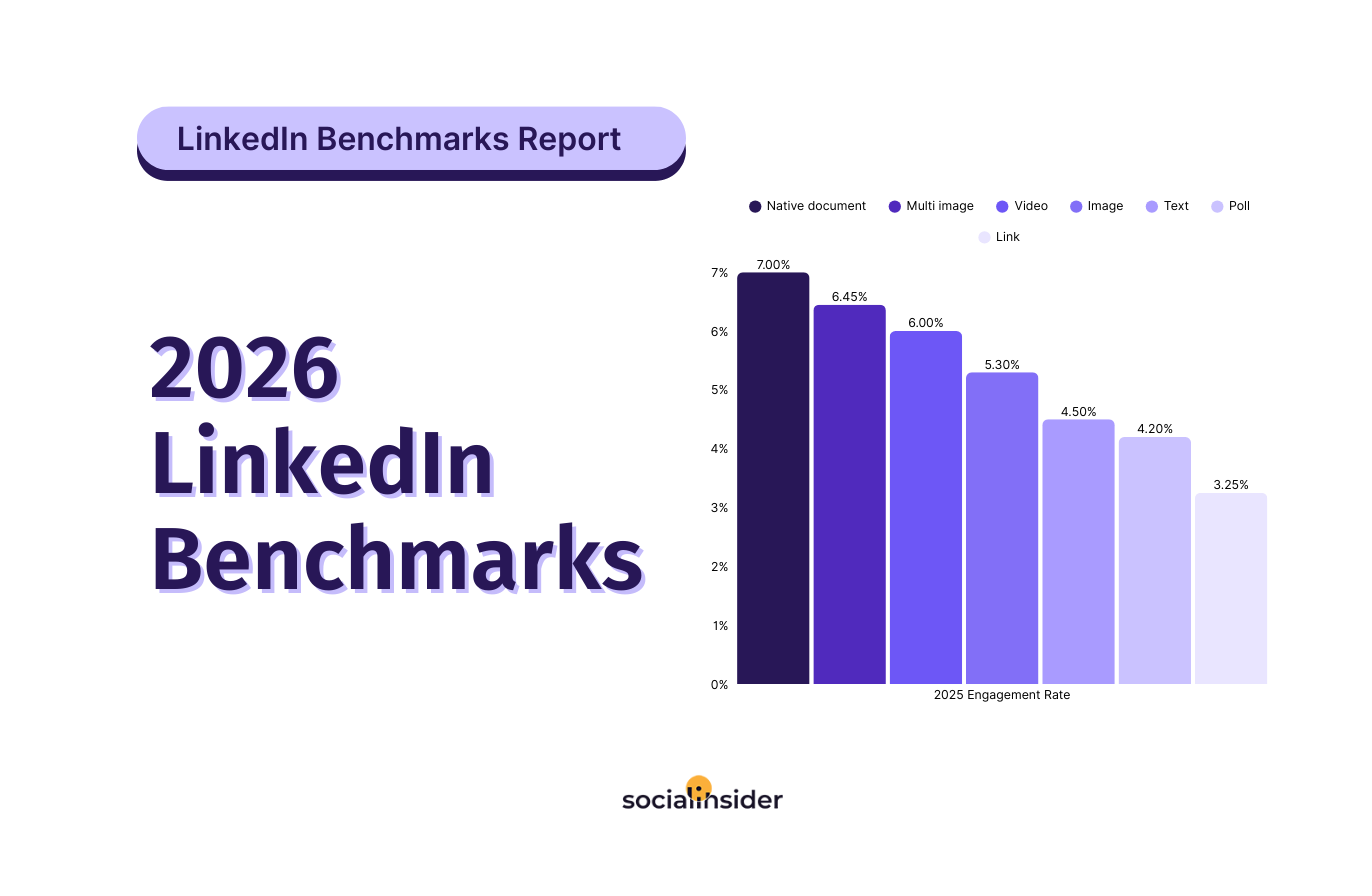
2026 LinkedIn Benchmarks
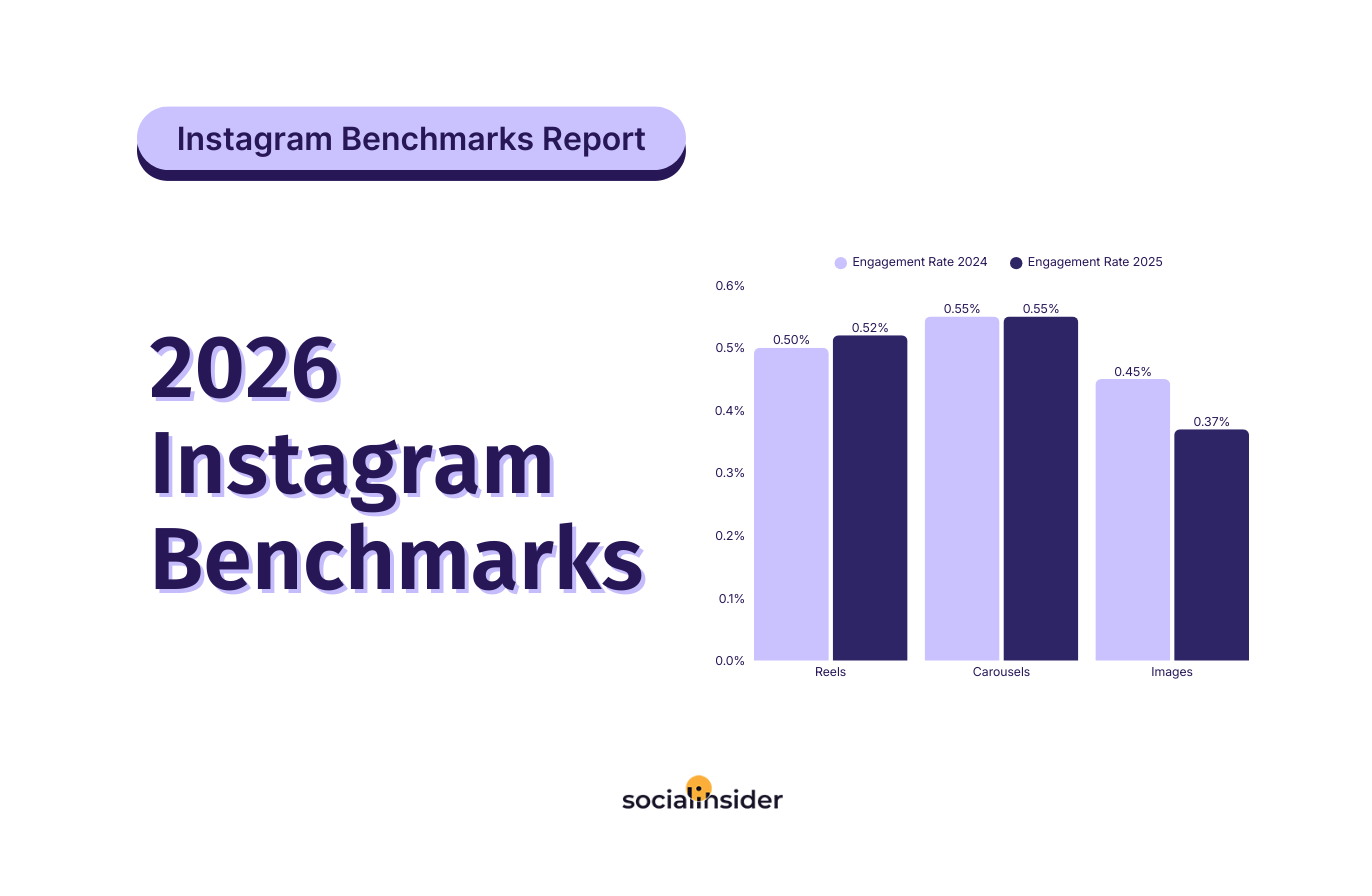
2026 Instagram Organic Benchmarks
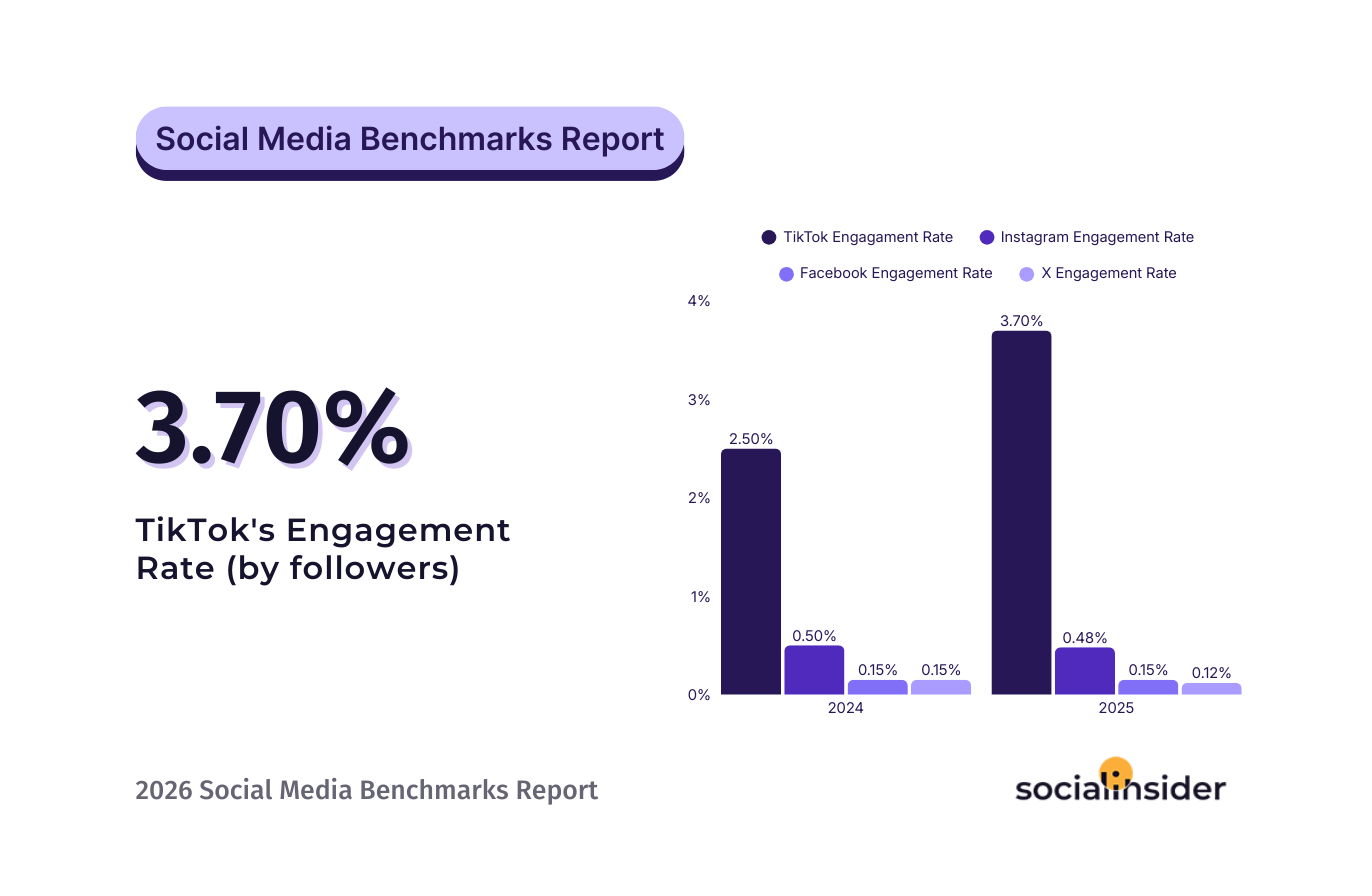
2026 Social Media Benchmarks
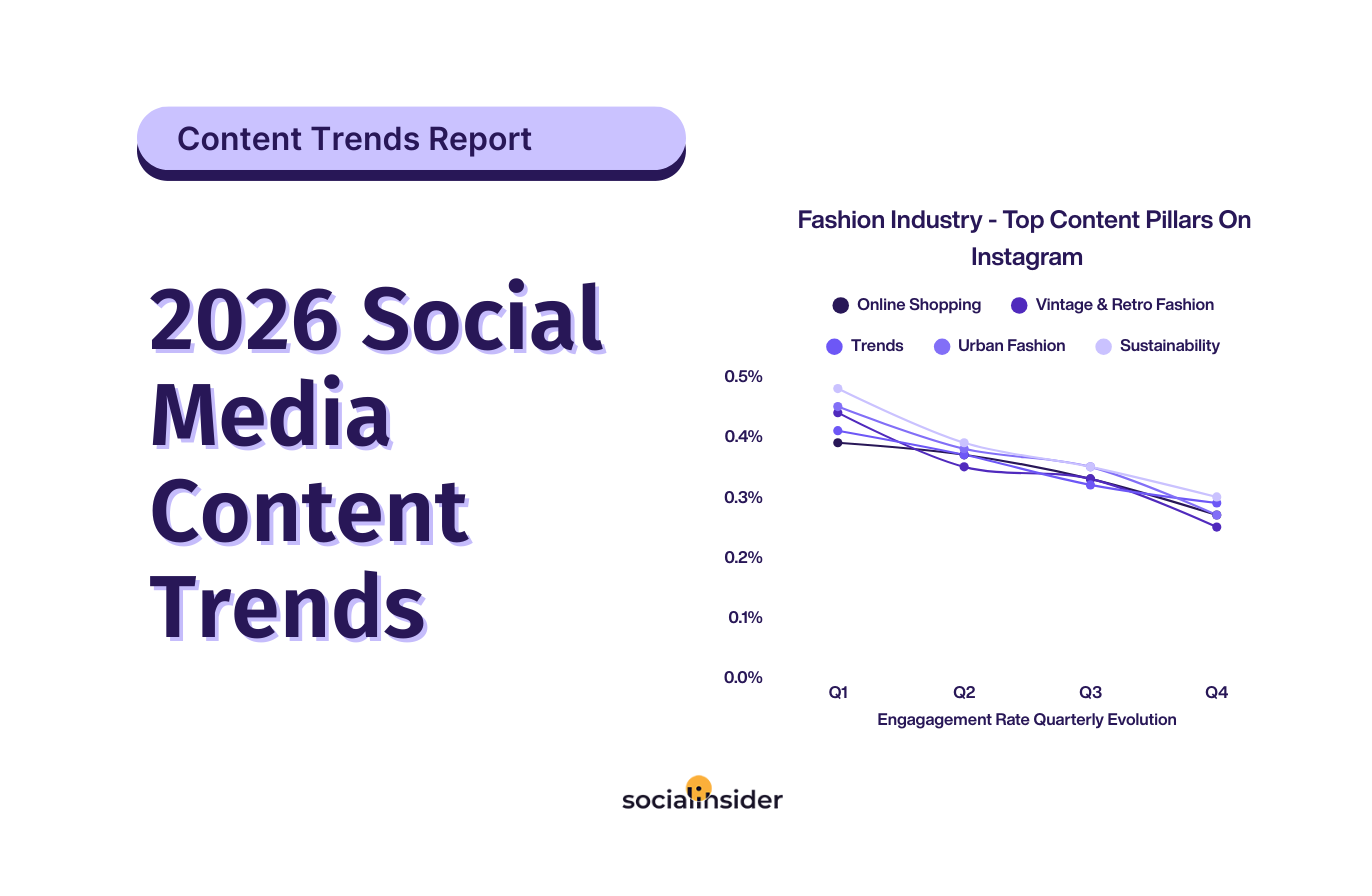
2026 Social Media Content Trends Across 16 Different Industries
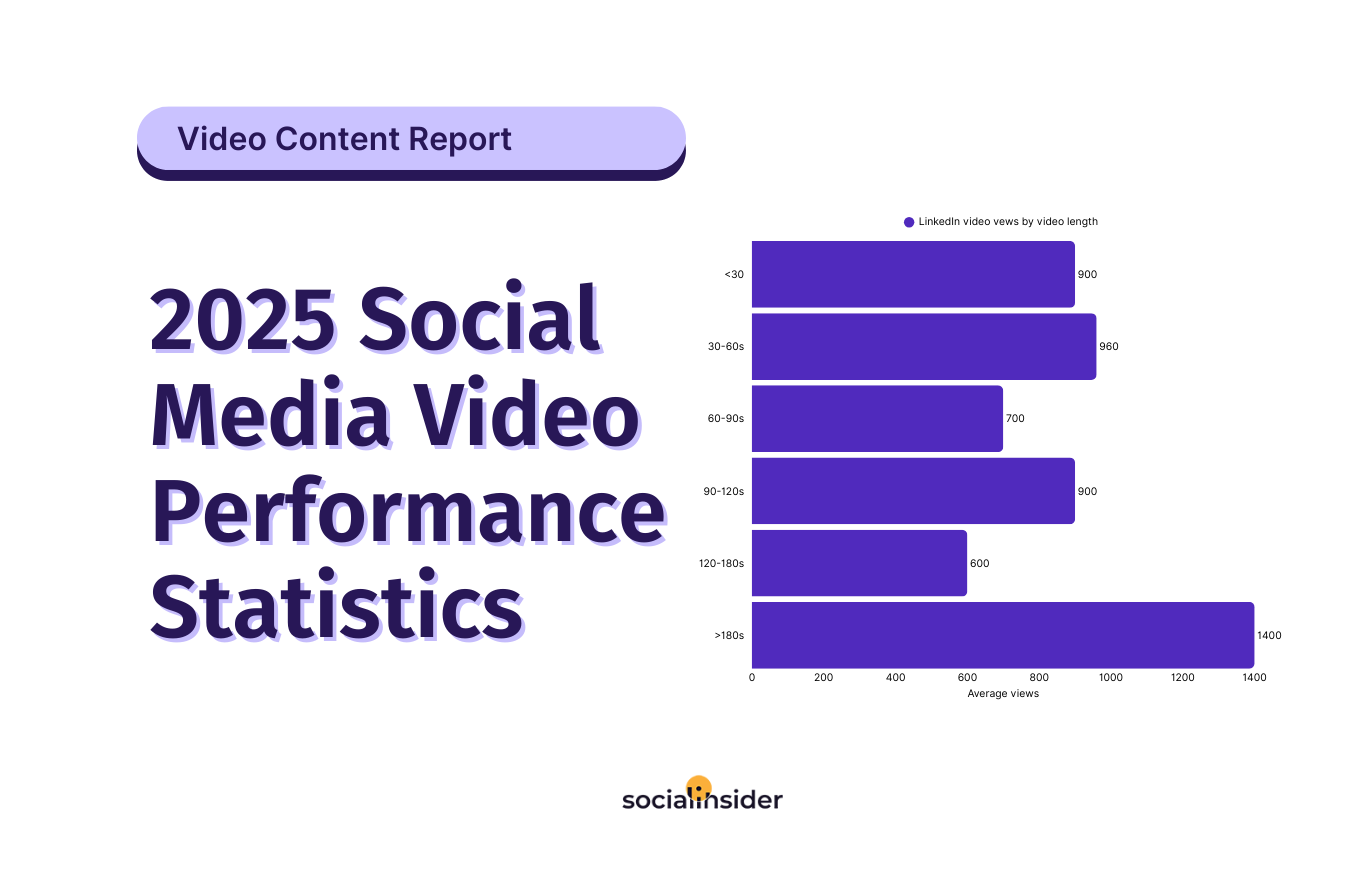
2025 Social Media Video Performance Statistics
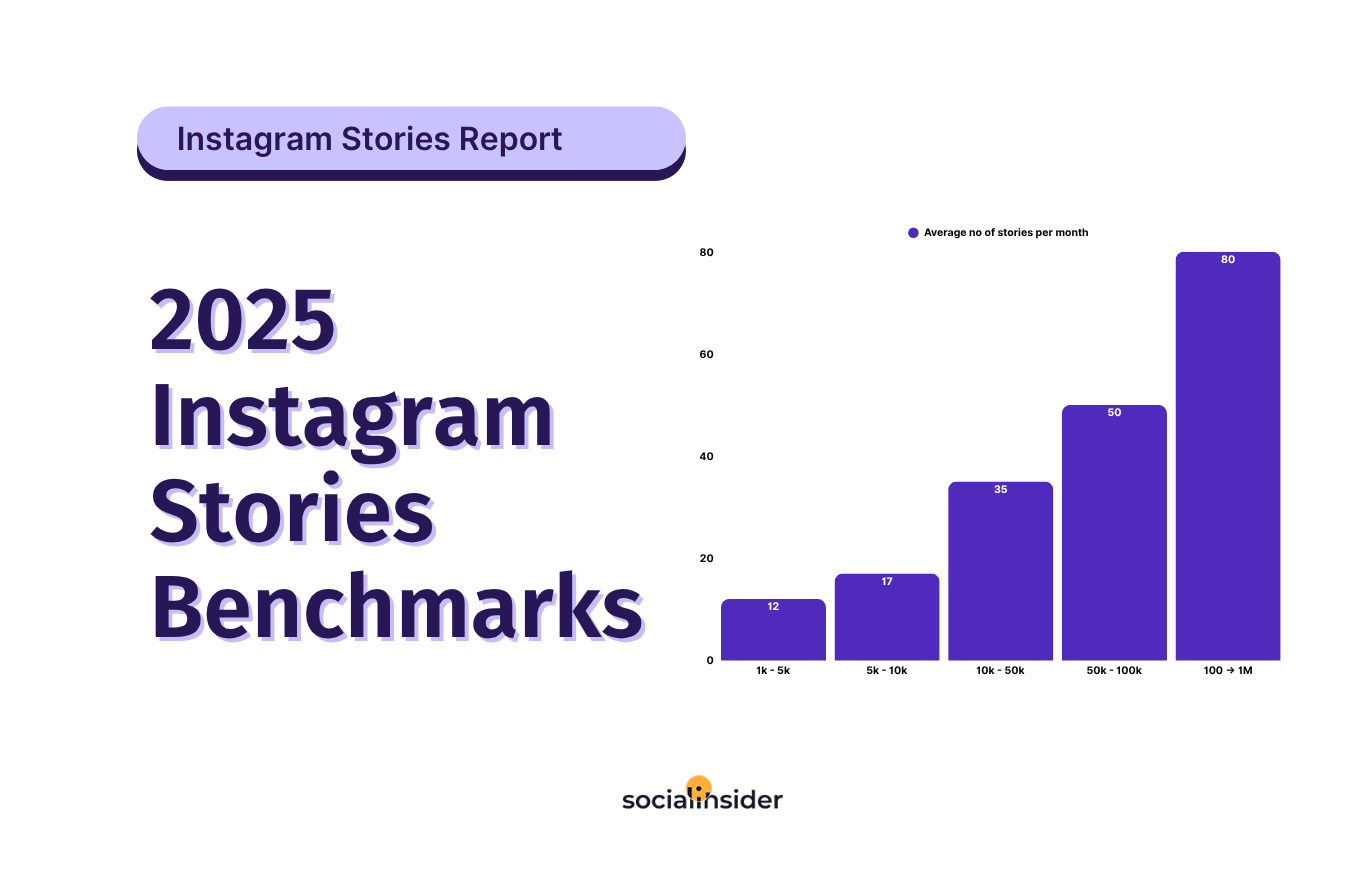
2025 Instagram Stories Benchmarks