Socialinsider Product Updates - September
New in September: The updates you never knew you needed 🙌

September was the month of small wins. Not the headline-grabbing feature launches, but the quiet improvements that make you think, "finally, someone fixed this."
This month, we tackled two things that fall into that category: in-depth reports for our free tools and proper number formatting throughout the platform. These updates won't make you gasp, but they will definitely make your workflow smoother. 🤩
Here's a look at what we accomplished this September. 🙌
1. Global Brand Benchmark Directory
This is an exciting project we've been developing for quite some time, and we believe you'll appreciate it as much as we do. We've compiled data from 6 markets across 12 industries.
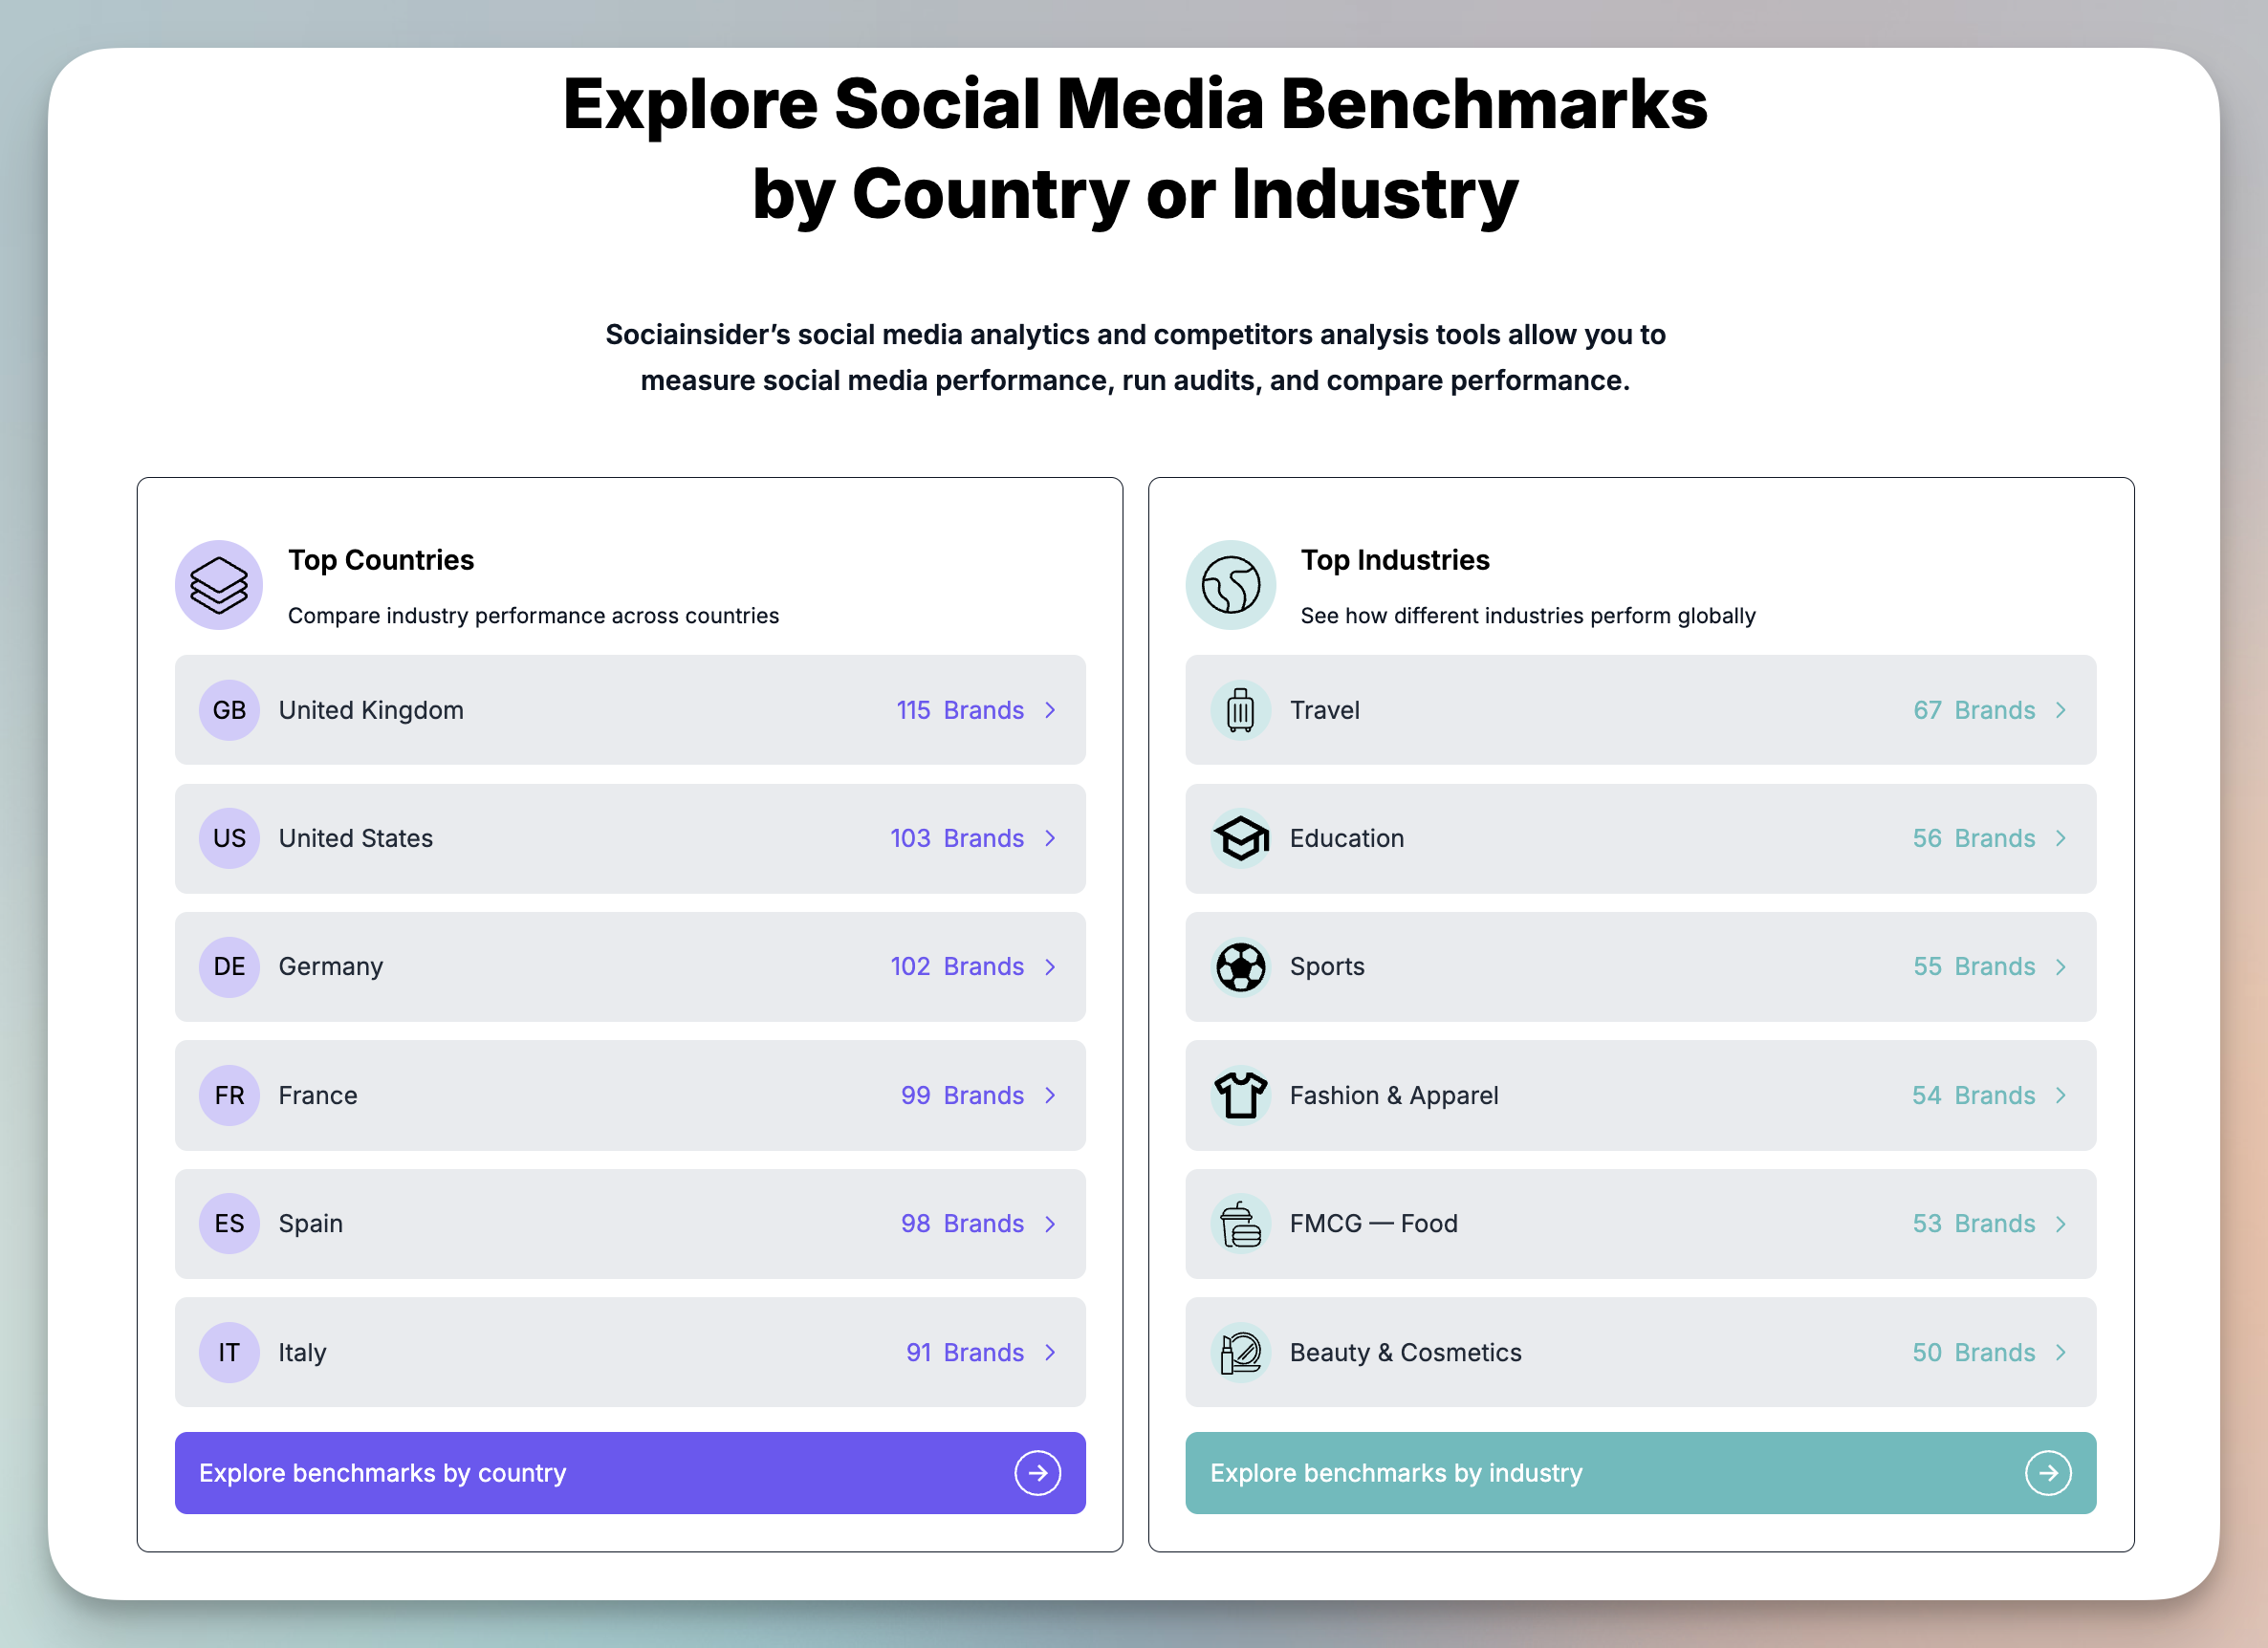
From our experience, social media benchmarking tends to be fragmented. Marketers need precise insights tailored to their specific requirements.
These resources provide comprehensive social media benchmark reports for brands spanning 12 industries and 6 countries.
Get more in-depth insights into each brand's performance metrics, audience engagement patterns, and content strategy effectiveness across different platforms.
These comprehensive analytics allow you to identify specific strengths and weaknesses within your industry competitors and understand what truly resonates with your target demographic.
Examine detailed social media benchmarks to evaluate your brand's position (by market, industry, or platform) and discover the strategies that set top-performing brands apart.
These reports cover the period from January through June 2025.
Check out the Global Brand Benchmarks Directory ✨
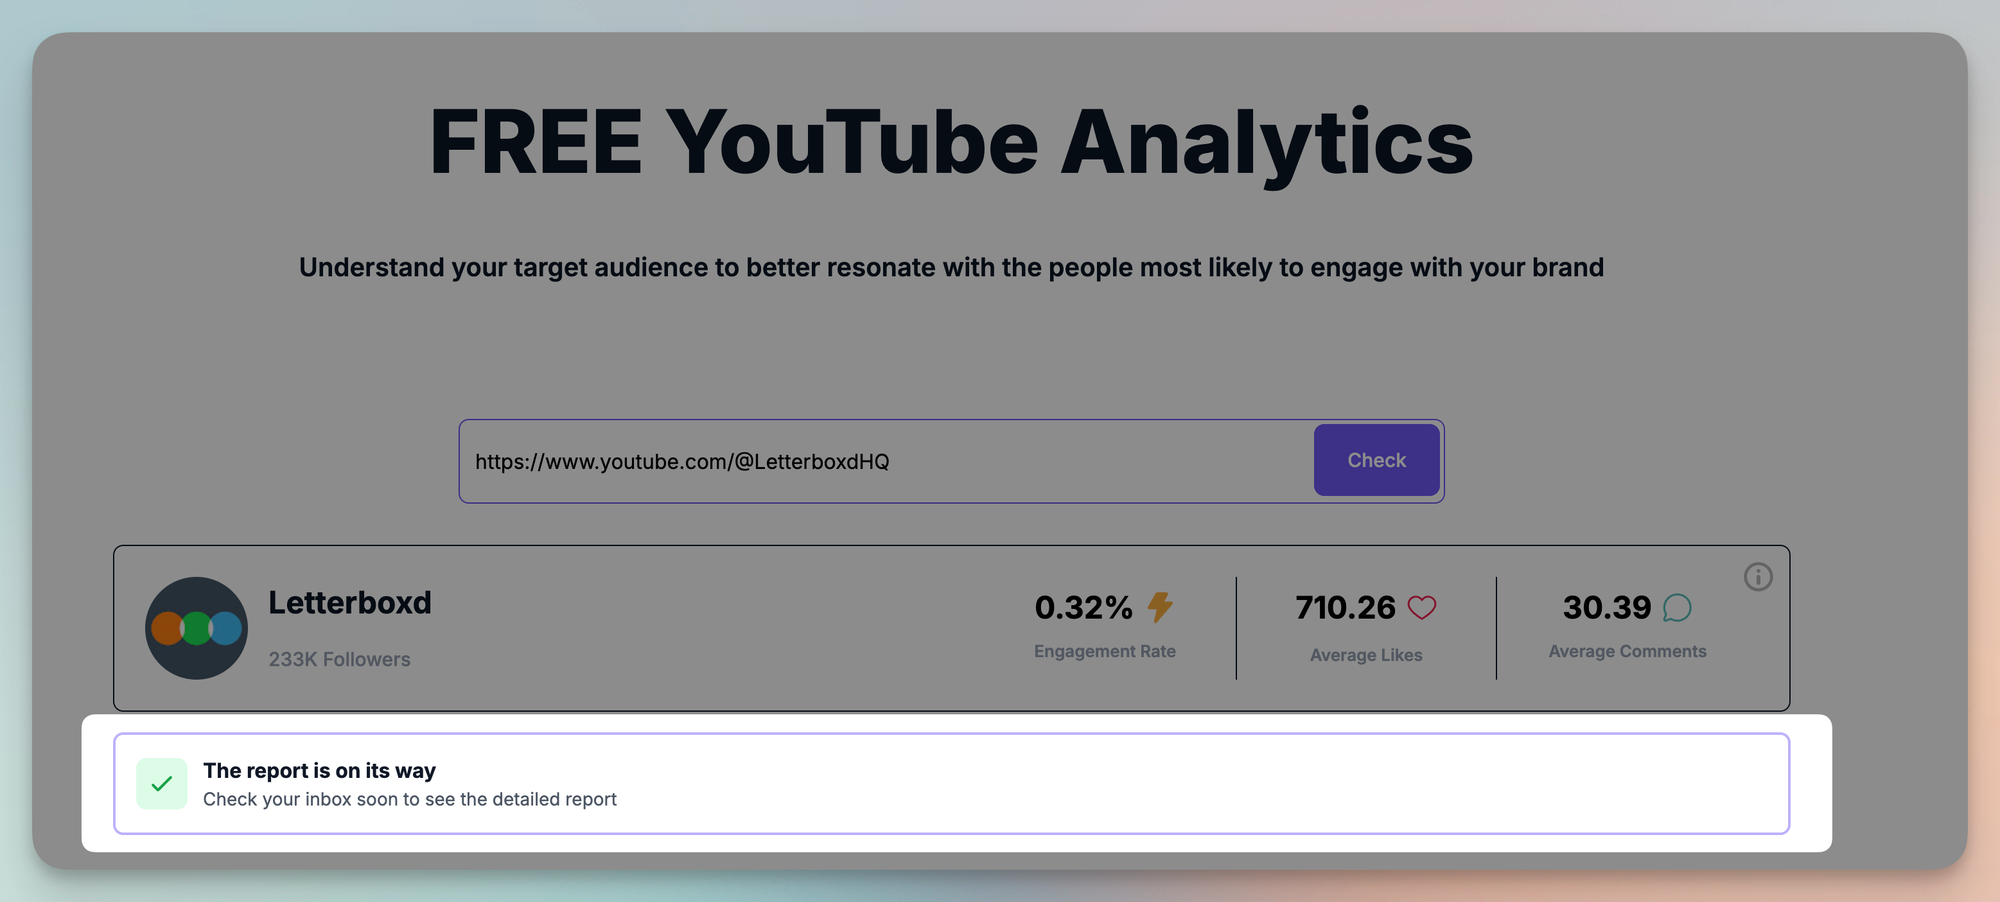
2. Free Tools Reports: Your Insights, Delivered
Love the free tools suite? Great news - they now provide reports delivered directly to you:
- In-depth reports from all our free tools categories: social media analysis tools, social media reporting tools, and social media video analysis tools
- Receive the report directly to your inbox
- Perfect for regular, quick reports
- Never miss important insights from your favorite free tools
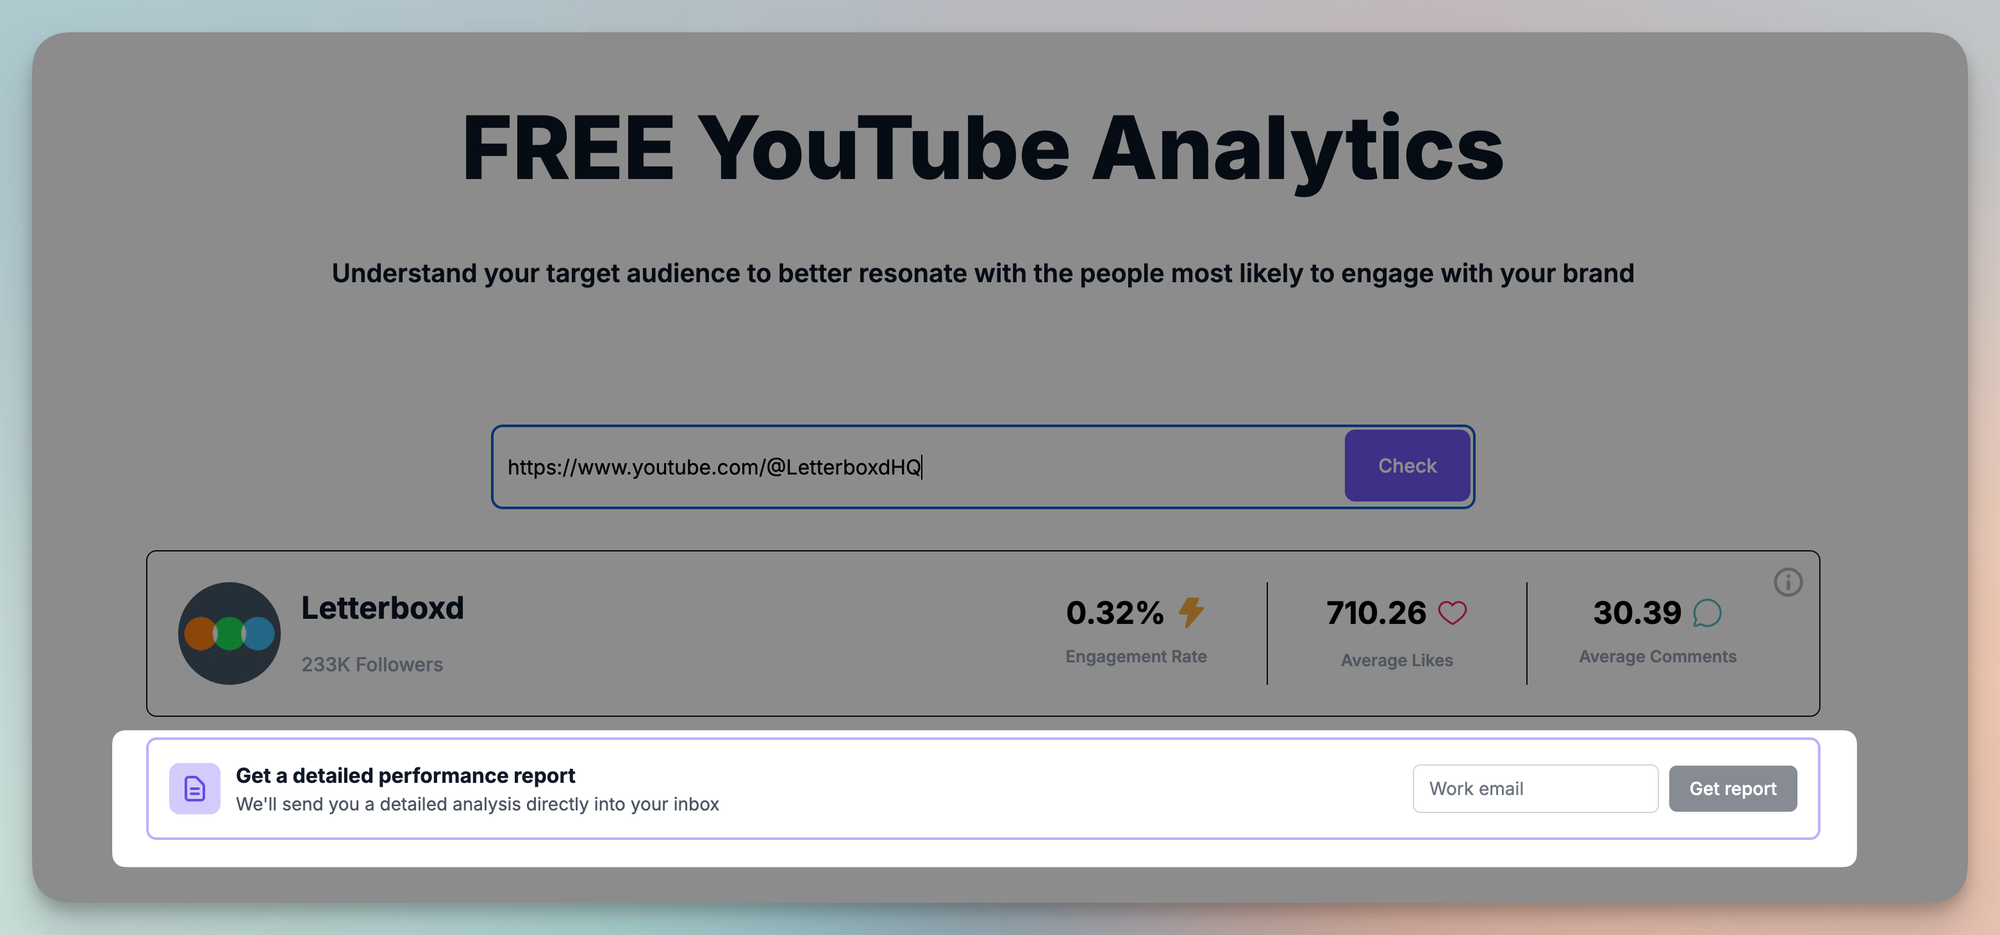
Simply add your email address, and we'll handle the rest - you'll receive a comprehensive PDF report delivered straight to your inbox.
Perfect for urgent analyses that require immediate insights! 🙌
Key insights available across all reports include:
- Executive Summary - the story behind the numbers
- engagement rate insights
- video views insights
- top posts
- audience insights
- glossary
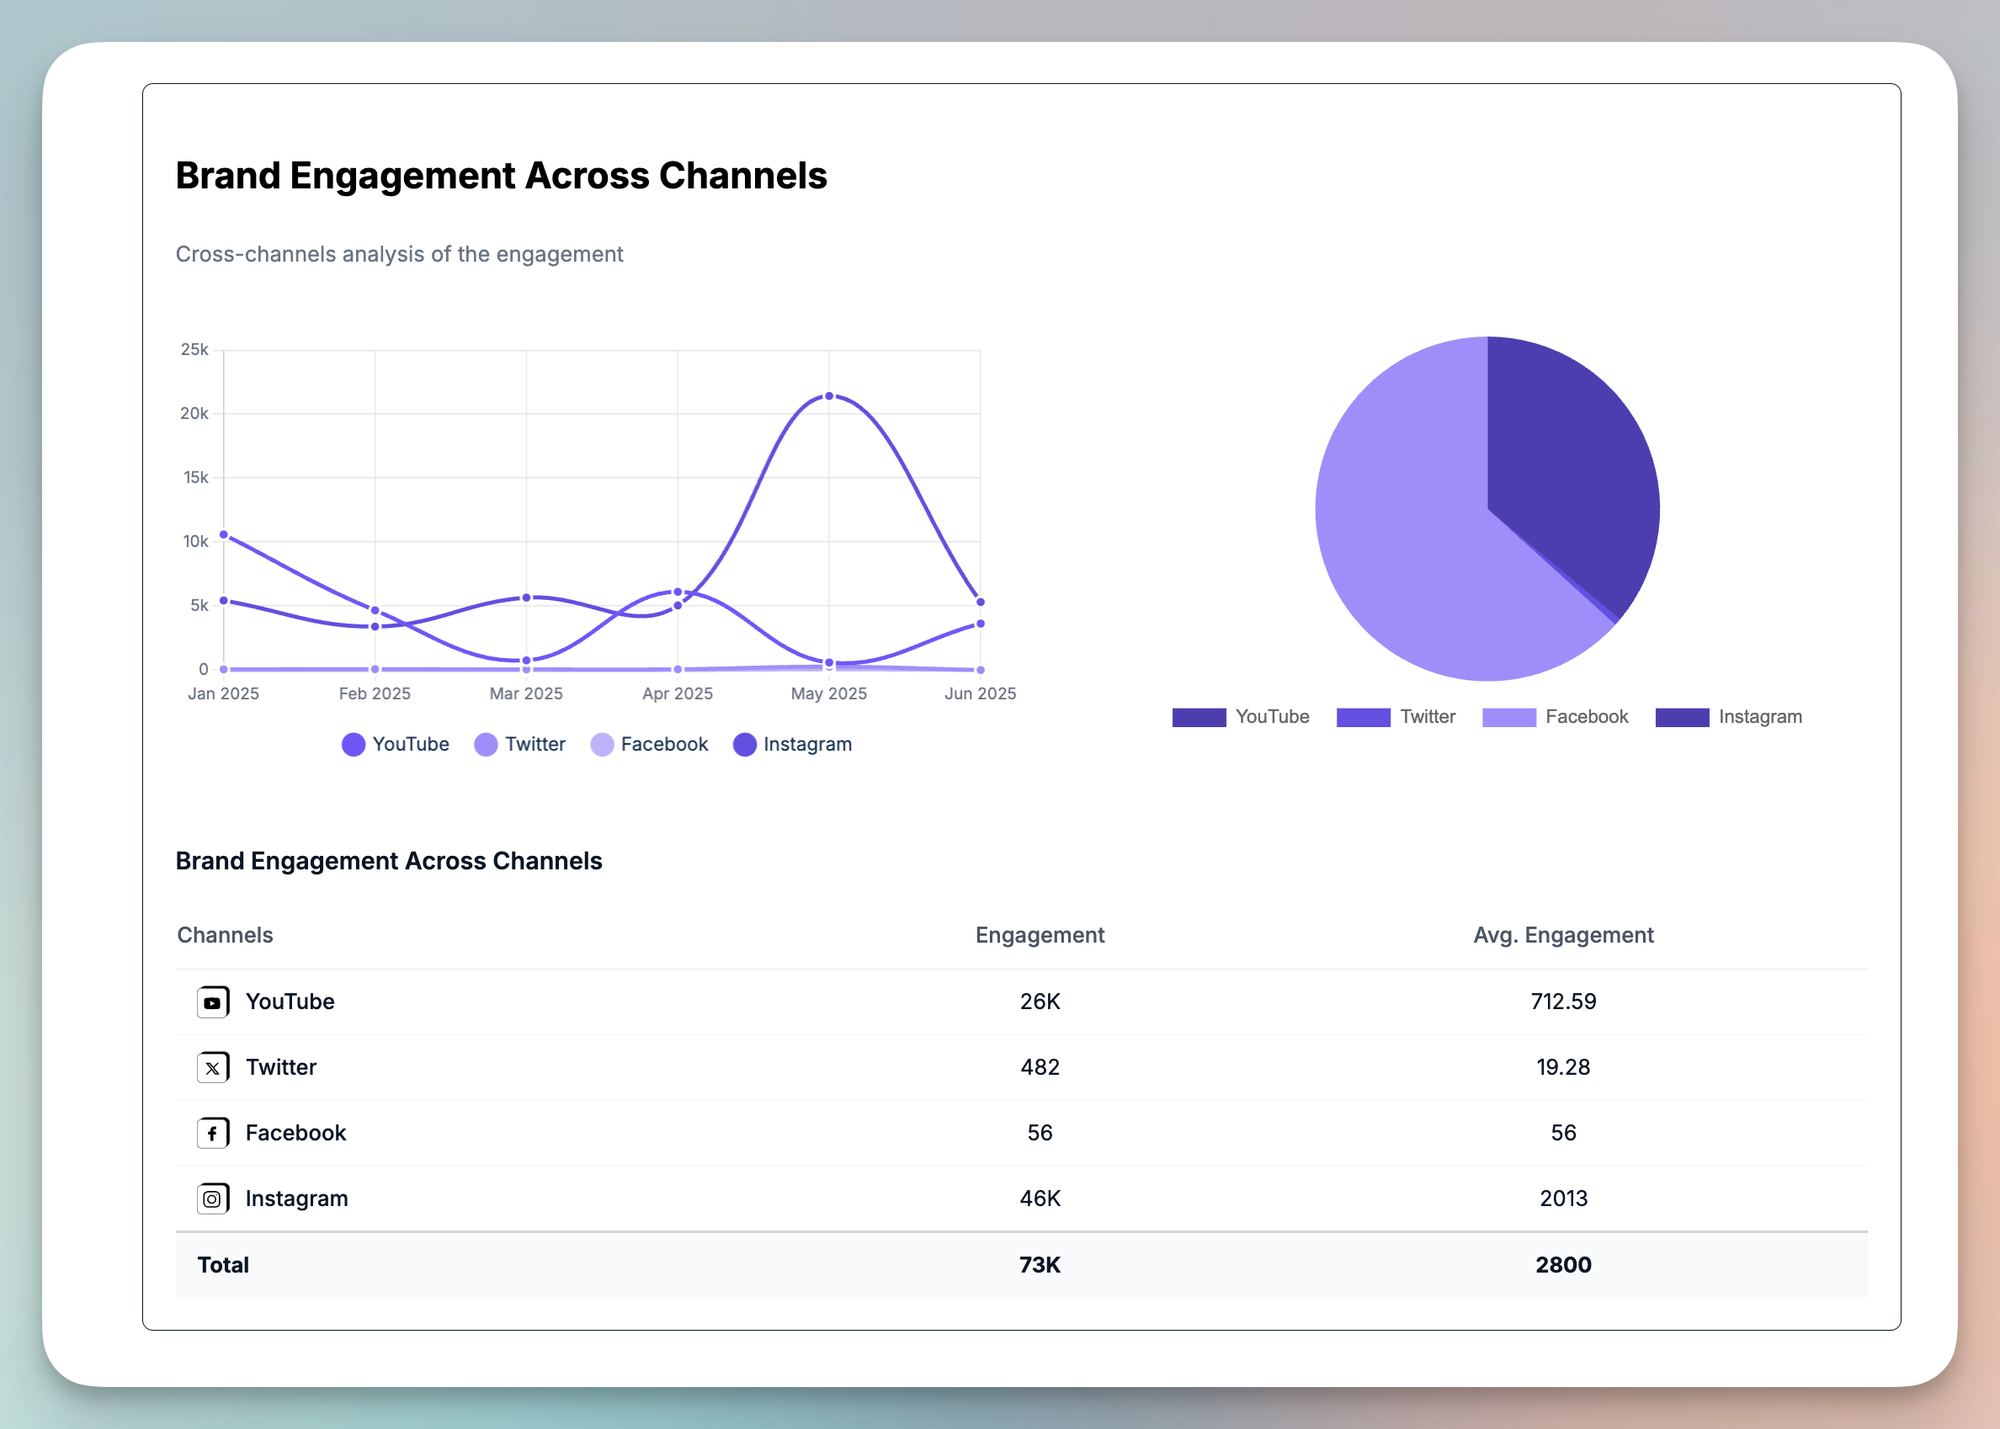
3. Number Formatting: Aligned and Readable
We've standardized number formatting across the entire app to match your regional expectations:
- Proper decimal and thousand separators (. and ,) throughout the platform
- Consistent formatting across all dashboards and reports
- Numbers that read naturally based on your location settings
- No more confusion when sharing data internationally
- Cleaner, more professional-looking reports
Here's a more visual example from the dashboard - this is a clear example of how commas are used for thousands and dots for decimals👇
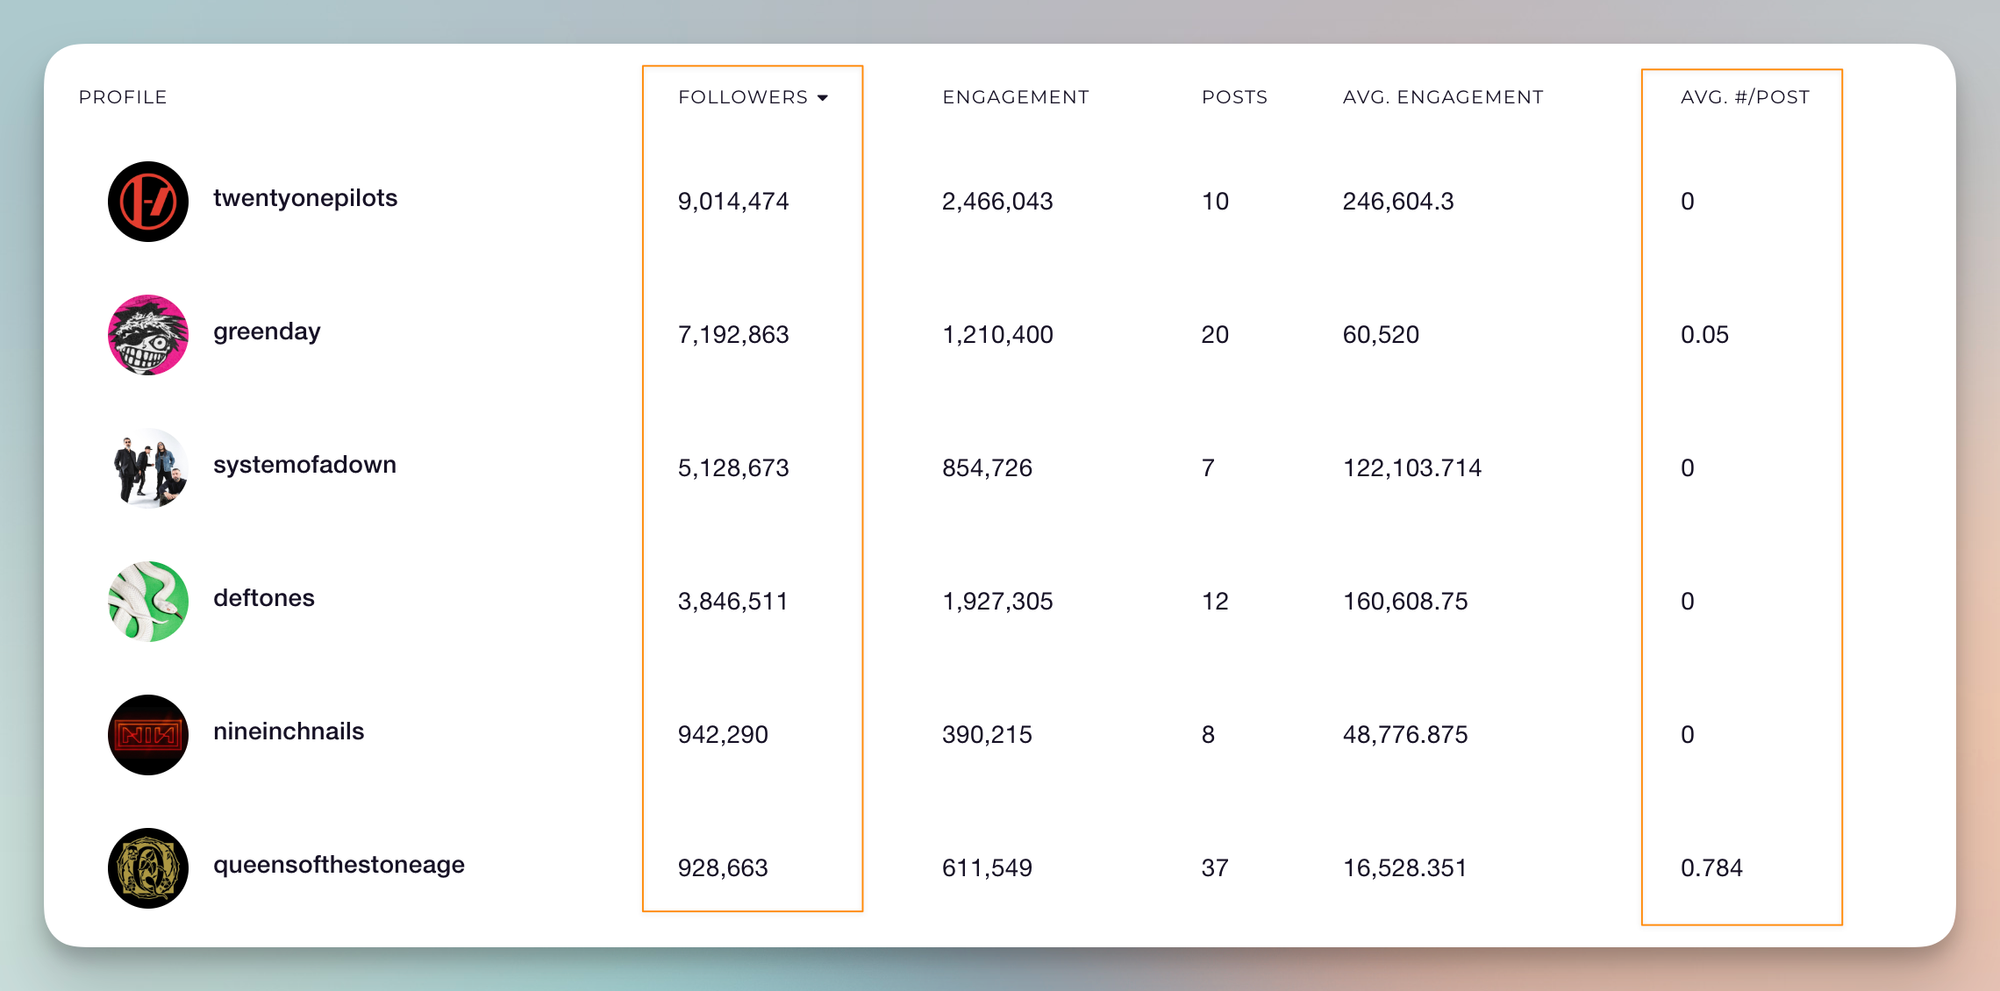
Note: This number formatting, however, adapts to your laptop's language settings.
In other words, here's something important to know:
In the US and other English-speaking places, we use commas for thousands (1,000,000) and dots for decimals (3.14). However, in many European countries, the opposite is true, where dots are used for thousands and commas for decimals (1.000.000,00).
Neither way is wrong - it's just important to be consistent and consider who's reading your numbers. That's why our update ensures everyone sees numbers in the format they're accustomed to.
Product Improvements 🚀
We're preparing for Meta's upcoming deprecation of Impressions in November. Consider this your friendly reminder to be aware of this change:
Beginning November 15, 2025, we’re deprecating the ‘impressions’ and ‘page fans’ metrics from the Page Insights API. This is in line with our continued efforts to align the functionality of the Page Insights API with that of the Facebook app and Meta Business Suite.
No immediate action is required, especially if you're already using Views as your primary metric instead of Impressions.
These changes will also be reflected in your dashboard in November.
Diana Gogolan
Product Manager @ Socialinsider. Designing, Building, Testing, Releasing - from idea to successful feature. Passionate about telling stories that take different forms and shapes.

Analyze your competitors in seconds
Track & analyze your competitors and get top social media metrics and more!
You might also like
Socialinsider Product Updates - February
Diana Gogolan
Mar 01, 2026
The little things that make your life better
Socialinsider Product Updates - January
Diana Gogolan
Feb 02, 2026
The Benchmarks study is finally here 🎉
Socialinsider Product Updates - November
Diana Gogolan
Dec 01, 2025
Facebook Views are here to stay 👀
Improve your social media strategy with Socialinsider!
Use in-depth data to measure your social accounts’ performance, analyze competitors, and gain insights to improve your strategy.