Socialinsider Product Updates - February
The little things that make your life better

February came with the kind of improvements that are easy to overlook until you notice how much faster your work gets.
This month, we focused on reducing friction in reporting: clearer metric context, sorting you can trust, and fewer dashboard “translation” moments when platforms rename things.
1. Contextual How‑To Guides (right where you need them)
You can now access contextual How‑To guides directly in the dashboard, including:
- Instagram Views (what changed, how to interpret it, how to report it)
- Facebook Views (what it means vs. the old Impressions language)
- Query Builder (practical guidance for Content Pillars rules)
Here's an example from the Instagram Views section 👇
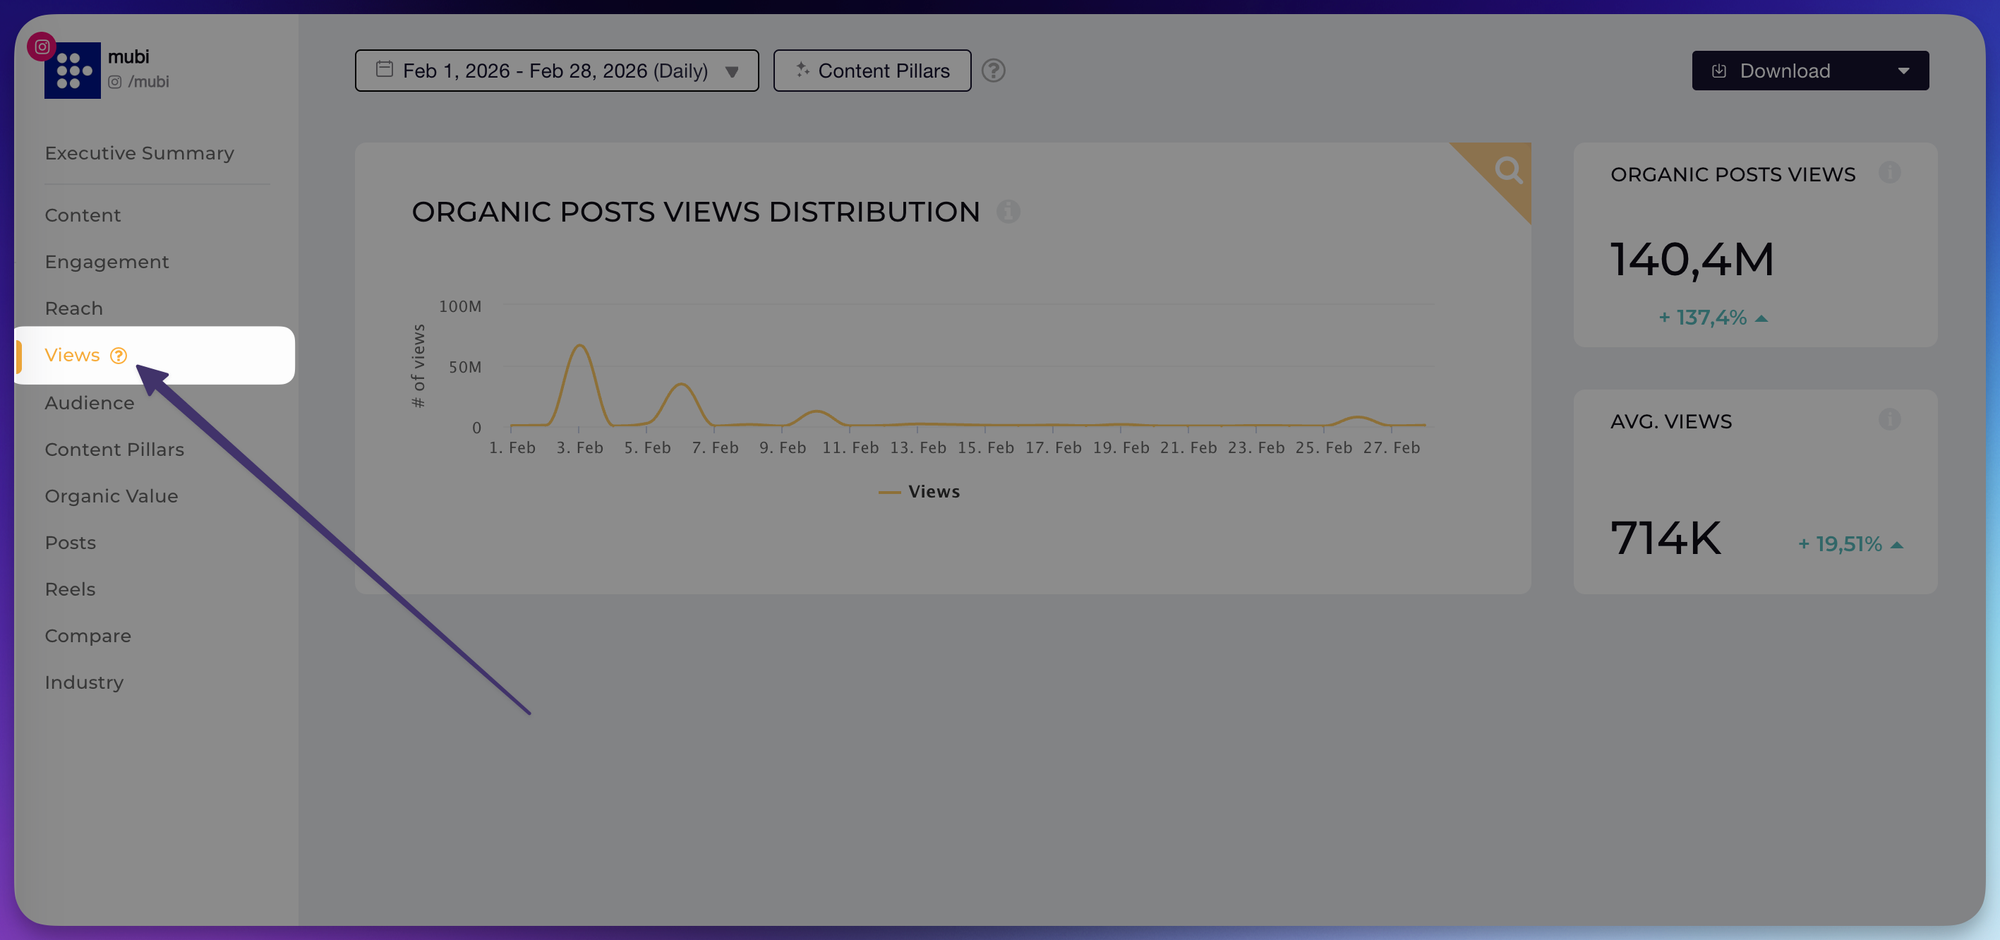
The icon will open the guide 👇
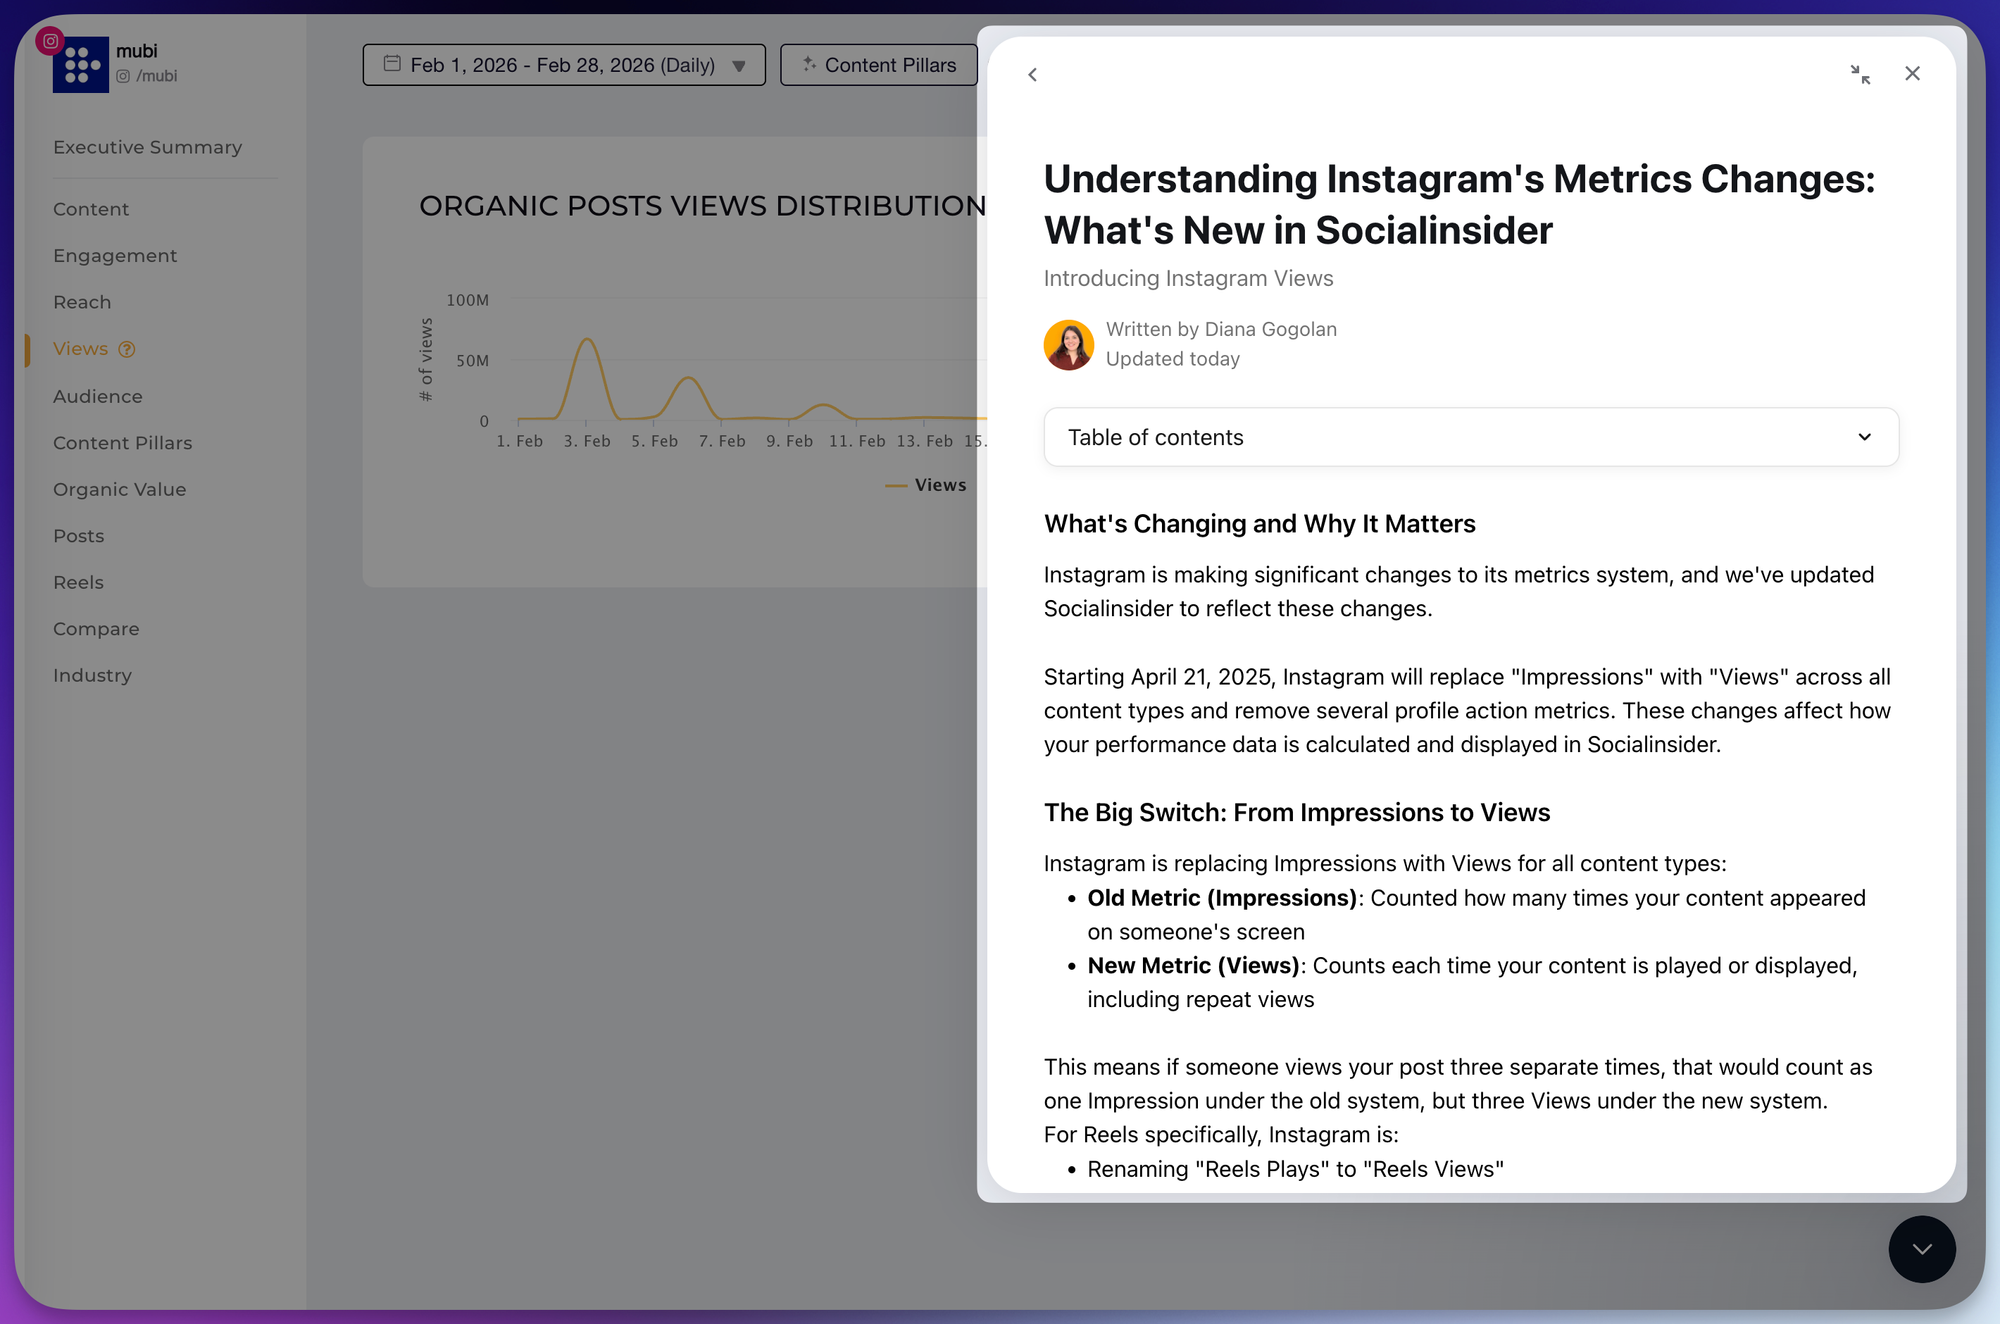
Instead of pausing your work to search docs (or second-guess a metric rename), the guidance now lives next to the charts and tables you’re already using.
It’s designed for the moment you’re building a report and need a confident explanation, fast.
2. Sorting Options (Views + Estimated Views)
You can now sort Instagram posts by Views and Estimated Views and get accurate results.
→ What’s improved:
- Sorting is consistent across the table view, exports, and post-level numbers
- It’s easier to find top-performing content during video-heavy periods
If you’ve ever looked at a “top posts” list and thought “this feels… wrong,” this one’s for you.
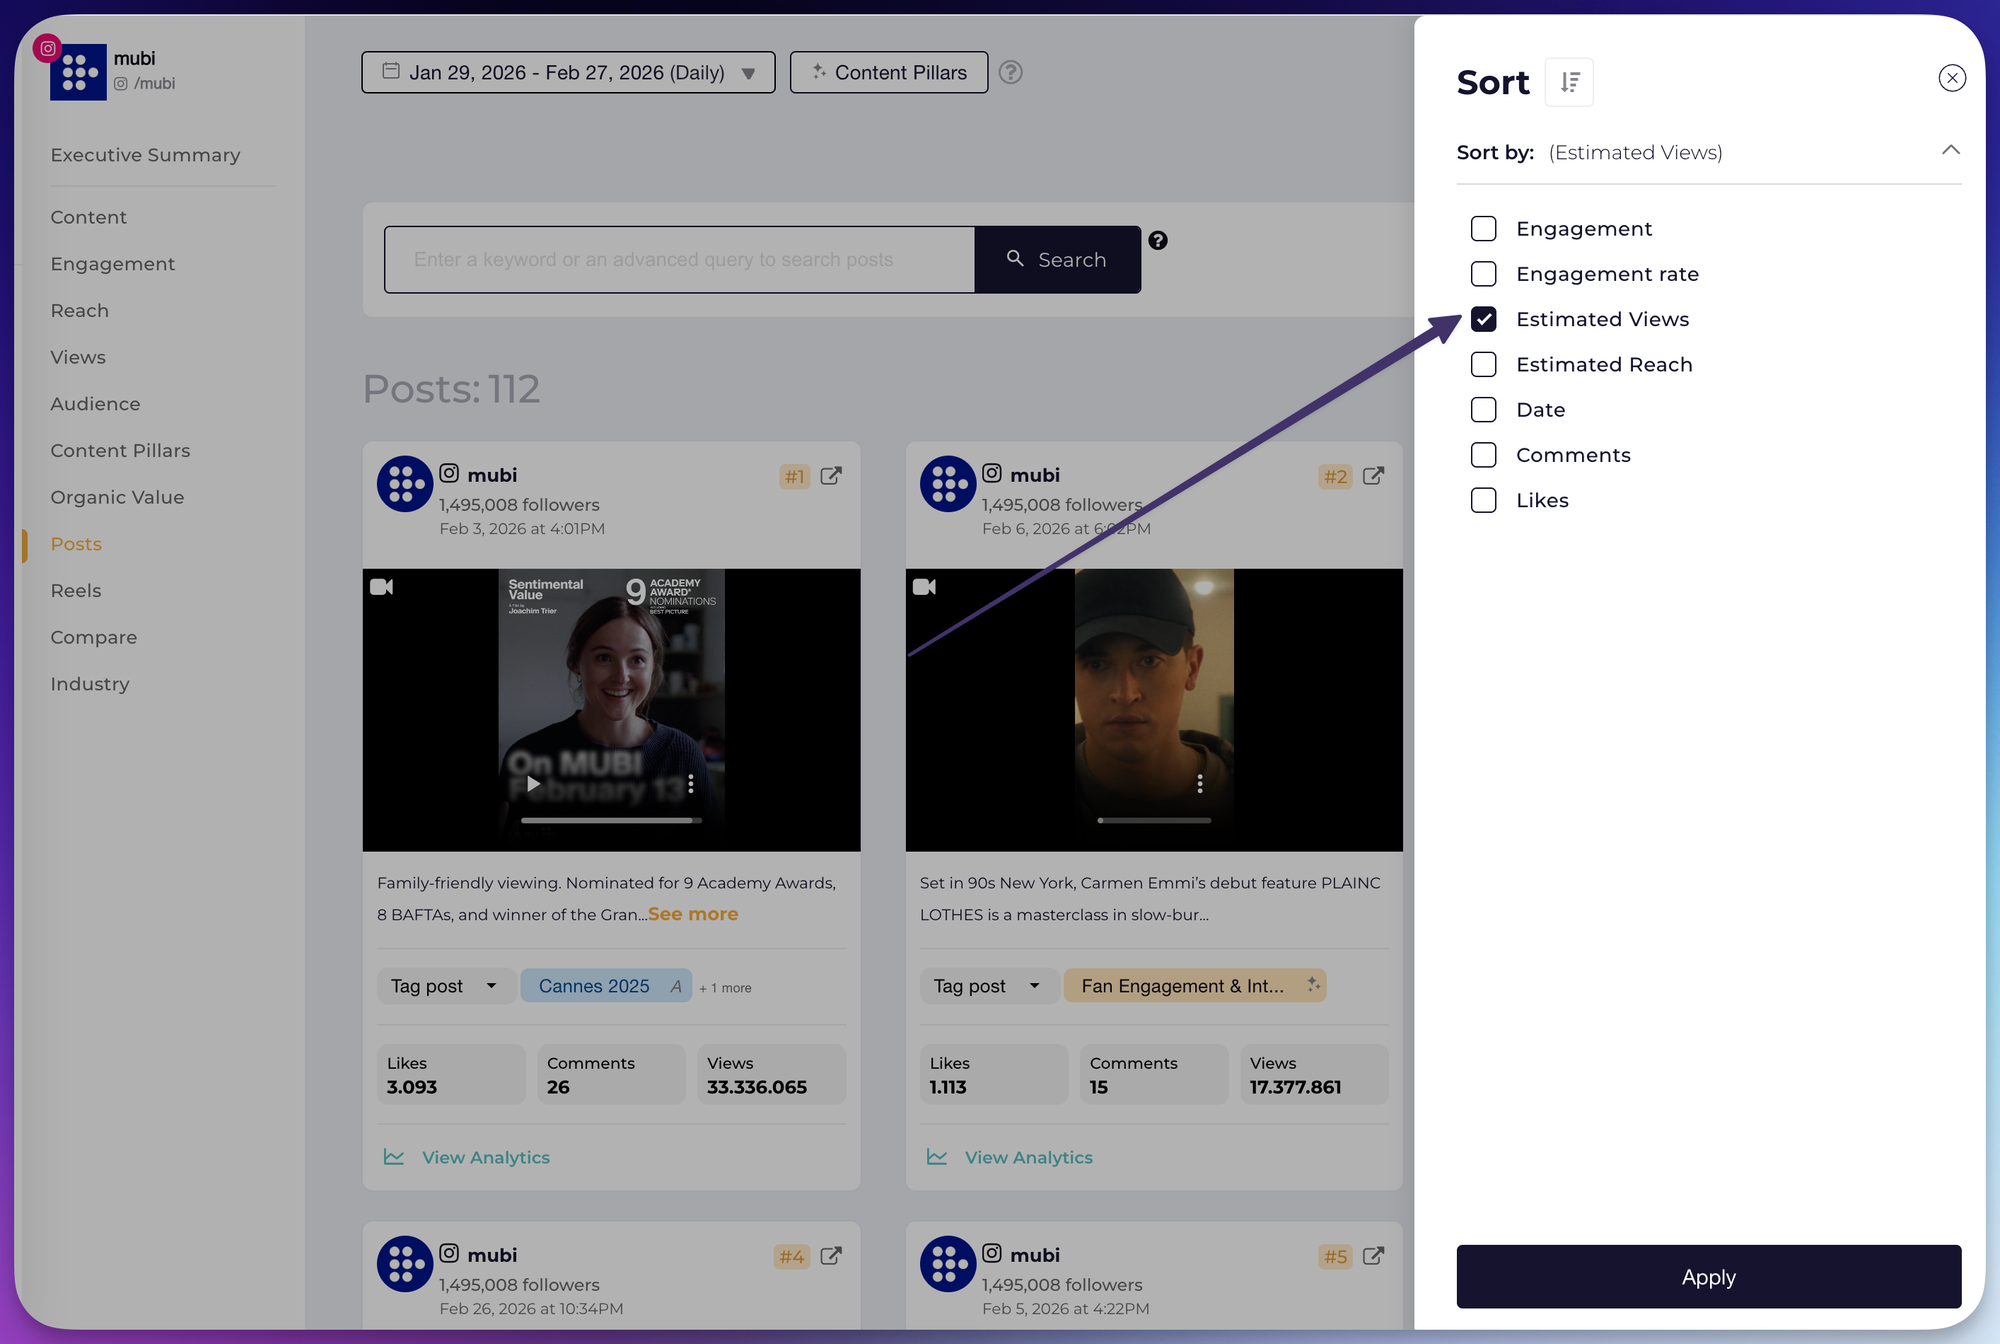
In other words, sorting now behaves consistently across the table, exports, and post-level numbers, so you can trust what you’re sharing.
- Best for: video-heavy periods, Reels reporting
- Outcome: faster analysis, fewer manual checks
3. Looker Studio Improvements
We made a few small improvements to our Looker Studio setup to make reporting smoother and more consistent, including alignment with the updated Views language (including Facebook).
Small change, big difference when you’re building dashboards you need to explain quickly.
- Outcome: fewer naming mismatches
- Benefit: smoother stakeholder conversations
Diana Gogolan
Product Manager @ Socialinsider. Designing, Building, Testing, Releasing - from idea to successful feature. Passionate about telling stories that take different forms and shapes.

Know what your competitors do — before your manager asks
Get instant social benchmarks & reports without manual work.
You might also like
Your data just entered the AI chat 🚀

Enemies to lovers, but it’s between me and Meta