2026 Social Media Benchmarks
These social media benchmarks for 2026 will help you empower your strategy. See how your brand stacks up against industry standards.

If I were to ask where your brand feels most “seen” online, would you pick TikTok? Instagram? Facebook or X? Maybe all of them—depending on what you’re hoping to spark with your latest post.
Let’s be real: audiences are moving faster than ever, and sometimes all you get is a scroll, a silent view, or the occasional quick “like.” On other days, your community comes alive, commenting, sharing, or even starting a conversation that takes on a life of its own.
With platform habits and algorithms always changing, it can be tough to know what real engagement actually looks like anymore.
That’s why we analyzed 70M social media posts across TikTok, Instagram, Facebook, and X, to understand the future of social media, audience interactions, and how brands can better prepare their strategies for 2026.
This Socialinsider 2026 social media benchmarks report analyzes engagement rates, impressions, likes, comments, shares, and posting frequency benchmarks across Facebook, Instagram, TikTok, and X (formerly Twitter).
By understanding these trends, brands can identify opportunities, optimize their content strategies, and enhance their social media return on investment (ROI).
Executive summary
- In 2026, TikTok’s engagement rate by followers stands at an average of 2.60%, registering a 10% YoY decrease.
- Facebook averaged 0.15% engagement, dipping in early 2025 and declining gradually afterward.
- Average comments per post fell on TikTok (24%) and Instagram (16%), suggesting a shift toward more passive engagement.
- TikTok recorded notable growth in shares per post, increasing by 45% YoY, mirroring the upward trend in overall engagement. As for Instagram, it registered a 12% increase.
- Both TikTok and Instagram experienced an increase in video views. TikTok had a 3% growth rate, while Instagram had a more pronounced 29% YoY growth rate.
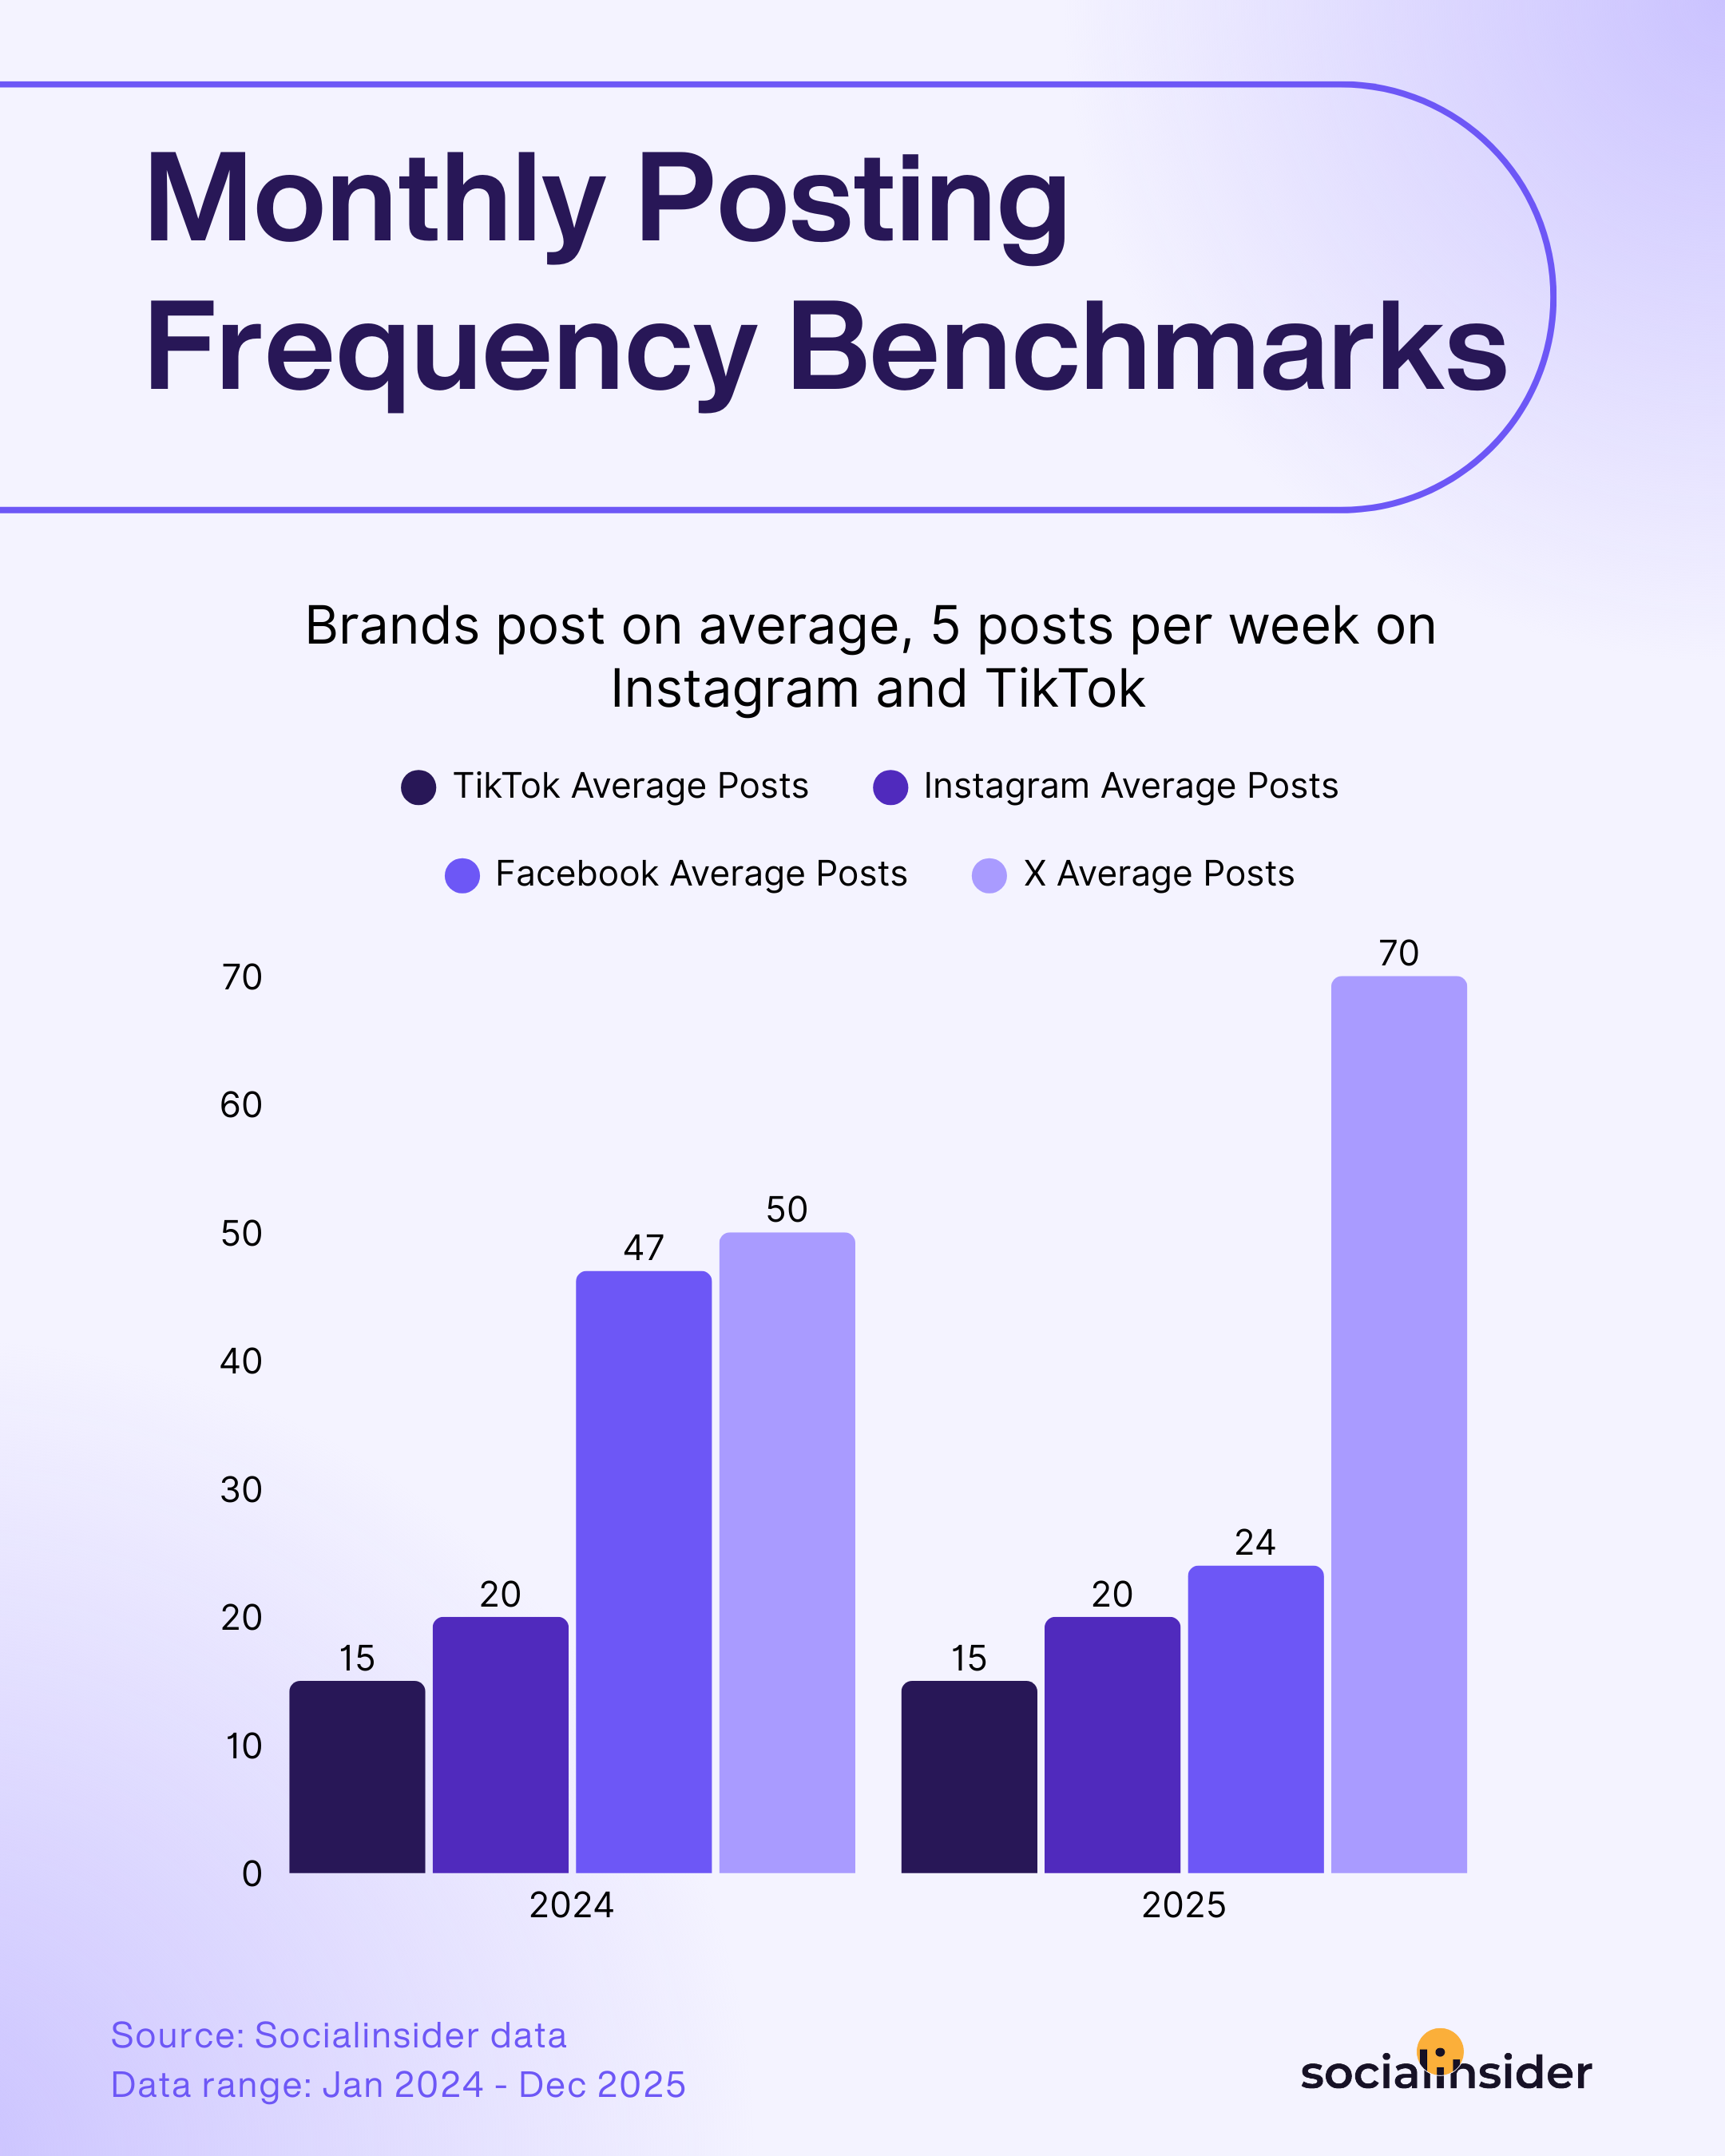
- Brands post an average of 5 posts per week on Instagram and TikTok.
Social media quarterly benchmarks
Over the past few years, I've consistently seen engagement rates decline across most social media platforms. As feeds become more crowded and brands publish more content than ever before, capturing audience attention, and more importantly, interaction, has become increasingly difficult.
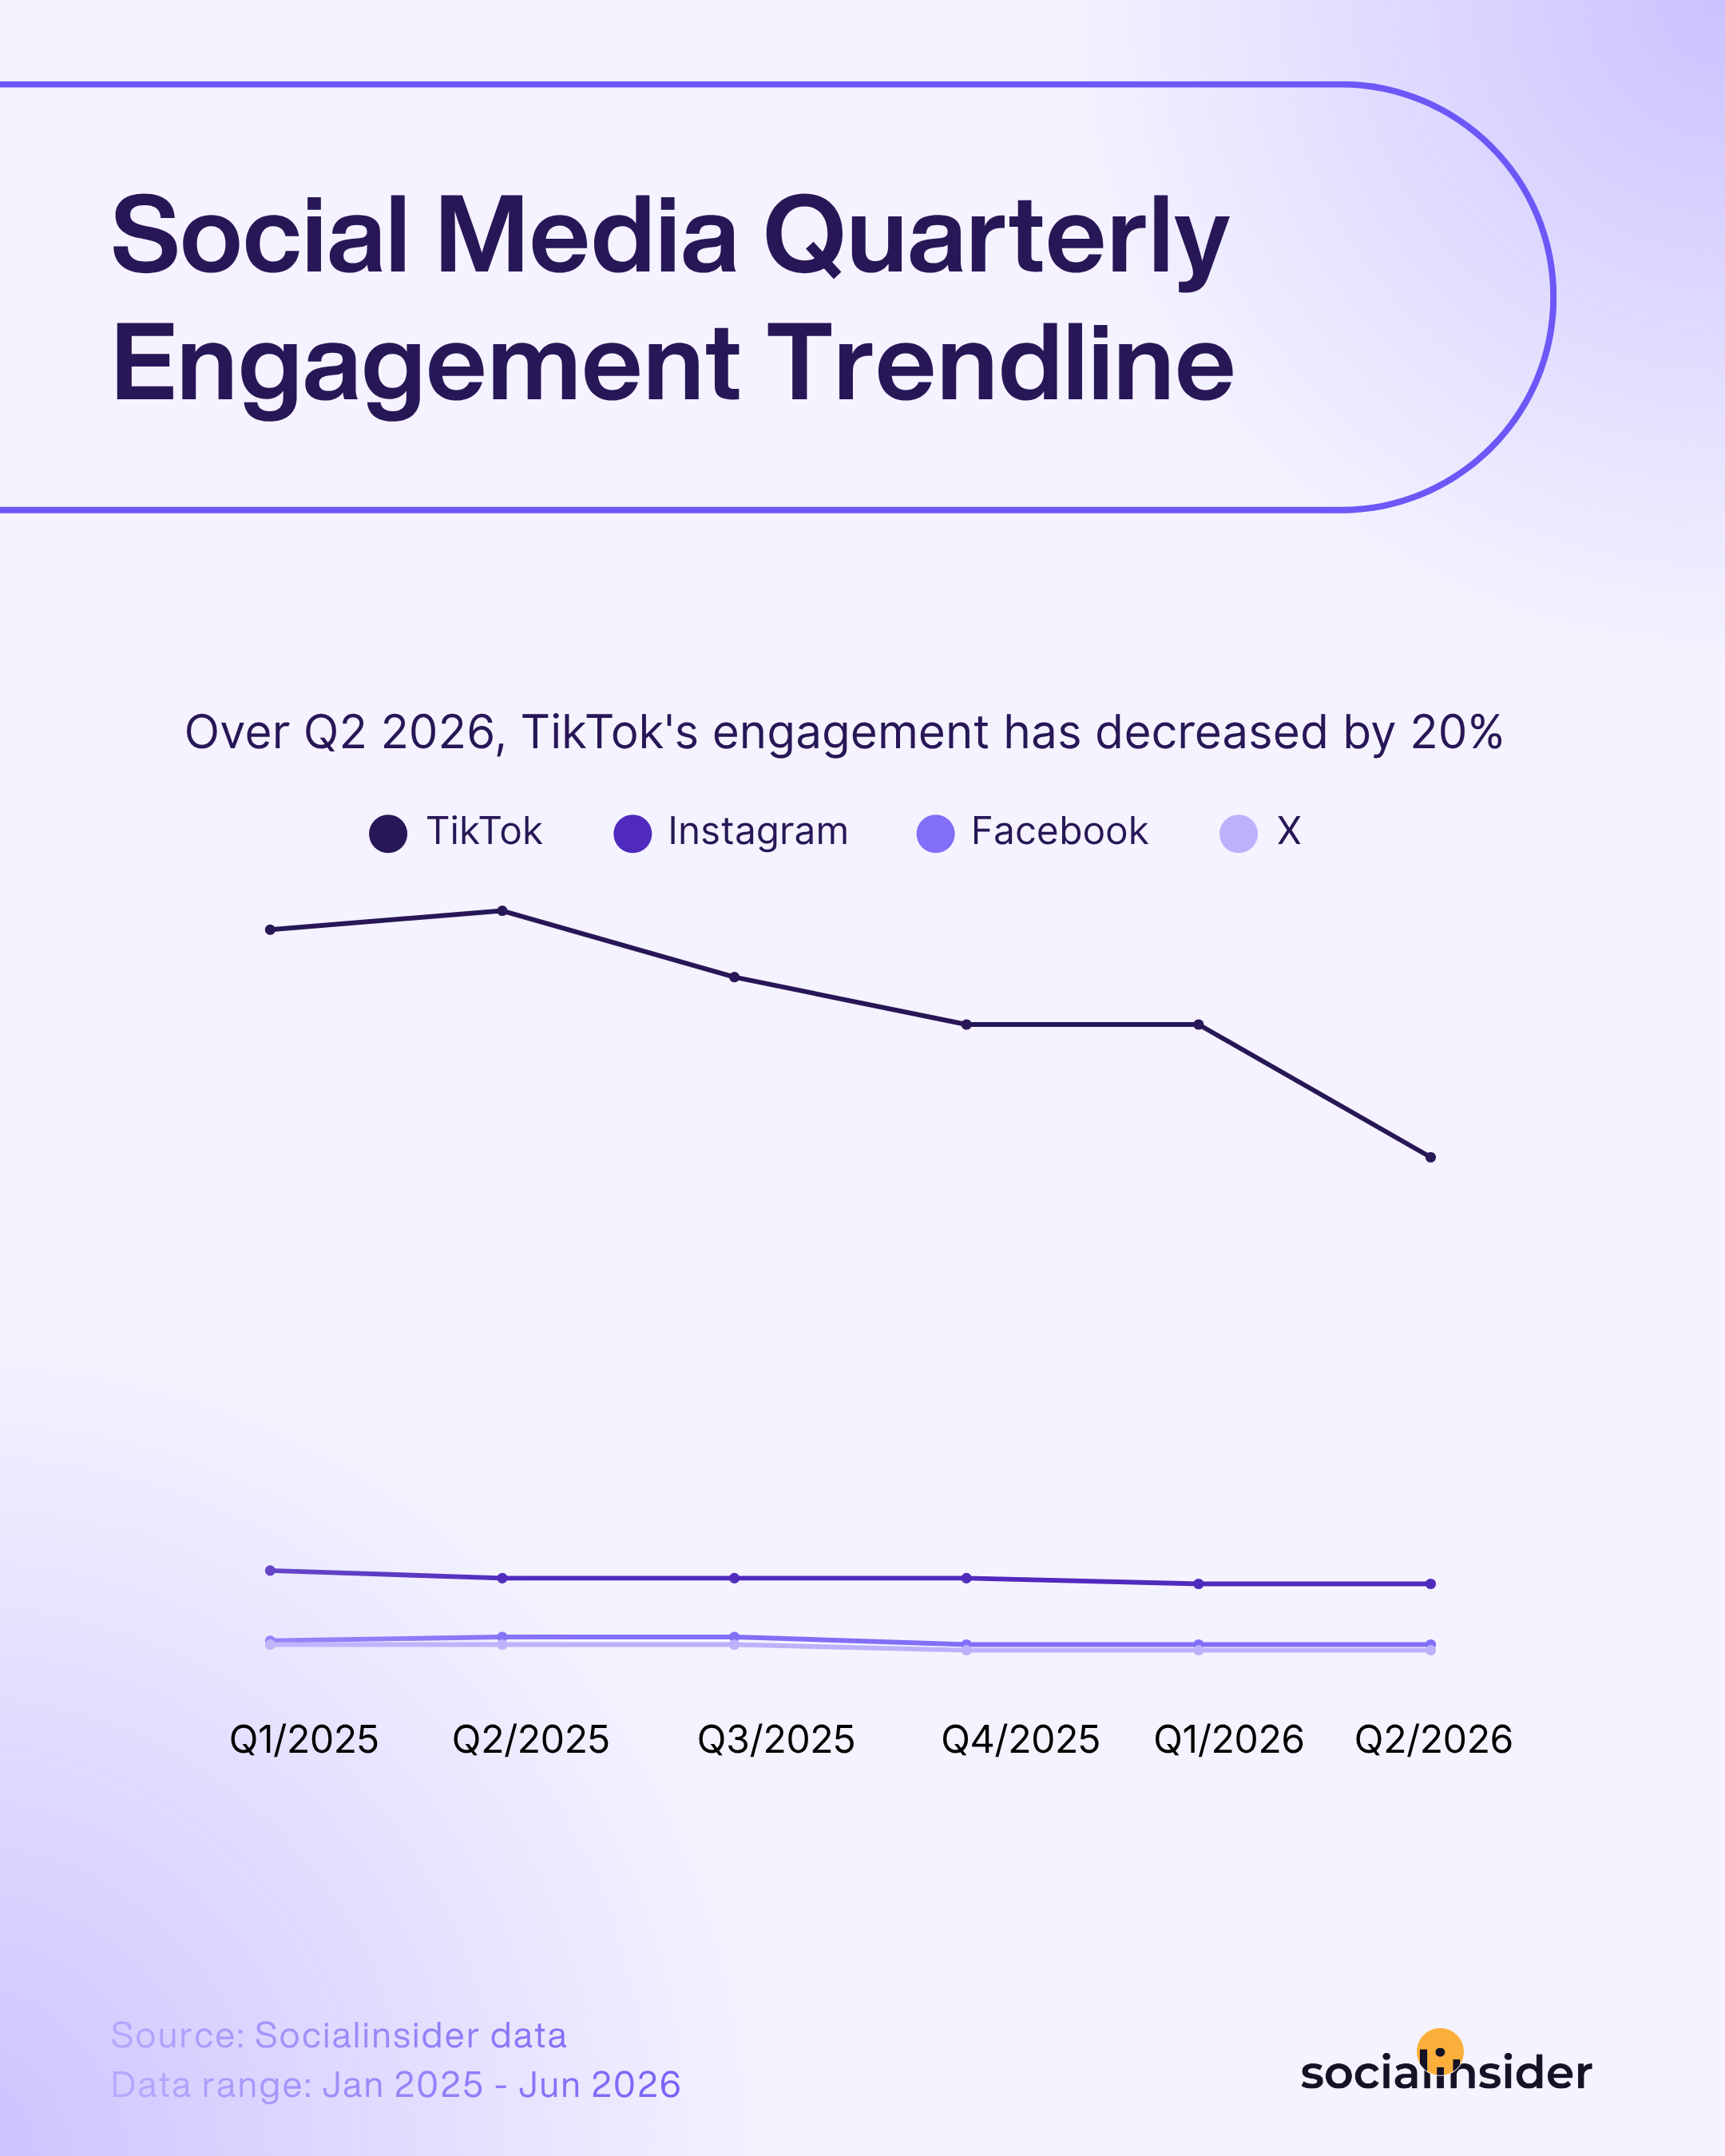
According to Socialinsider's data, half-year through 2026, TikTok's engagement rate dropped by 20%, entering a more pronounced decreasing phase, compared to the last two quarters. And here's how it compares to the other platforms:
- TikTok: With an average engagement rate by followers of 2.70%, TikTok now registered its lowest values in the last year and a half.
- Instagram: The platform remains on a slightly decreasing engagement path, dipping from 0.52% in Q1 2025 to 0.45% in Q1 and Q2 2026.
- Facebook: Facebook ticked up to 0.17% through the middle of 2025 before settling back down to 0.13% by Q4 2025, where it's remained flat through Q2 2026.
- X: X continued to post the lowest engagement rates among the analyzed platforms, dipping from 0.13% in early 2025 to 0.10%, where it has stayed flat since Q4 2025.
Social media benchmarks 2026 by platform
Each year, the landscape of social media engagement evolves—driven by shifting user behavior, algorithm changes, and brands’ creative strategies.
As we step into 2026, keeping up to date with the latest social media benchmarks becomes more crucial than ever for marketers wanting to set informed goals, outperform competitors, or report on campaign success. Because, as we all know, engagement benchmarks digging is so much more than finding and putting a pin on a number - it’s about context, clarity, and the confidence to know you’re putting your effort in the right place.
Whether you’re aiming to improve your TikTok performance, curious about the average engagement rate on Facebook, or looking for that sweet spot on Instagram, understanding these social media engagement benchmarks will help you set realistic targets (and brag a bit about your wins).
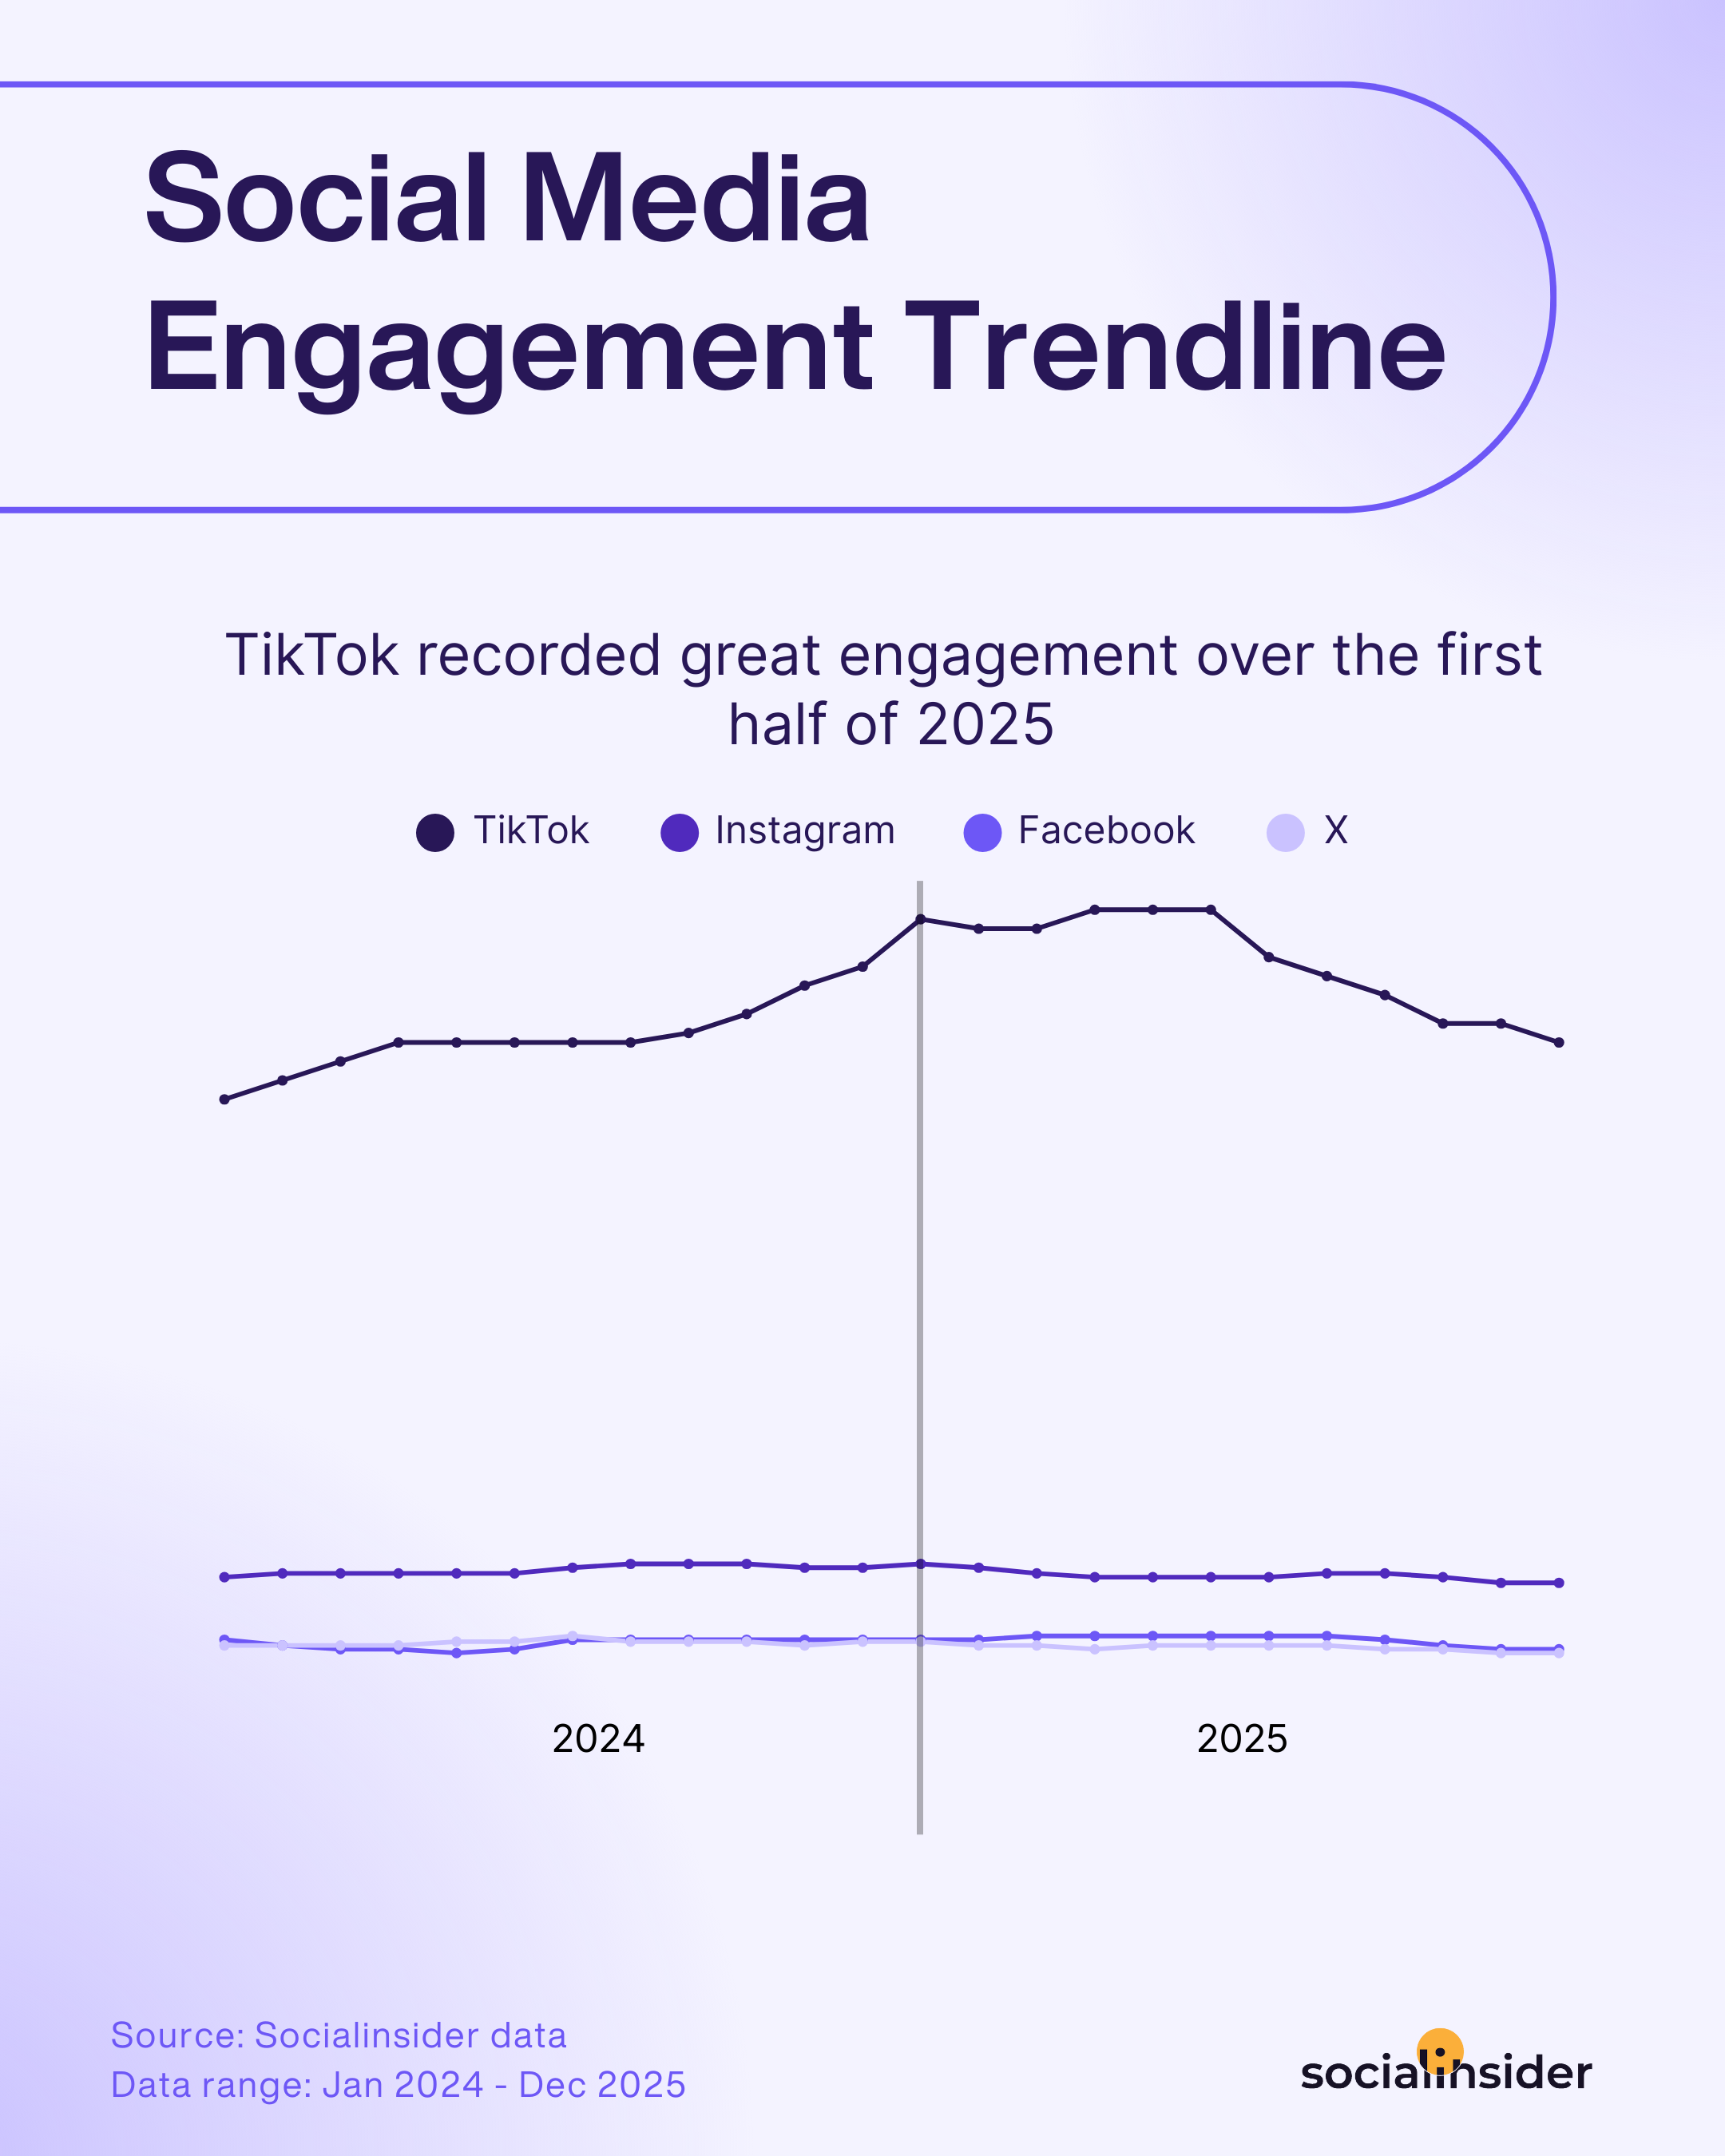
So, how did engagement shift in over the past year across the biggest platforms? Let’s break it down:
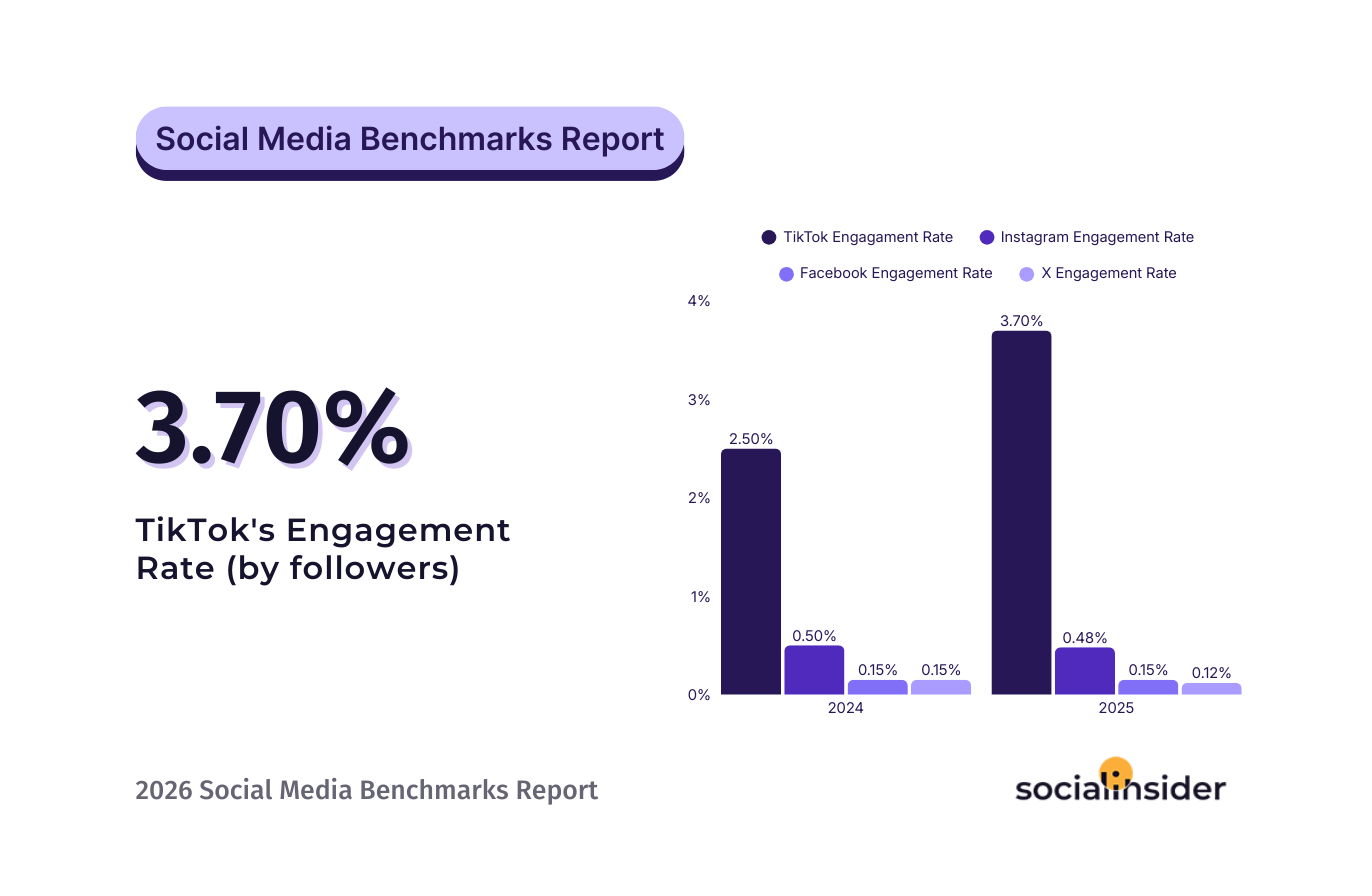
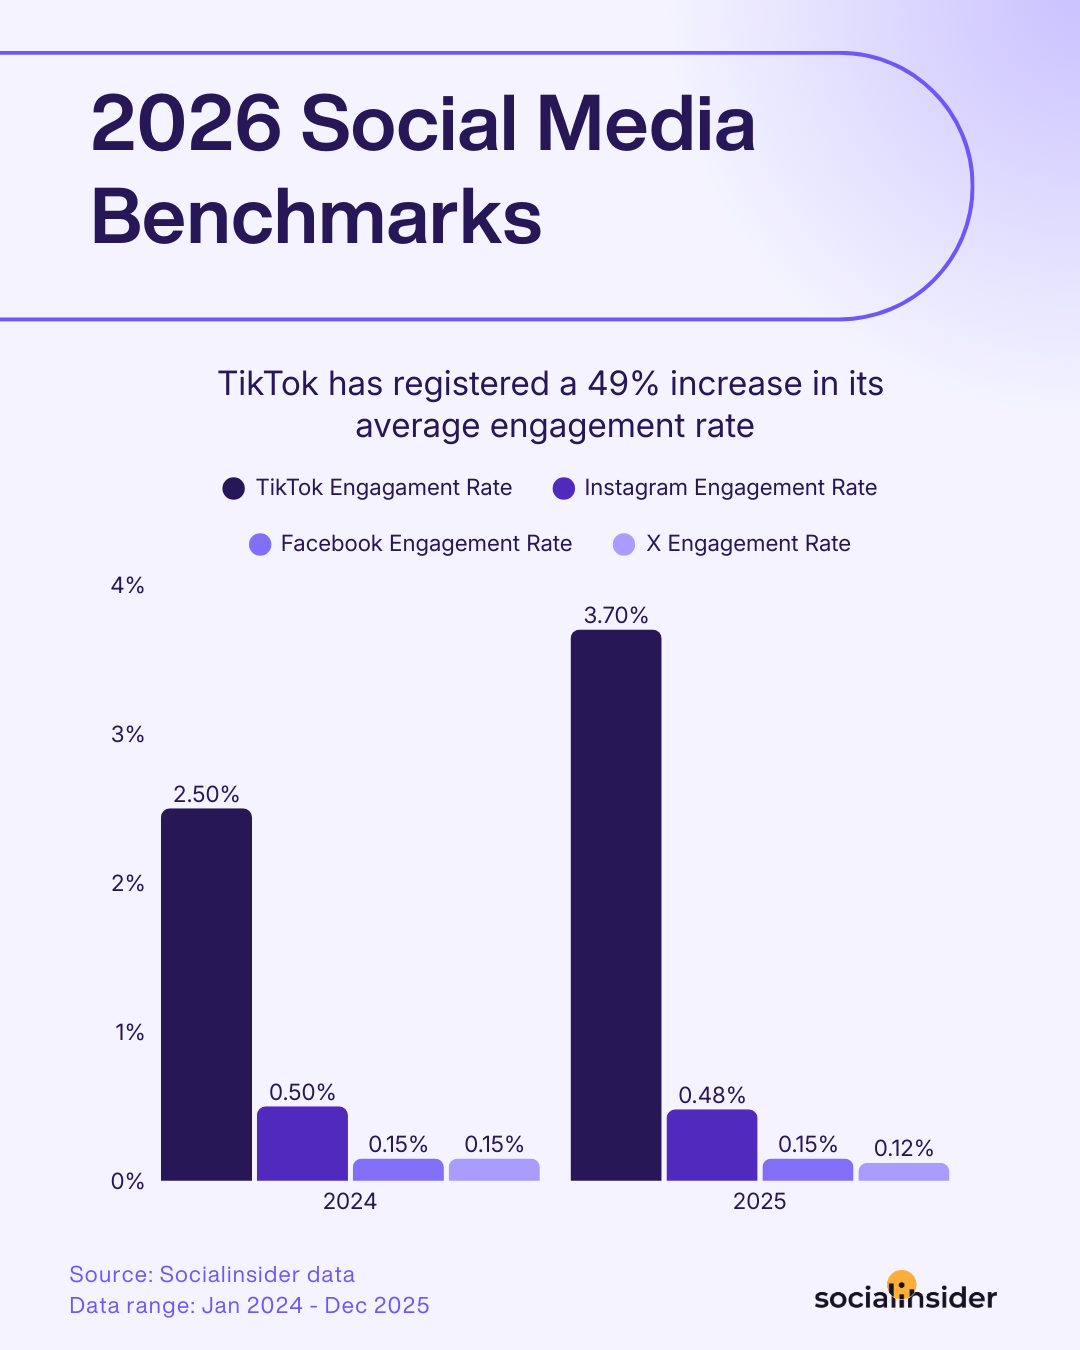
- TikTok: TikTok made headlines yet again, with engagement rates leaping from 2.50% to a standout 3.73%, registering an impressive 49% YoY growth. For brands looking to push boundaries or tap into new audiences, TikTok’s growth cements its role as the go-to channel for high energy and high returns.
- Instagram: Here’s where it gets interesting. Instagram’s engagement rate nudged down a touch, from 0.50% to 0.48%. It might not feel like much, but even a slight drop is worth noting. Still, if you ever wondered “what is the average Instagram engagement rate?” or how it compares, you’ve got your answer: Instagram remains a step above Facebook when it comes to sparking conversations and connections.
- Facebook: You might be surprised, or maybe not, that the average Facebook engagement rate hasn’t budged—it’s holding strong at 0.15% year-over-year. For many brands, this means expectations on Facebook should be steady: you’re playing in a mature, less volatile space. If you’re asking what the average Facebook engagement rate is in 2026, it’s still 0.15%, so you know exactly what to aim for.
- X: And what about X? The platform saw a subtle slide in engagement rates, dipping from 0.15% in 2024 to 0.12% in 2025. For brands that still invest in X, this signals a need for sharper content strategies and perhaps a rethink on how best to capture attention in a changing environment. While the numbers are modest, they offer a valuable reminder: standing still isn’t an option if you want to keep your audience engaged on X.
The engagement gap exists because people use these platforms very differently. Instagram is still largely about polished, aesthetic curation, while TikTok feels more raw, authentic, and immediate.
On TikTok, people don’t just scroll for inspiration. They actively look for answers. Whether it’s finding a restaurant in London, a solution for acne, or an honest review of the latest Marvel movie, users are increasingly going straight to TikTok instead of Google. But it goes beyond utility. TikTok is where people find communities around very specific interests and, in many cases, a sense of belonging.
The “For You” page plays a huge role in this. Discovery on TikTok feels effortless. The algorithm shows you what you want before you even know you’re looking for it. That’s what fuels deeper engagement. TikTok shortens the distance between users and the content they actually care about, while Instagram is still catching up when it comes to frictionless discovery. - Morgane Wasilewski, Social Media Manager at Channable
Strategic tactics to increase your engagement rate across platforms
Looking to turn benchmark insights into real results? Here are a few proven tactics to help boost engagement rate across your social channels:
- Humanize your brand: Show real people, stories, and behind-the-scenes moments. Audiences engage more with authenticity than with “stock” or overtly polished content.
- Embrace platform-specific features: Polls on X, Reels on Instagram, native stories—each feature comes with algorithmic boosts and higher user participation.
- Invest in powerful hooks: Capture attention right away—whether through a dynamic visual, a bold headline, or a pressing question. The faster you deliver a reason for audiences to interact with you, the more engagement your content will rack up.
Average likes per post across platforms
It’s no secret that a quick glance at your like count gives you a pulse check on how your content is resonating. But averages across platforms?
That’s where benchmarks become real-world roadmaps, helping you answer “Are we ahead of the curve, or is there room to grow?”
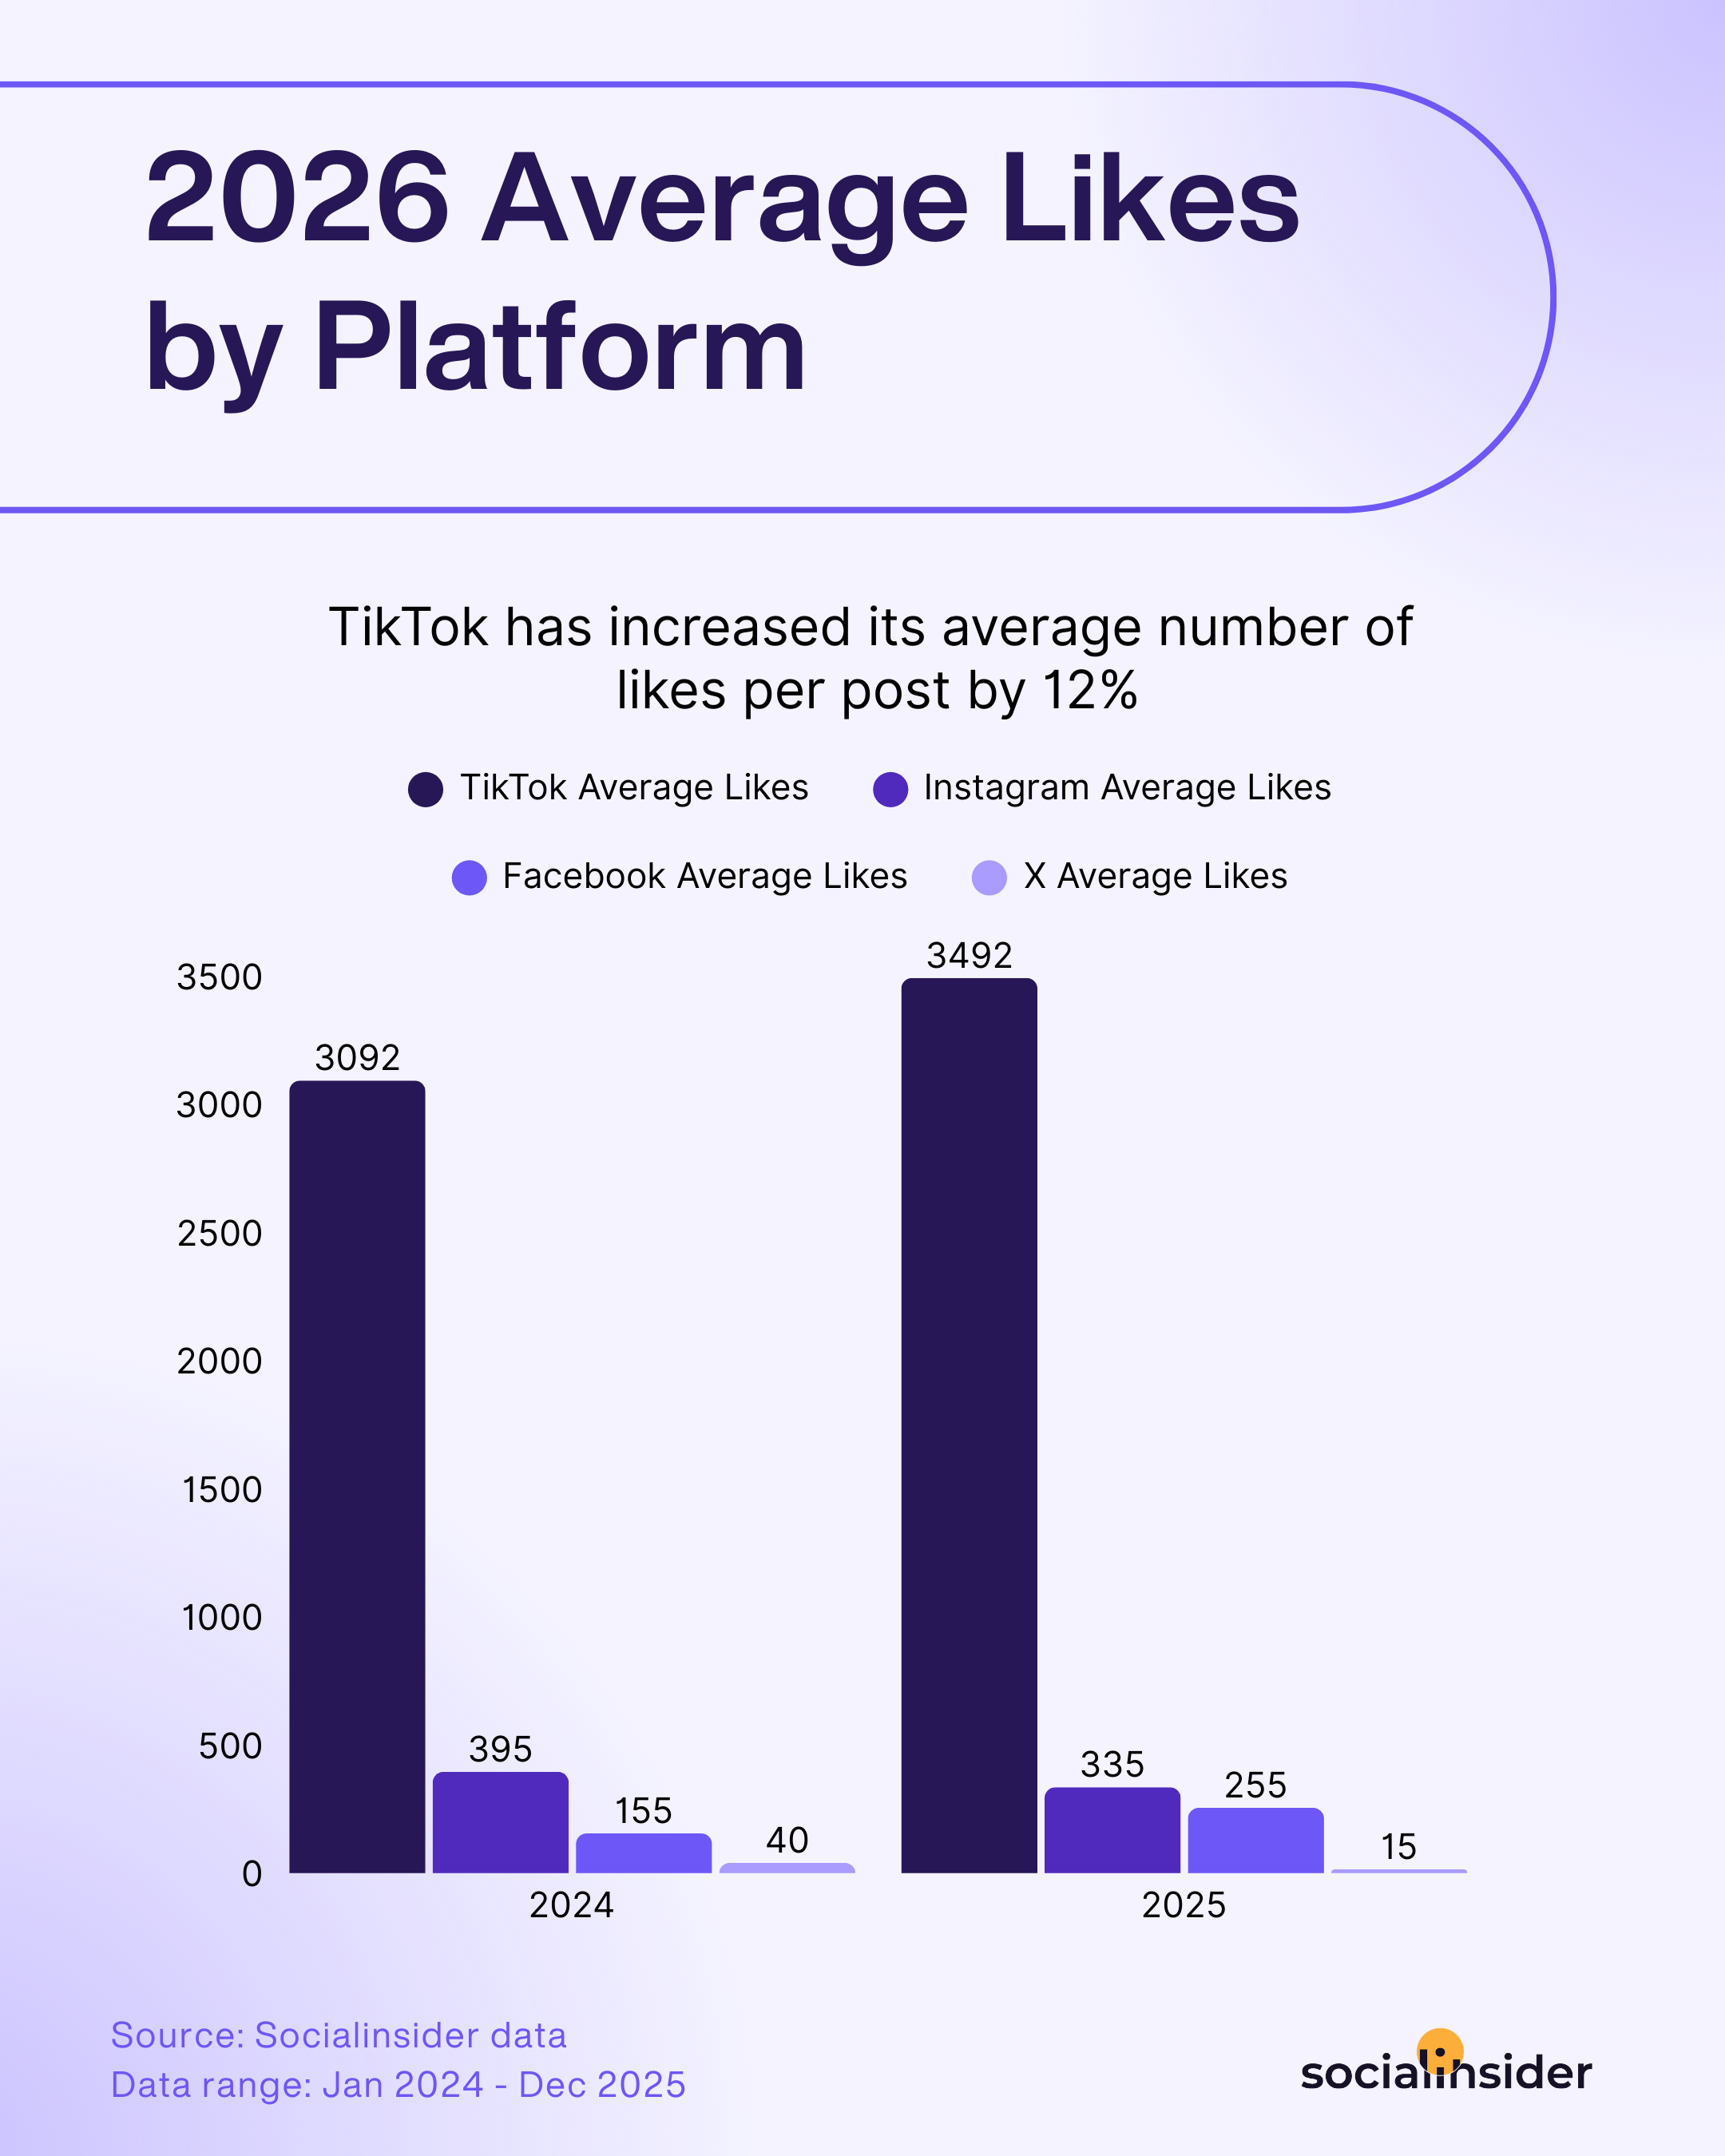
- TikTok: Still the pulse-raiser of the social scene, TikTok stands out for its consistently high appetite for content. User enthusiasm hasn’t just stayed strong—it’s elevated (by 12%) showing that audiences are not only present but actively rewarding creative, eye-catching posts. If you’re leaning into trends and keeping things fresh, TikTok is still the go-to channel for visible, organic love.
- Instagram: This year brought a subtle shift for Instagram—while likes remain a core part of the experience, there’s a distinct sense of rising competition, with likes decreasing by 15% compared to previous values. The platform’s atmosphere has grown a bit more competitive, meaning it now takes even more creativity and true community-building to earn those taps. For brands, it’s a cue to double down on originality and ensure your content has a genuine point of view.
- Facebook: Defying expectations, Facebook managed a quiet resurgence in user engagement, gaining with 64% more likes compared to the previous year. For brands that really listen to their audience and tailor content accordingly, Facebook can surely ensure success. It’s a reminder that authenticity and relevance can still move the needle on legacy platforms—even when trends seem to point elsewhere.
- X: With a 62% YoY decrease in likes, it's becoming clearer that audiences here are becoming more selective and thoughtful, making every like harder to earn but potentially more meaningful. Brands can’t afford to phone it in: winning attention on X now requires sharper, more relevant content and a willingness to rethink what real engagement means on this platform.
Instagram likes are declining not because content is weaker, but because the platform prioritizes watch time, saves, and shares over passive engagement. Users increasingly interact through DMs and private channels, which don't show up in public metrics. The engagement isn't gone. It's just moved to the actions that actually drive reach.
Facebook's like rebound shows what happens when brands stop treating every platform the same and remember that Facebook was built for community, not distribution. Conversational posts that speak directly to existing audiences lower the friction to engage, making likes a natural response again. It's proof that platform-native strategy beats cross-posting every time. – Valeria Sillani, Global Social Media Manager at EasyVista and OTRS
Strategic tactics to increase your likes across platforms
Here are several strategic moves you can use across any network to turn more of your audience into active fans:
- Offer quick-win tips, hacks, or inspiration: Share bite-sized advice, “did you know?” facts, or motivational messages that provide instant value—content that’s useful or heartening tends to get more likes and shares.
- Optimize your visual storytelling: Prioritize striking imagery, bold graphics, or stop-motion visuals that stand out immediately in crowded feeds. High-quality, scroll-stopping visuals are often rewarded with more likes at first glance.
- Create recurring series with an interactive hook: Establish an ongoing content theme—such as “Monday Motivation” or “Ask Me Anything Wednesdays”—that encourages habitual interaction. When followers come to expect (and look forward to) consistent, interactive posts, likes tend to grow over time.
Average comments across platforms
Comments are where true engagement lives—where audiences pause the scroll, join the conversation, and leave their mark. But not all platforms spark dialogue equally, and this year brought some interesting shifts in the art of getting people talking.
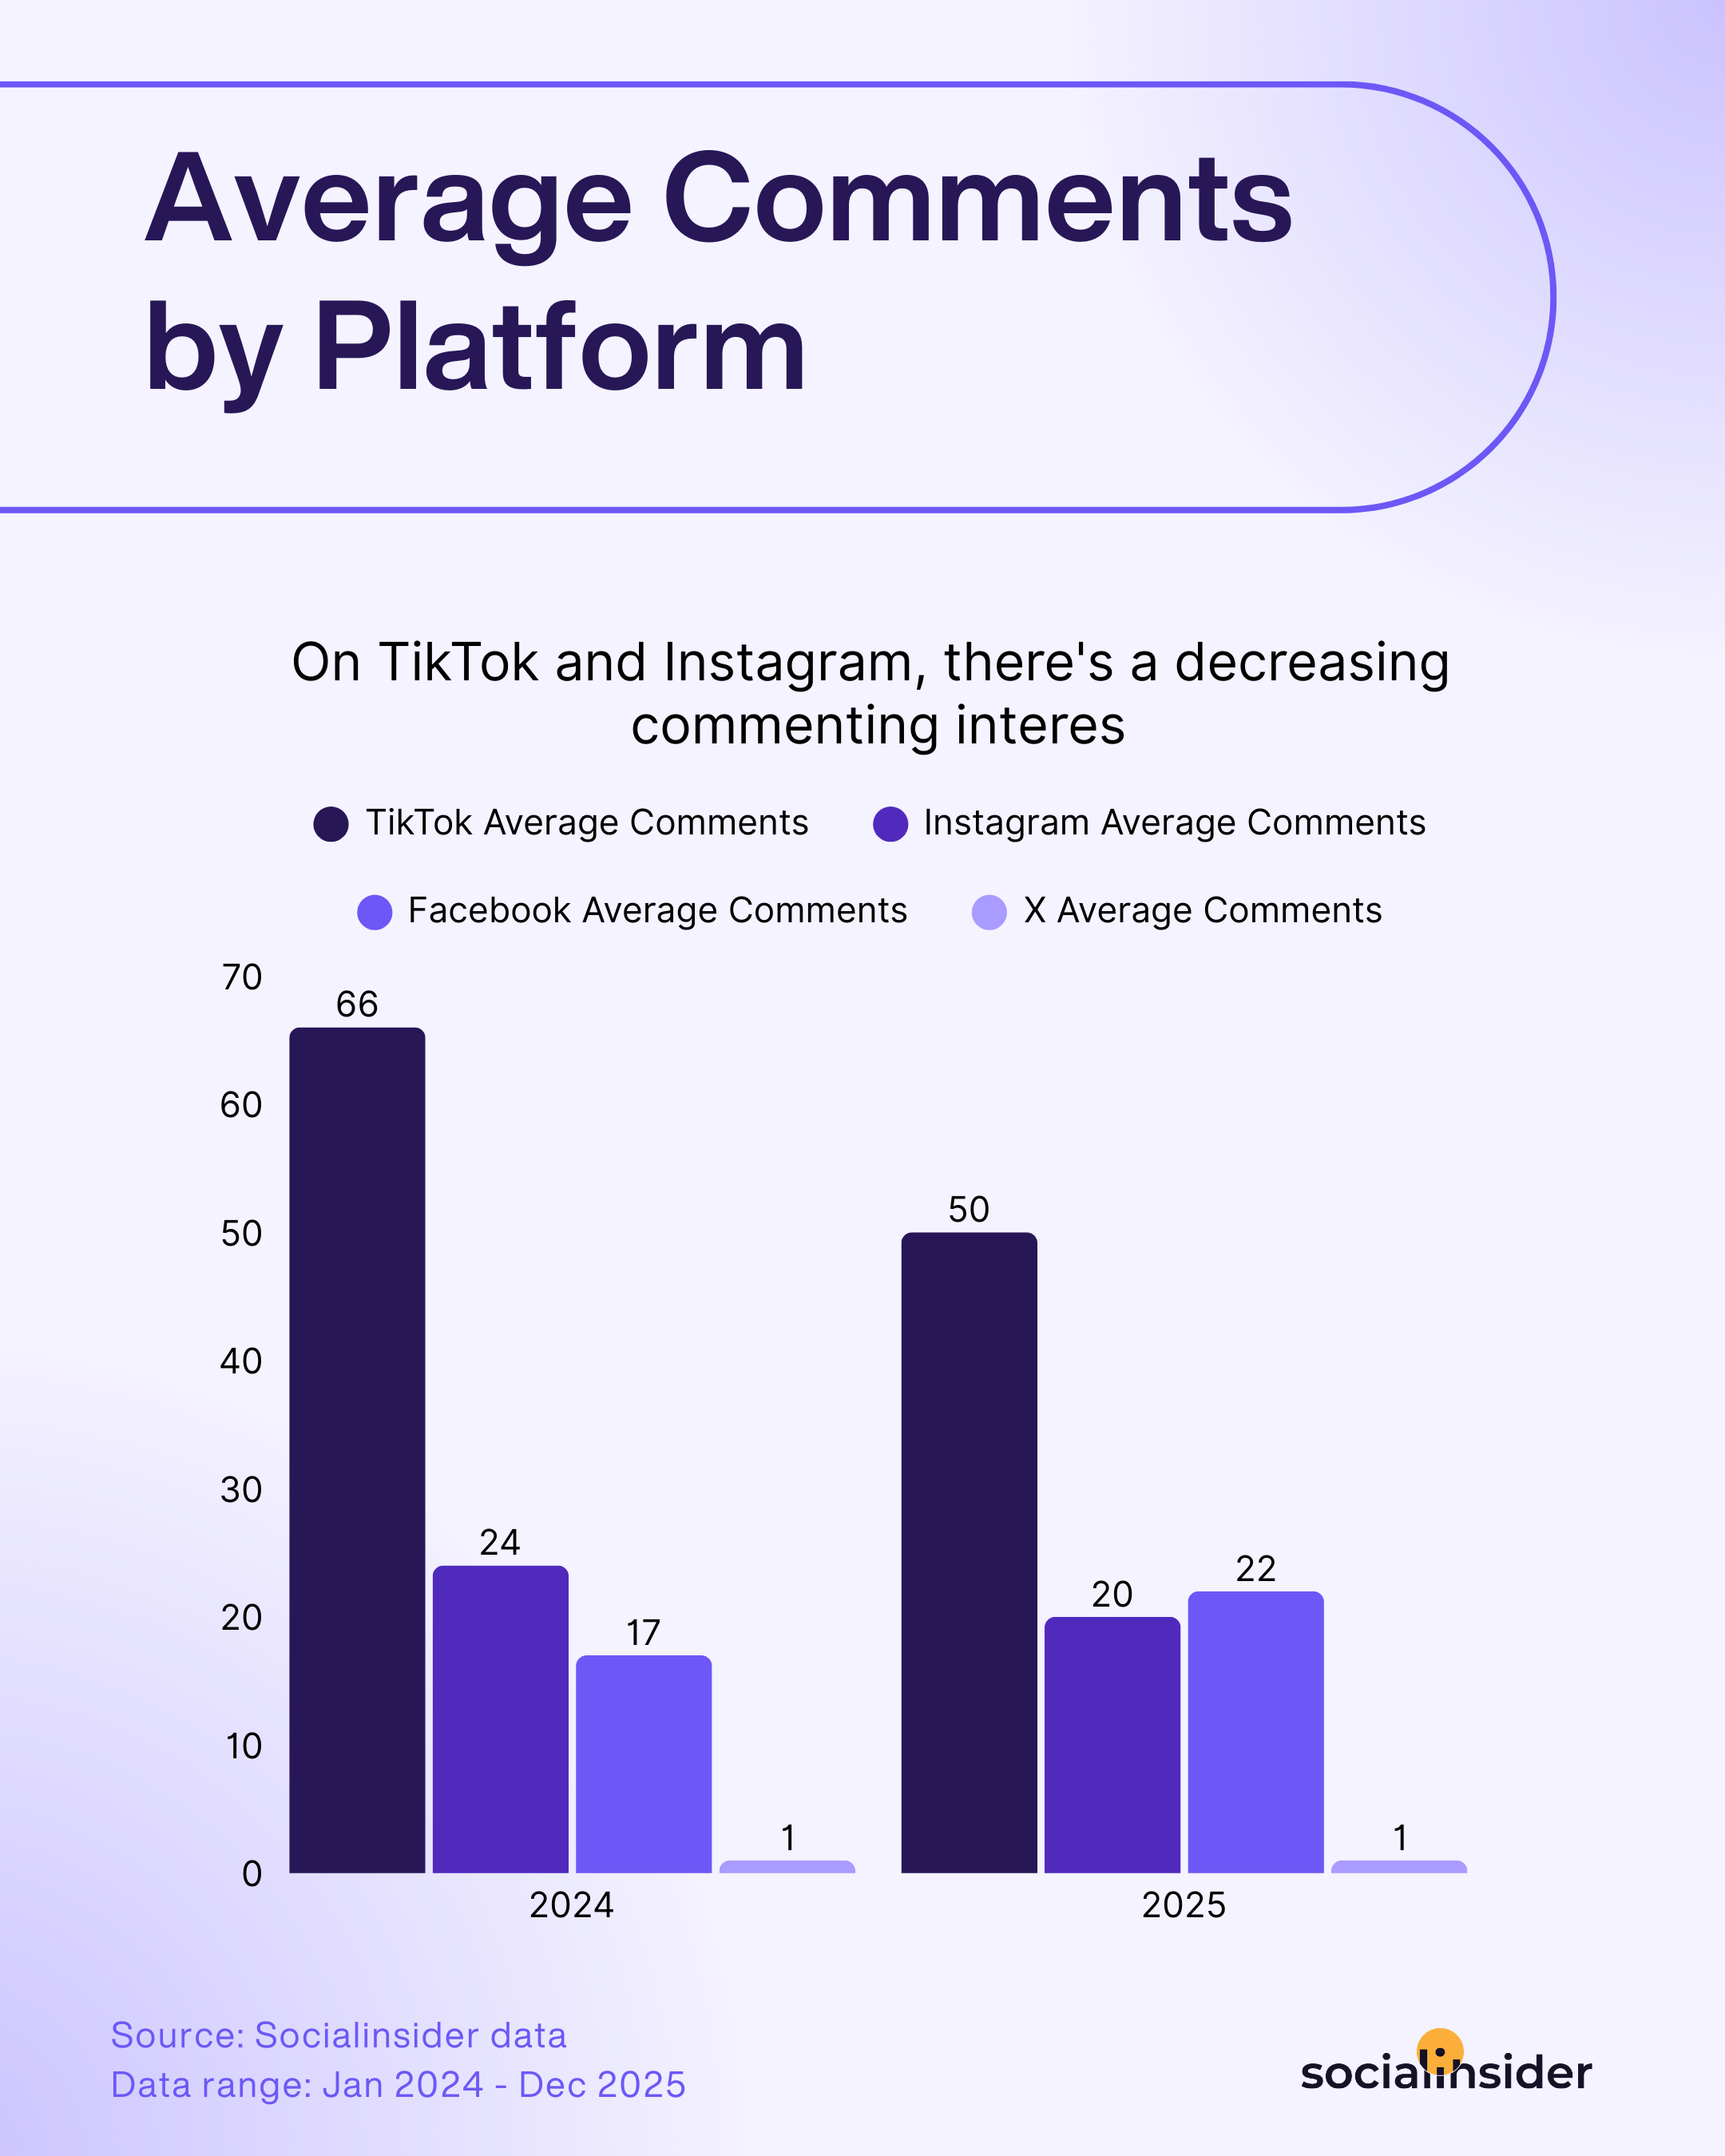
- TikTok: The buzz is real, but conversation is getting more selective. While TikTok still inspires tons of quick reactions, users are now less likely to jump into long comment threads, the platform scoring a 24% decrease YoY in comments generated. This is a sign the platform’s interaction style is evolving—quick, high-energy content still rules, but deeper exchanges may need a new approach.
- Instagram: Engagement through comments remains a pillar on Instagram, though it’s on a gentle downward slope (scoring a 20% YoY decrease). With so much content competing for attention, getting followers to pause and say something requires more intentional prompts and community-minded hooks.
- Facebook: The original home of social dialogue is regaining some spark, registering a 20% increase in the number of comments generated. Despite the platform’s age, Facebook posts are seeing livelier comment sections, pointing to the value of familiar formats and trusted communities. When brands nurture discussion and invite open input, their audience is ready to chime in.
- X: The nature of engagement here is brief and immediate; most users scroll, like, or move on. For those aiming to build actual conversation threads, success now depends on delivering hot takes or timely commentary that simply can’t be ignored.
Comments require time, and users are looking for quicker ways to engage with content. Instead of reacting publicly, they are forwarding content to friends privately or in group chats. This points to a shift toward connection-driven engagement.
It’s also important to note that Gen-Z is often described as the “spectator generation”, highly tuned in but selected about when and where they speak.
Also, platforms and algorithms are ever-changing. We’ve seen an increase in prioritisation around watch time and shares which could also explain this shift in behaviour. Overall, this shift tells us that users still care about content but they prefer to engage privately rather than through a public thread, leaving no trail. - Melody Doffman, Social Media Manager at Nestlé
Strategic tactics to increase your comments across platforms
Here are strategic tactics to help spark (and sustain) a lively comment section across any platform:
- Ask for feedback, ideas, or suggestions: Request input on new products, features, or content directions. Phrasing like “What should we try next?” or “How can we improve?” empowers your audience and shows that their voice matters, motivating them to comment.
- Share unfinished stories or open-ended scenarios: Post cliffhangers, “what would you do?” questions, or stories with missing pieces. The curiosity and desire to weigh in encourage followers to fill in the blanks and keep the conversation going.
- Partner with micro-influencers for authentic collabs: Instead of big-budget sponsorships, tap niche or local creators who align with your brand values. Their loyal, engaged audiences trust their content—meaning your brand message gets a genuine boost in both reach and interaction.
Average shares across platforms
As audiences grow more selective—often opting to scroll, swipe, or simply “like” in silence—the humble share has taken on a whole new significance. Shares are now the gold standard of audience action: proof that your content strikes a chord deep enough for someone to broadcast it beyond their own feed.
This shift is especially telling as passive consumption climbs across nearly every network. In a climate where getting users to even pause is a win, inspiring them to hit “share” says you’ve delivered true value—something worth amplifying
This year’s trends show that while not every platform is built equally for virality, every channel offers unique opportunities to inspire that all-powerful share.
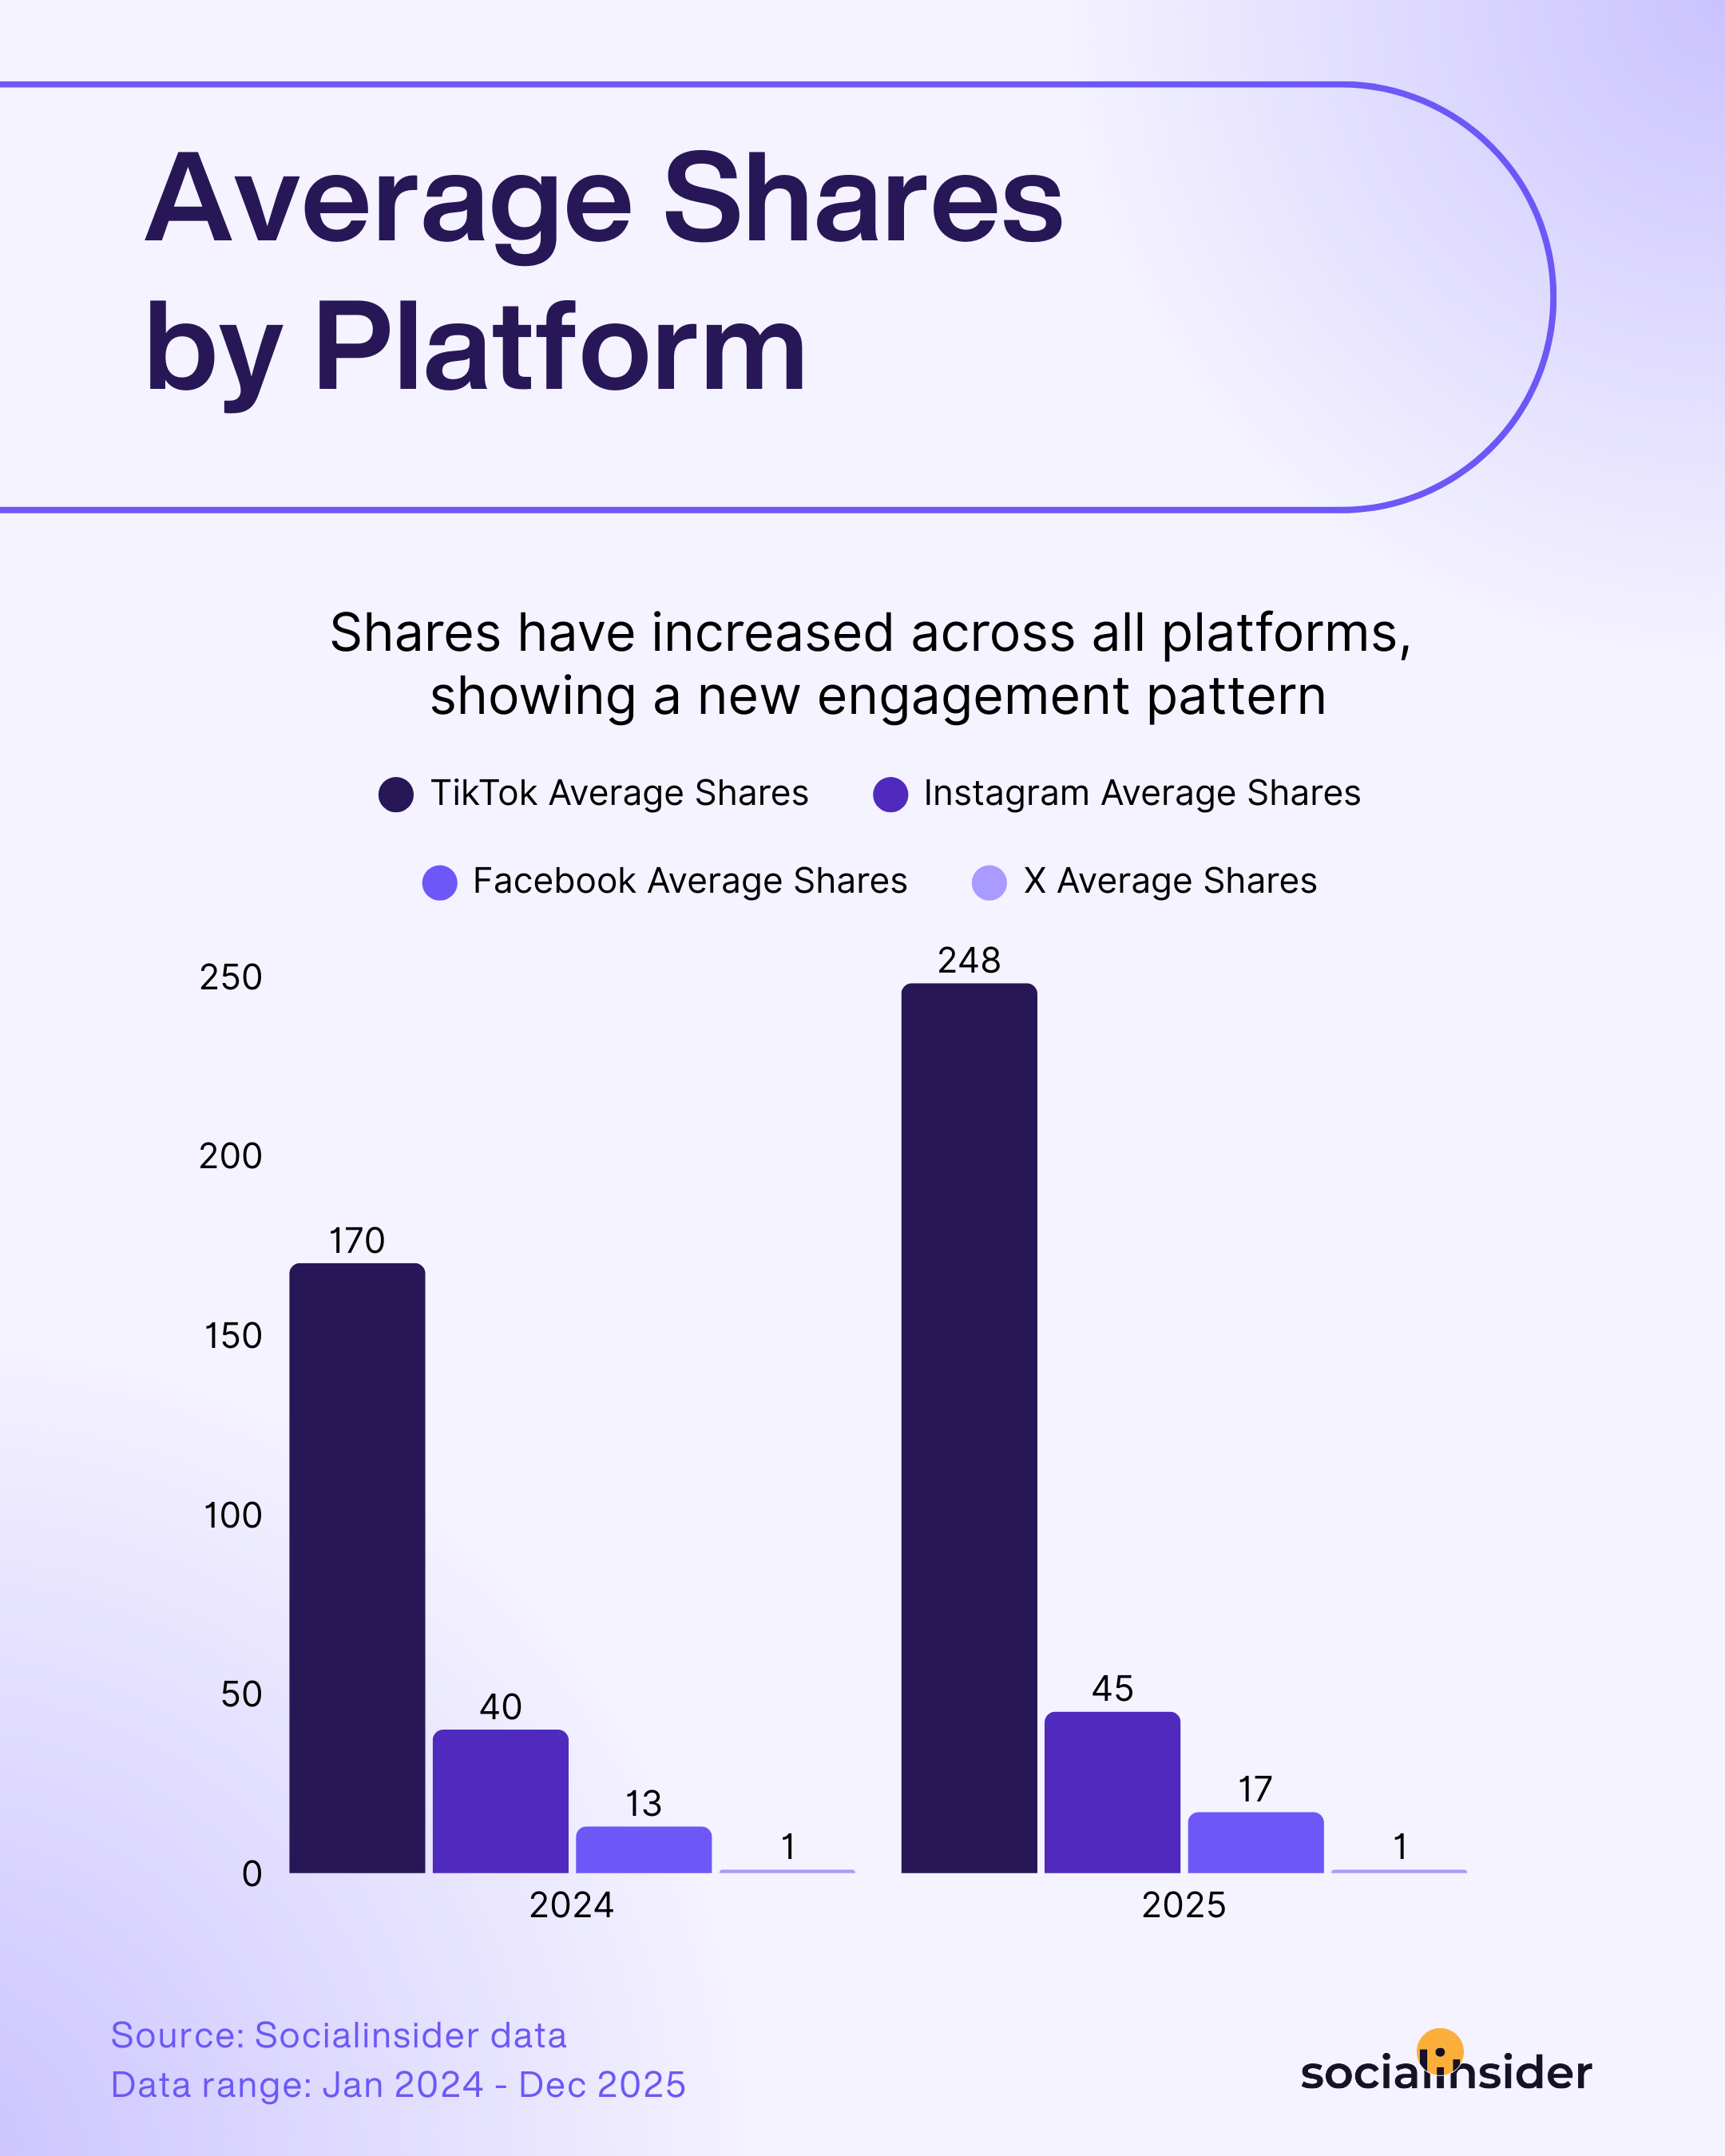
- TikTok: Virality is thriving on TikTok. Sharing culture on this platform keeps gaining momentum as users enthusiastically boost what entertains, educates, or hits a cultural nerve. For creators and brands with their finger on the pulse, TikTok continues to deliver unmatched share potential, actually registering a 45% more shares generated YoY.
- Instagram: Sharing on Instagram maintained its slow-but-steady climb, increasing by 12%. While the share button isn’t the platform’s star, consistently shareable content—think valuable tips, memes, or beautiful visuals—means audiences are a bit more willing to spread the love to DMs and Stories.
- Facebook: Sharing has seen an uptick on Facebook as well (increasing by 30%), confirming that meaningful, relatable content still finds its way to broader audiences here. Tapping into personal connections and community-focused posts is your in-road to more organic reach.
- X: Shares (retweets) on X remain flat, underscoring the challenge of igniting widespread conversation. To cut through, content must be especially bold, timely, or divisive—otherwise, users are much more likely to observe than amplify.
Strategic tactics to increase your shares across platforms
Turning scrollers into sharers is a mark of resonance on any platform. While TikTok leads the pack, every social network rewards content that taps into emotion or value—so focus on creating posts people can’t wait to show others.
- Leverage user-generated content (UGC): Spotlight posts, stories, and case studies from real customers and followers. Audiences are more likely to share content that features themselves or people they relate to—plus, UGC brings an instant credibility boost.
- Tap into emotion—humor, awe, or inspiration: Content that makes people laugh, grabs their attention, or lifts their spirits is naturally shareable. Lean into moments or messages that spark a strong reaction, and your followers will want to pass it on.
- Encourage sharing as a form of participation: Invite your audience to be part of a movement—whether it's tagging friends, joining a challenge, or sharing their take on a topic. When sharing becomes a way to participate, your reach multiplies.
If marketers want to drive more shares, they need to focus on content people genuinely want to send to their group chats. That might be something highly relatable, genuinely useful, creatively inspiring, or simply something that makes people smile. The common thread is value — your content needs to earn its place in someone’s scroll.
Sharing is also a form of self-expression. When people share a post, they’re signaling their interests, values, or sense of humor. Pay attention to your own behavior here: when you share content from other brands or creators, save it and ask how that idea could be adapted for your brand.
You also don’t need to reinvent the wheel. Analyze your most-shared posts to spot patterns in topics or formats, and don’t hesitate to repurpose what’s already worked. As marketers, we see everything we publish but the average follower doesn’t, which makes revisiting strong ideas even more effective. - Elissa Wardrop, Social Media Specialist at IKEA
Average views across platforms
Views are the foundation of social success: every like, comment, or share begins with someone simply watching. But viewing habits aren’t static, and shifts in how (and where) people consume content reveal where the action—and the opportunity—truly lie.
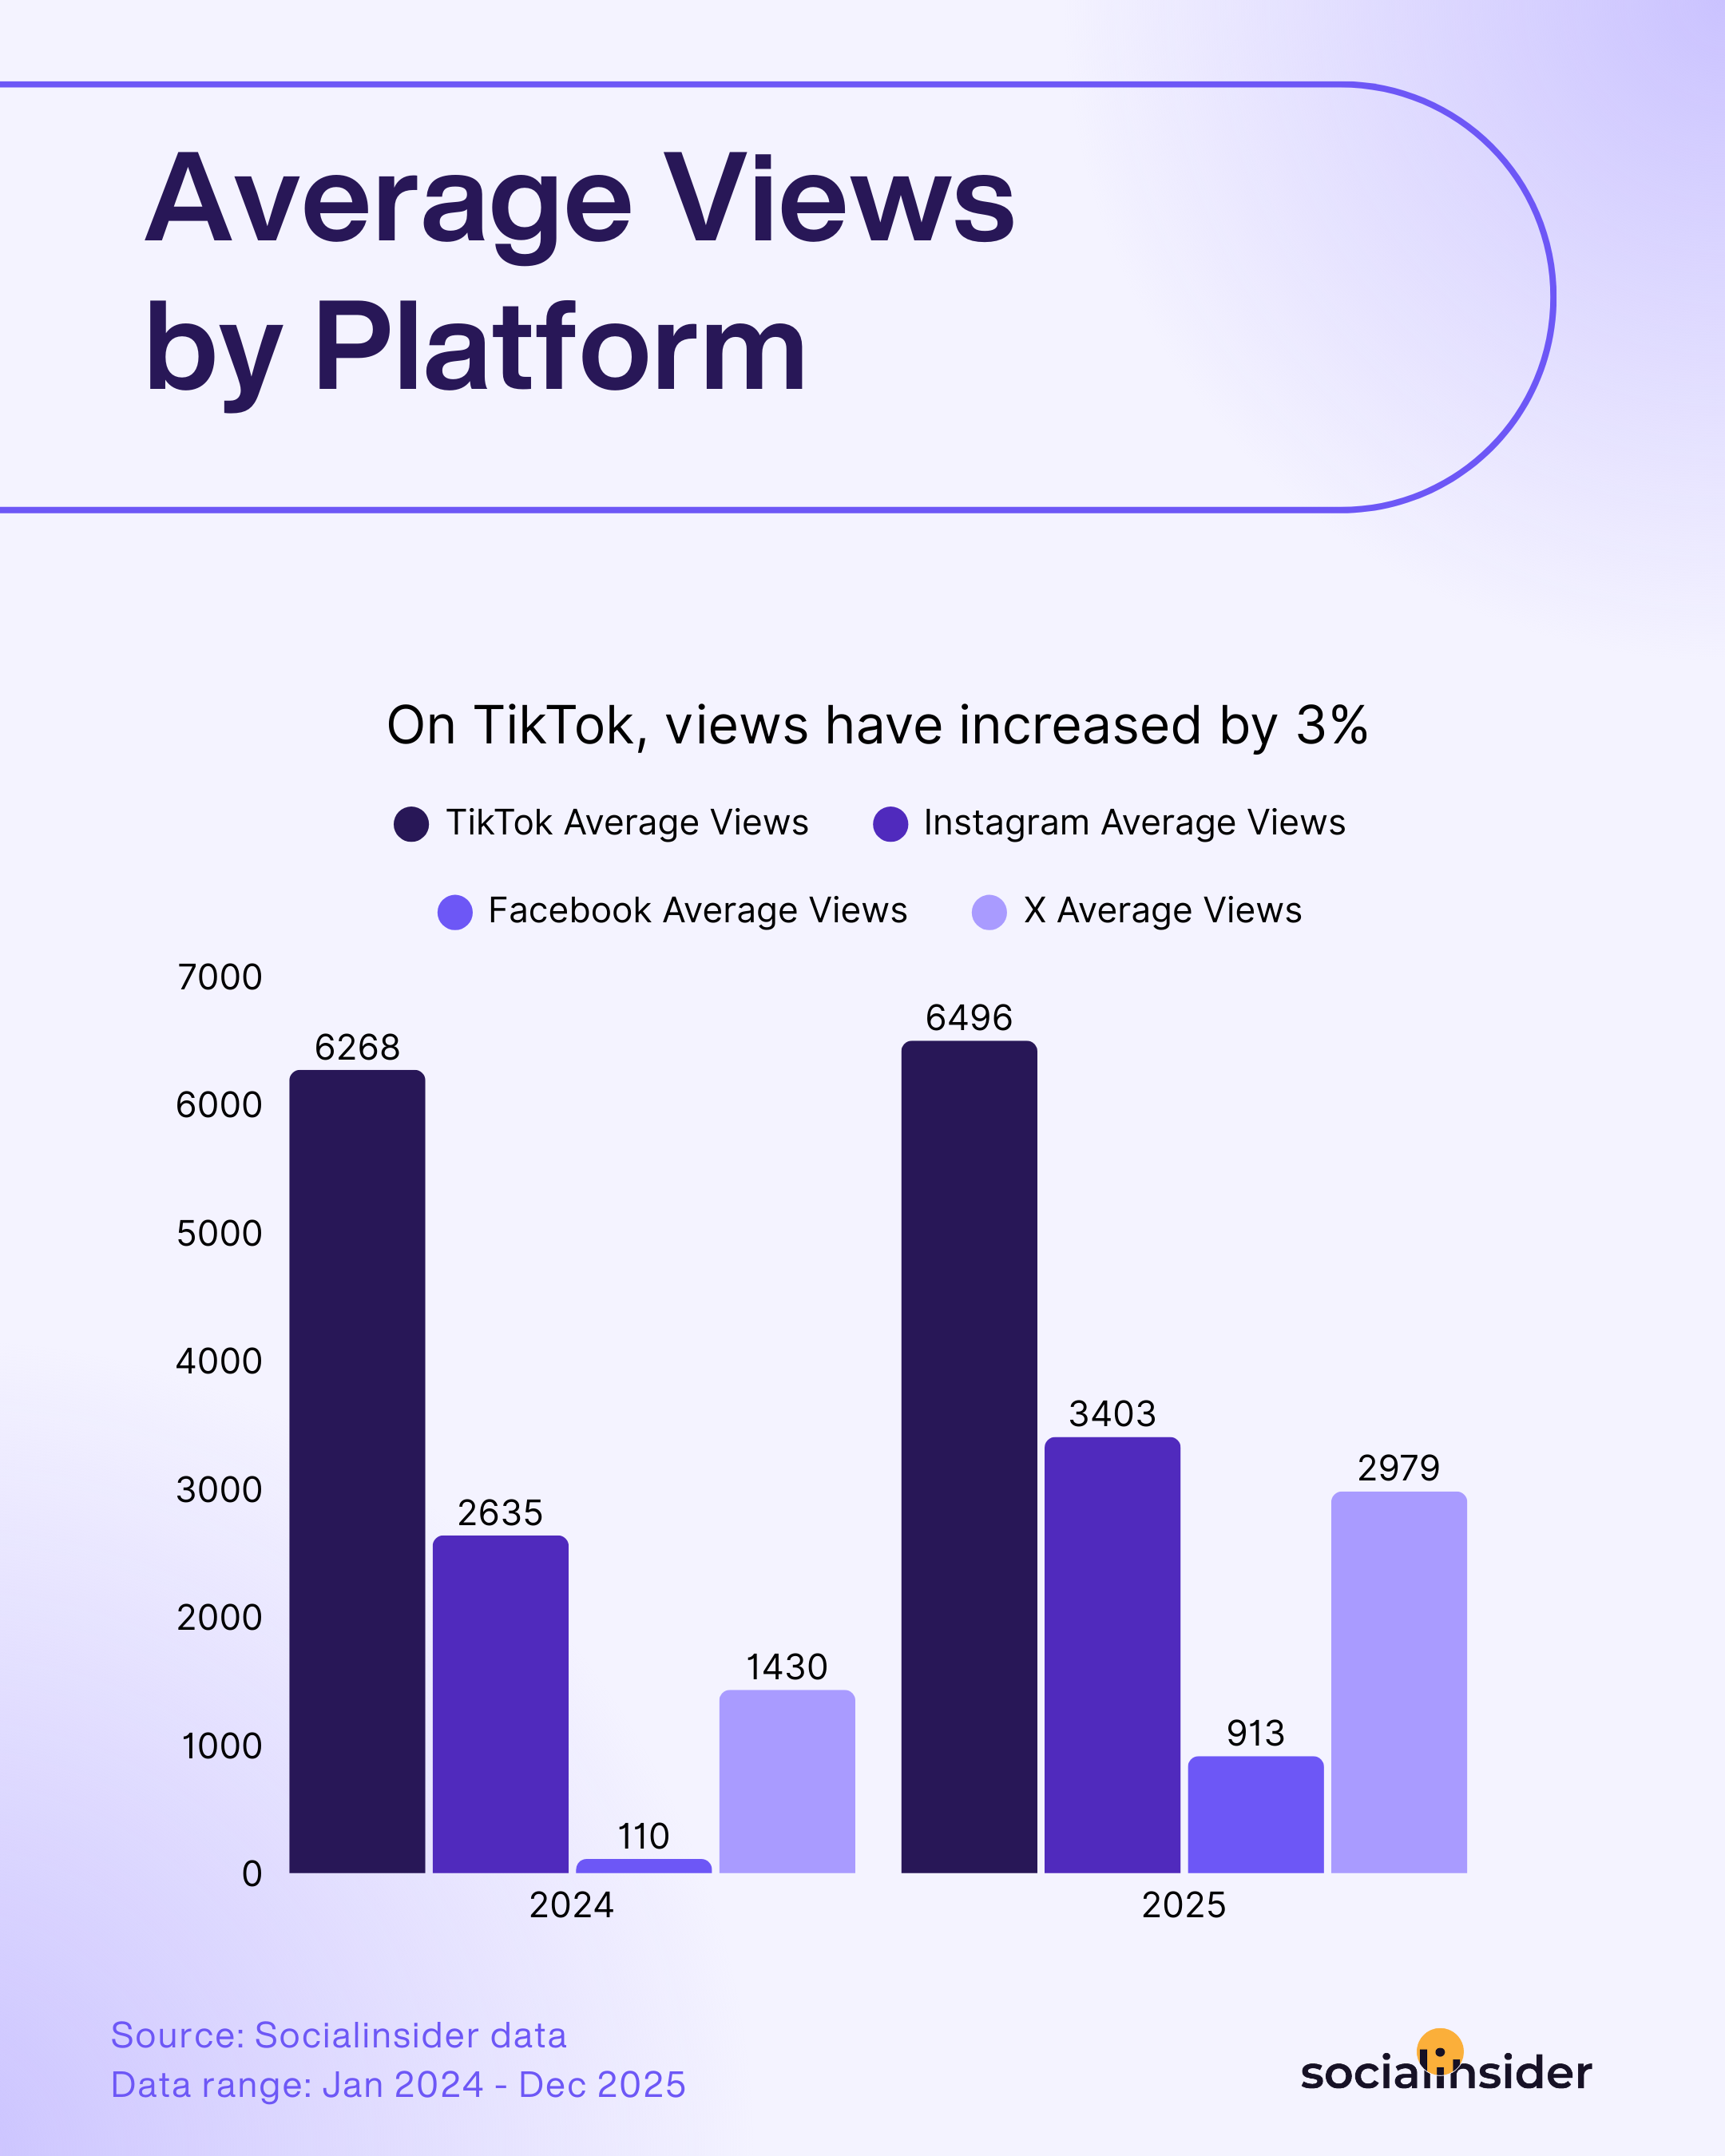
- TikTok: Momentum remains strong on TikTok. Audiences are consistently turning up in high numbers, increasing its average number of views by 3% YoY, with the platform continuing to be the go-to for viral reach. Creativity and trend-savvy content still get rewarded with widespread visibility here.
- Instagram: Instagram saw an impressive lift in viewership, (of 29%) which may be party due to Instagram’s new way of measuring views (in 2025 impressions turned into views). The takeaway: Instagram is quickly becoming a powerful place for brands to grow their reach—especially with snackable, visually compelling content.
- Facebook: Views dipped slightly on Facebook (by 17%), signaling that organic reach is becoming more challenging. To capture attention here, brands need to experiment with format, timing, and hyper-relevant topics to stand out amid the noise.
- X: The platform saw a notable burst in viewership this year (registering a 50% increase), likely tied to viral moments and broader shifts in platform culture. Short-form, news-driven, and visually engaging content now has a clearer runway to reach broad audiences, offering renewed potential for brands willing to play bold.
In 2025, Instagram’s discovery engine pushed content further and faster than ever. With Reels now driving over 20% of time spent on the platform and expanded to three minutes, brands have more surfaces and more time to earn attention. Discovery no longer depends on follower count. Video-first content and collaborations are what the algorithm rewards, allowing even smaller brands to reach thousands organically and generate meaningful views without relying solely on paid spend. - Sara Zuehlke, Senior Social Media Strategist at Digible
Strategic tactics to increase your views across platforms
Ready to get your content in front of more eyes? Try these proven tactics to expand your and drive up your view counts across every platform:
- Tap into cultural moments and real-time events: React to trending news, holidays, or viral topics with your brand’s unique angle. Timely, relevant reactions often earn higher viewst as audiences dive in on what everyone’s already talking about.
- Encourage team or employee sharing: Motivate internal team members or brand ambassadors to share your content to their networks, multiplying early exposure and attracting new eyes.
- Leverage eye-catching thumbnails and titles: Design strong, curiosity-driven thumbnails and headlines that stand out and make audiences want to click and watch.
The increase in views is a real opportunity for brands that felt priced out of reach before. As views go up, the pressure to be perfect goes down. What matters more now is showing up consistently with a clear point of view, focusing on creative, relevance, and storytelling rather than constant selling. Views open the door, but long-term brand building, recognition through repetition, and what you do once people are paying attention is what truly drives impact.” - Victoria I., Brand Manager at fatjoe
Monthly posting frequency benchmarks
How often you show up matters just as much as what you share. Here’s a quick look at how posting rhythms are evolving—and what that means for your brand’s visibility on each platform:
- TikTok: Consistency remains key—brands are sticking to a steady output. The platform rewards regular participation, but without overwhelming audiences. It’s all about maintaining momentum with a relaxed but reliable posting rhythm.
- Instagram: Post volume is holding steady, signaling that on Instagram, it’s quality and variety (think posts, Stories, and Reels), not just quantity, that keeps audiences engaged and algorithms happy.
- Facebook: A sharp reduction in post frequency (a 48% decrease) points to a more intentional approach, with brands moving away from volume and toward curated, high-value updates that cut through the crowded feed.
- X: Posting pace has accelerated (by 40%), underscoring the platform’s real-time, always-on nature. Timely, high-volume posting is still the route to relevance—and missing a beat could mean missing the conversation entirely.
The X platform rewards speed and conversation, not polished, curated, or aesthetic content. Brands need to stop treating X like it needs a content calendar. Encourage team members to engage in relevant conversations rather than creating only batched posts.
Set up monitoring or social listening tools for industry keywords, have clear brand guidelines, and let people be human. One authentic reply can outperform a week of scheduled posts. – Bukunmi Weke, Social media Strategist
For well-resourced teams with strong creative and production processes, posting 5 times per week is great as Socialinsider’s benchmarks also point out. But for many brands especially a small marketing team chasing frequency quickly becomes a creativity trap.
The number itself isn’t the issue; consistency and value are. I’d always choose fewer, higher quality posts that genuinely resonate over hitting an arbitrary posting target.” – Danielle Mote, Social media specialist, Construct It and BJS
Strategic tactics to optimize your posting strategy
Want to make every post count? Try these practical tactics to fine-tune your posting cadence and keep your audience engaged—no matter the platform:
- Batch-create and schedule your content: Planning in advance ensures consistency (even on busy weeks) and helps you find the right frequency without burning out.
- Mix formats and content types: Don’t just rely on the same kind of post—rotate videos, images, carousels, Stories, or even live sessions to engage different audience segments and keep your feed fresh.
- Use analytics to spot your sweet spot: Monitor when your audience is most active and which posting patterns yield the highest engagement, then fine-tune your calendar accordingly.
Continue reading:
Methodology
Within this social media benchmarking report, we provide a representative sample of international brands with an active presence on TikTok, Instagram, Facebook, and Twitter, between January 2024 - December 2025. The findings of this study are based on the analysis of 70M social media posts.
We define social media engagement rate as measurable interactions on Facebook, Instagram, Twitter, and TikTok posts, including comments, reactions, and shares, with the particularities for each platform.
Facebook engagement rate per post (by followers): Facebook engagement rate per post is calculated as the sum of reactions, comments, and shares on the post divided by the total number of fans that page has. The result is then multiplied by 100.
Instagram engagement rate per post (by followers): Instagram engagement rate per post is calculated as the sum of likes and comments on the post divided by the total number of followers that page has. The result is then multiplied by 100.
Twitter engagement rate per post (by followers): Twitter engagement rate per post is calculated as the sum of likes and Retweets received on the Tweet divided by the total number of followers that page has. The result is then multiplied by 100.
TikTok engagement rate per post (by followers): TikTok engagement rate is calculated as the sum of likes, comments, shares, and saves on the post divided by the total number of followers that page has. The result is then multiplied by 100.
Average likes per post: represents how many likes a post receives on average.
Average comments per post: represents how many comments a post receives on average.
Average shares per post: represents how many shares a post receives on average.
Average views per post: represents how many views a post receives on average.
NOTE: This study contains 2025 values, presented as 2026, because, at the time of publication, there wasn't enough data for analysis, with the year just starting. That is why we bring quarterly updates, as the year unfolds and more data is available.
Analyze your competitor's social profiles
Get insights on competitor's performance across channels and discover do's and don'ts!
Ready to improve your social media strategy with real-time insights?
Get strategic insights, analyze the social performance across all channels, compare metrics from different periods and download reports in seconds.