Impressions vs Engagement: What to Track and How?
Understand how to look at impressions vs engagement and how they influence each other. Discover helpful benchmarks for each.


As social media becomes a more critical channel for brand visibility and competitive advantage, knowing which signals to prioritize is essential. Impressions tell you how widely your message travels, while engagement reveals whether the content actually resonates with the audiences that matter most.
So which one of these social media metrics should you emphasize in your reporting?
In this blog post, I’ll break down how impressions and engagement compare across platforms—and how they correlate—using insights from Socialinsider’s 2025 Benchmarks Reports. The goal: to help you understand not just what people see, but what truly moves them.
Key takeaways
-
When to track impressions vs engagement: Impressions help you measure visibility, while engagement shows how well your content resonates and drives action—track each based on your specific campaign goals.
-
Use platform benchmarks to set realistic goals: Each platform performs differently—TikTok leads in both reach and engagement, Instagram favors Reels and carousels, Facebook and X require strategic content, and LinkedIn excels with interactive formats like polls and documents.
-
Understand the correlation between impressions and engagement: Analyzing impressions and engagement together reveals whether your content is both seen and effective, helping you identify when to optimize creative, targeting, or distribution.
When do impressions matter the most?
Impressions measure how many times your content appears on someone’s screen, even if the same user sees it multiple times. While the metric doesn’t tell you whether audiences interact with your content, it does tell you how visible your brand is becoming across the channels that matter to you.
For leaders who are thinking strategically about social as a maturing or increasingly important channel, here’s when impressions matter most:
Audience expansion
When you’re evaluating whether your presence is successfully breaking into new segments or markets, impressions act as an early indicator of distribution health. If impressions spike across new geographies or demographics, it signals that your content is gaining visibility where you intend it to.
However, if impressions rise while reach remains flat, it’s a sign your visibility is cycling through the same audience—boosting familiarity, but not expansion.
Brand awareness campaigns
If your goal is to build recognition or reinforce brand presence, impressions help you confirm whether your narrative is consistently showing up in the right feeds, even before interaction or deeper action occurs.
New product launches and announcements
When the priority is exposure, impressions validate whether high-stake messaging (like launches, repositioning, or major announcements) is getting the visibility required to influence your market.
Competitive market positioning
In crowded categories, staying visible alongside (or ahead of) competitors is a strategic advantage. High impressions indicate your brand remains present in the broader industry conversation, especially during periods when buyers are evaluating options and forming shortlists.
When does engagement matter the most?
Engagement helps you determine whether your content is truly resonating, and whether your strategy is aligned with what your audience values right now.
For leaders overseeing multiple initiatives or stakeholders, engagement becomes especially important when:
Nurturing and retaining the existing audience
Engagement signals whether your message still holds relevance for the community you’ve built. Even with a strong follower base, low engagement can indicate your content no longer reflects your audience’s expectations, or that platform algorithms are deprioritizing it.
Community building initiatives
When cultivating a community around your brand, engagement shows the depth of connection: comments, shares, discussions, and saves are indicators of real participation, not just passive visibility.
Measuring content fit
If engagement drops, it’s often a sign your themes, tone, or content formats need recalibration. High engagement reinforces that your content is aligned with audience priorities, and with the internal narrative your brand wants to deliver.
Conversion-focused campaigns
Engagement metrics help you diagnose whether your creative, messaging, or format is effective before you invest more budget. If users aren’t liking, clicking, or interacting, they likely won’t convert.
Product research and feedback loops
Interactive formats such as polls, Q&A captions, and multi-image explainers can double as lightweight product research tools. Tracking recurring patterns in how people respond provides insights into what resonates, whether you’re evaluating feature ideas, messaging, or customer priorities.
What's the correlation between impressions and engagement?
Impressions and engagement are connected, but they don’t always move in the same direction. Analyzing them together can help you understand what’s working and what just isn’t.
When they work together, you get:
- High impressions with high engagement, meaning your content has high visibility, and it’s also encouraging your audience to engage with it.
When they conflict, you get:
- High impressions with low engagement, which could mean your content is being seen, but not many people are engaging with it. This could happen due to weak creatives, incorrect audience targeting, or unclear messaging.
- Low impressions with high engagement, which could mean your content is resonating well with the small audience that sees it. Consider testing new formats, posting at different times, or boosting posts to reach a wider audience.
Platform-specific impressions and engagement benchmarks
Instagram benchmarks: Impressions vs engagement
Impressions
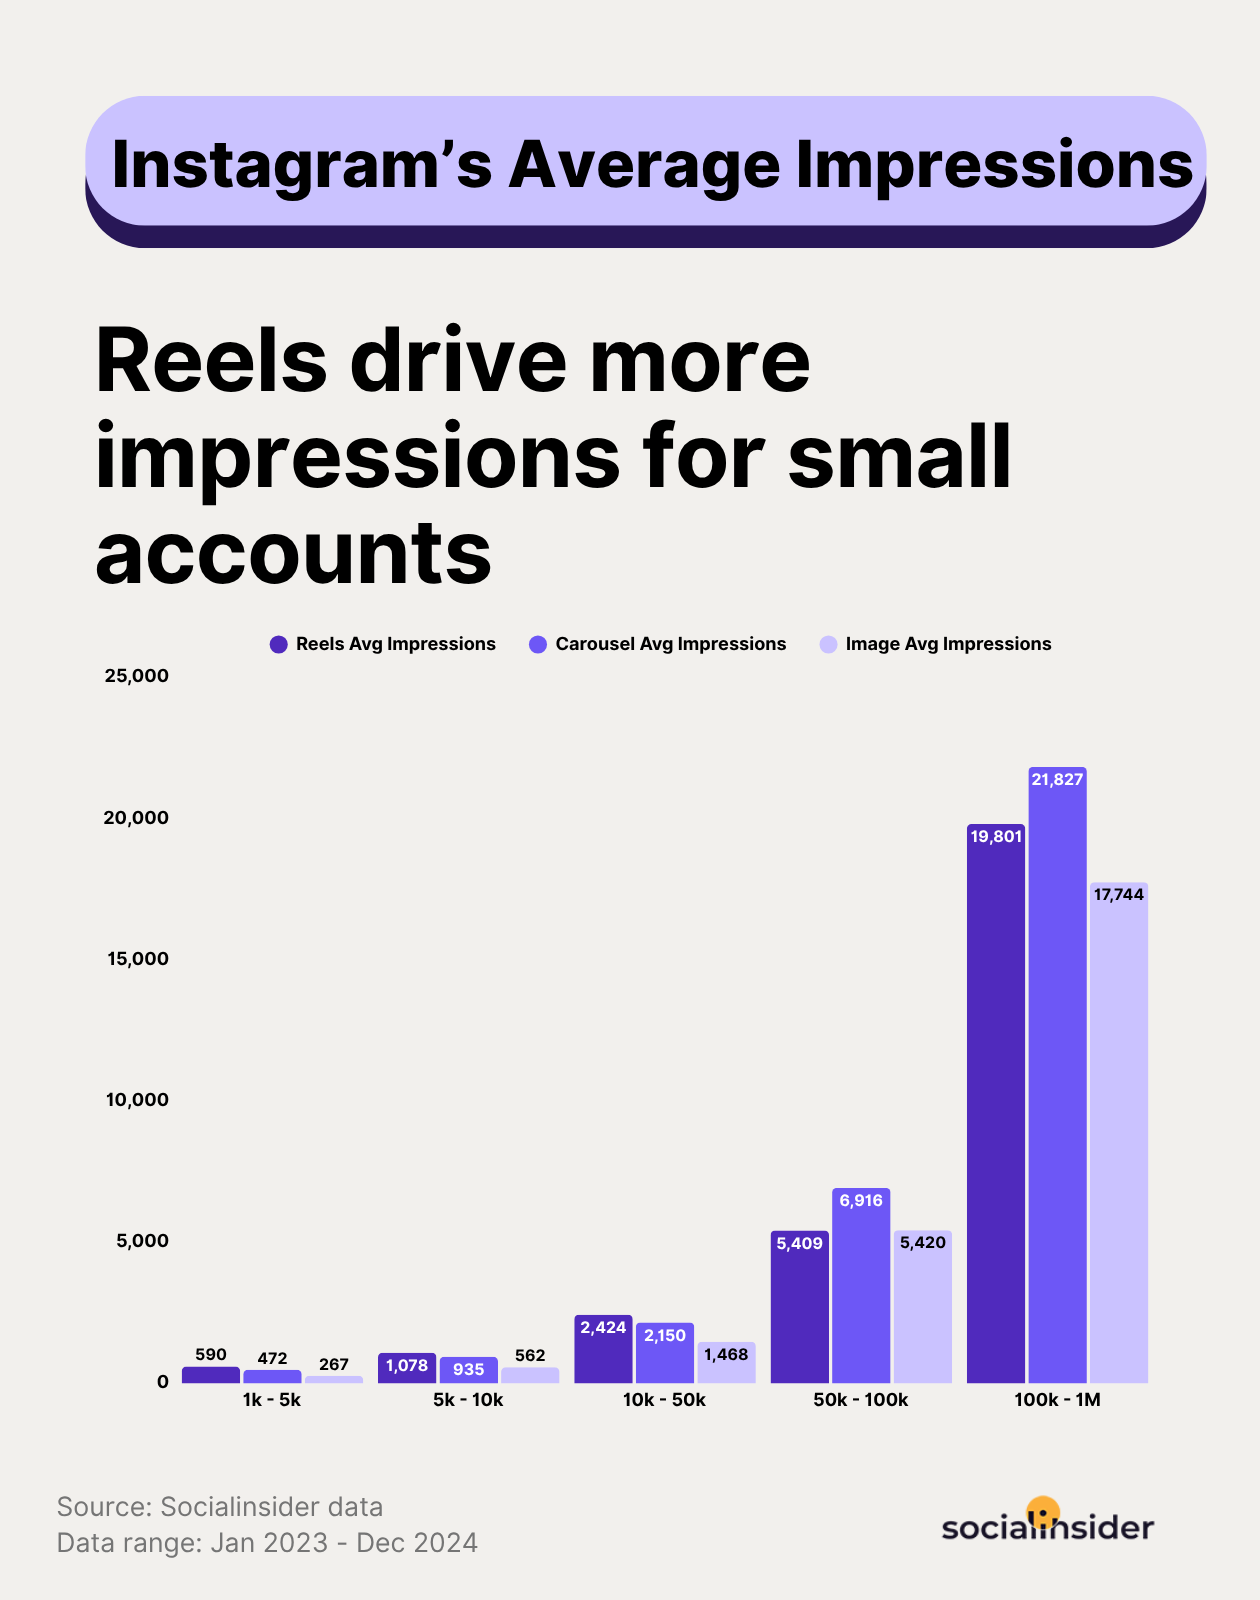
For smaller accounts, Instagram Reels have the highest impressions, but as account size grows, carousels emerge as the top-performing format.
Meanwhile, static images continue to fall behind, reinforcing Instagram’s shift away from one-off visuals in favor of video and multi-image posts.
Engagement
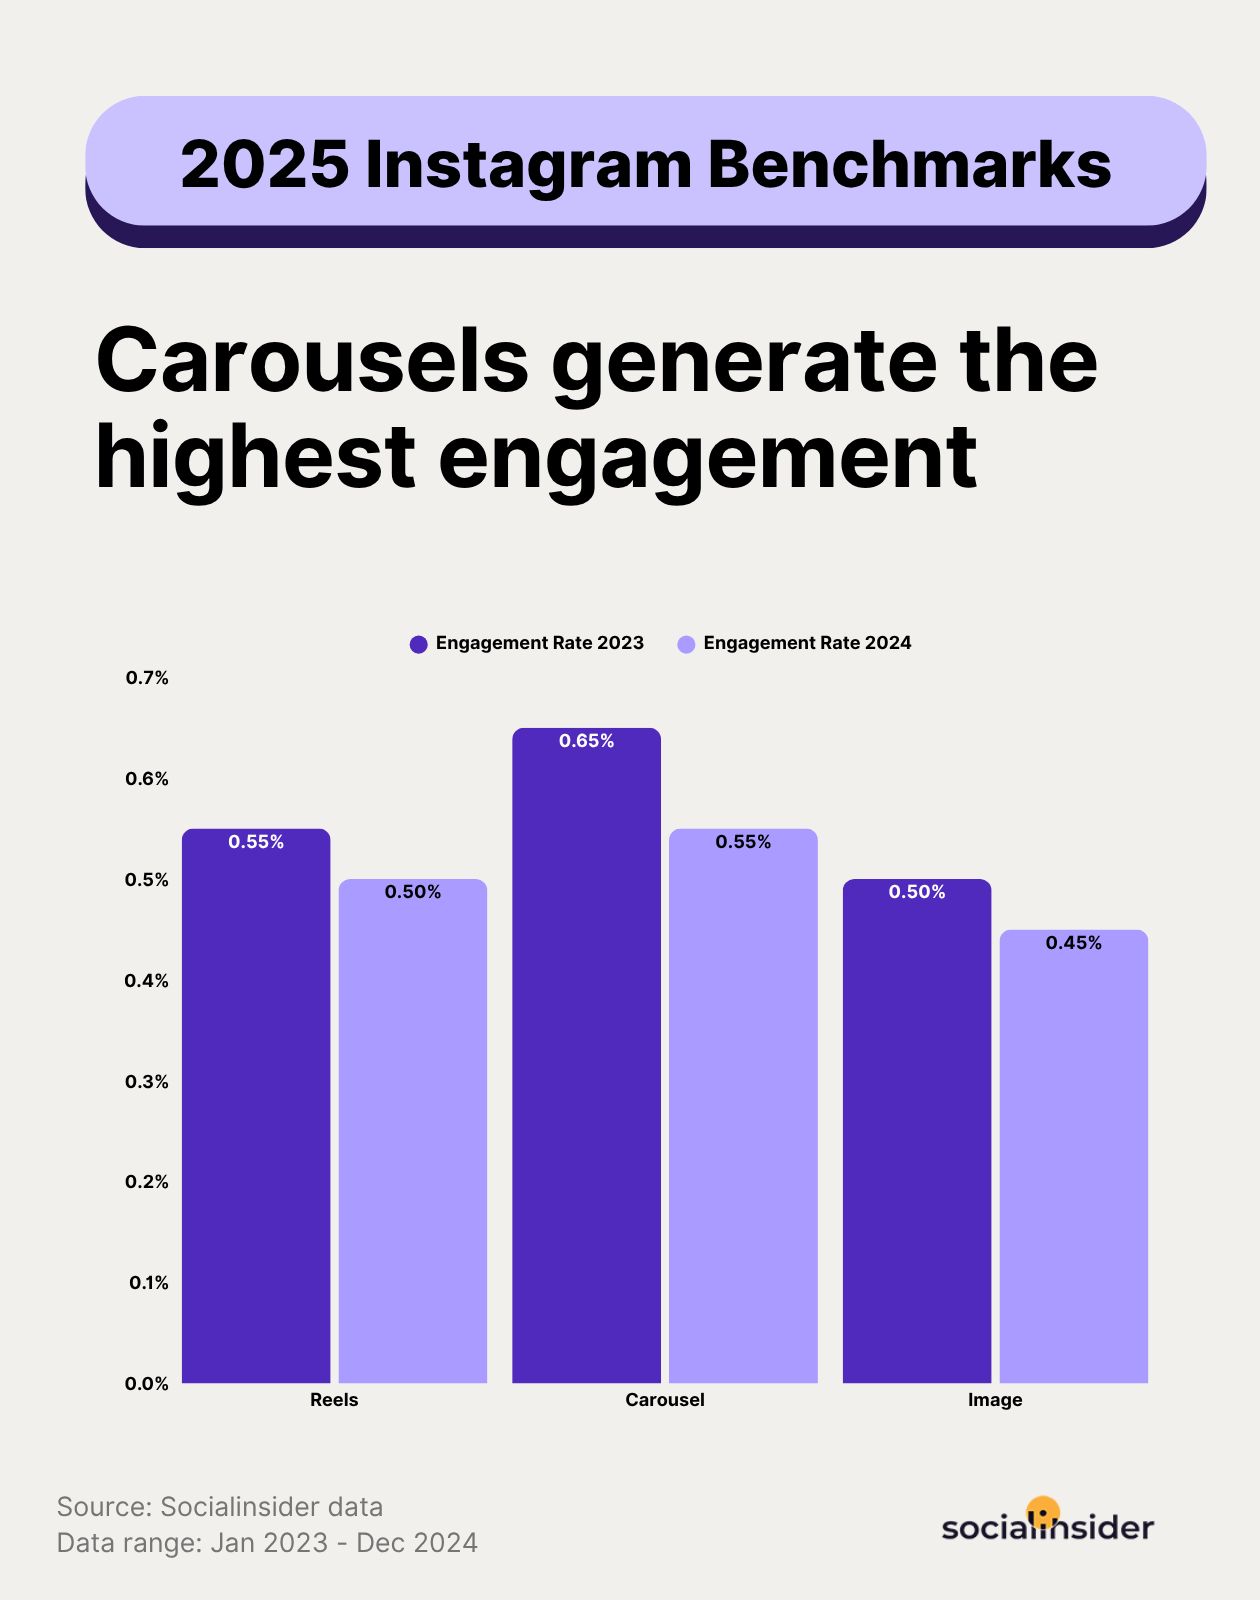
Among content types, carousels lead with an average engagement rate of 0.55%, thanks to their interactive, swipeable nature. Reels now have an average engagement of 0.50%, while static images are at 0.45%. Seasonality also plays a role, with engagement peaking in Q4-Q1 and dipping during the summer.
Facebook benchmarks: Impressions vs engagement
Impressions
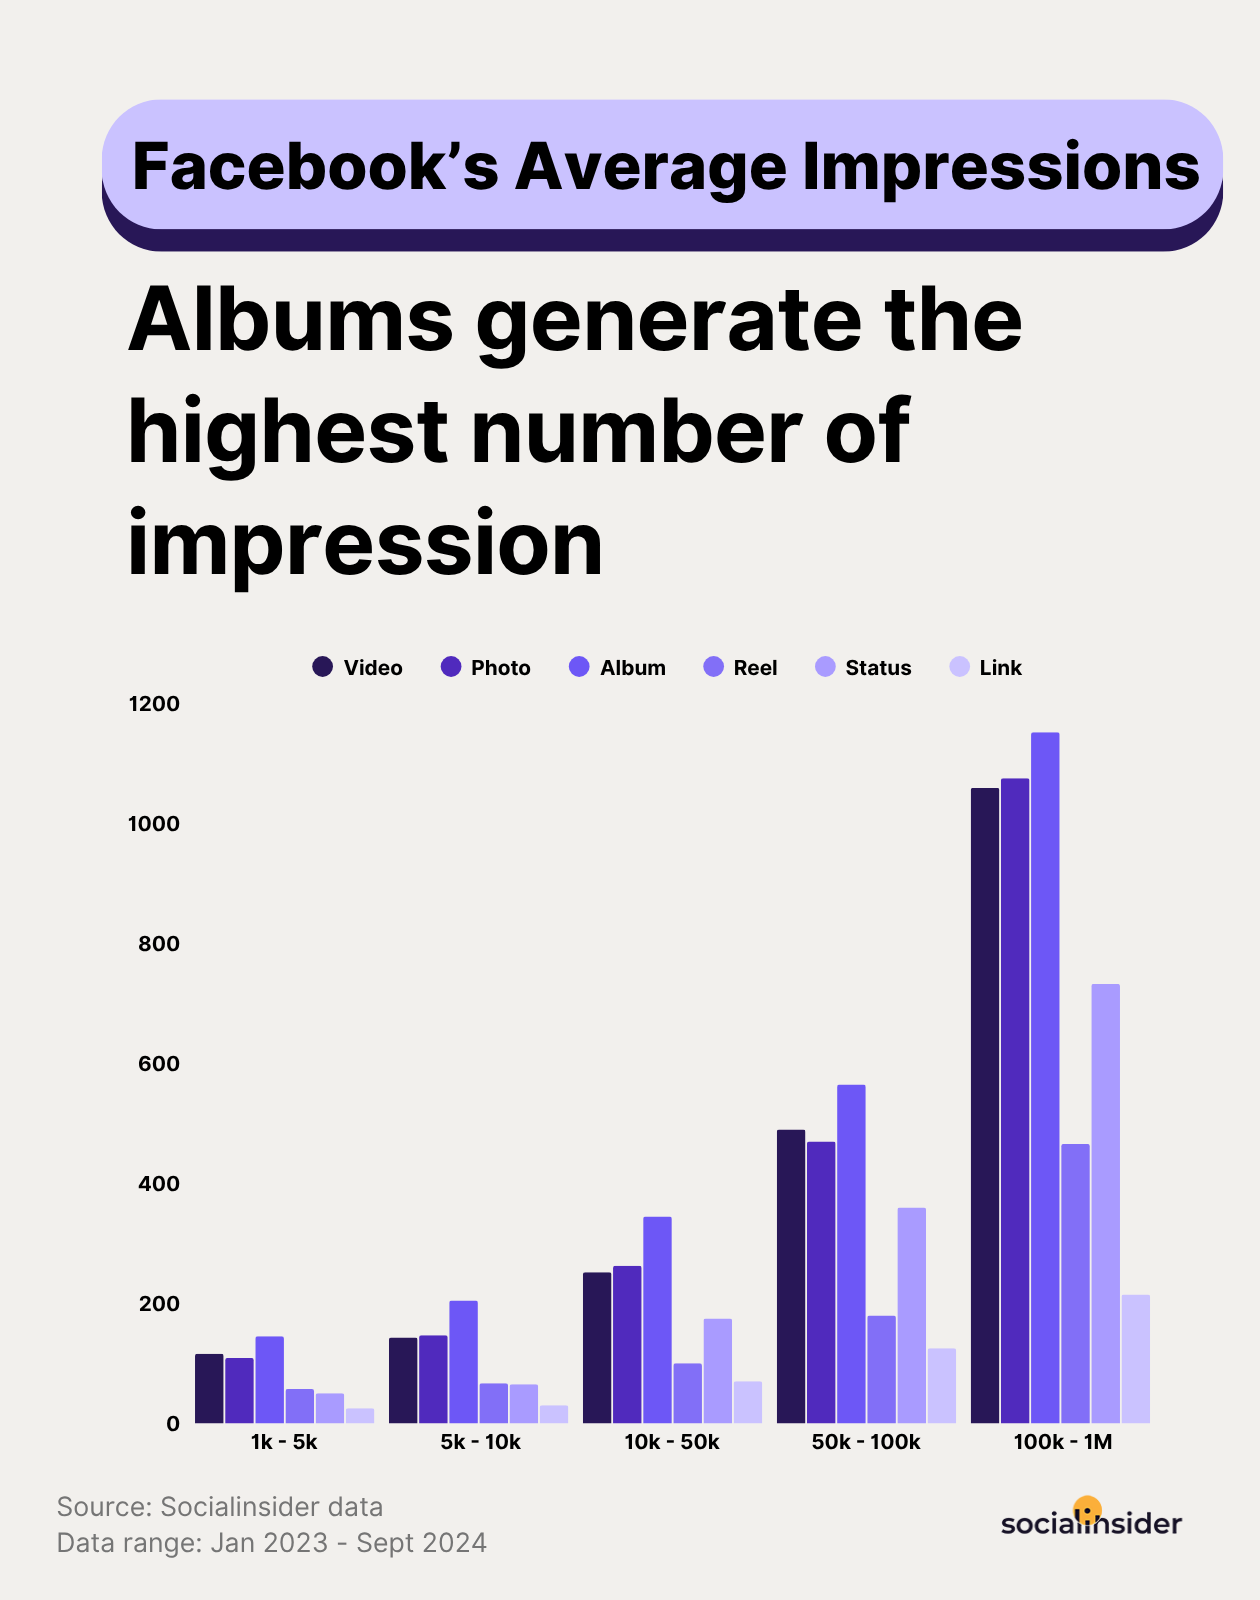
Albums generate the highest number of impressions on Facebook, followed by videos and single image posts. For accounts with over 100,000 followers, albums average 1,153 impressions per post. The number drops to just 145 for accounts with fewer than 5,000 followers.
Engagement
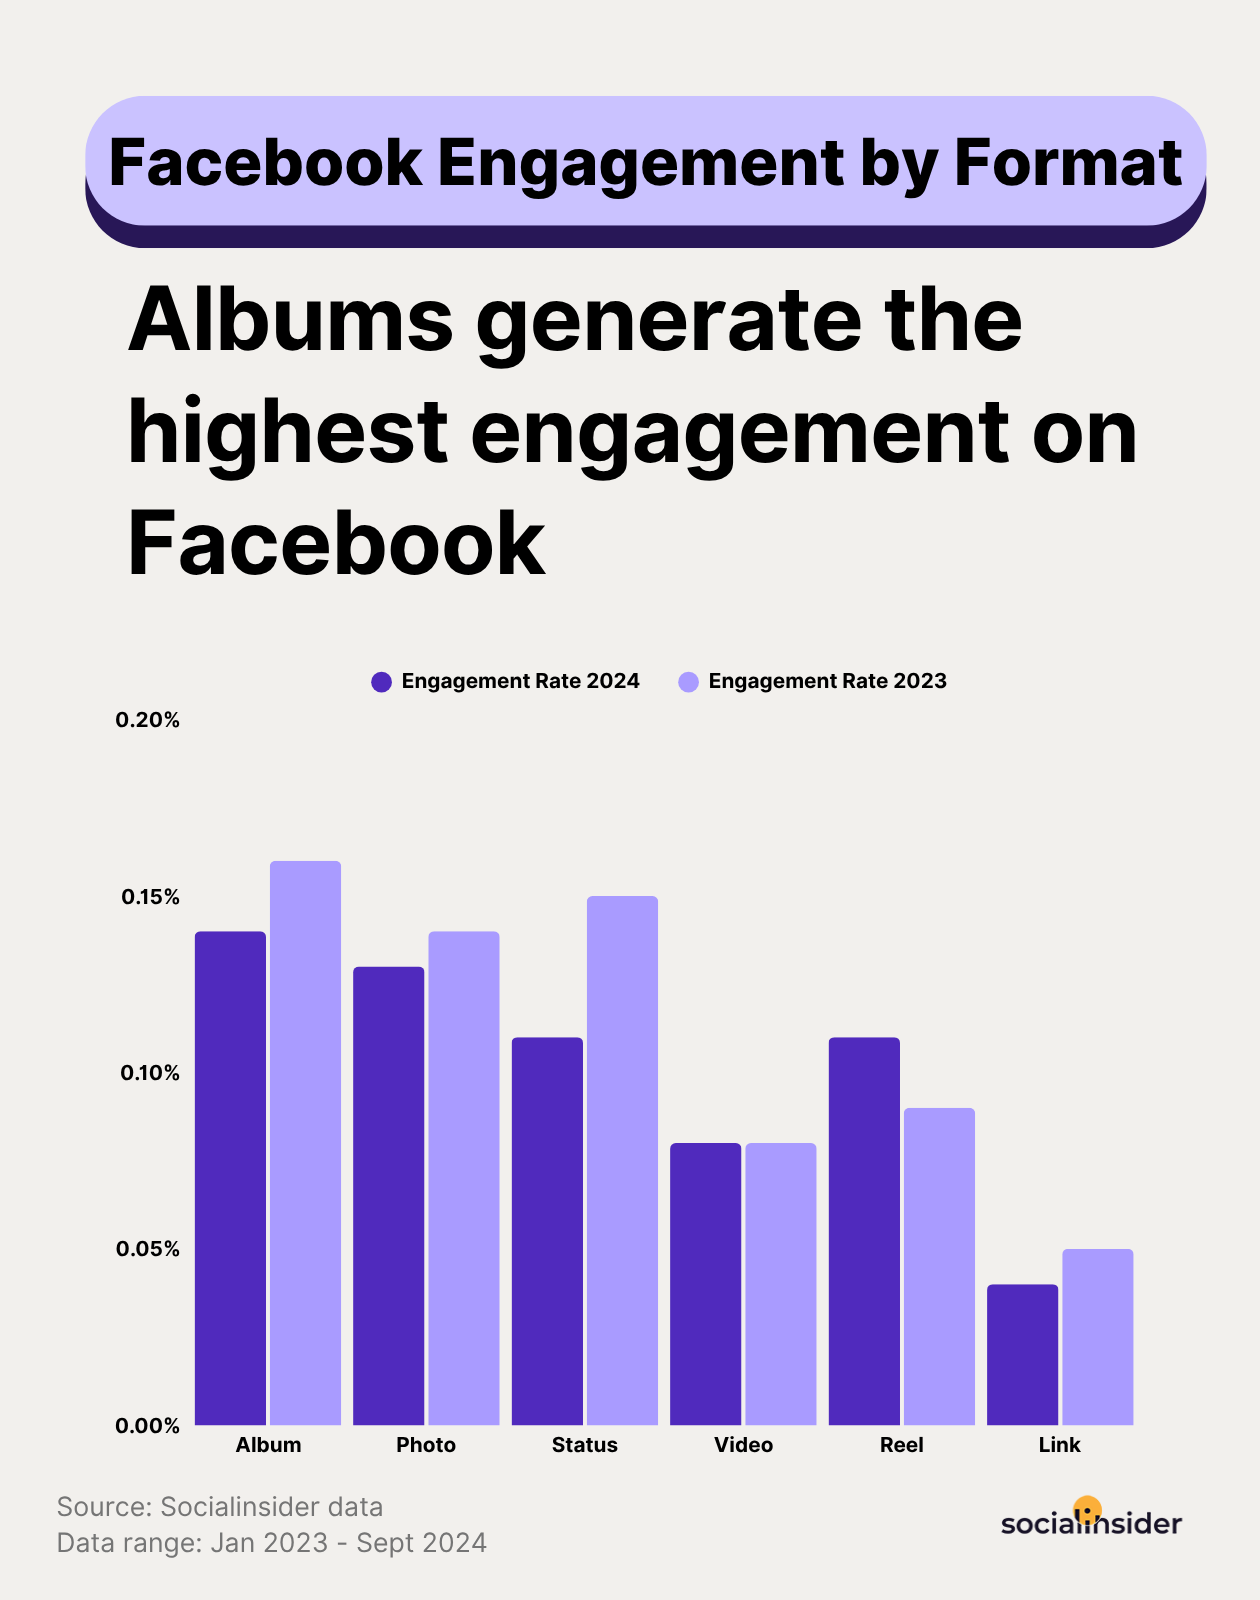
While Facebook’s average engagement rate remains steady at 0.15%, smaller pages, especially those with under 5K followers, tend to perform better with an average of 0.30%.
Photo albums pull the highest engagement on Facebook. Their story-like format encourages more interaction as users browse through multiple images.
Tiktok benchmarks: Impressions vs engagement
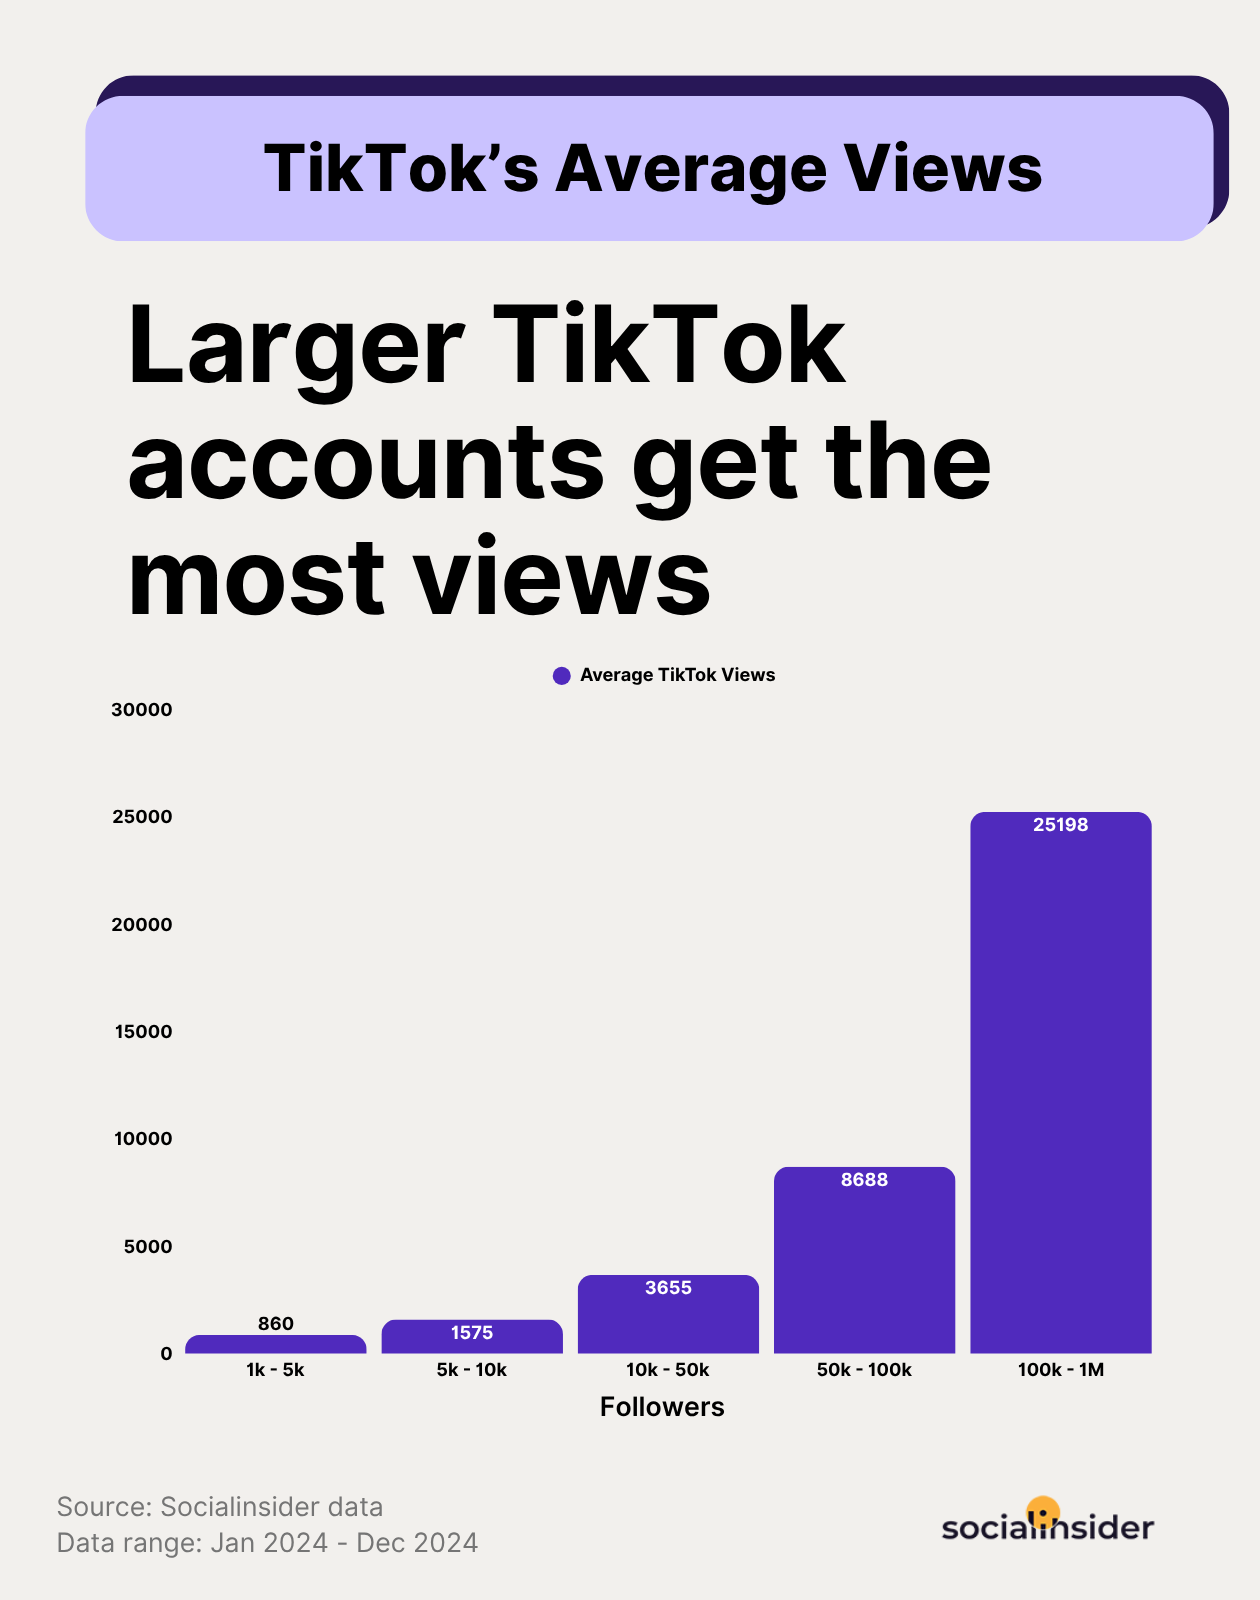
Impressions
On TikTok, larger accounts consistently get the most views. As follower count increases, average views per post grow sharply, especially beyond the 100K mark. This trend proves that follower count isn’t just a vanity metric on TikTok; it’s a direct indicator of organic reach.
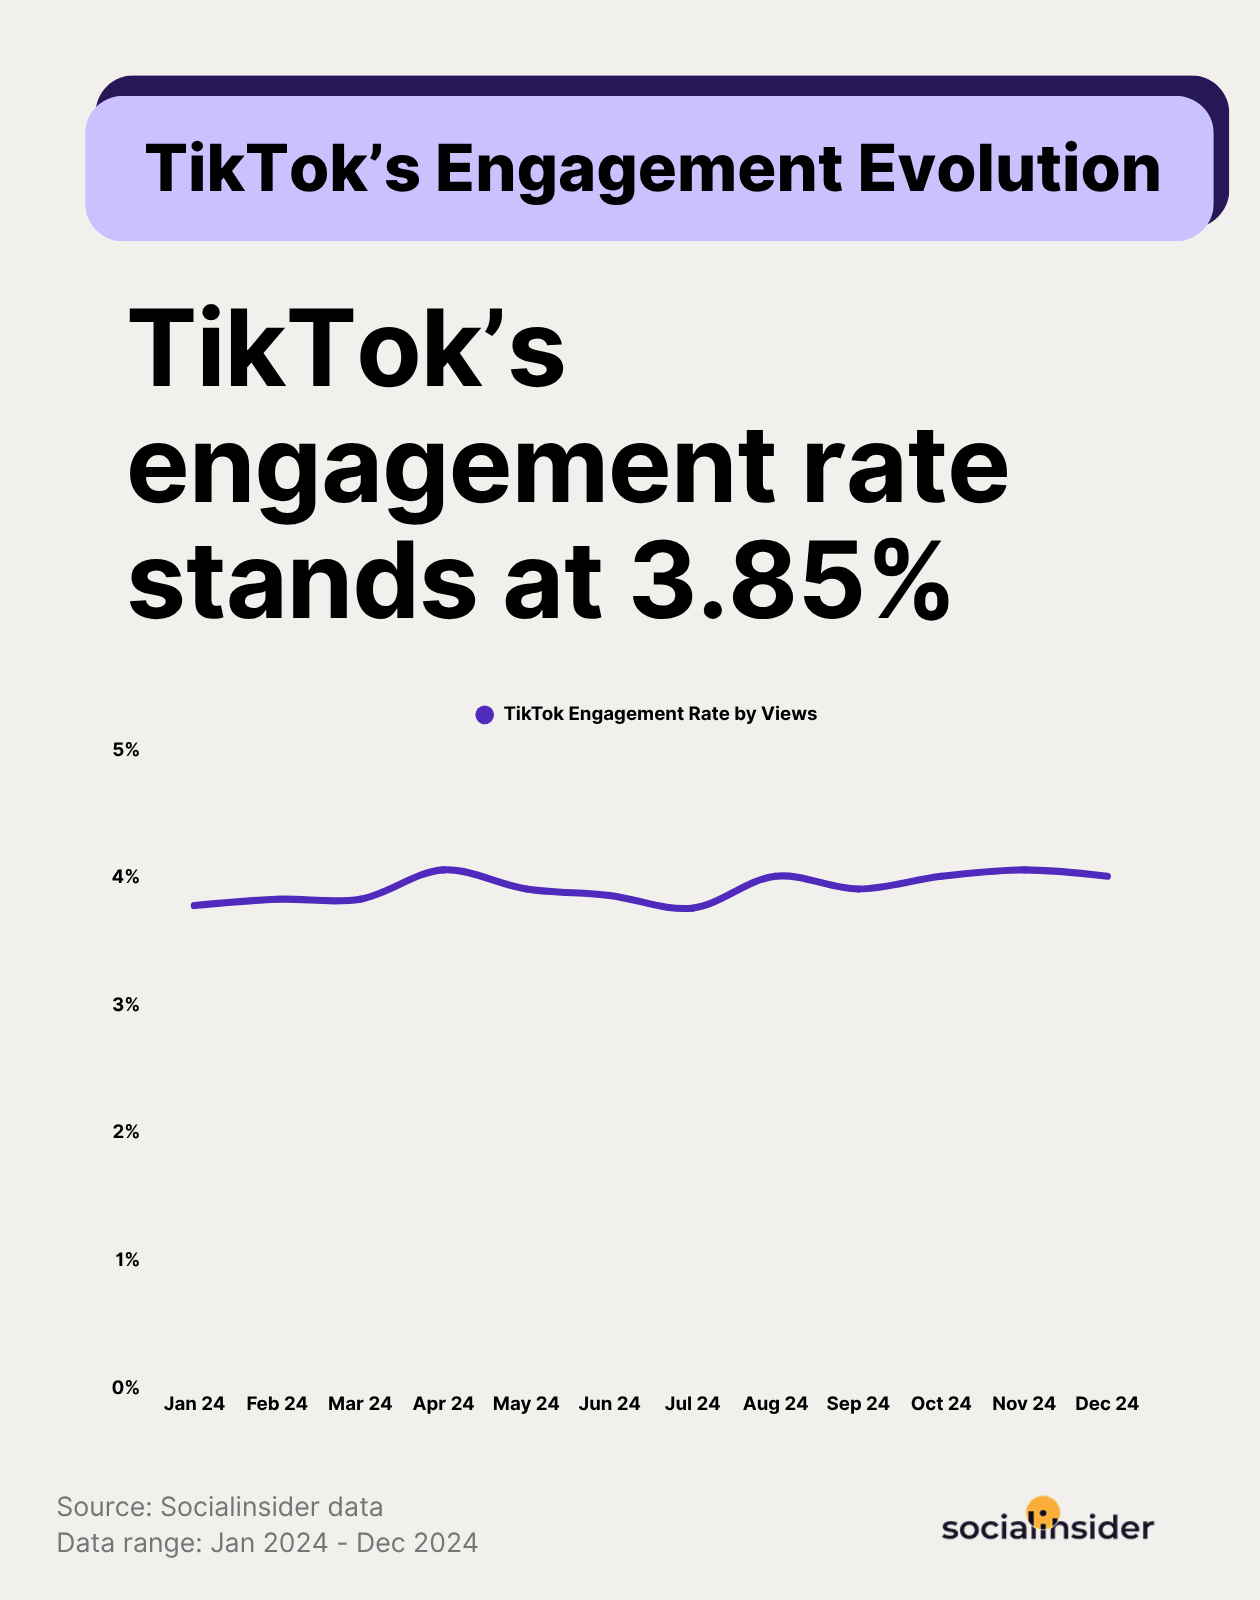
Engagement
TikTok leads all platforms in engagement, possibly driven by a digitally native younger audience.
While the average TikTok engagement rate by views is 3.85%, accounts with fewer than 5K followers have an average of 4.2%.
That’s because the content from smaller accounts often feels more personal and relatable. Larger accounts have higher reach, but the overall content-to-engagement ratio is lower.
LinkedIn benchmarks: Impressions vs engagement
Impressions
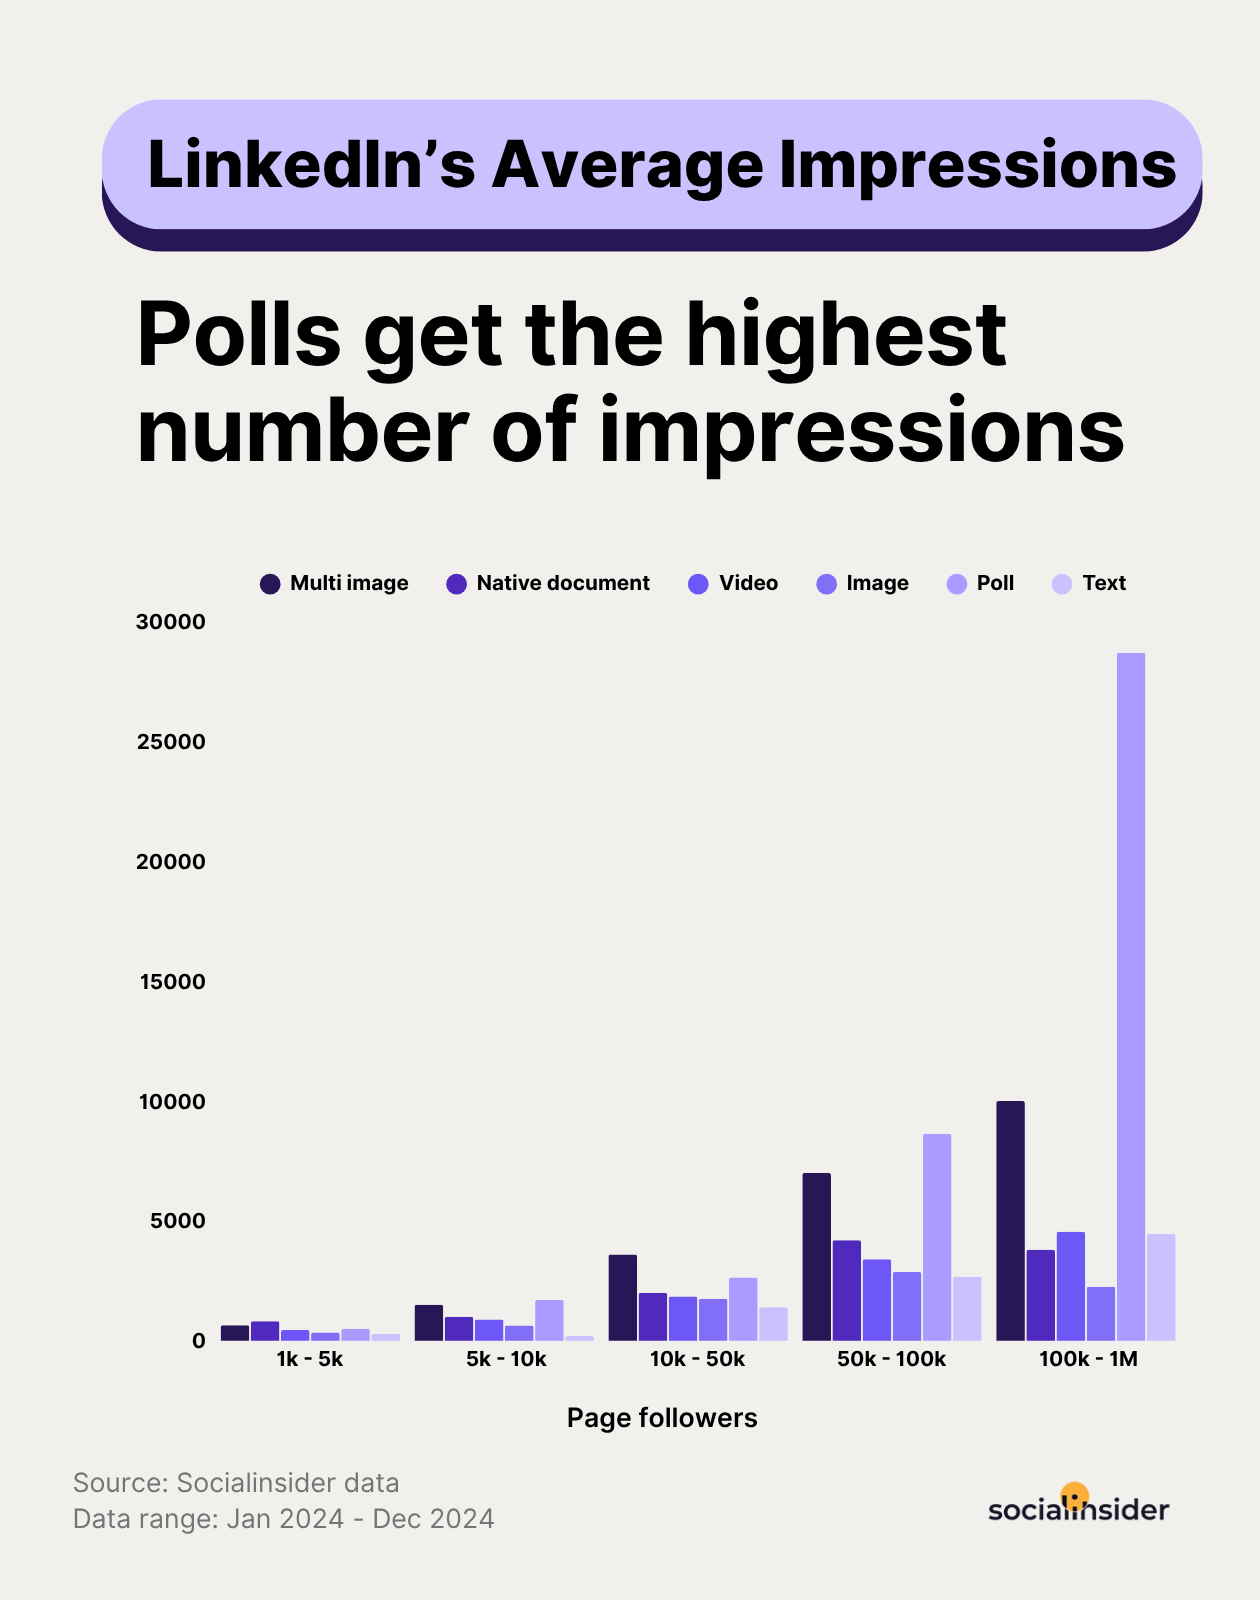
In 2025, polls are dominating impressions on LinkedIn, and they are outperforming every other content format by a wide margin. When tied to trending topics or bold opinions, polls can be a great way to gain visibility on the platform.
But interestingly, for smaller accounts with less than 5k followers, native documents get the highest impressions, followed by multi-image posts and polls.
Text-only posts get the fewest impressions.
Engagement
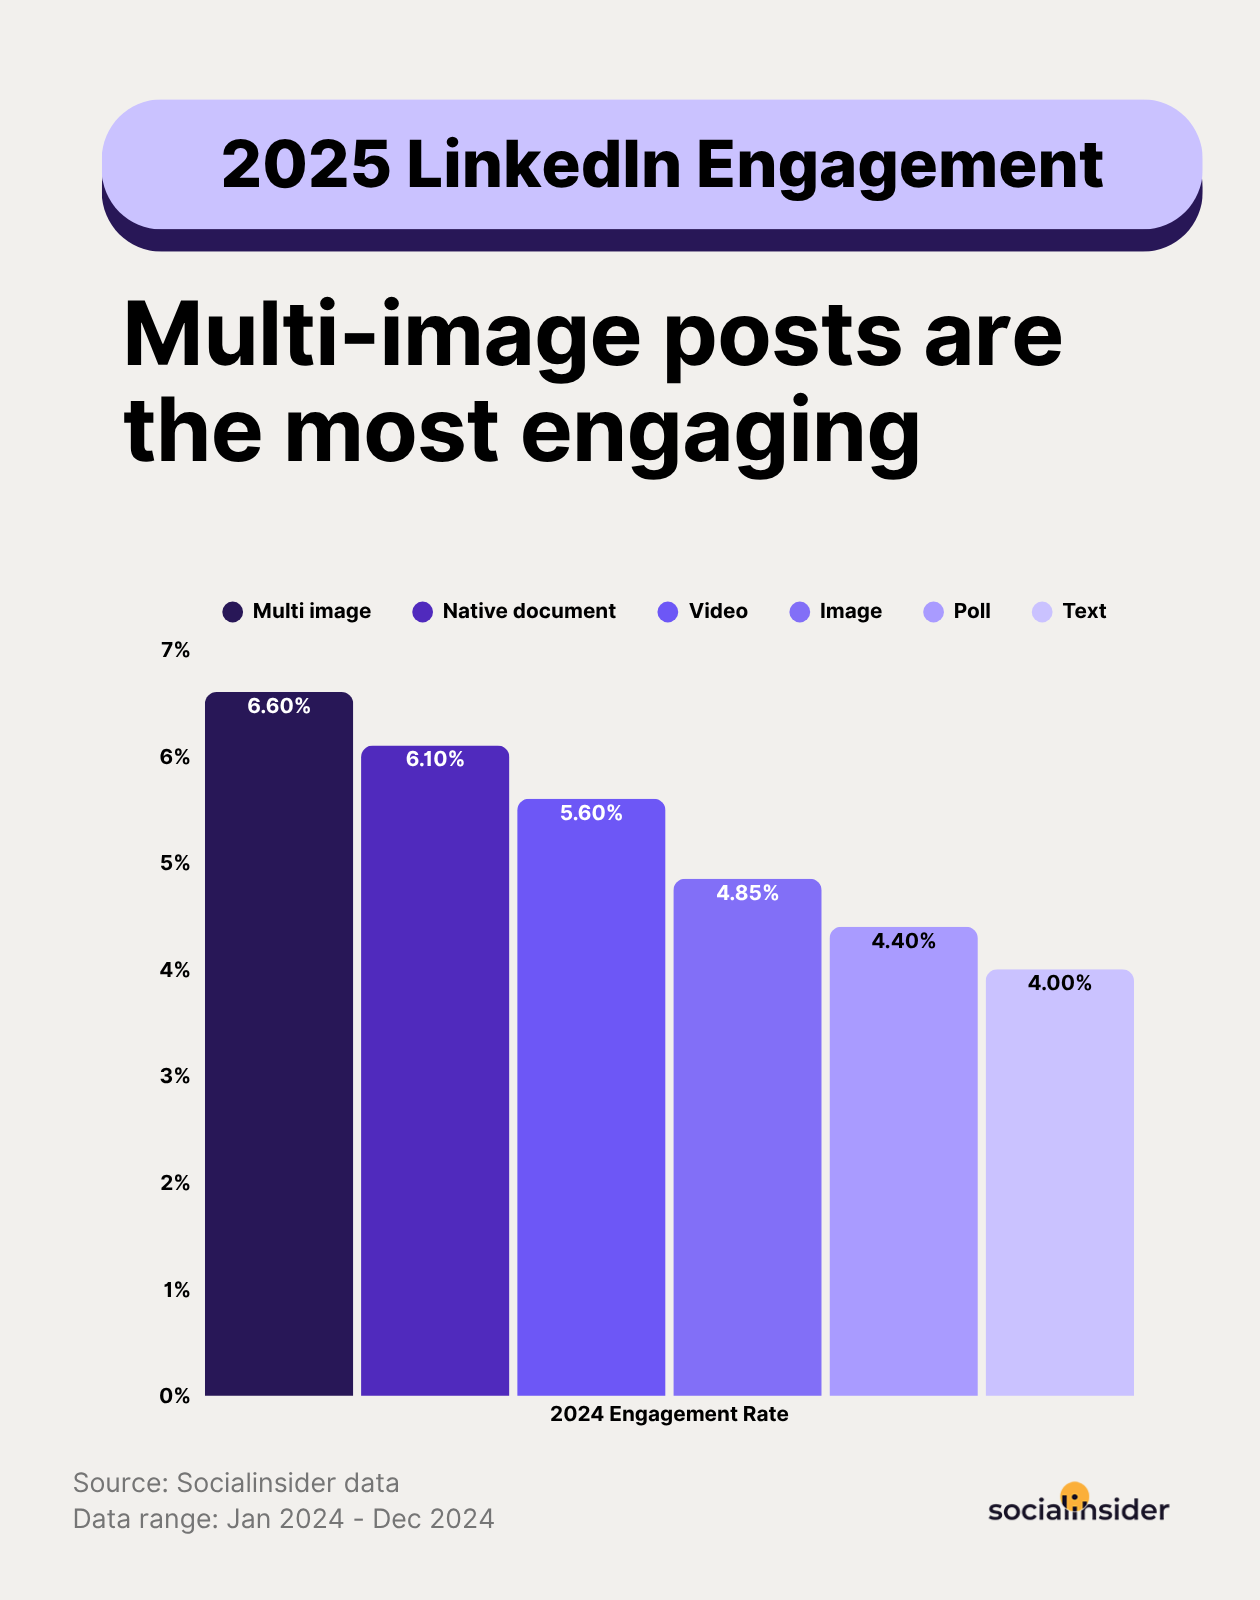
Multi-image posts have the highest LinkedIn engagement at 6.6%. Native documents follow closely at 6.1%, offering a format that invites users to slow down and engage with in-depth content.
Videos have seen a major jump in engagement and now stand at 5.6%. Meanwhile, text-only posts remain the weakest performers at just 4%.
What are the best tools for impressions and engagement measurement?
There are two ways to measure impressions and engagement for your social media channels: You can either check the native analytics available on each platform, or you can use a cross-channel social media analytics tool that lets you analyze data across all the different platforms. Both of these have their own pros and cons. Let’s take a look.
Native platform analytics
Most platforms, including Instagram, Facebook, TikTok, and LinkedIn, offer native analytics dashboards where you can view your profile’s performance data from the past few months. These dashboards are useful for checking quick performance snapshots.
But these tools have some limitations:
- Historical insights usually max out at 30-90 days
- Custom reporting options are minimal
- With limited historical data, exports are also limited, which makes it difficult to build long-term trend reports
Third-party analytics tools
For seamless cross-platform analytics, consider third-party tools like Socialinsider that offer the flexibility marketers need.
Socialinsider is a social media analytics and competitive benchmarking tool that pulls real-time and historical data from all the major social media platforms to help you uncover trends, compare performance, and identify what truly works.
With Socialinsider, you get:
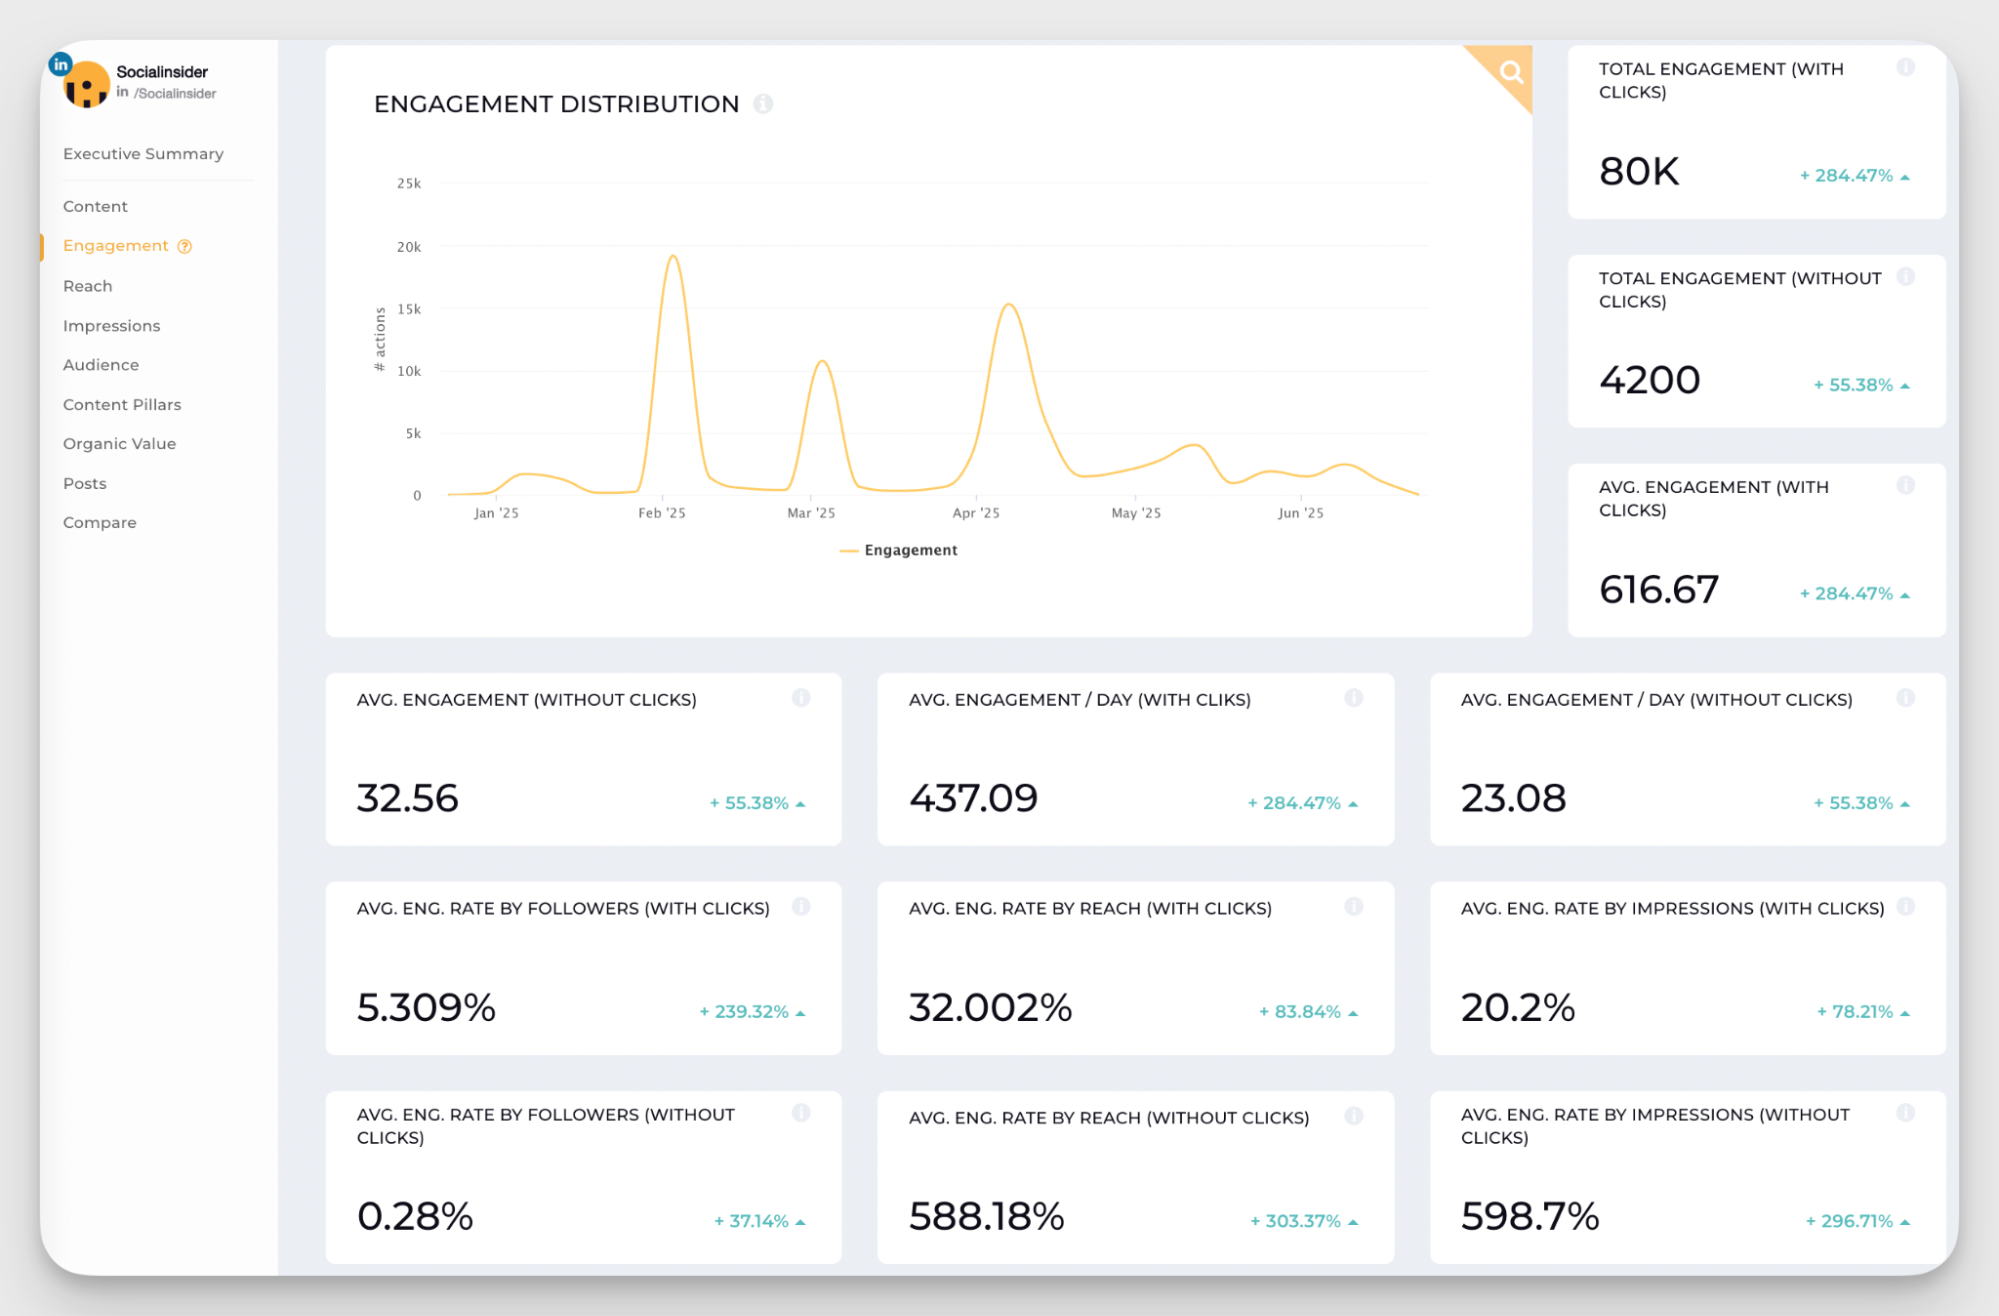
- Cross-platform analytics for LinkedIn, Instagram, TikTok, Facebook, and more–all in one dashboard
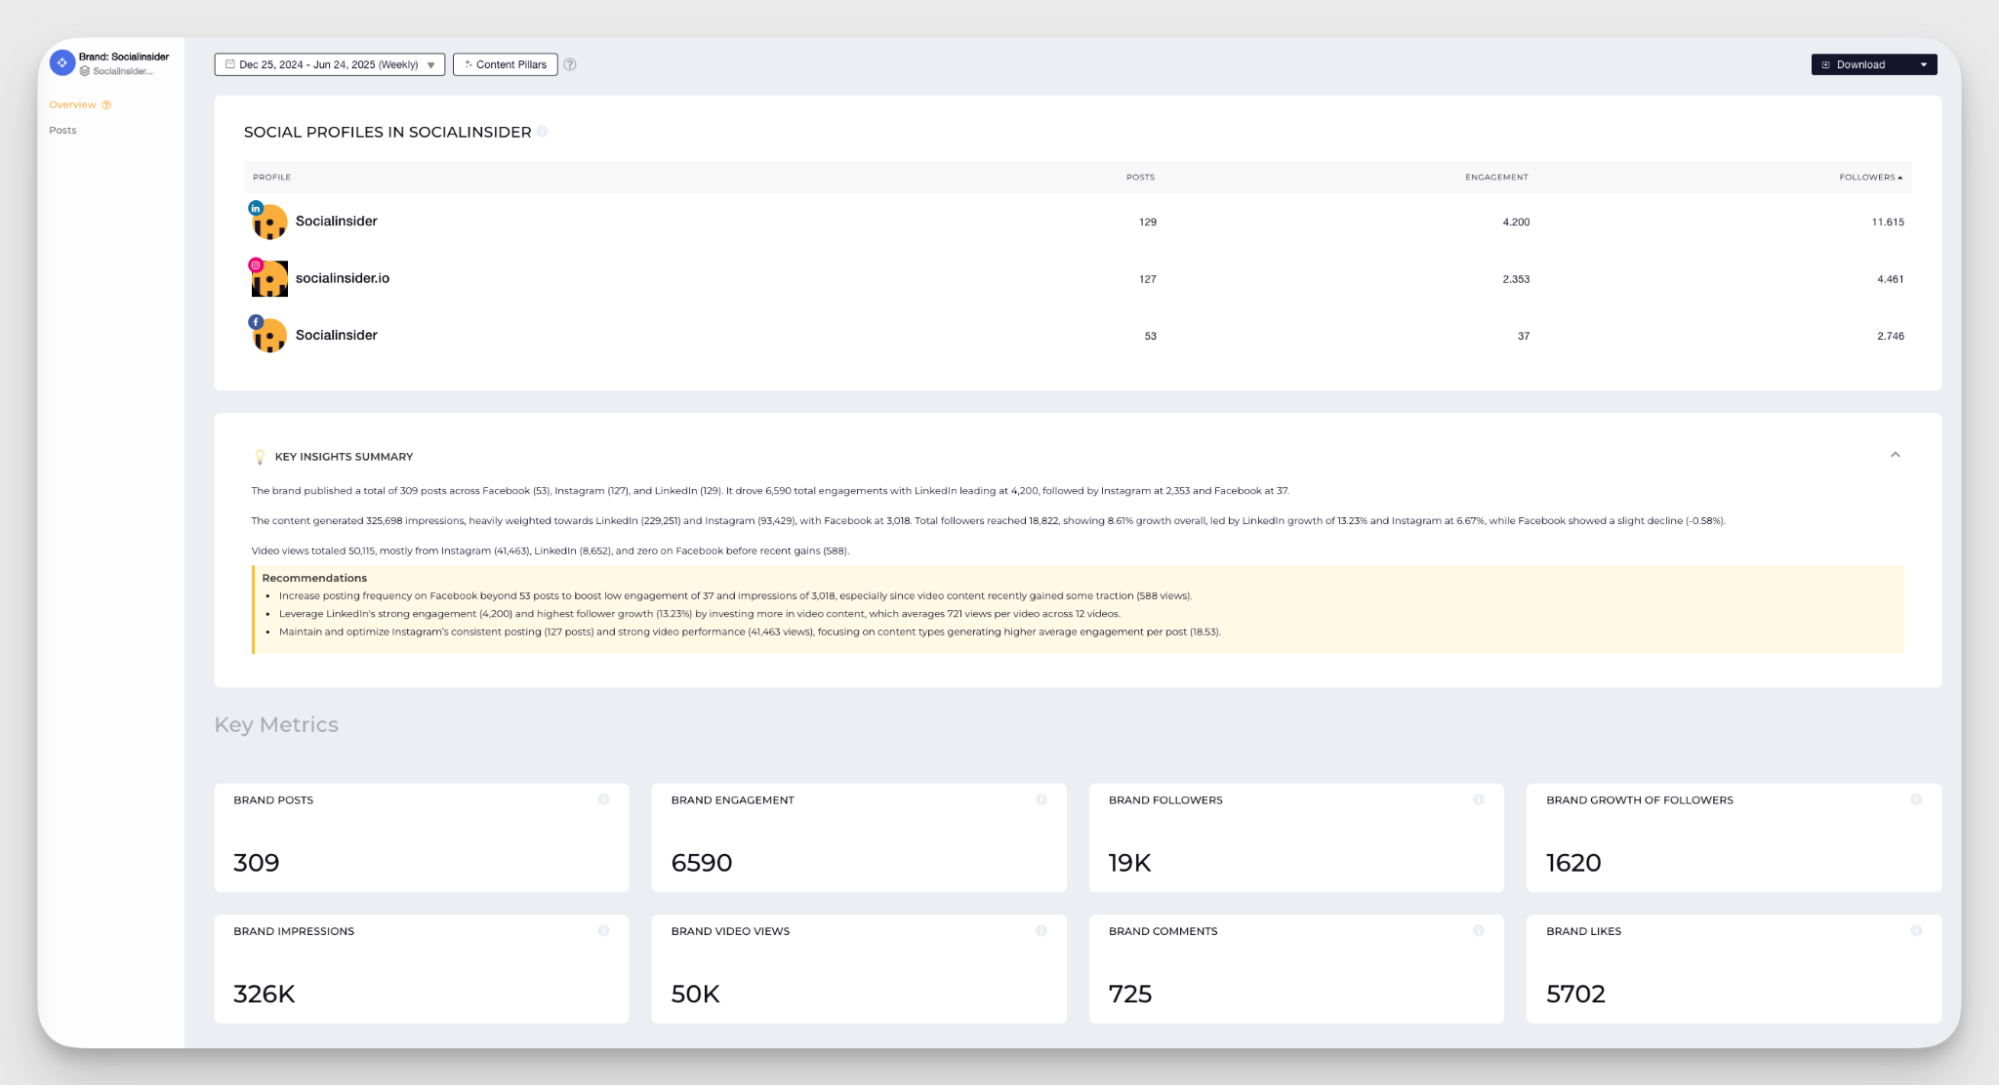
- Deeper metrics for engagement and impressions, content-type breakdowns, and best times to post
- Access to extended historical data for year-over-year benchmarking
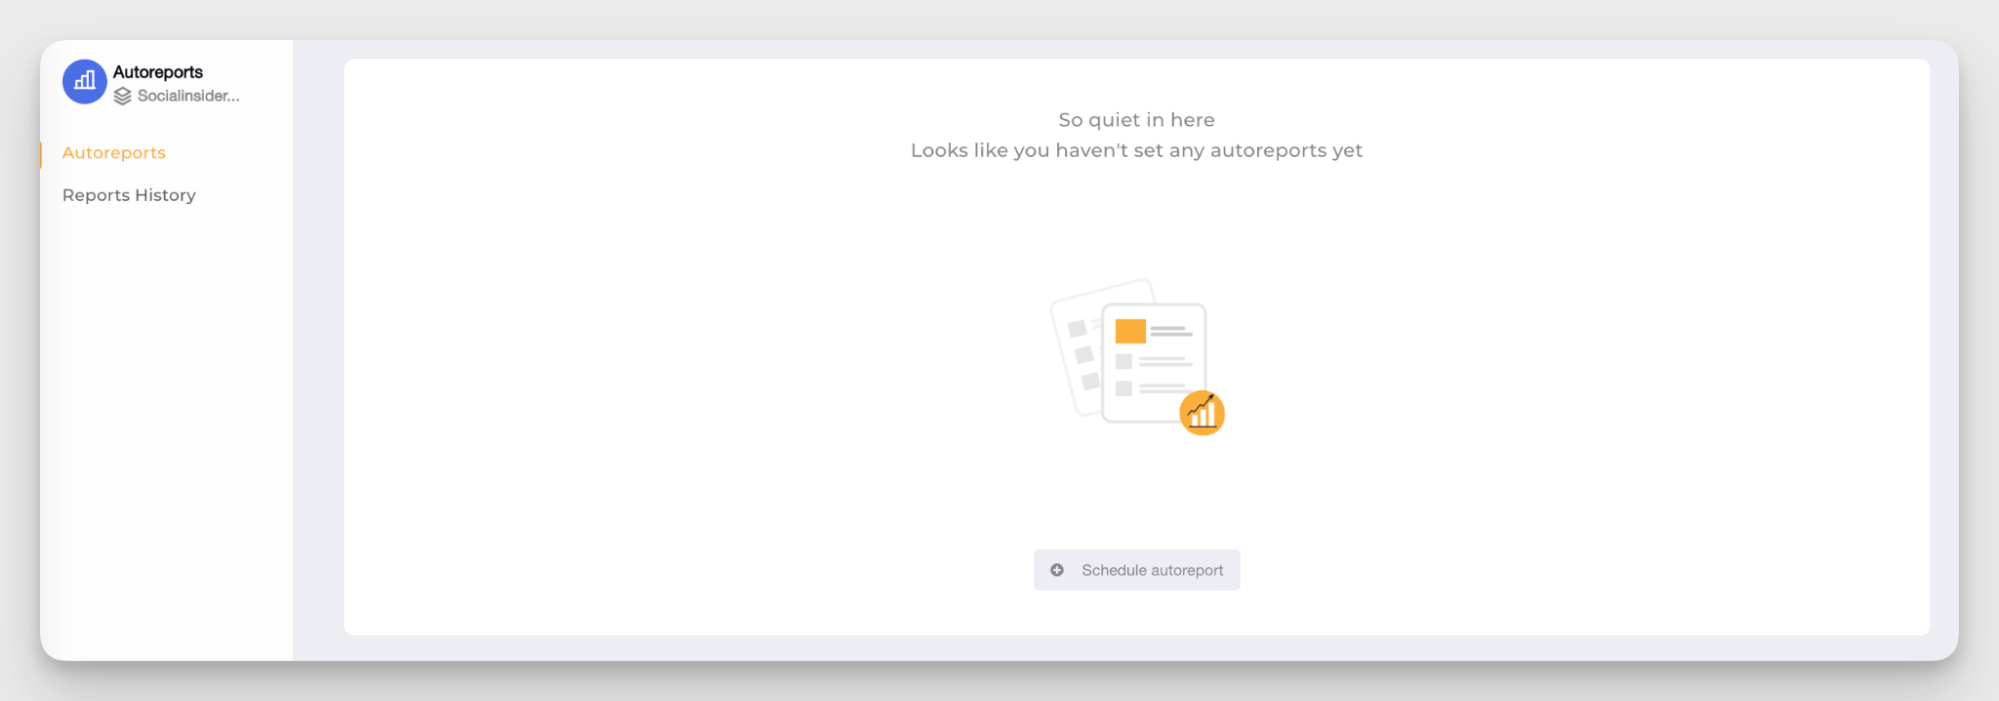
- Automated and customized reporting to streamline monthly and quarterly reporting for stakeholders and clients
Final thoughts
Both impressions and engagement matter—individually and together—when evaluating the impact of your social media efforts. But knowing when to emphasize each metric is what enables leaders to make sharper, more confident strategic decisions.
For teams where social media is becoming a more influential communication and competitive channel, pairing impressions (visibility) with engagement (resonance) reveals whether your brand is not only being seen, but remembered.
Socialinsider brings impressions, engagement, and cross-platform benchmarks into one unified dashboard, giving you the clarity needed to guide your team, refine your strategy, and communicate results with confidence. You can explore all these insights yourself by starting a FREE 14-day trial.
FAQs about impressions vs engagement
1. Which is better, impressions or engagement?
Well, it depends on your goals. Impressions are great for tracking how often your content is being seen. Engagement, on the other hand, measures how people are responding to your content through likes, comments, shares, or clicks. Track impressions for brand awareness and engagement for conversion-focused campaigns. You can also track both to understand how visible and effective your content really is.
2. How many impressions are good on each platform?
There’s no universal benchmark for ’good’ impressions. It depends on your account size, industry, and the platform you’re using. For example, TikTok averages over 6,000 impressions per post, while Instagram averages around 2,600. Instead of chasing a fixed number, check the benchmarks specific to your industry and follower range for each platform. Focus on how your impressions trend over time, and how they compare to reach and engagement to get a clearer picture of performance.
Ritika Tiwari
Ritika Tiwari is a content writer and strategist with over 10 years of experience creating content for SaaS B2B brands. Outside of work, you’ll likely find her somewhere near the ocean.

Analyze your competitors in seconds
Track & analyze your competitors and get top social media metrics and more!
You might also like


Improve your social media strategy with Socialinsider!
Use in-depth data to measure your social accounts’ performance, analyze competitors, and gain insights to improve your strategy.