8 Best Facebook Analytics Tools to Gather Powerful Insights and Skyrocket Performance
Discover powerful Facebook analytics tools to enhance your strategy. Track performance, gain insights, and optimize your campaigns effectively.

With so many Facebook analytics tools promising ‘all-in-one’ insights, picking the right one can feel like scrolling through an endless feed of options that all look the same.
The truth is, Facebook analytics tools help you track performance, understand your audience, benchmark against competition, and uncover what actually drives engagement. But finding the right fit? That’s a whole other story.
So, I put a bunch of them to test, measuring everything from usability to advanced social media analytics features, and handpicked the 8 best Facebook analytics tools. Let’s look at each one.
Key takeaways
-
Where Facebook’s native analytics fall short: Facebook’s built-in analytics offer only basic insights, while third-party tools fill the gaps with competitive benchmarking, historical data, customization, and advanced reporting features.
-
What to consider when choosing a Facebook analytics tool: When selecting a Facebook analytics tool, focus on data coverage, integration accuracy, reporting flexibility, usability, scalability, pricing transparency, and advanced analytics capabilities.
-
Facebook organic performance analytics tools: Tools like Socialinsider, SocialPilot, Brandwatch, and Synthesio excel at tracking organic performance, analyzing audience behavior, benchmarking competitors, and identifying content trends
-
Facebook paid performance analytics tools: For paid ads, platforms like Bïrch, AdEspresso, Northbeam, and HYROS automate optimization, track conversions accurately, and provide granular visibility into ad performance across channels.
-
API limitations of third-party Facebook analytics tools:Third-party tools depend on Facebook’s API, meaning some data points are unavailable or inconsistent, leading to occasional metric gaps or discrepancies with native reports.
Where do Facebook’s native analytics fall short (and why it’s recommended to turn to third-party tools)?
Facebook’s built-in analytics, accessed either through Meta Business Suite or Facebook Page Insights, do a decent job of giving you an overview of your page performance. But I have found it still falls short on a lot of metrics and analysis.
Here are six of them:
- Limited competitive benchmarking: Meta Insights only shows data for pages you manage. You can’t compare your performance against competitors. Third-party tools fill that gap by aggregating and comparing data across multiple brands.
- Restricted data access: Key metrics like video views or follower counts are visible only for connected pages. Facebook blocks access to many data points for public or competitor pages, while third-party tools can bridge some of those gaps through APIs or public data.
- Inconsistent metric calculations: Facebook counts engagement on all posts receiving new interactions within a time range, while third-party tools usually track engagement only on posts published during that period, causing differences in reported numbers.
- Limited reporting and export options: Native reports are rigid, offering minimal customization. Third-party tools provide flexible exports, automated scheduling, and the ability to combine insights from multiple platforms for a unified view.
- Short historical data windows: Meta Insights often limits how far back you can access data. Third-party tools can extend these timeframes, making long-term trend analysis easier.
- Lack of advanced features: Facebook’s analytics lack features like automated benchmarking, content tagging, and multi-platform aggregation, all standard in professional third-party tools.
What should you consider when searching for a Facebook analytics tool?
To make sure you choose the right tool, here’s the criteria I considered when selecting the tools on this list.
- Data coverage and metrics: Choose a tool that tracks reach, impressions, engagement, follower growth, demographics, and content performance. I also included tools that offer historical data and competitor benchmarking for pages you don’t manage.
- Integration and accuracy: I made sure all the tools connect directly to Meta’s API for reliable, real-time data. If you use a tech stack, ensure your analytics tool integrates with the important ones.
- Reporting and customization: Look for customizable reports, flexible formats (PDF, PPT, CSV), and the ability to group multiple pages or brands under one dashboard.
- Usability and scalability: I checked if the interface simplifies comparisons and supports multiple accounts without hassle. Also, confirm how many pages you can track under your plan for scalability in future.
- Pricing and support: Compare pricing based on the number of pages, data access, and features. Strong customer support and onboarding can make a big difference.
- Additional analytics features: Advanced tools may include content tagging, pillar analysis, scheduled reports, or industry benchmarks, ideal for deeper strategy insights.
Facebook organic performance analytics tools
1. Socialinsider — best for content performance and competitor analysis
Using Socialinsider as a Facebook analytics tool is as simple as logging in to your account and adding your profile.
The first thing you see is a clean dashboard with all your important social media KPIs. Think reach, views, follower growth, engagement, and posting frequency. The best part? I can customize this dashboard to display only the metrics that matter to me.
What stands out to me is how in-depth yet easy to navigate the platform feels. The analytics are smartly organized into sections like Content Pillars, Engagement, Reach, Impressions, and so on. It’s structured enough for data pros yet simple enough for beginners.
I may be a little biased here so hear it from our long-term user:
“We are using this social media analytics dashboard for all our 40 social media clients. We can have all the performance data in one single place.” - Arnold Vieriu, Tribal Worldwide
Key features:
- Cross-channel comparison: Get all your social media performance data in one place. Check how your brand performs across platforms for easy comparison and resource allocation.
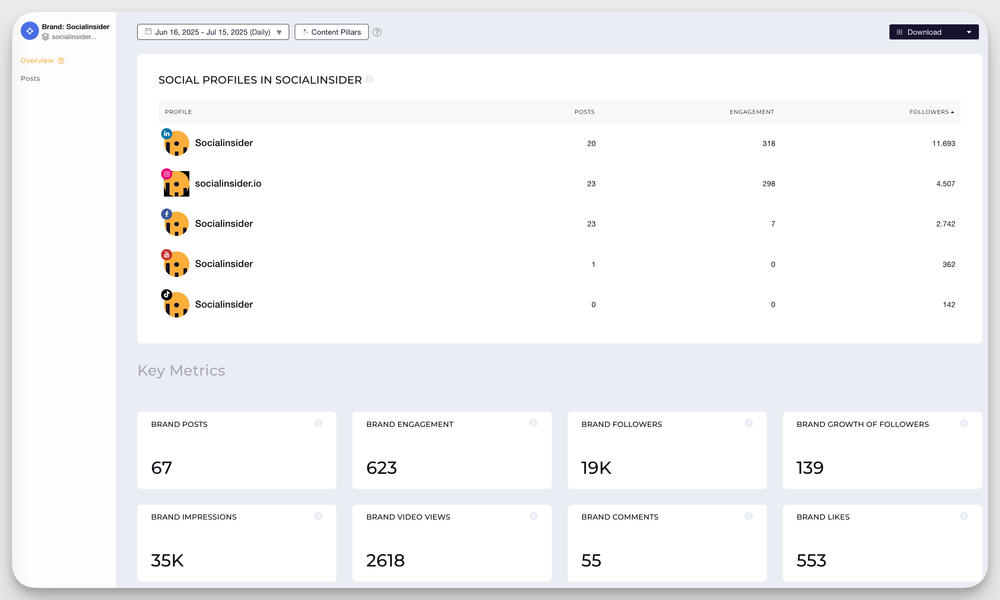
- Advanced Facebook analytics: You get detailed engagement data, such as engagement rate by followers and by reach, engagement by post type, reach and impressions.
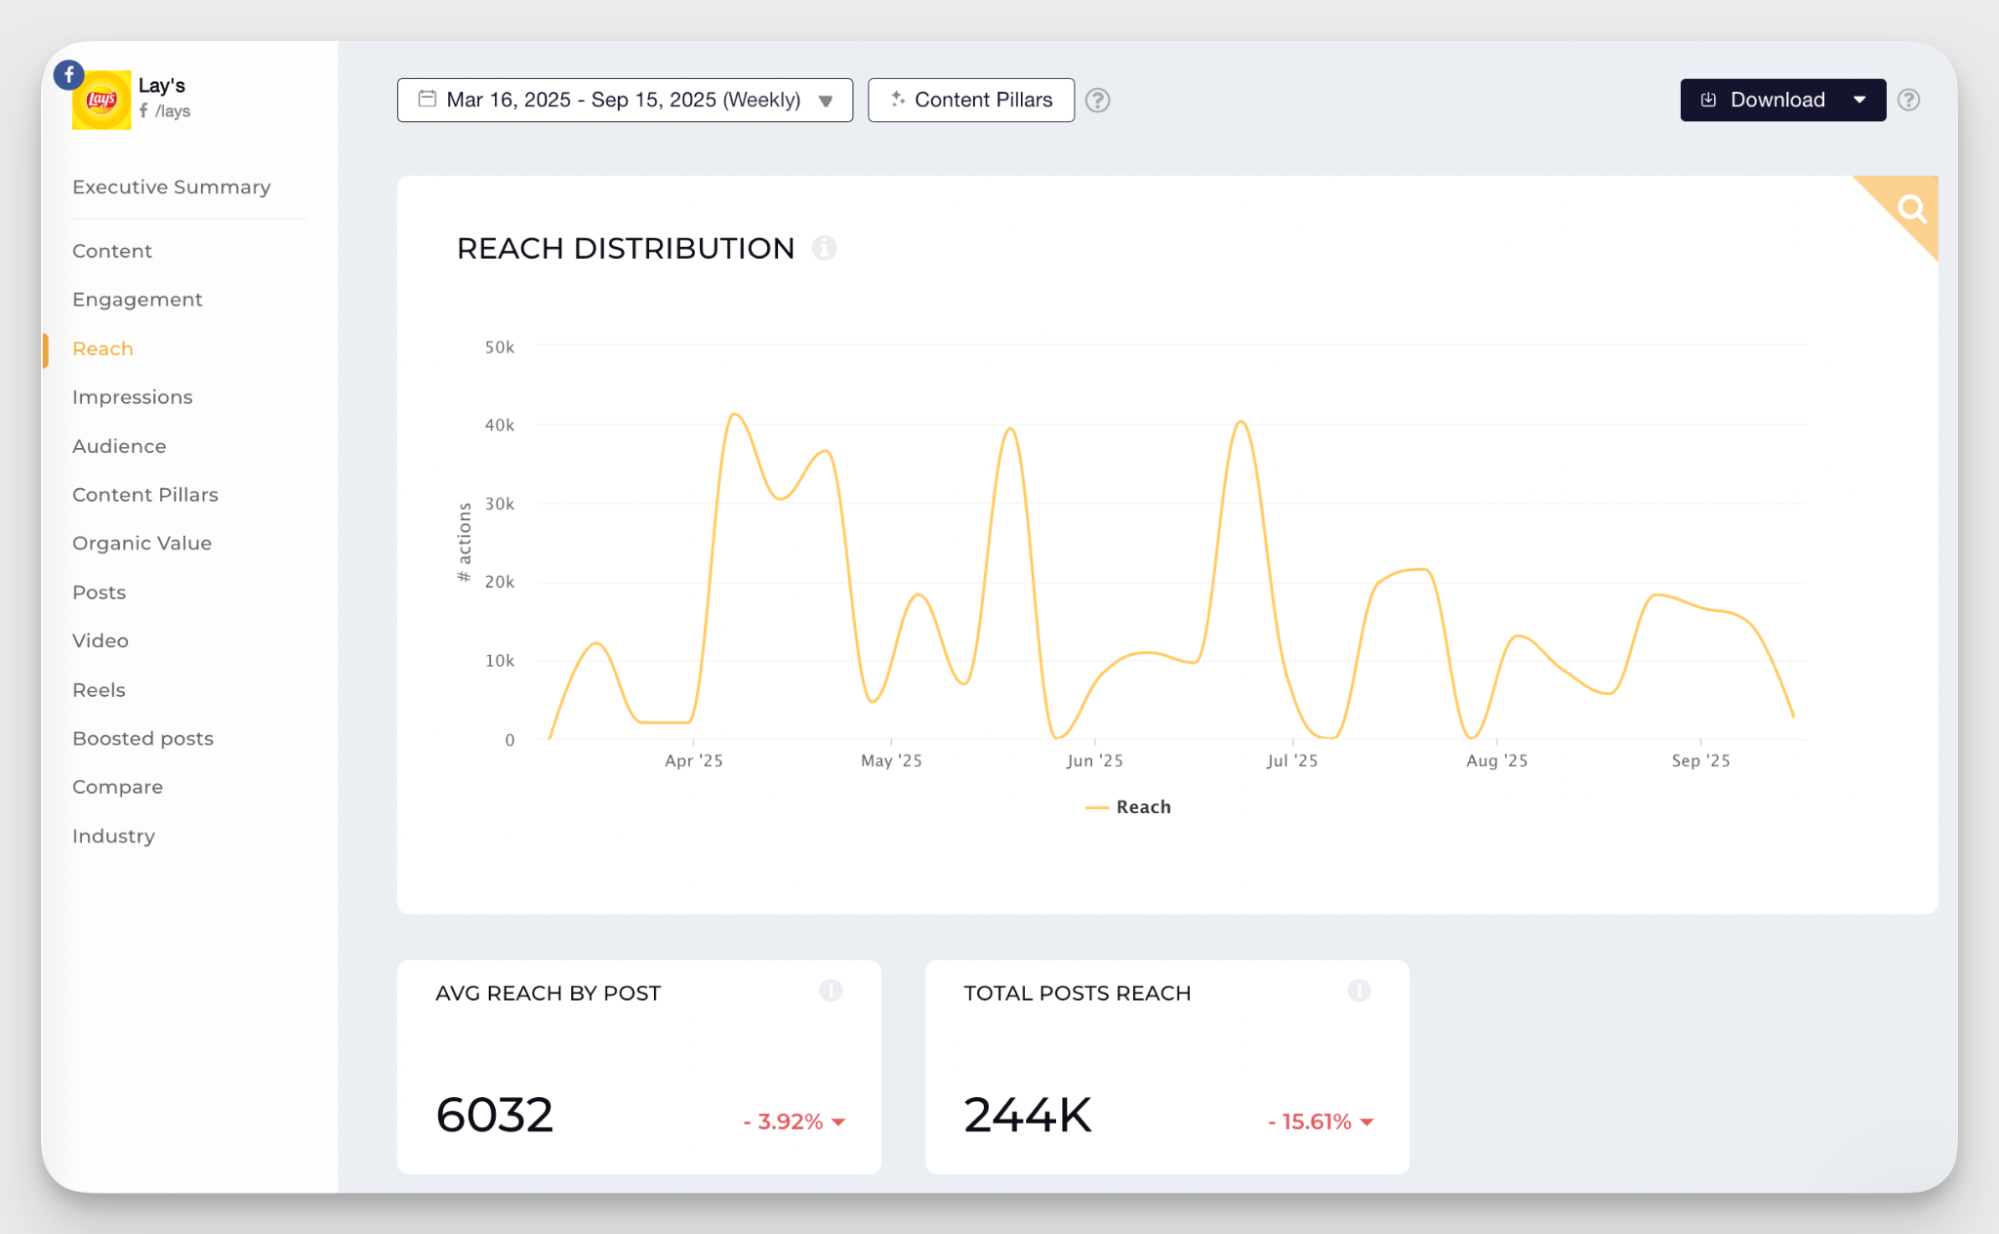
You can even see the top and bottom performing posts for a specific period.
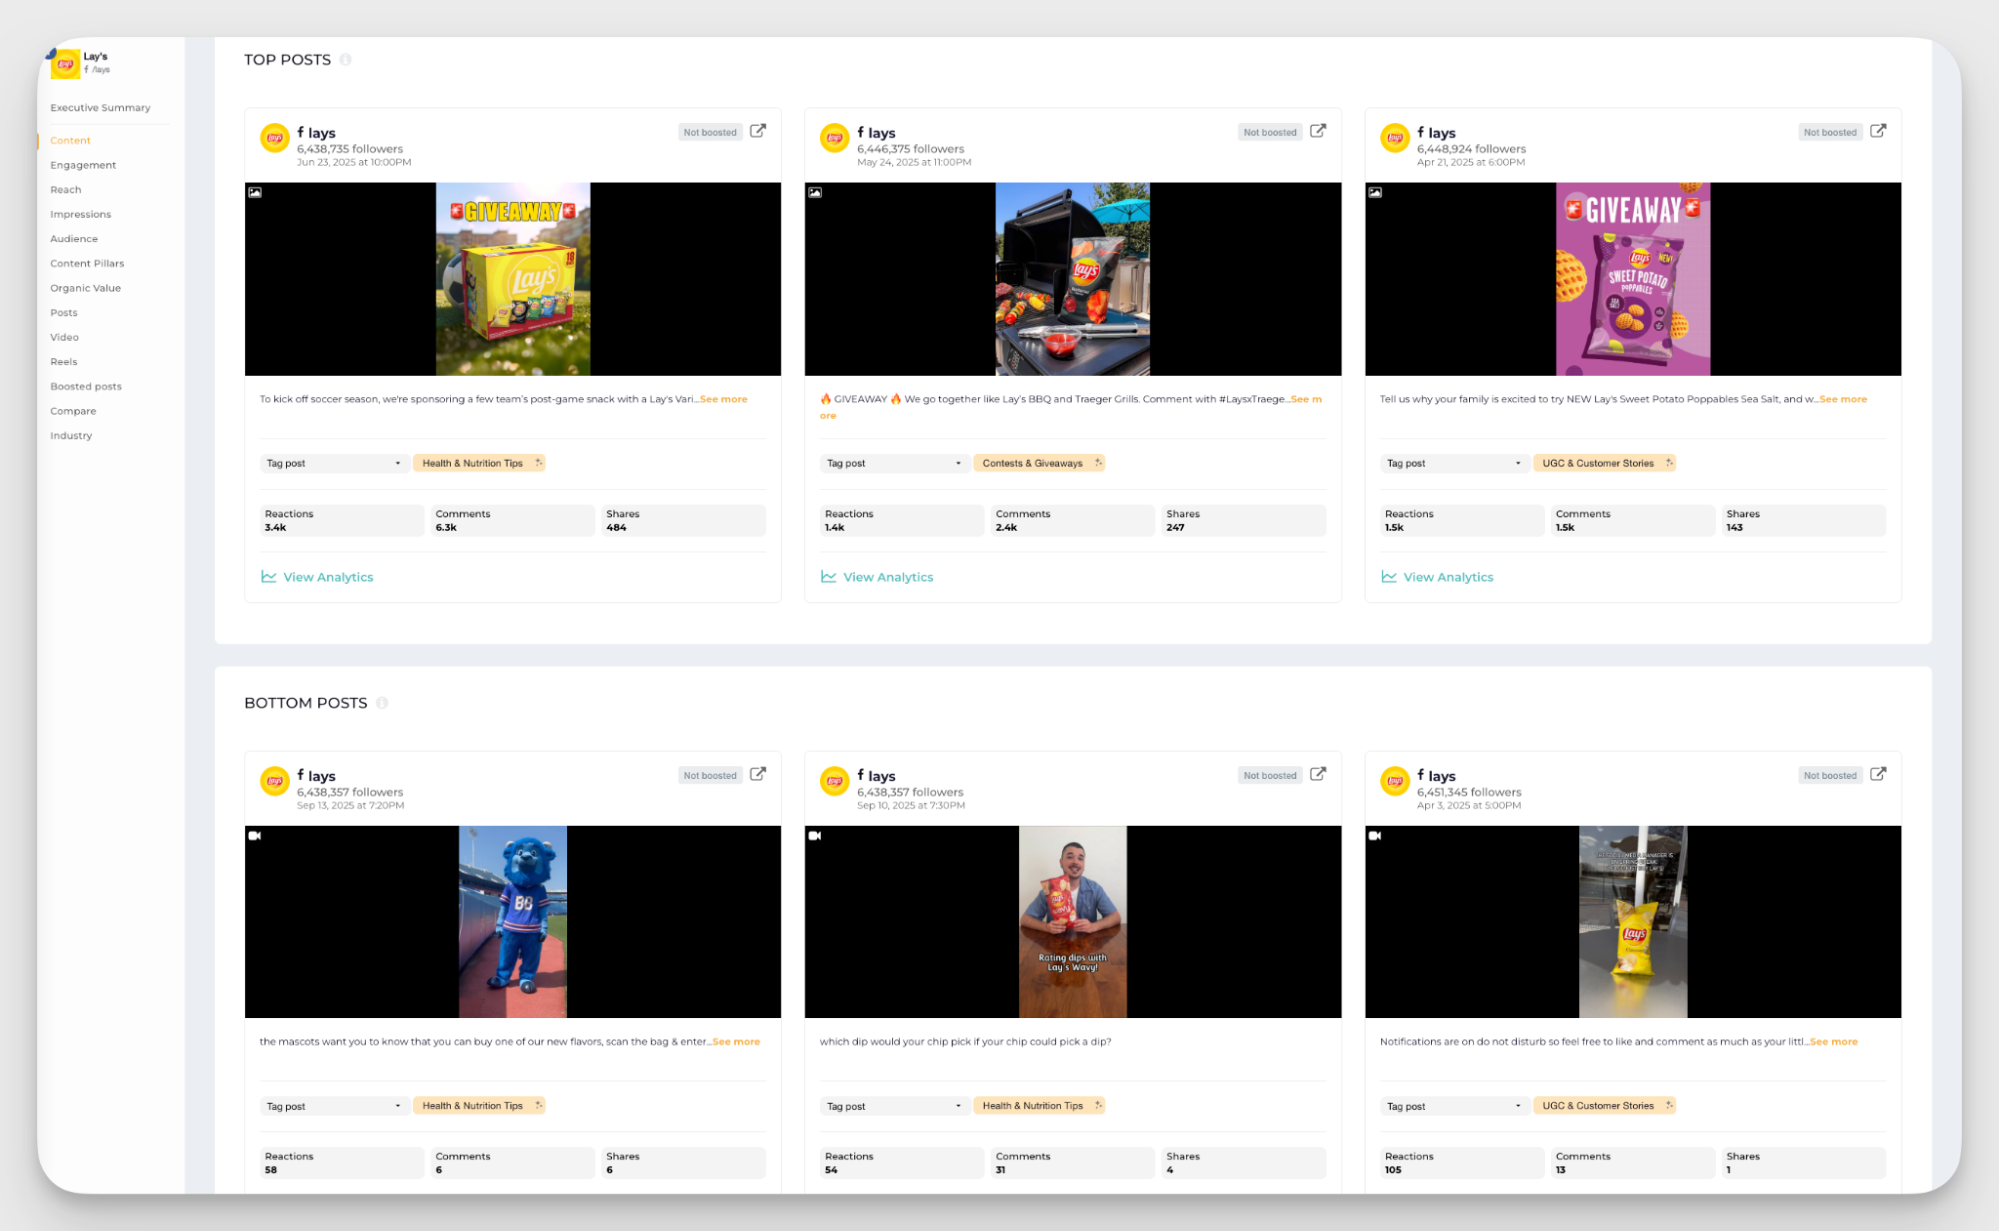
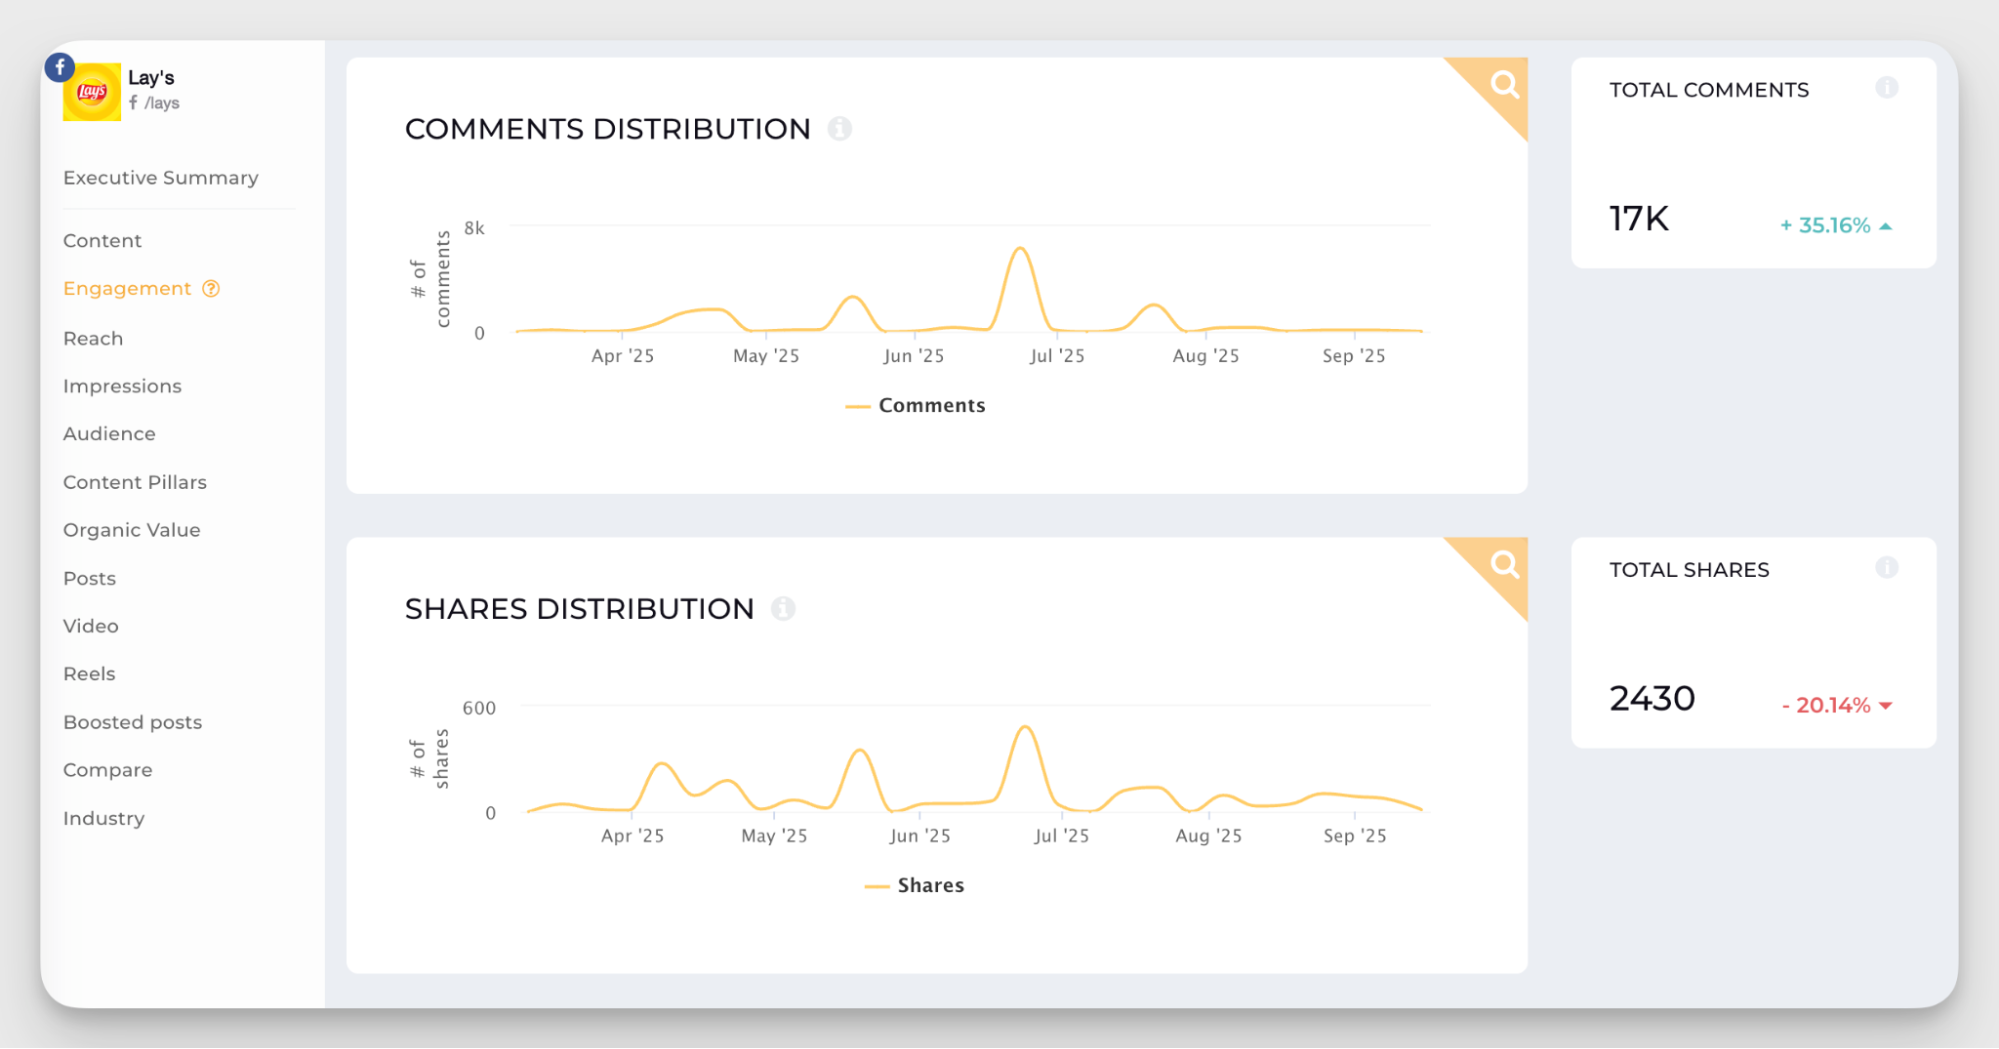
The tool provides simple graphs to show how comments and shares have evolved over time.
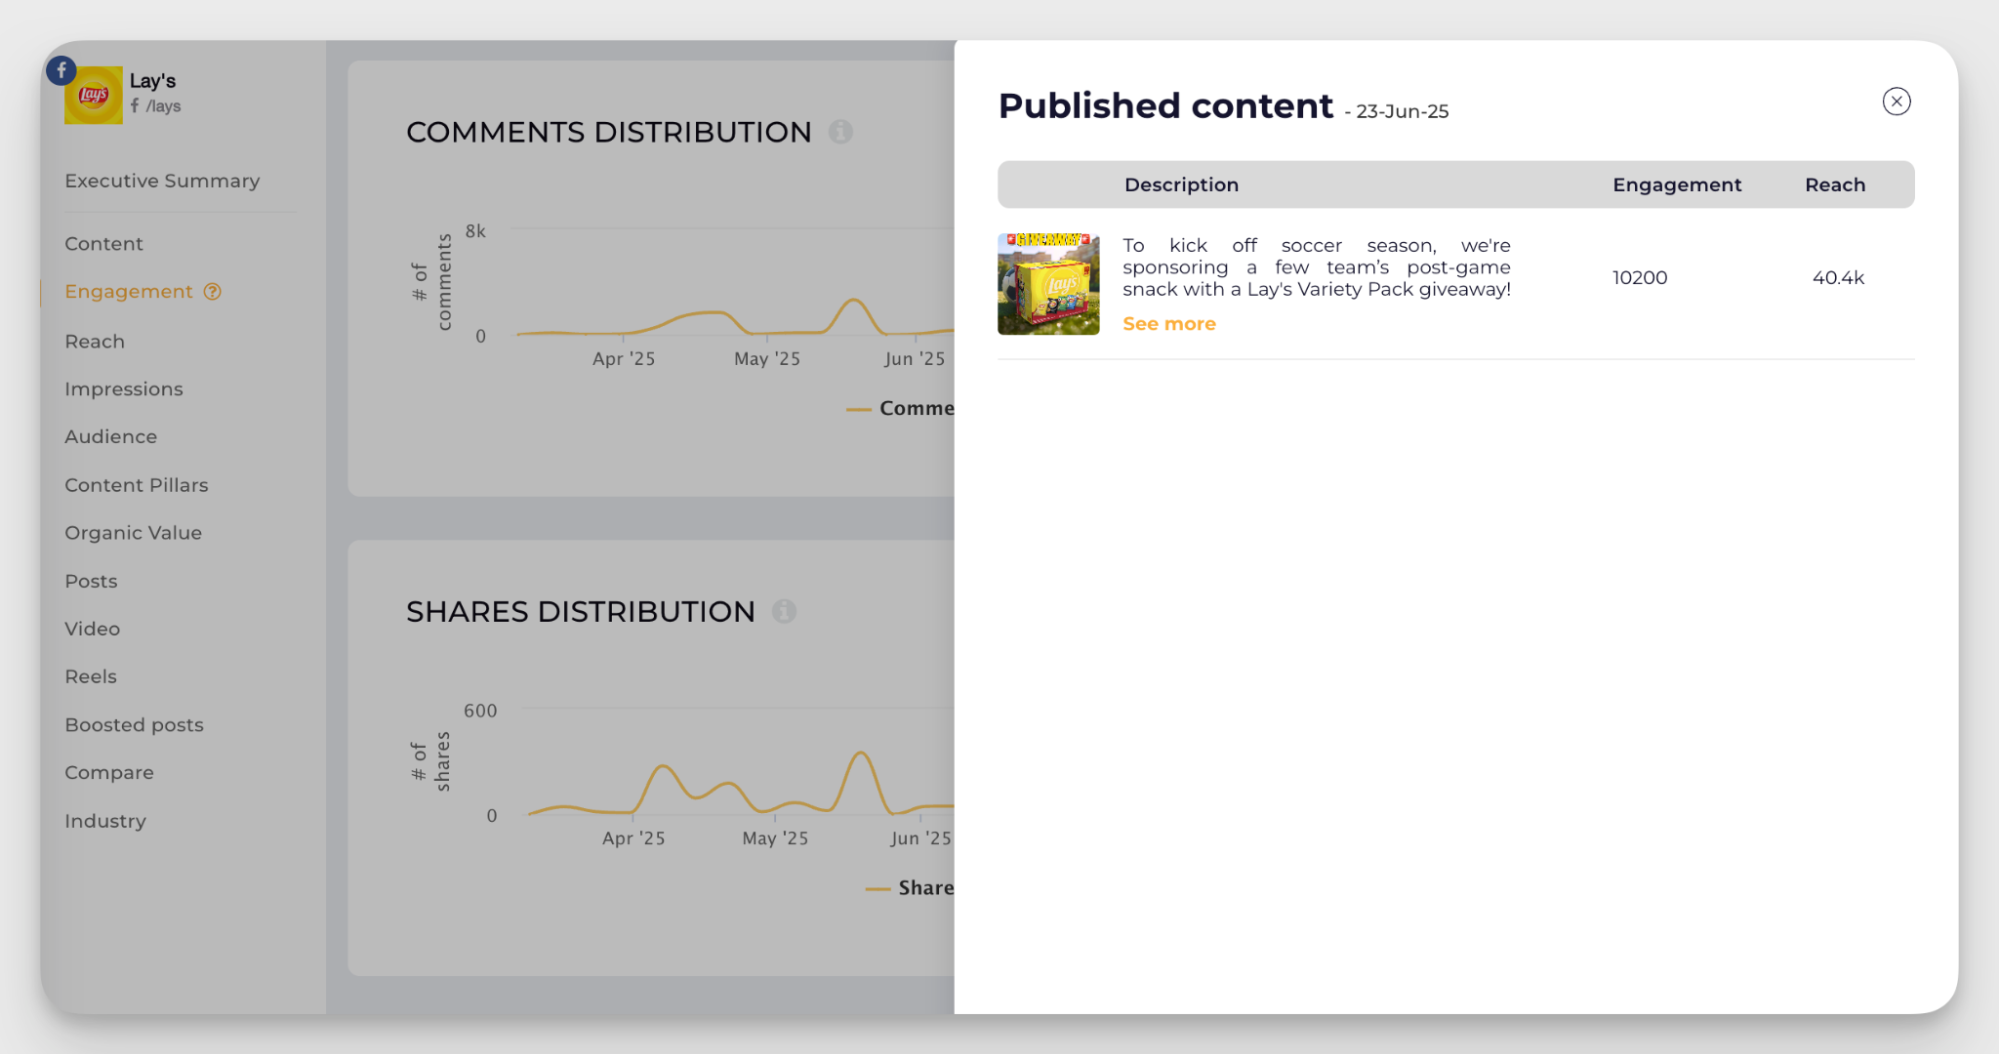
If you see some anomalies or sudden spikes, you can click on it and see the posts that created that impact.
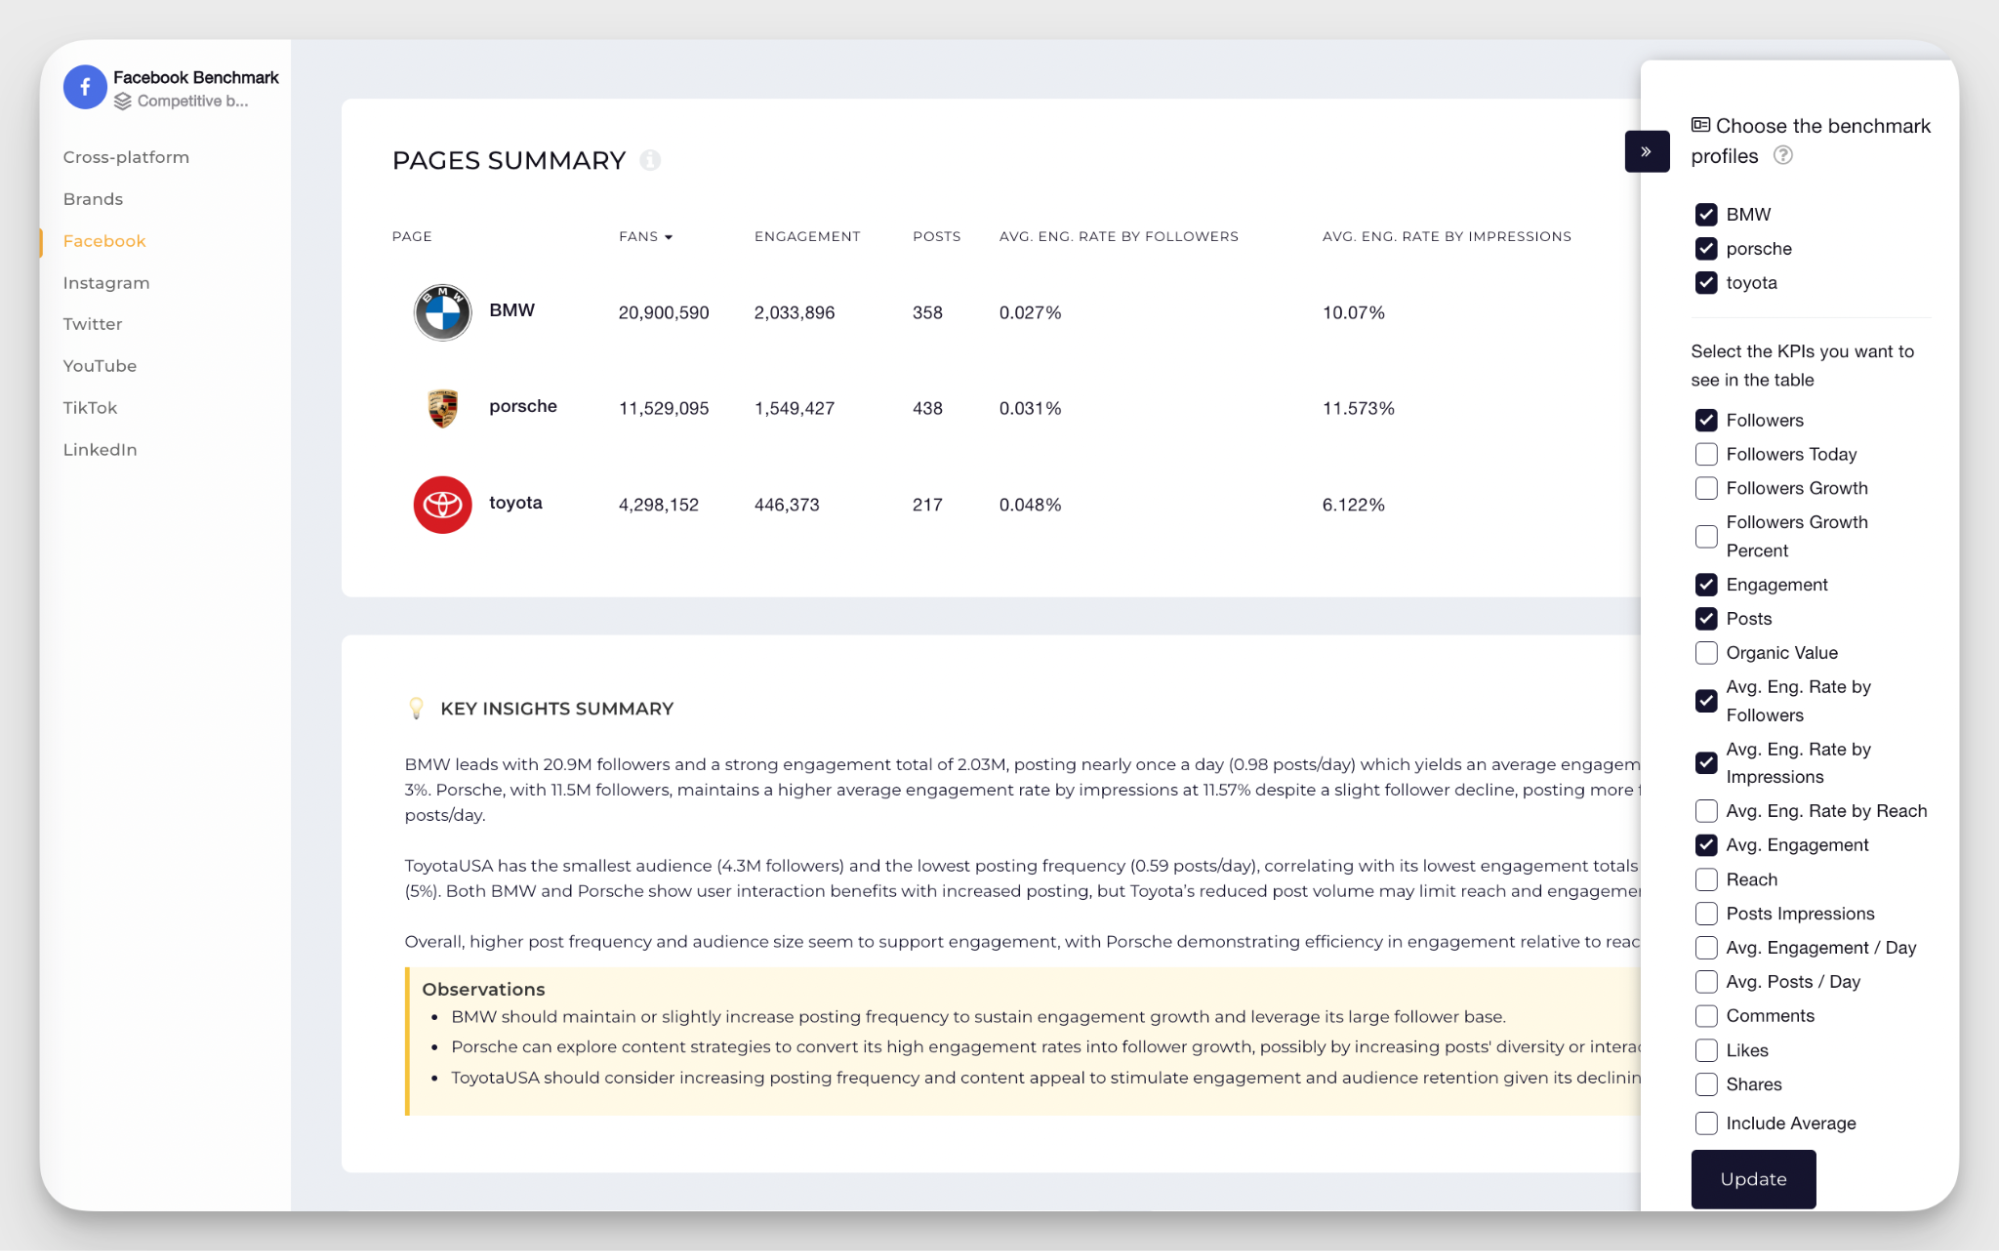
- Competitor benchmarking: Compare performance against competitors across different metrics like total fans and fans’ growth, reach, views, etc.
- Industry comparison: See how you compare against a specific page or the overall industry. You can even select the country and follower number for competitor accounts you want to compare with.
- Content pillars performance analysis: Analyze your top performing content pillars and how your content pillar mix looks like for a particular period.
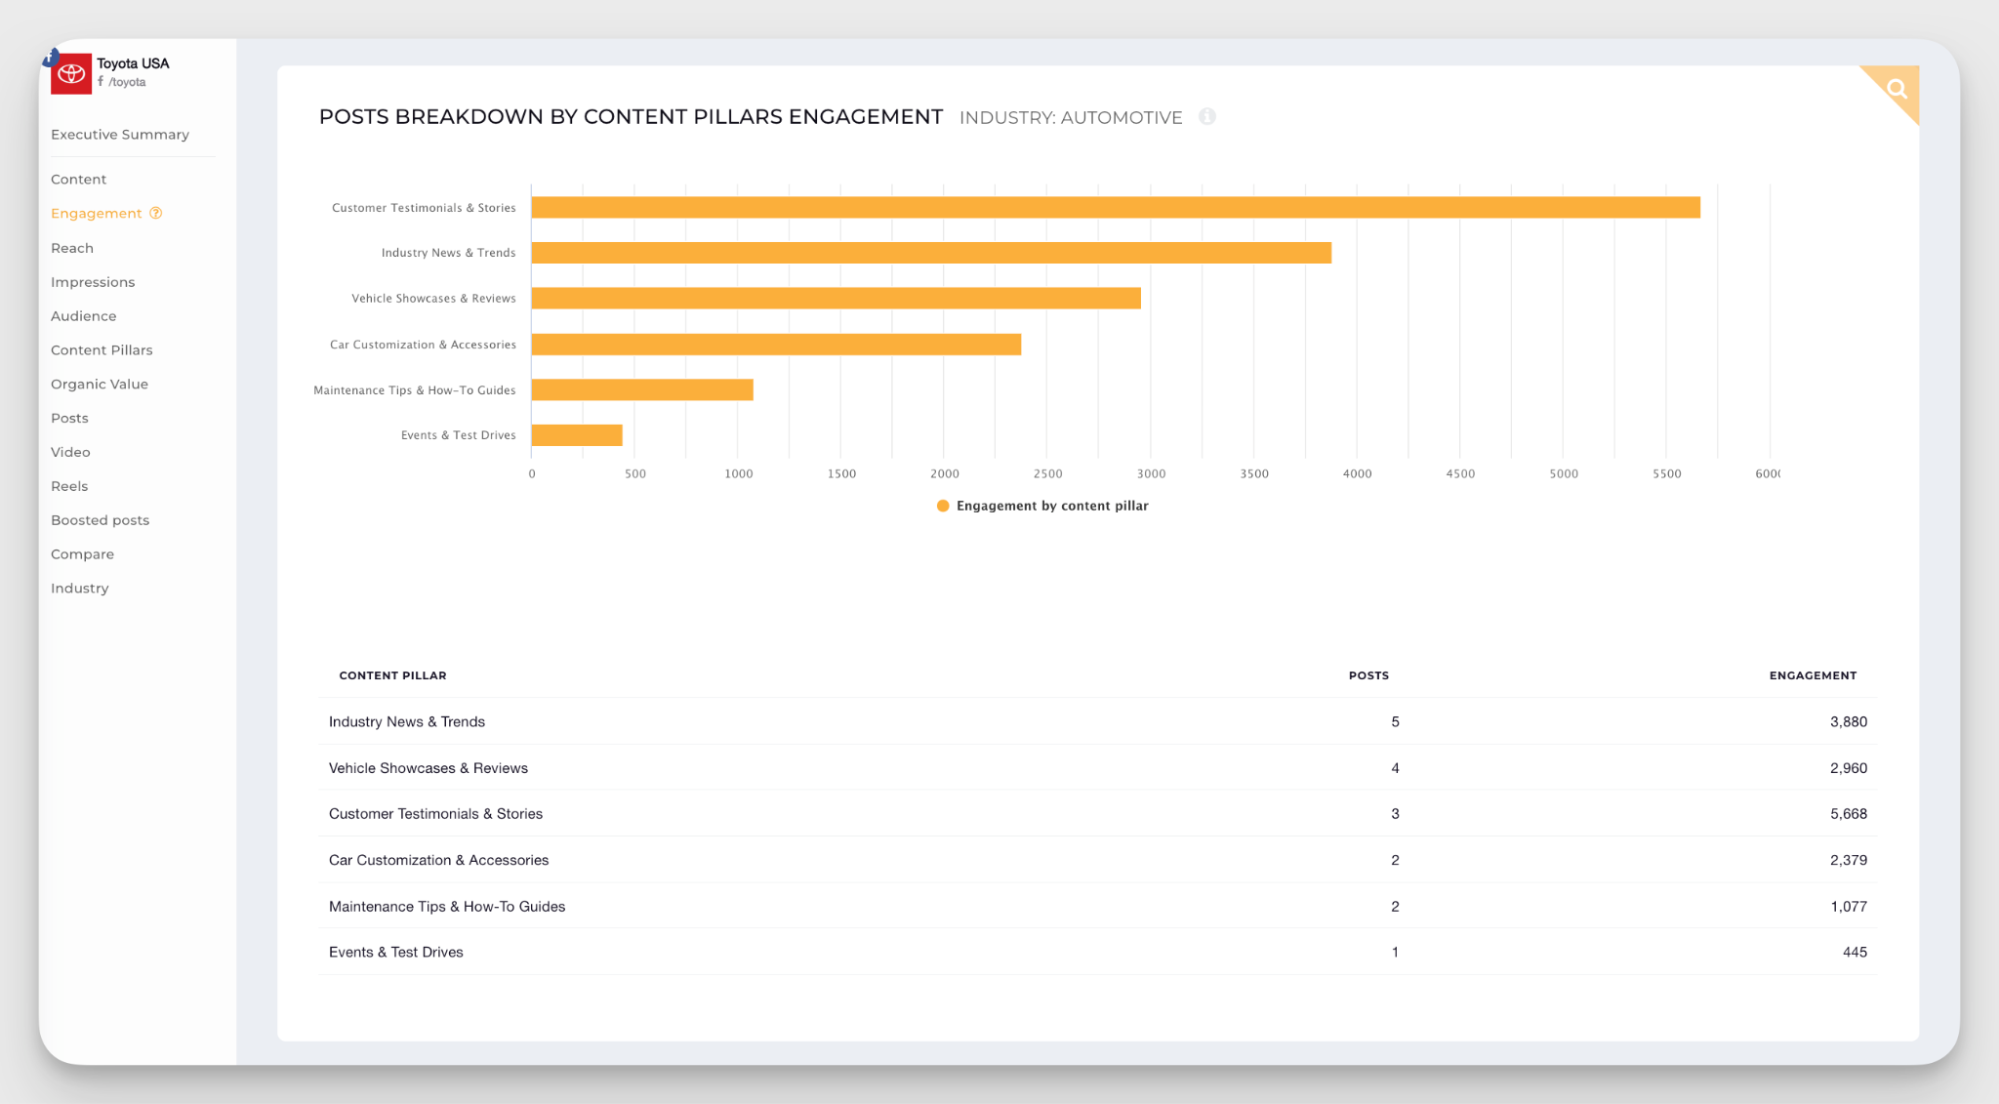
You can even see your competitor’s content pillar mix and benchmark against those.

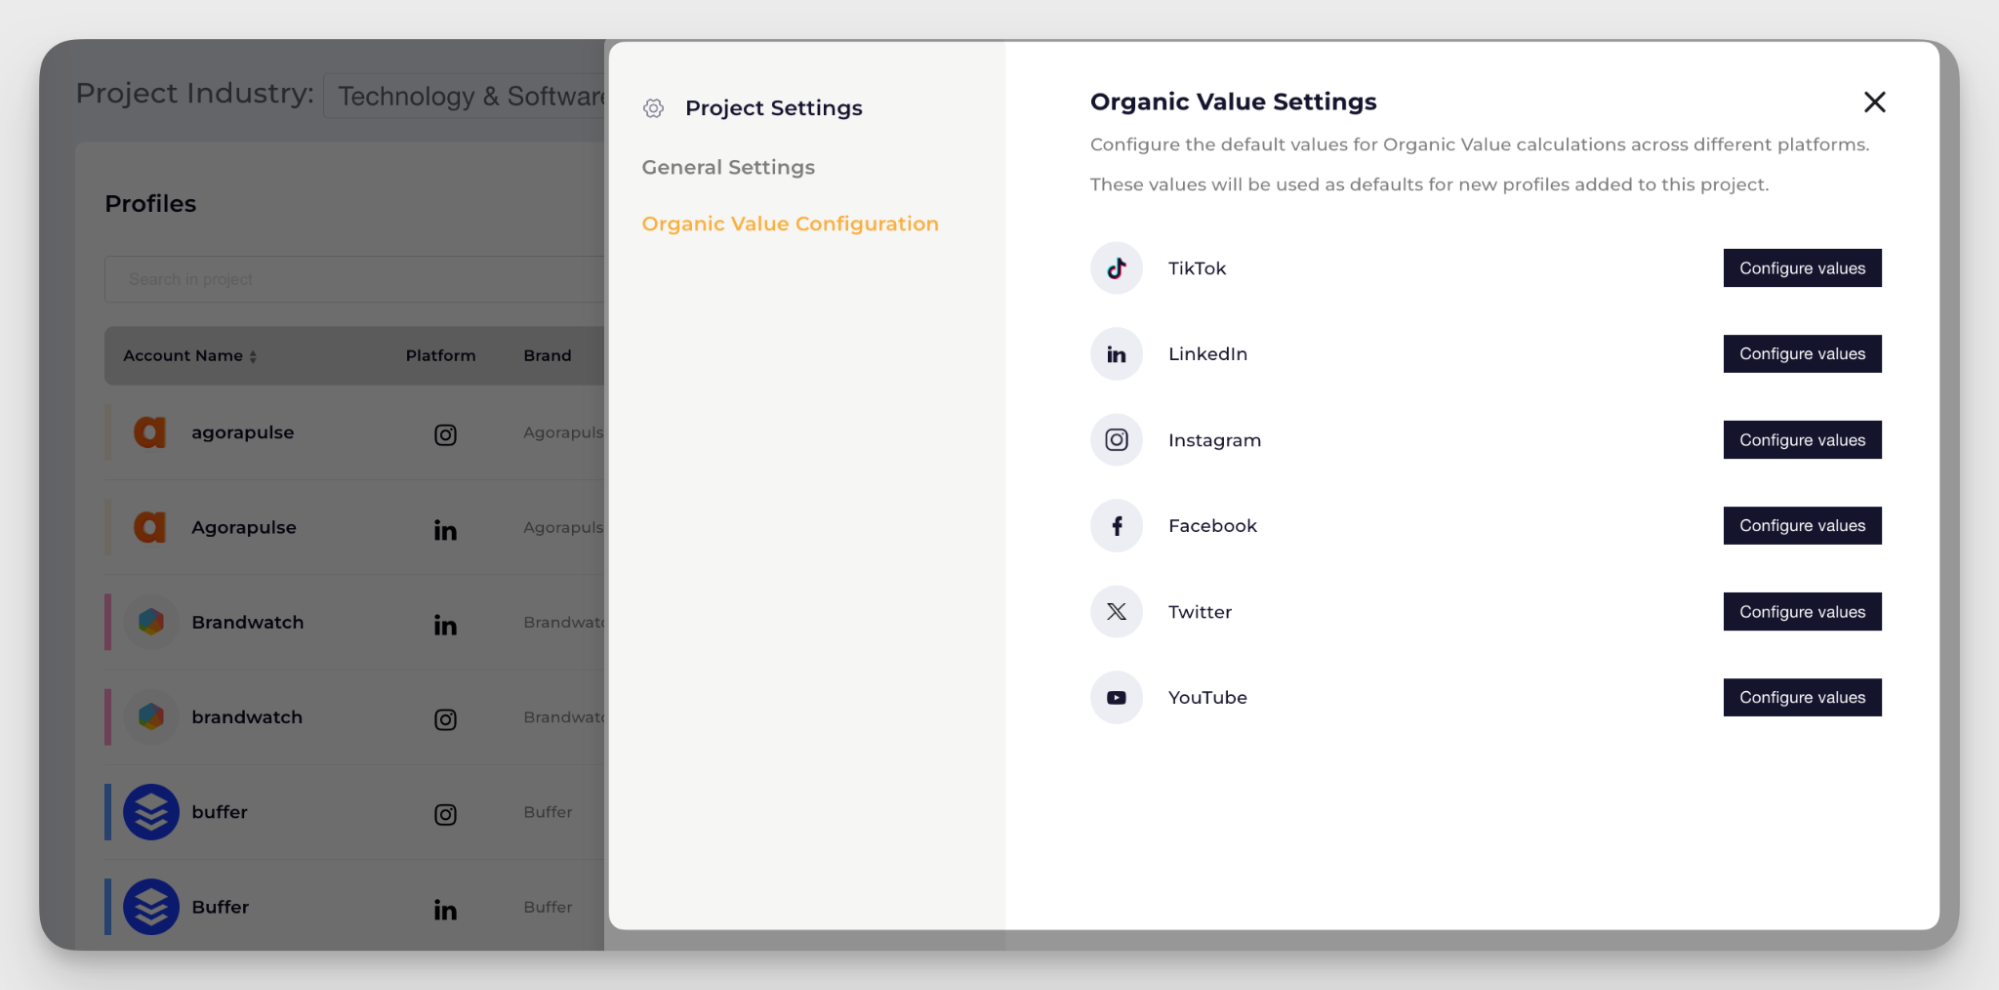
- Organic value calculation: Shows the estimated monetary value of your organic social media efforts over a given period of time. You can change the values assigned as per your requirements to get the exact organic value.
- Autoreporting: Get scheduled autoreports for key metrics and analytics in your inbox without having to make them from scratch.

Pricing: Socialinsider offers a free trial of 14 days and the monthly plans start from $99.
Reviews: “I love the layout. Gathering the data from Meta is such a pain and difficult to navigate, so it saves us a lot of time. It also makes presentations more appealing and easy to read. I like how we can set the comparison easily. My most utilized tool is campaign tracking. By tagging posts, we can see the effect from just selecting comms and it's really helpful. For organic content, this tool is very helpful. The Customer Support team has also been very helpful and prompt.”
2. Social Pilot — best for Facebook management with analytics
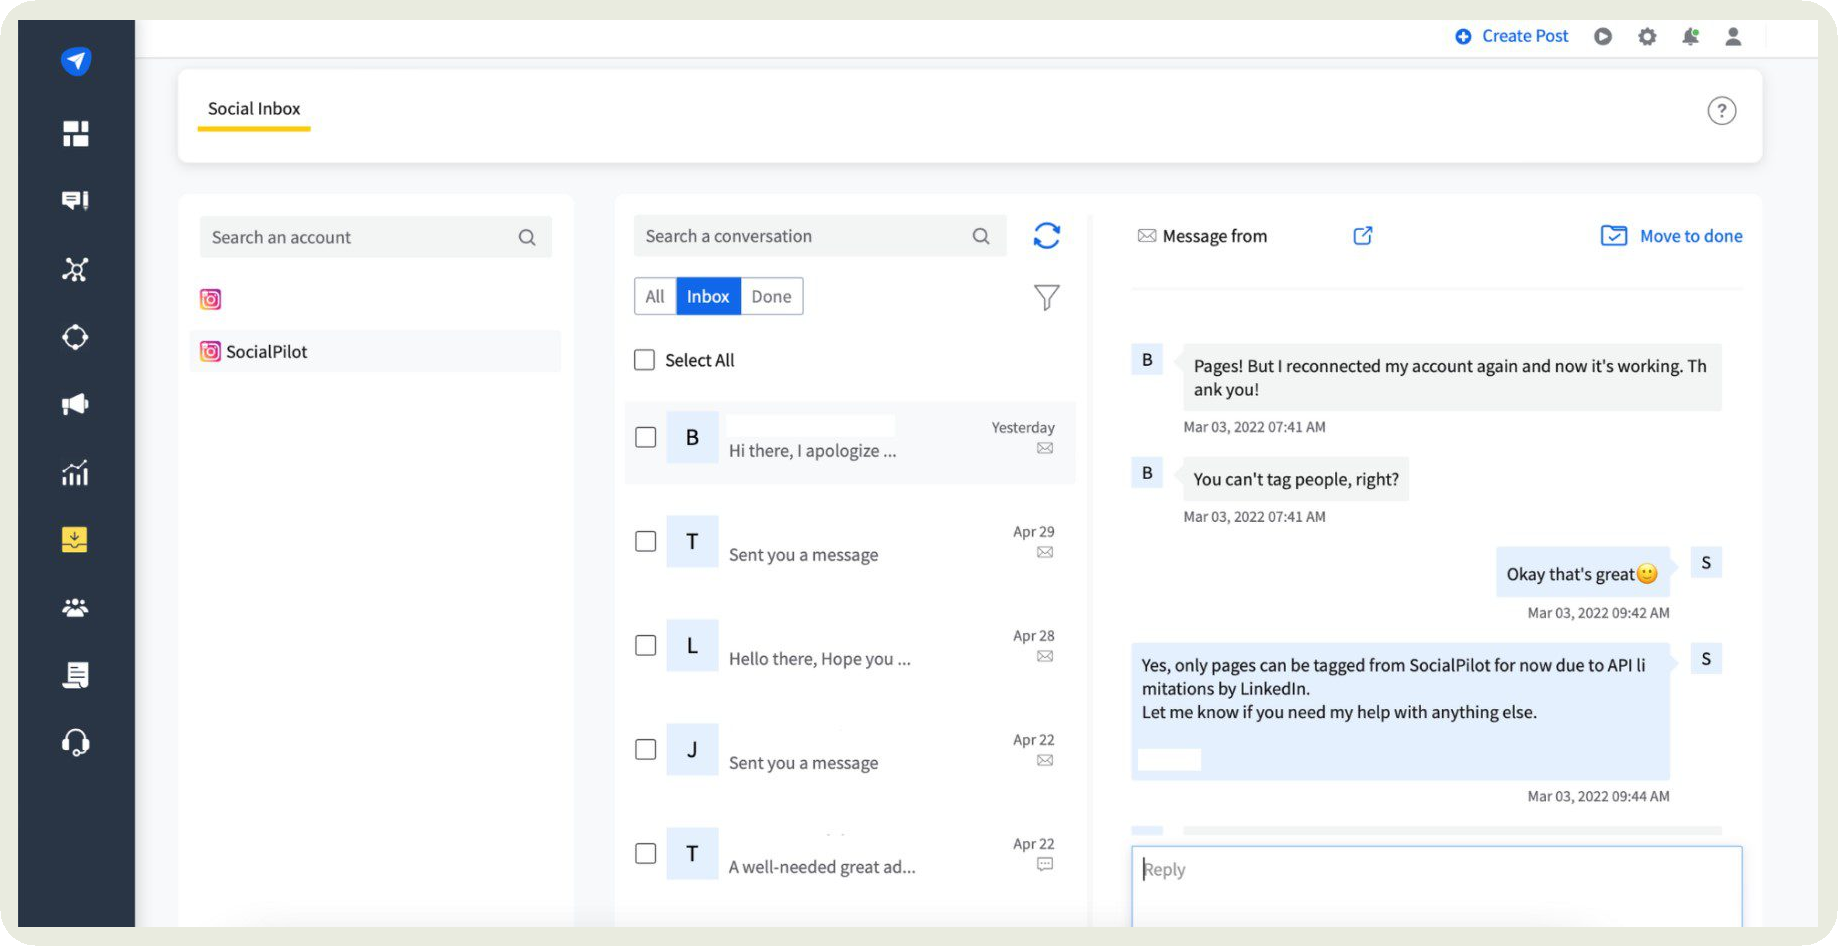
Do you want a Facebook analytics tool that also helps with other tasks like scheduling and managing conversations?
On the Facebook post analytics side, I can track page likes, reach, and engagement trends and even examine post-performance over custom date ranges.
On the publishing side, I can schedule regular posts, Reels and Stories for multiple pages in one go, bulk-upload up to 500 posts, and use audience targeting to refine who sees what.
Plus, the unified inbox means you can manage comments, messages, and mentions from different pages all in one place.
Key features:
- Get detailed metrics: Access in-depth analytics for Facebook like reach, clicks, impressions, and engagement to understand how your Facebook content performs over time.
- Identify high-performing content: Quickly spot which posts drive the most engagement and reach.
- Competitor reports: Track and compare your performance against competitors to uncover content gaps and benchmark your strategy.
- Historical data: Analyze long-term trends and performance patterns with extended access to past data (approximately 2 years).
- White-labeled reports: Generate professional, client-ready Facebook analytics report with your own branding.
- Bulk scheduling: Plan and schedule hundreds of posts at once across different profiles, saving time.
Pricing: Offers a free 14-day trial after which their plans start from $30 per month.
Reviews: “I really like the overall SocialPilot platform. It has all the features we require for the 20+ pages we manage on our account. It was also super easy to integrate with all our pages on the different platforms. We use it several times a week to schedule posts and ensure our calendar is properly set up. I highly recommend this platform as it's a great deal for the price as well.”
3. Brandwatch — best for audience analysis and custom reporting
Is your engagement dropping? Do you think it might be because you’re targeting your audience with the wrong content?
Brandwatch helps you with detailed audience analysis so you can create laser-focused Facebook marketing strategies.
When I tried the tool, I found it easy to slice and dice audience segments by behaviour, demographics, and interests with tools like custom classifiers, unlimited keyword rules, and image analysis that spots logos and scenes where my brand appears.
Their AI assistant, Iris AI, also makes it easy to run topic analysis and pore through millions of conversations happening around the topic.
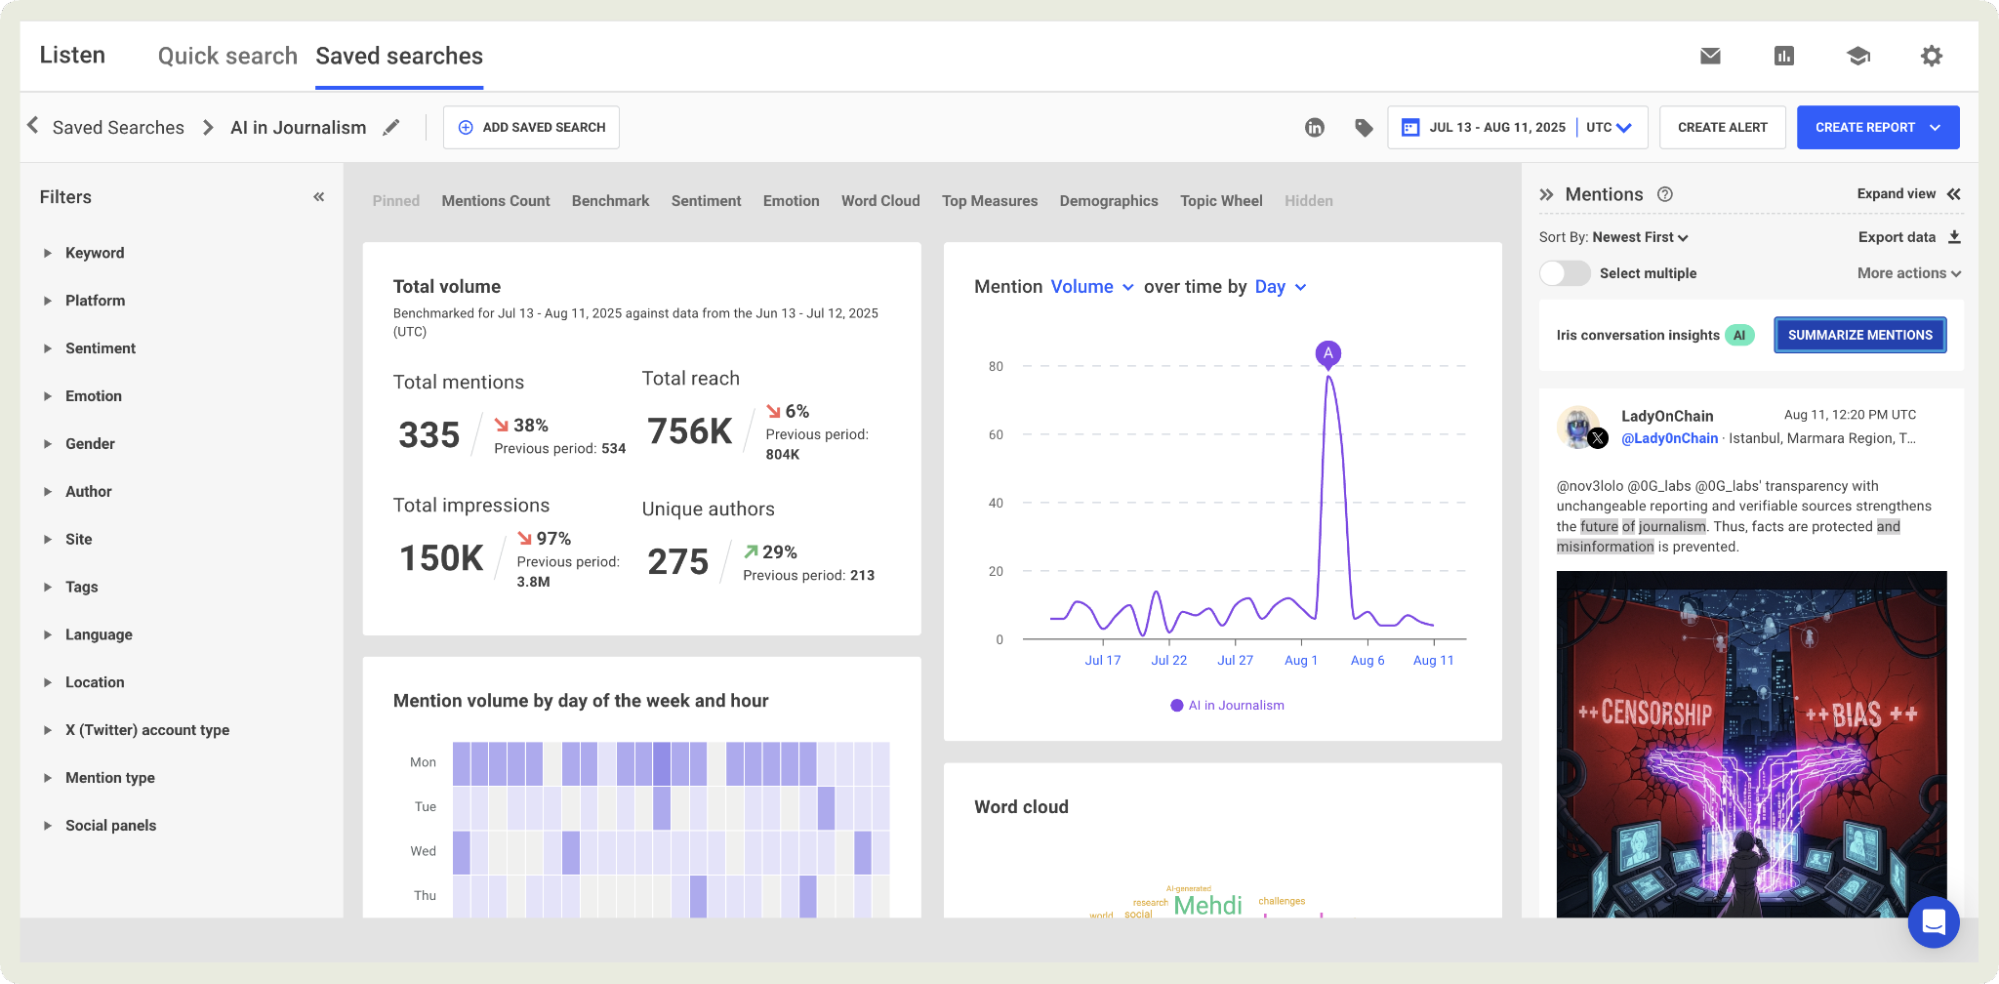
When it comes to reporting, there’s no one-size-fits-all: I could build fully customised dashboards, drag and drop widgets, schedule exports in PDF/CSV/PPT and, share live links for stakeholders.
Key features:
- Performance analysis: Assess how your content, channels, and campaigns are doing with deep insights: post-level metrics, cross-network comparisons, AI-driven insights on content performance, and dashboards to measure and visualise success.
- Automated AI-powered email alerts: Receive automatic email notifications when AI spots unusual spikes or drops in brand mentions, sentiment, or other key social media metrics.
- Historical trends: Dive into past data archives (billions to trillions of conversations) to identify long-term patterns, seasonal shifts, and trends in your brand or industry.
- Sentiment analysis: Analyse the tone of conversations at scale (positive, negative, neutral, and beyond) using natural language processing and machine-learning models to understand how audiences truly feel about your brand or topic.
- Competitor analysis: Benchmark your brand against rivals across metrics like share of voice, content performance, and sentiment to uncover strengths, weaknesses, and opportunities in your market.
Pricing: Not available on the website. Contact Brandwatch team to get these details.
Reviews: “The support team truly stands out for their exceptional service. They respond promptly and demonstrate a deep understanding of our business requirements. Additionally, the data rigor remains consistently high and fast, which allows us to deliver quick and accurate insights to our clients in various sectors. The user interface could be modernized; there are sleeker options available in the marketplace that they can emulate.”
4. Synthesio — best for trend analysis and social listening
Synthesio is a great Facebook analytics tool if you play around with trends a lot.
You can monitor brand mentions, hashtags and cross-platform chatter with its social listening dashboard and dig into who’s saying what, where and how often.
Its AI-powered Topic Modeling engine scans thousands of posts in minutes to surface emerging themes and trend clusters I would otherwise miss.
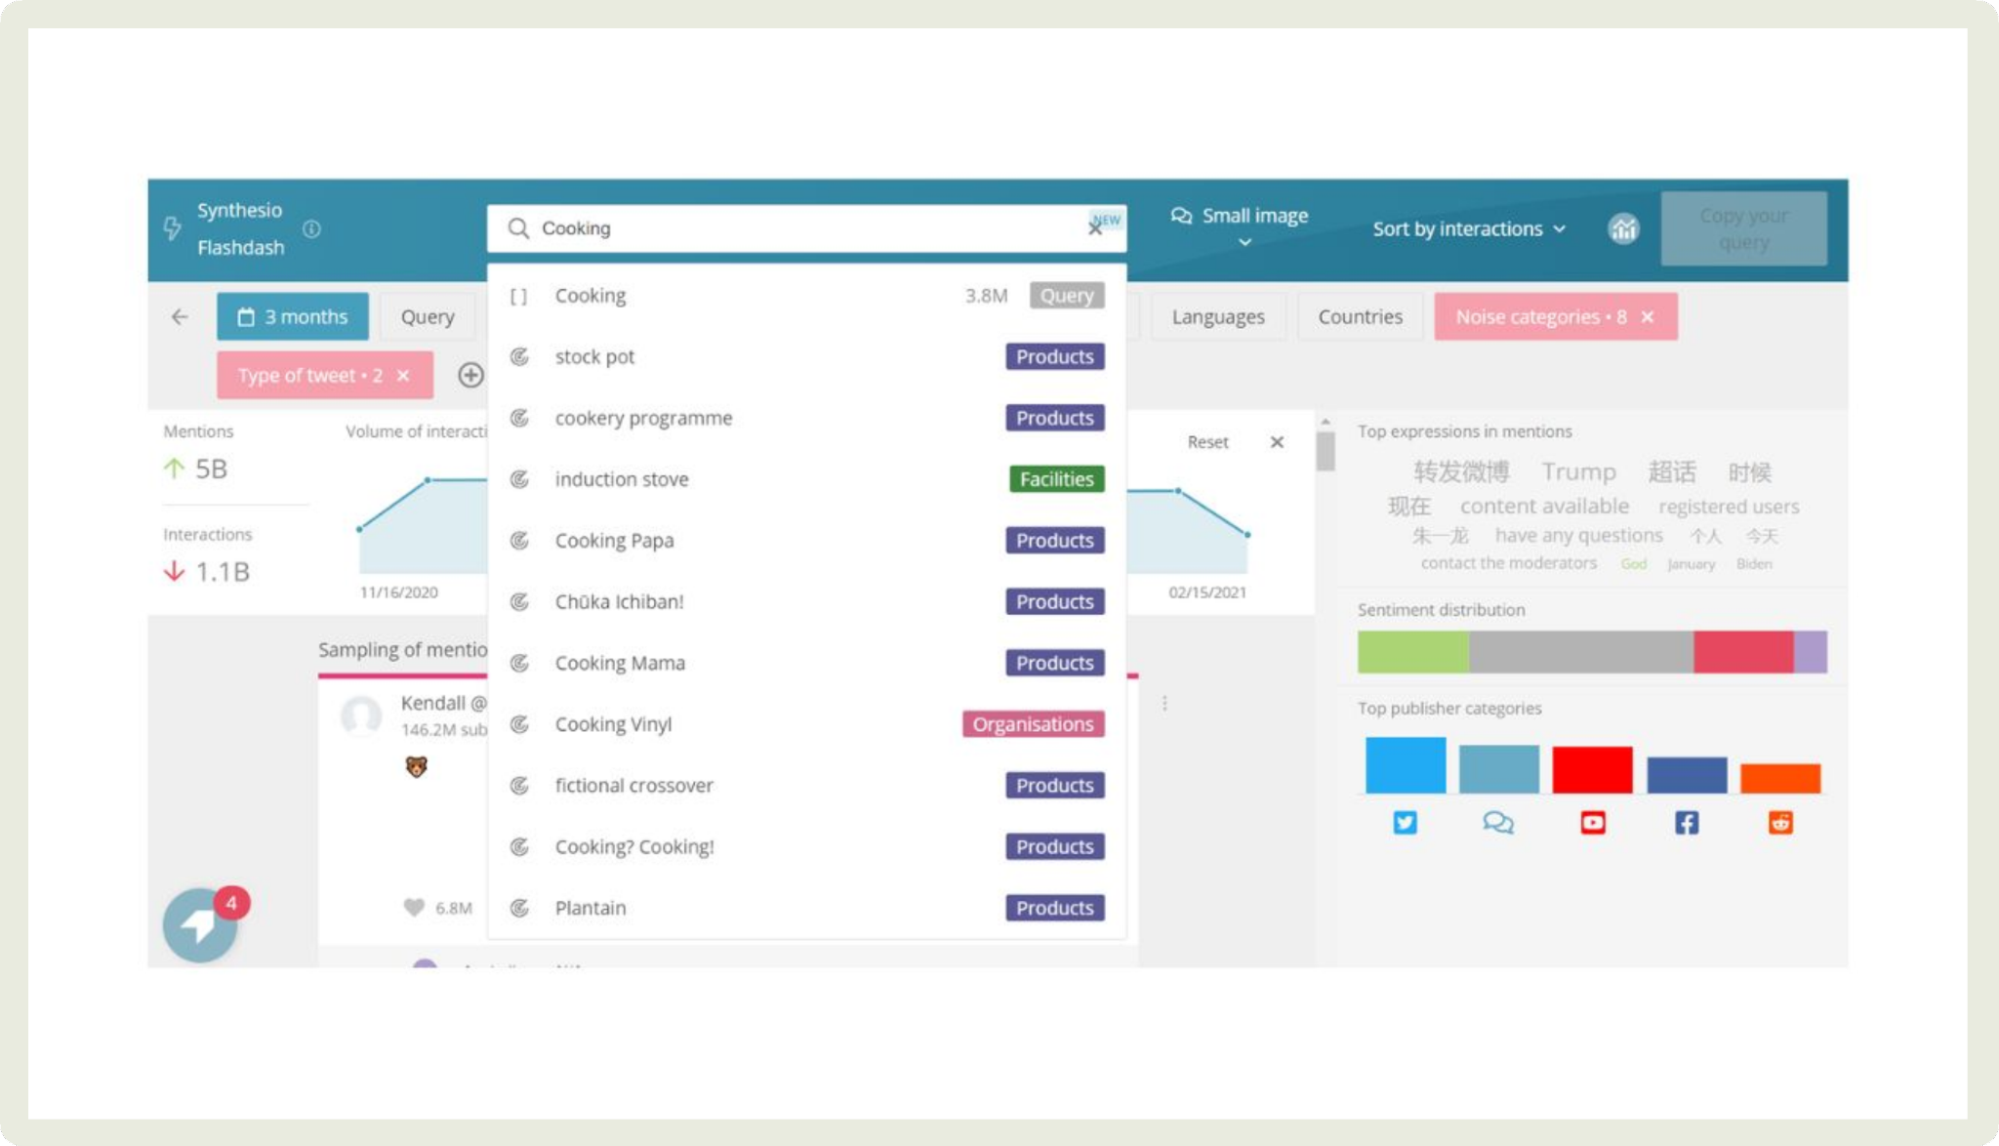
On the trend-spotting front, Synthesio’s Signals module alerts me when a topic is gaining traction or shifting sentiment, so I’m never caught off guard.
Key features:
- Campaign analysis: Monitor and measure your marketing or communication campaigns in real time. Track conversation volume, engagement, share of voice and performance of key messages to see what’s working and what isn’t.
- Comprehensive trend discovery: Surfacing emerging topics and consumer behaviours by scanning vast data sets using AI-driven topic-modelling.
- Evaluate trend velocity and maturity: See how quickly a trend is growing (velocity) and how established or saturated it is (maturity) to decide whether to act on a rising topic now, or wait.
- 360° consumer insights: Combine social, search, survey and behavioural data across languages and regions to build a holistic view of your audience.
- Social listening: Track and analyse what people are saying about your brand, category, competitors, products or topics across social networks, forums, blogs and news.
- Reputation monitoring: Keep an eye on the health of your brand by identifying negative sentiment spikes, crisis signals or reputational risks, enabling you to respond quickly and protect your brand image.
Pricing: Not available on the website. Contact Synthesio’s team for specific details.
Reviews: “The filtering options and ad-hoc searching feature are great. The customer support is really what stands out to me, as it is so much better than what I have ever gotten with any other social media tool. The only con being it's a complex tool, so adoption can take time.”
Facebook paid performance analytics tools
5. Bïrch — best for Facebook ads automation and reporting
Imagine waking up and seeing your Bïrch dashboard already updated: bids adjusted, underperforming ads paused and budget shifted to winners while you were asleep. That’s the reality you experience after diving into this Facebook ads automation and reporting tool.
For Facebook campaigns, you can use its visual rule-builder to set layered triggers like ‘if ROAS drops below X for 3 days then pause ad’ and ‘when CTR rises above Y then increase budget by Z’.
I also tapped into its bulk-ad-creation feature that helps launch dozens of ad variations in one go.
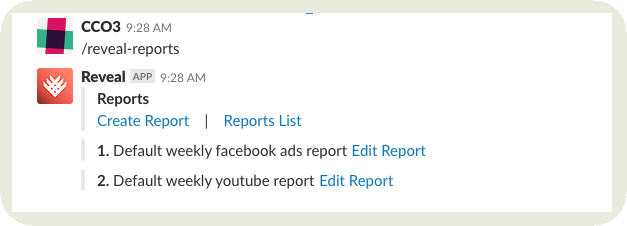
On the reporting side, you can build customised dashboards with drag-and-drop widgets and set scheduled delivery via Slack or email.
Key features:
- Advanced automation rules: Create custom rules that pause, start, duplicate campaigns/ad-sets/ads, adjust budgets or bids based on conditions you define (example, cost per acquisition, spend thresholds, performance comparisons).
- Custom metrics and timeframes: Define your own Facebook metrics and set custom date/time frames for comparison to surface meaningful performance shifts.
- Audience and creative analytics: Identify top-performing audiences and creatives across campaigns, compare segments, find what’s working and scale accordingly.
- Bulk operations and post-boosting: Launch or duplicate ads in bulk, boost top organic Facebook posts automatically when they meet performance criteria, export post IDs for reuse.
- Cross-platform support and reporting: While focused on Meta platforms like Facebook/Instagram, Bïrch supports multiple ad platforms, provides dashboards, scheduled Facebook page analytics reports and performance visualization for clients or teams.
Pricing: Their paid plans range varies depending on your monthly ad spend. For monthly ad spend up to $10K, the plans start from $49 per month.
Reviews: “I love how easy Bïrch makes managing ads across different platforms. The automation rules save me so much time and help me get better results without having to constantly check and adjust things manually.”
6. AdsEspresso — for paid campaign management and analytics
Managing multiple Facebook ad campaigns can feel like juggling flaming swords. You miss out on one thing and your campaign may crumble.
Adsespresso makes tracking all of it easy. The platform lets you build and test dozens of ad variations in minutes using its guided campaign creation flow. You can segment audiences, tweak visuals, and experiment with headlines without leaving the dashboard.
What I liked the best is its Compare tool. This Facebook page analytics tool lines up campaigns side by side so I can instantly see which one’s driving the best ROAS or CTR.
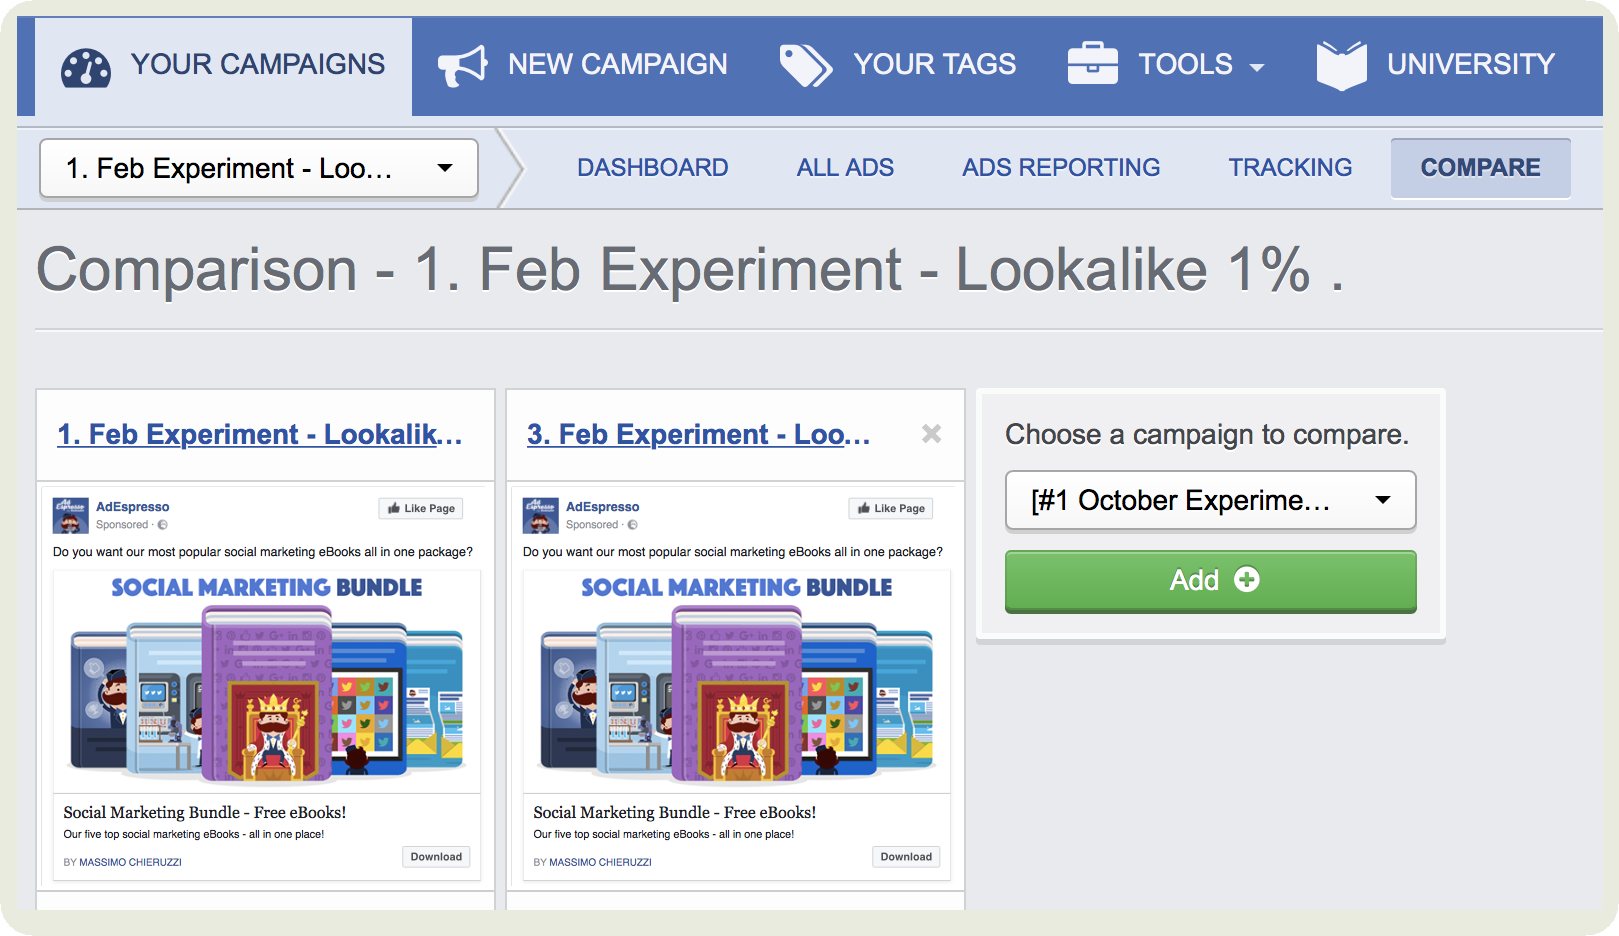
They also offer tagging for aggregated reporting, meaning you can easily organize and group campaigns by clients or segments. Once done, you’ll be able to see aggregated statistics for each campaign.
Key features:
- Optimization rules and automation: Create rules to automatically pause, adjust, or duplicate ads based on performance metrics and free up time for social media strategy.
- Retargeting and audience lists: Use retargeting lists (for example, visitors, converters, engaged users) and build ad sets to re-engage these audiences with tailored messages and creatives.
- Bulk update: Manage and edit multiple campaigns, ad sets or ads in one go to scale your workflow efficiently.
- Ad metrics analysis: Access detailed performance metrics like clicks, impressions, reach, conversions, cost per result, and engagement with widgets and graphs to quickly assess how campaigns are doing.
- Customizable dashboards: Choose which KPIs matter to you and customize your Facebook analytics dashboard.
- Drag-and-drop reporting tool: Build and export reports easily with drag-and-drop tables, graphs and snapshots (including white-labeling) so you can share performance with clients or team members.
Pricing: Offers a free 14-day trial. Their pricing plan range starts from $49 per month (monthly ad spend of $1000).
Reviews: “The best part is quickly being able to create multiple versions of Ads also really makes it easy for us to go for split testing. It makes the overall ad management very comfortable.”
7. Northbeam — best for multi-touch attribution modeling
Picture this: you’re reviewing your Northbeam dashboard and at a glance you can trace a customer’s journey from a cold Facebook ad all the way through to purchase, instead of just seeing ‘last-click.’
What got me hooked is how Northbeam’s multi-touch attribution models work: you can choose custom look-back windows, apply the proprietary ‘Clicks + Modeled Views’ model that credits not just clicks but verified views and impressions.
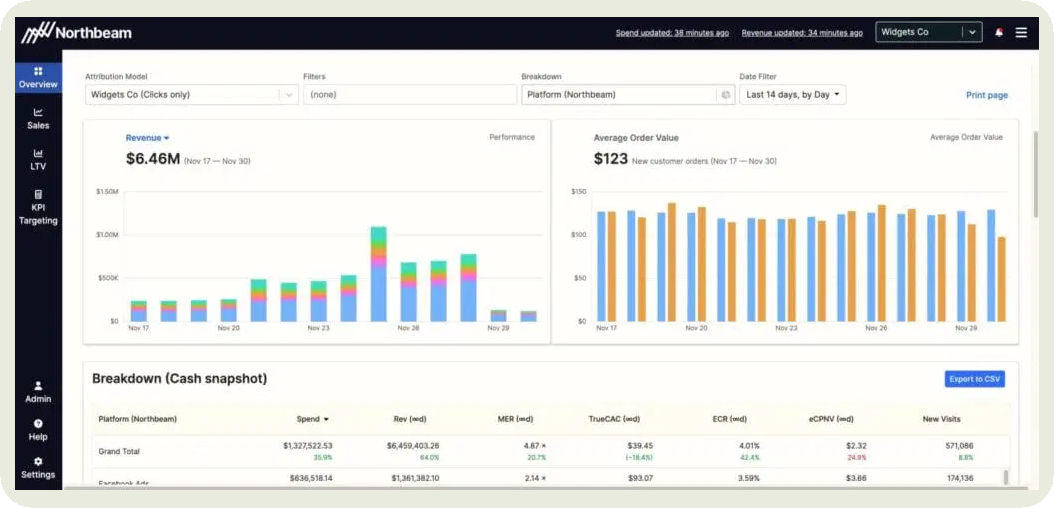
It also relies heavily on first-party data and integrates seamlessly across channels so you’re not locked into biased platform stats.
Key features:
- Unlimited attribution models & lookback windows: Northbeam supports multiple attribution models (Linear, Clicks-Only, Clicks + Modeled Views) and allows you to choose long or custom lookback windows.
- First-party data foundation and independent measurement: The platform emphasises using your own first-party data rather than relying solely on ad-platform claims, enabling more ‘truthful’ attribution across channels.
- Omnichannel and full-funnel visibility: Track every touchpoint, from awareness to conversion, across all channels (ads, search, direct traffic, etc.), so you see the full customer journey.
- Real-time or near real-time reporting: Hourly updates and detailed dashboards enable analysing media performance quickly and reacting to changes in campaign behaviour.
- Creative or campaign-level granularity: You can break down performance down to the ad/creative level, enabling you to see which creatives or assets across channels are the drivers.
Pricing: They offer custom pricing so you’ll have to get in touch with their team for exact pricing plan.
Reviews: “Northbeam has helped make it easy for us to determine what is really making money within the businesses we work with and letting us scale the mediums that are actually profitable. We'd recommend Northbeam to any business doing over $5 million a year, spending on paid traffic, and looking to find clarity within their numbers.”
8. HYROS — best for advanced conversion tracking
Have you ever launched a Facebook ad campaign only to see conversions disappear into the ether and wondered exactly which ads, audiences and actions are driving results?
That’s where HYROS steps in.
Once you connect your Facebook ad account, you immediately benefit from its server-side integration and URL-parameter tracking to attribute leads, sales and calls back to the original ad source, even when the standard pixel loses data.
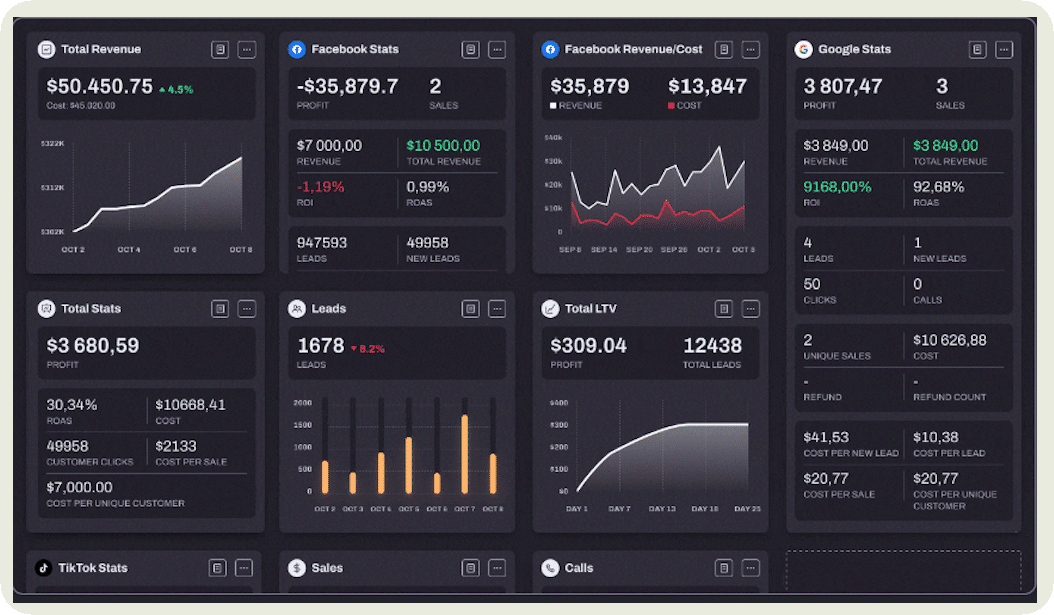
The platform also allowed me to push custom conversion events back into Facebook and build advanced attribution models that track first-click, last-click or multi-touch paths so I truly understand what’s working.
And if you need to report back to clients or top management, that’s easy as well.
Key features:
- Granular ad and campaign tracking: HYROS lets you track leads, sales, and calls back to specific ads, ad sets and campaigns on Meta by using custom URL parameters
- Full-funnel and multi-touch attribution: Beyond last-click attribution, you can see how Facebook ads fit into the broader customer journey (including other channels) and organise your attribution window and model accordingly.
- Custom parameter support: You can keep your existing UTM/tracking parameters and map them inside HYROS, maintaining your own naming conventions or legacy tracking setups.
- Offline and lead form tracking: The platform supports tracking of Facebook Lead Ads forms and offline conversions (for example where the ad generates a form or call rather than direct online purchase).
- Agency and multi-client tools: Get dashboards and admin tools for agencies running Facebook ads for many brands.
Pricing: Their business pricing plans start from $230 per month with annual plan and a monthly tracked revenue up to $20K.
Reviews: “The money it costs to use Hyros is less than the amount I was losing on Meta ads not having Hyros. I finally clearly know what ads to shut off, which ones to increase, and I’m thrilled to see my ROAS increasing. If you care about your business and want success, use the best tools. Get HYROS!”
What are some API limitations of third-party Facebook analytics tools?
Sometimes you may think, “Why is my Facebook analytics tool not working properly?” That is largely because of API limitations. Here are two of them.
Metric availability and data gaps
Here’s the thing about Facebook’s API: it doesn’t share everything. Some metrics are locked away for pages you don’t manage, such as follower counts or audience demographics for competitors.
Even when you’re analyzing your own page, certain insights might simply not show up. Metrics like video views or reach can disappear without warning, and Facebook doesn’t always split organic and paid engagement. Sometimes, the platform even retires old metrics altogether, which leads to empty spots in your reports and confusion about what changed.
Data discrepancies
Even when the data does come through, it might not match what you see inside Facebook’s native reports. That’s usually because of different attribution models, time windows, or API constraints. The result? Slight variations in your metrics that can make cross-checking feel like comparing two versions of the same story told by different people.
Final thoughts
The best Facebook analytics tools make your life easy. Whether it’s answering questions like, “What did my paid ads performance for last month look like?” or “What changes do we need to make in our content strategy?” or saving time looking for KPIs.
Before subscribing to any platform, I’d recommend taking a step back and listing exactly what you need it to do. Then, use the free trial to test those features in real time. It’s the easiest way to know if it fits your workflow or just looks good on paper.
And if you’re curious about how Socialinsider can help you dig deeper into Facebook metrics and automate your reporting, try it free for 14 days. You might just find your new favorite analytics sidekick.
FAQs about Facebook analytics tools
Why use Facebook analytics tools?
Facebook analytics tools help you understand what content resonates with your audience, how your advertising performs, who your followers are, and how your social efforts contribute to business goals. They provide data-driven insights that allow you to optimize your strategy, justify your social media investments, and improve ROI.
How can I export Facebook post data?
You can export Facebook data in several ways:
- From Meta Business Suite: Navigate to Insights → Export Data → select date range and metrics → export as CSV or Excel
- From Meta Ads Manager: Select the campaign, ad set, or ad → Reports → Export
- From third-party tools: Most offer CSV, Excel, PDF, or PowerPoint export options
- Via the Facebook Graph API: For developers needing programmatic access to data
Analyze your competitors in seconds
Track & analyze your competitors and get top social media metrics and more!
You might also like
Improve your social media strategy with Socialinsider!
Use in-depth data to measure your social accounts’ performance, analyze competitors, and gain insights to improve your strategy.

