Reach vs Impressions: How to Choose the Right Metric for Your Marketing Goals
Reach vs impressions - which one should you track first? Learn about key differences and the importance of each in this article.


Picture this: you’ve just launched what you believe is your brand’s most creative social media campaign to date. The posts look stunning, the copy is compelling, and you’re excited to see the results. A week later, you’re staring at your analytics dashboard, trying to make sense of the numbers. Your reach seems decent, but impressions are through the roof. Is this good or bad? How do these numbers align with your marketing strategy goals?
If this scenario sounds familiar, you’re not alone. Six out of ten marketing leaders struggle to demonstrate the impact of their marketing investments because they are measuring the wrong metrics.
This confusion isn’t just academic—it has real consequences for your marketing effectiveness. When you misinterpret these fundamental metrics, you risk optimizing for the wrong outcomes, misallocating your budget, and ultimately diminishing your ROI. A campaign with impressive “reach” numbers might actually be underperforming if viewed through the proper analytical lens.
In this article, we’ll demystify the reach vs. impressions conundrum. Let’s dive in.
Key takeaways
-
Reach measures unique users who saw your content (counting each person once), while impressions count total views regardless of repetition
-
The relationship is expressed as: Impressions ÷ Reach = Frequency, which shows how many times each person saw your content on average
-
High frequency (3+) can indicate either strategic reinforcement or limited audience penetration
-
Prioritize reach for brand awareness campaigns and reaching new audiences, focus on impressions for retargeting and promotional campaigns where message repetition is important
-
Neither metric is inherently better - the right choice depends entirely on your campaign objectives
-
High impressions with low reach suggests you're only reaching the same people repeatedly
-
High reach with low engagement means content isn't resonating despite visibility
-
Sudden drops in either metric can indicate algorithm changes, reduced posting, or audience disengagement
-
Platforms are shifting focus from passive impressions to active consumption metrics like views
-
The rise of "quiet audiences" who consume content without actively engaging is reshaping success metrics
-
Brands should create content for passive viewers and focus on meaningful connections rather than just chasing active engagement
Reach vs. impressions: core definitions and fundamental differences
At their most basic level, reach and impressions represent two distinct ways of measuring your content’s visibility. But the devil—and the marketing value—is in the details.
What is reach?
Reach measures the total number of unique users who have seen your content. This includes posts, stories, check-ins, ads, social information from people who interact with your brand account, and more. Think of reach as counting heads—each person who encounters your content counts exactly once, regardless of how many times they see it.
What are impressions?
Impressions, on the other hand, count the total number of times your content was displayed, regardless of whether it was clicked or even seen by the same person multiple times. This includes posts, stories, ads, and other content or information on your business page. If someone scrolls past your post three times in their feed, that counts as three impressions.
The crucial relationship between these metrics
This relationship can be expressed in a simple formula:
Impressions ÷ Reach = Frequency
Frequency tells you how many times, on average, each person saw your content. A high frequency (3+) might indicate your content is being shown repeatedly to the same audience, which could be either strategic (for reinforcement) or problematic (suggesting limited audience reach).
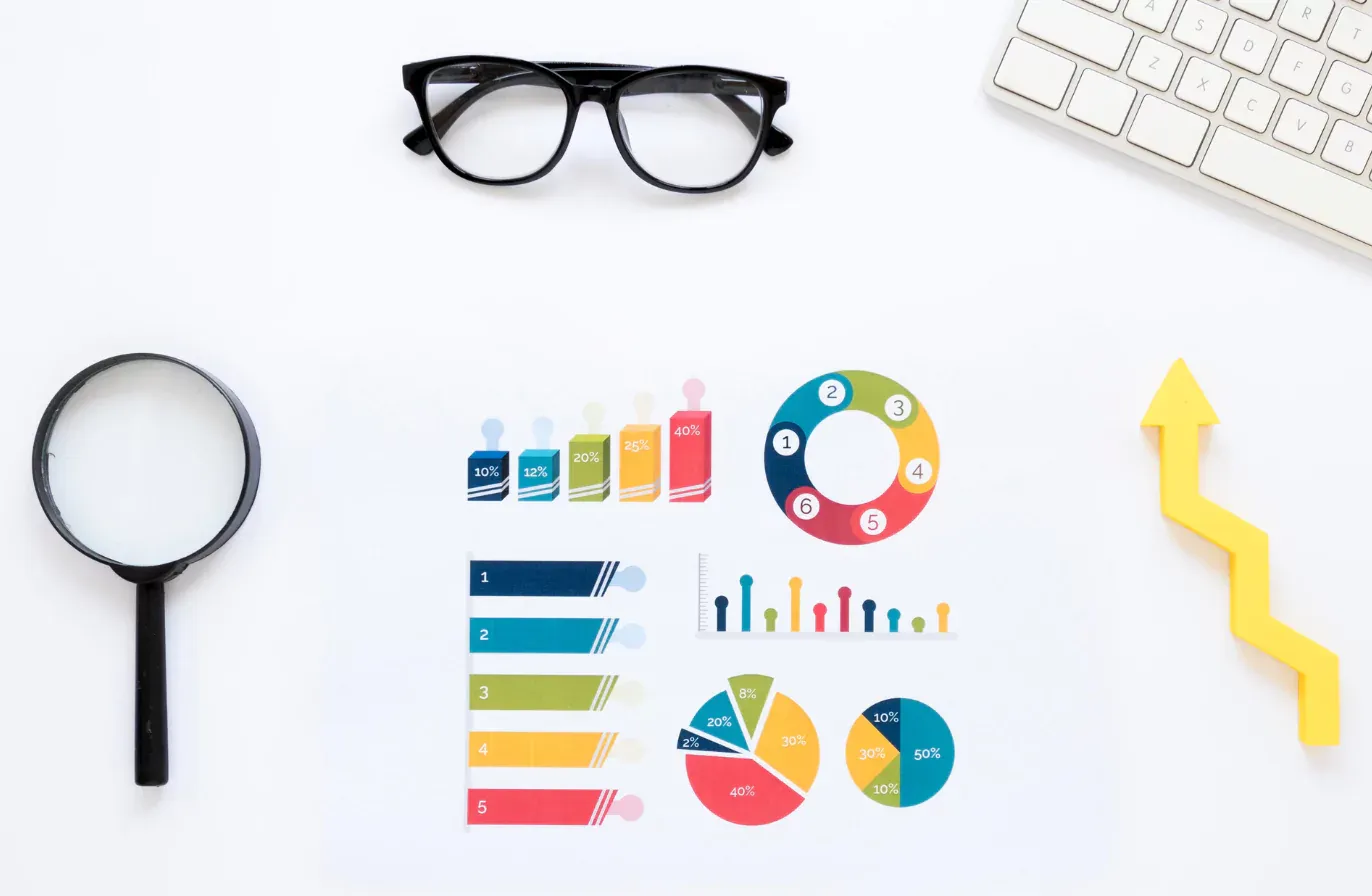
Visual comparison: reach vs. impressions
Historical context: the evolution of these metrics
These metrics weren’t born in the digital era. Traditional media has long distinguished between reach and frequency:
- In television, “reach” referred to the percentage of households tuned to a program, while “gross impressions” counted total viewings
- In print, “circulation” (analogous to reach) measured unique subscribers, while “readership” (similar to impressions) estimated total readers, including pass-alongs
The digital revolution brought unprecedented precision to these measurements. Early web analytics focused primarily on “hits” and “page views” (impressions), but as digital marketing matured, the importance of tracking unique visitors (reach) became apparent.
Social media platforms further refined these metrics, initially focusing on followers and likes before developing the sophisticated reach and impression metrics we use today.
The practical difference for marketers
Understanding the distinction has real implications for how you evaluate performance:
- Reach-focused analysis helps you understand campaign penetration and audience expansion (for a correct analysis, reach should be correlated with the total addressable market)
- Impression-focused analysis helps you understand overall visibility and message reinforcement
For example, a campaign with 10,000 reach and 10,000 impressions (frequency = 1) reached many people, but each person saw it only once, potentially insufficient for complex messaging. Conversely, a campaign with 1,000 reach and 10,000 impressions (frequency = 10) had high repetition but limited audience penetration.
Common misconceptions
The most prevalent misconception is treating these metrics as interchangeable. They’re not. They tell different parts of the same story. Another common error is assuming higher numbers always signal success. In reality, the “better” metric depends entirely on your campaign objectives, which we’ll explore in detail later.
Identify your most performant channel
Get the data you need to assess your social media performance and benchmark it against competitors and industry peers.
Start a 14-day FREE trialPlatform-specific reach and impressions
While some platforms let you track both reach and impressions, others offer limited access to them. Let’s break down how each major social media platform defines and tracks these metrics.
Facebook reach vs. impressions
On Facebook, reach is an estimated metric that measures the number of people who see any content from your page or about your page.
Impressions measure the number of times your content is shown on a person’s screen.
- Facebook lets you track both reach and impressions in its native analytics dashboard. Both metrics are broken down into paid and organic categories.
- But Facebook doesn’t provide reach data through its API. That means third-party tools can show accurate impression counts, but only estimate reach based on the available data.
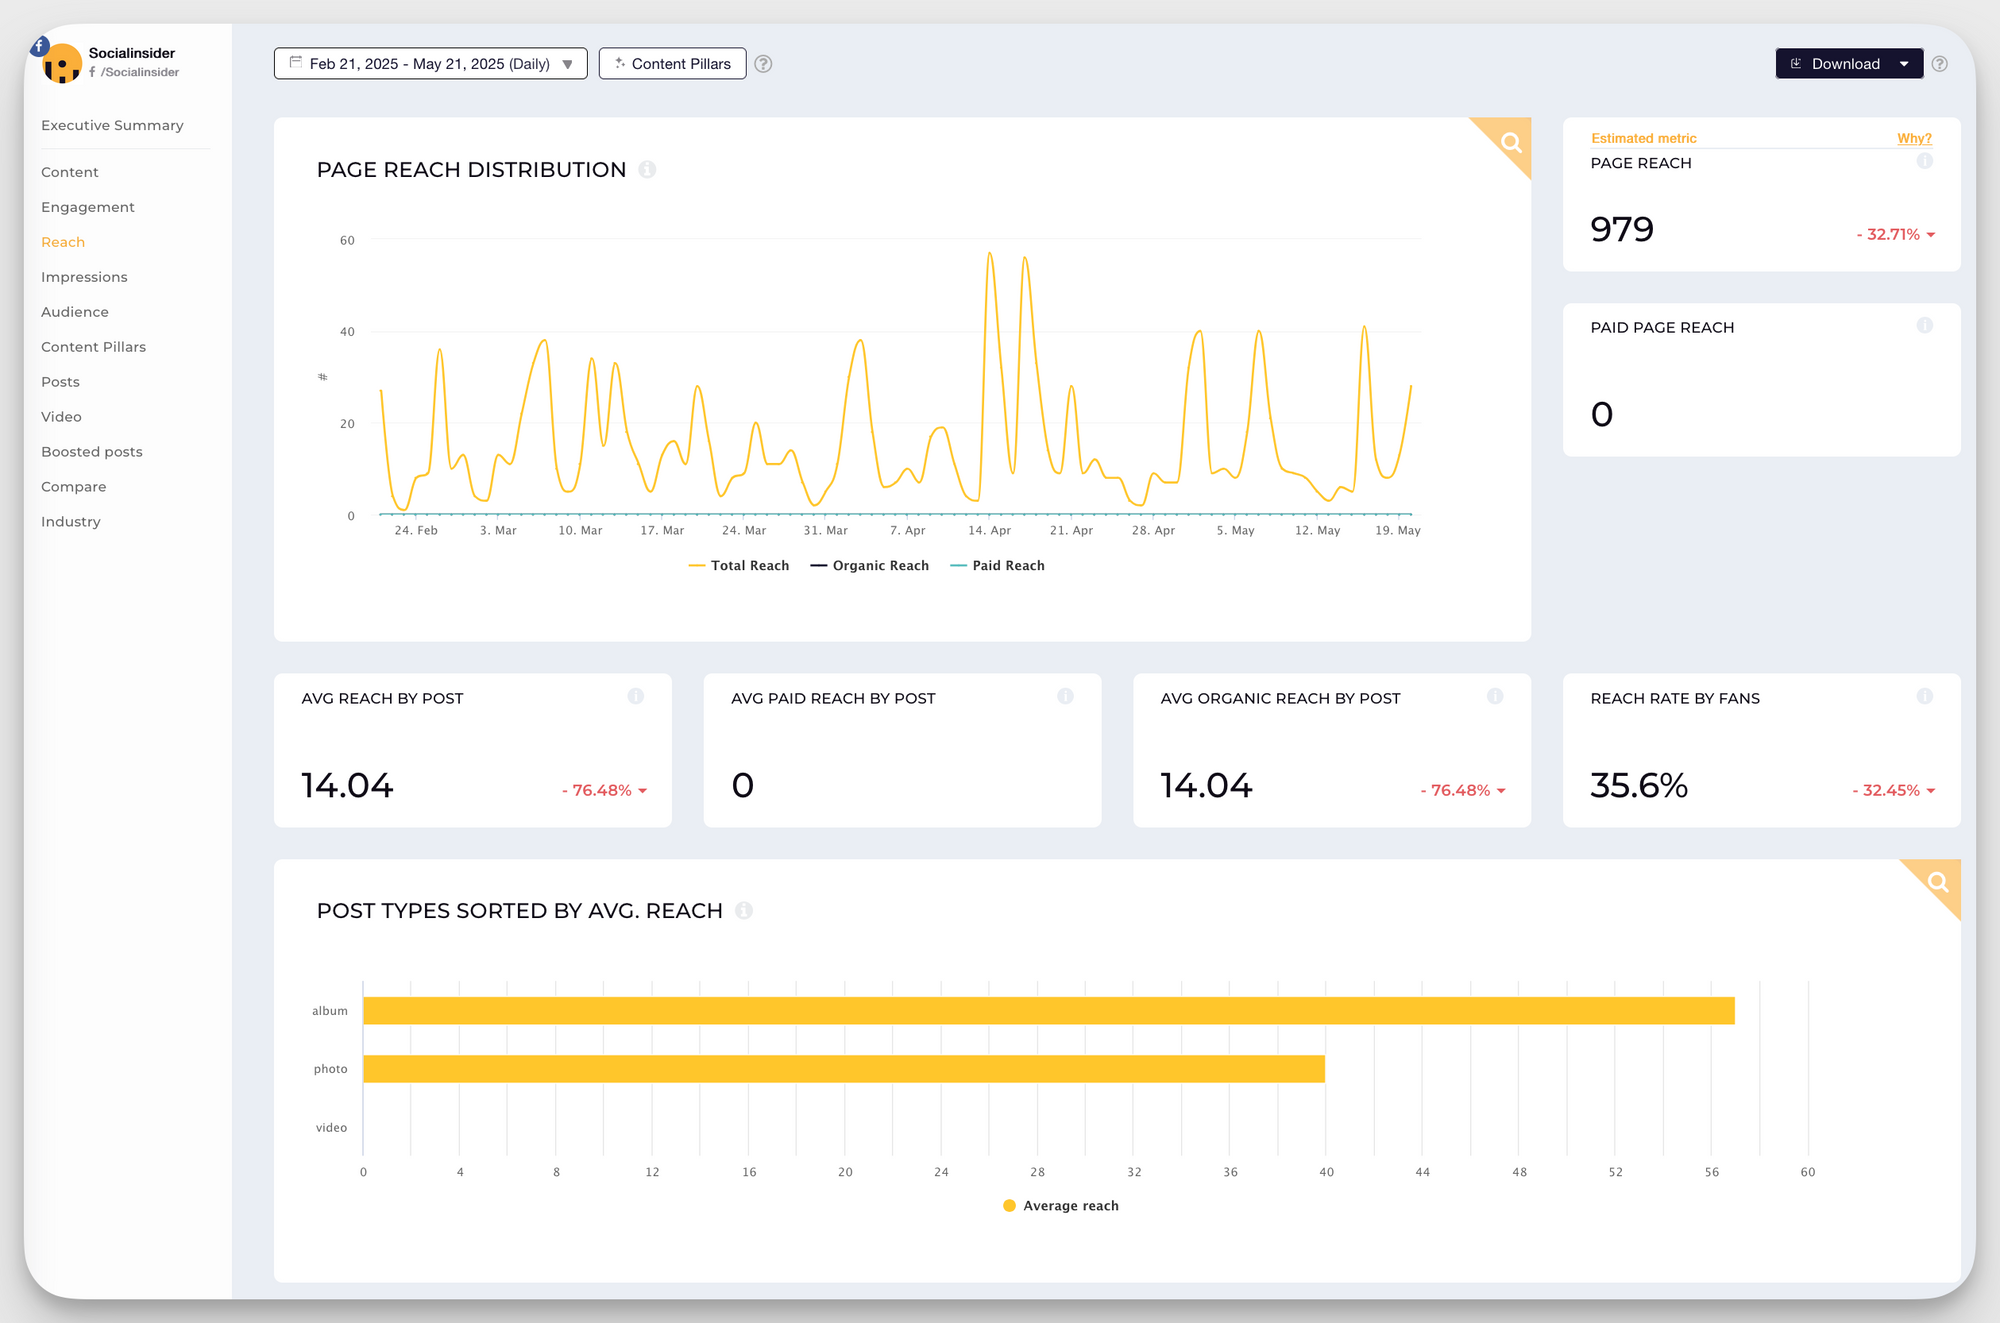
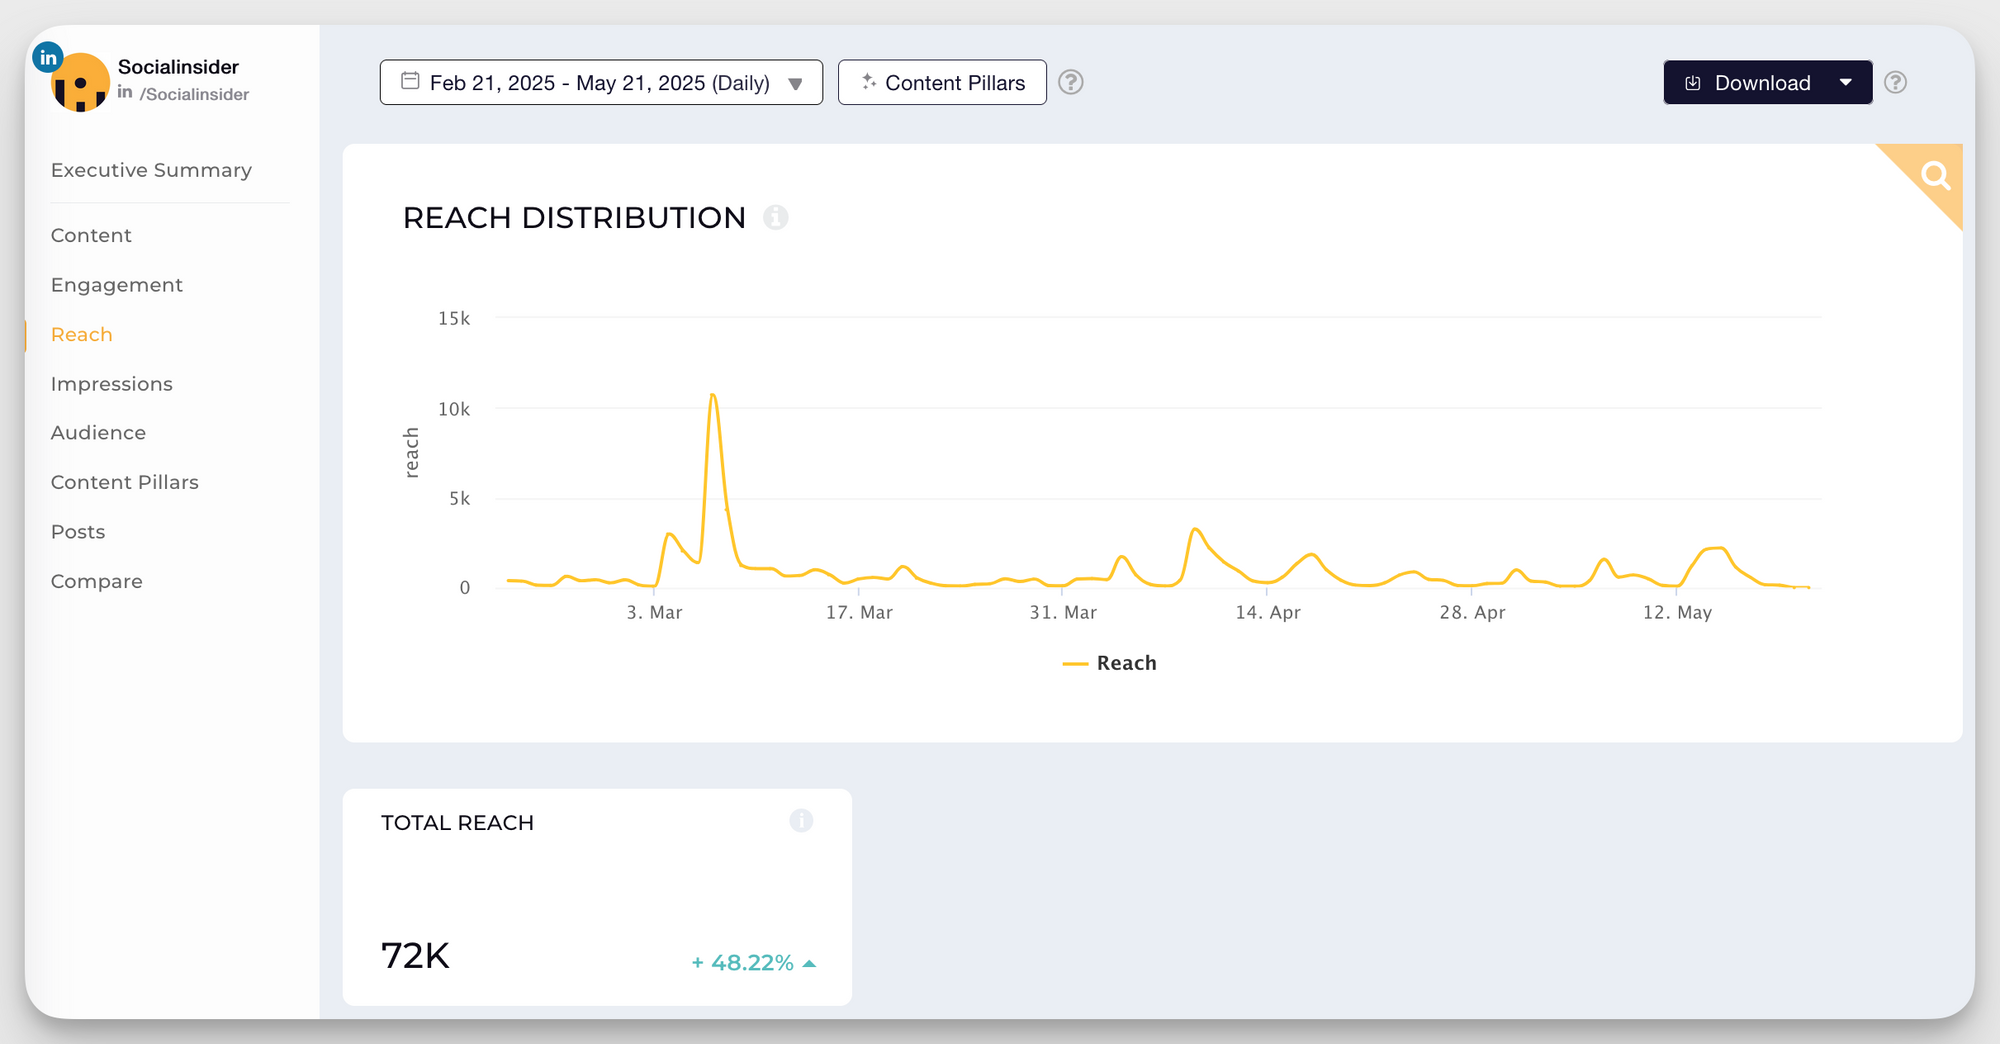
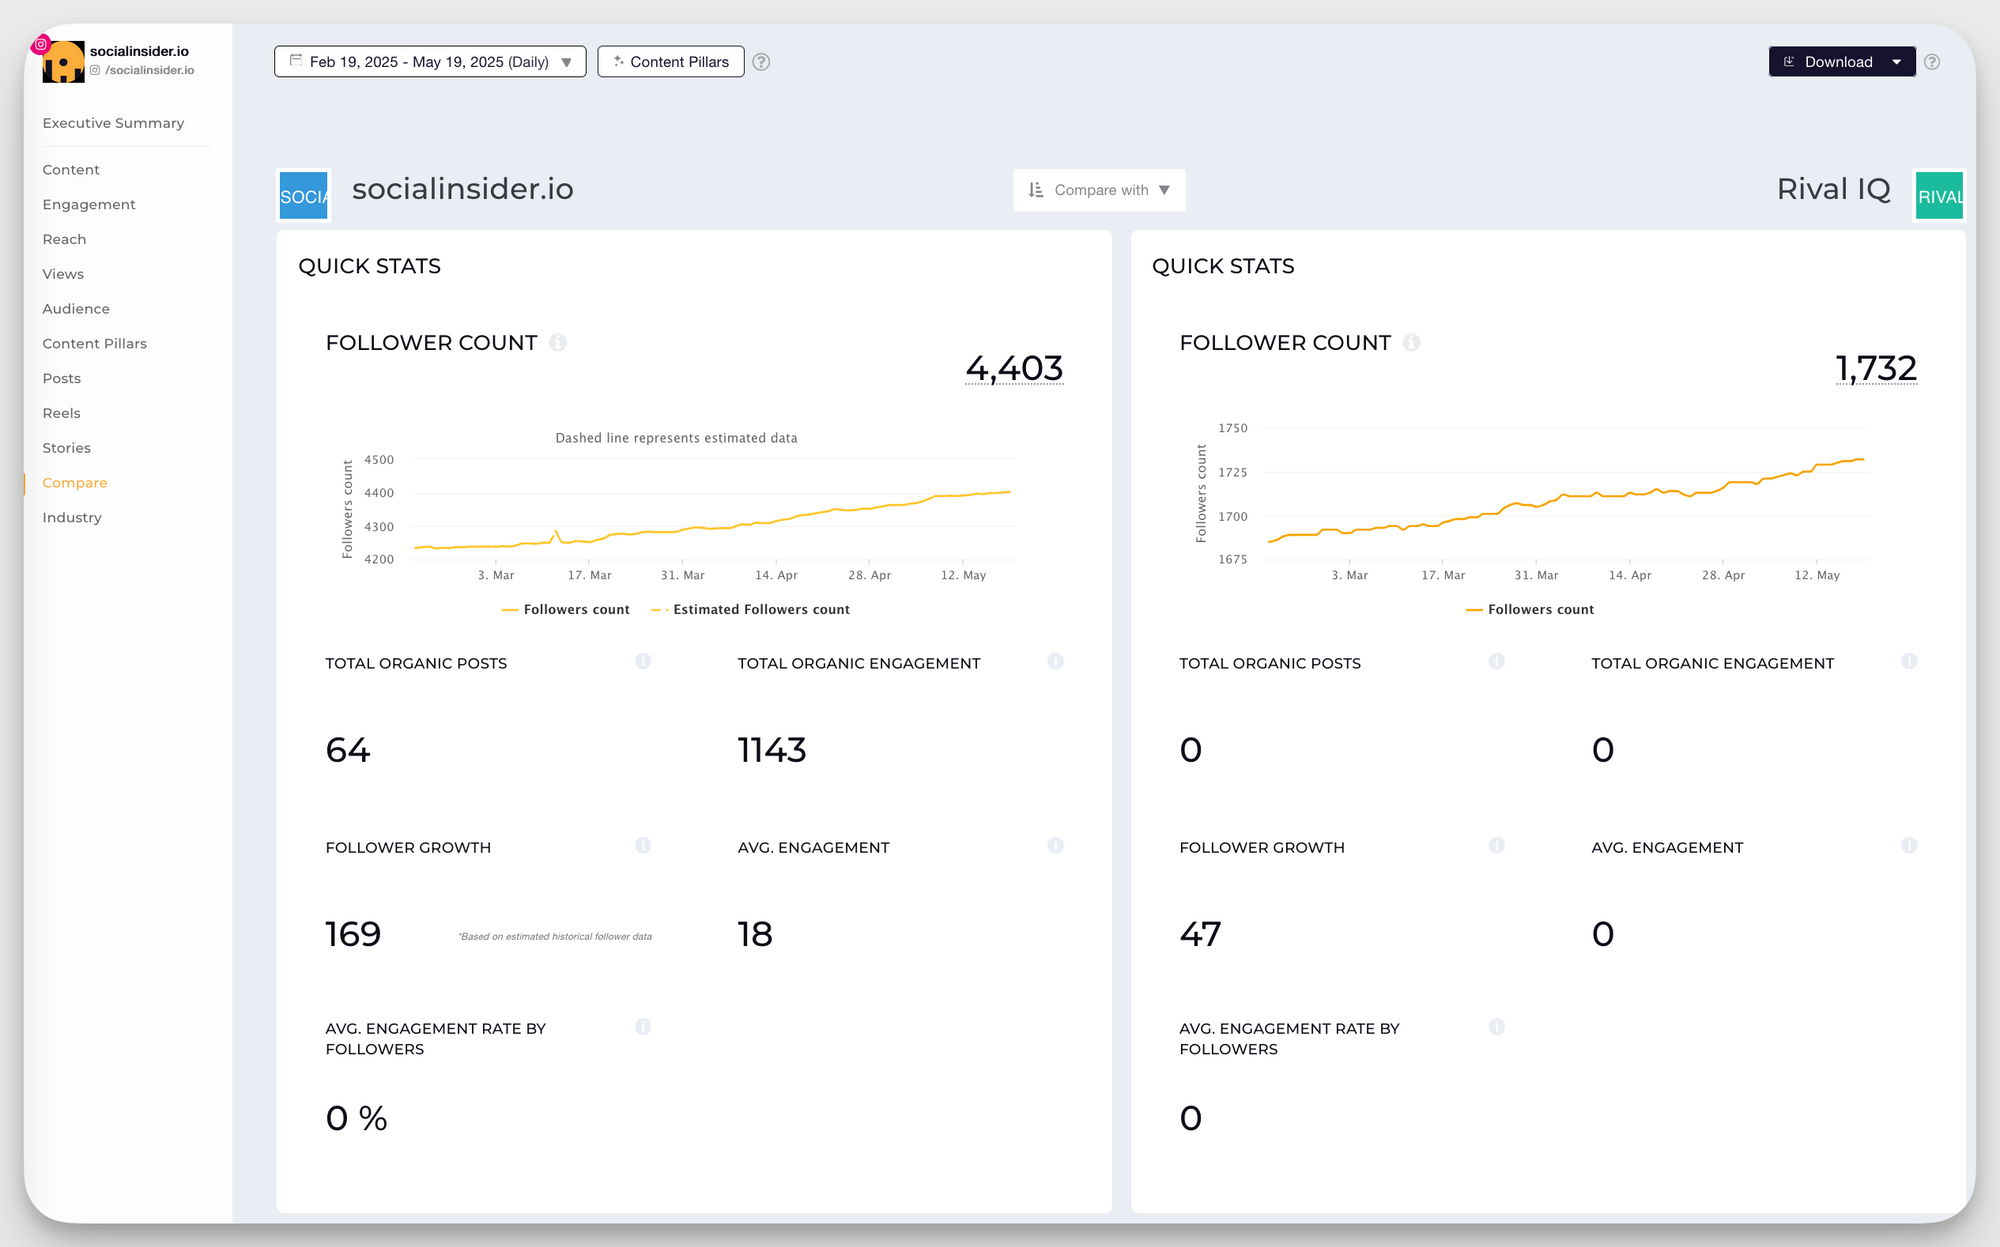
To check reach for your or a competitor’s Facebook page, add the page to your Socialinsider dashboard, open it, and click on Reach. You’ll instantly see key metrics like total reach (for paid and organic campaigns), average reach per post, organic reach rate by followers, and post types sorted by reach (just keep in mind that data for accounts you don’t own is limited due to Facebook’s API).
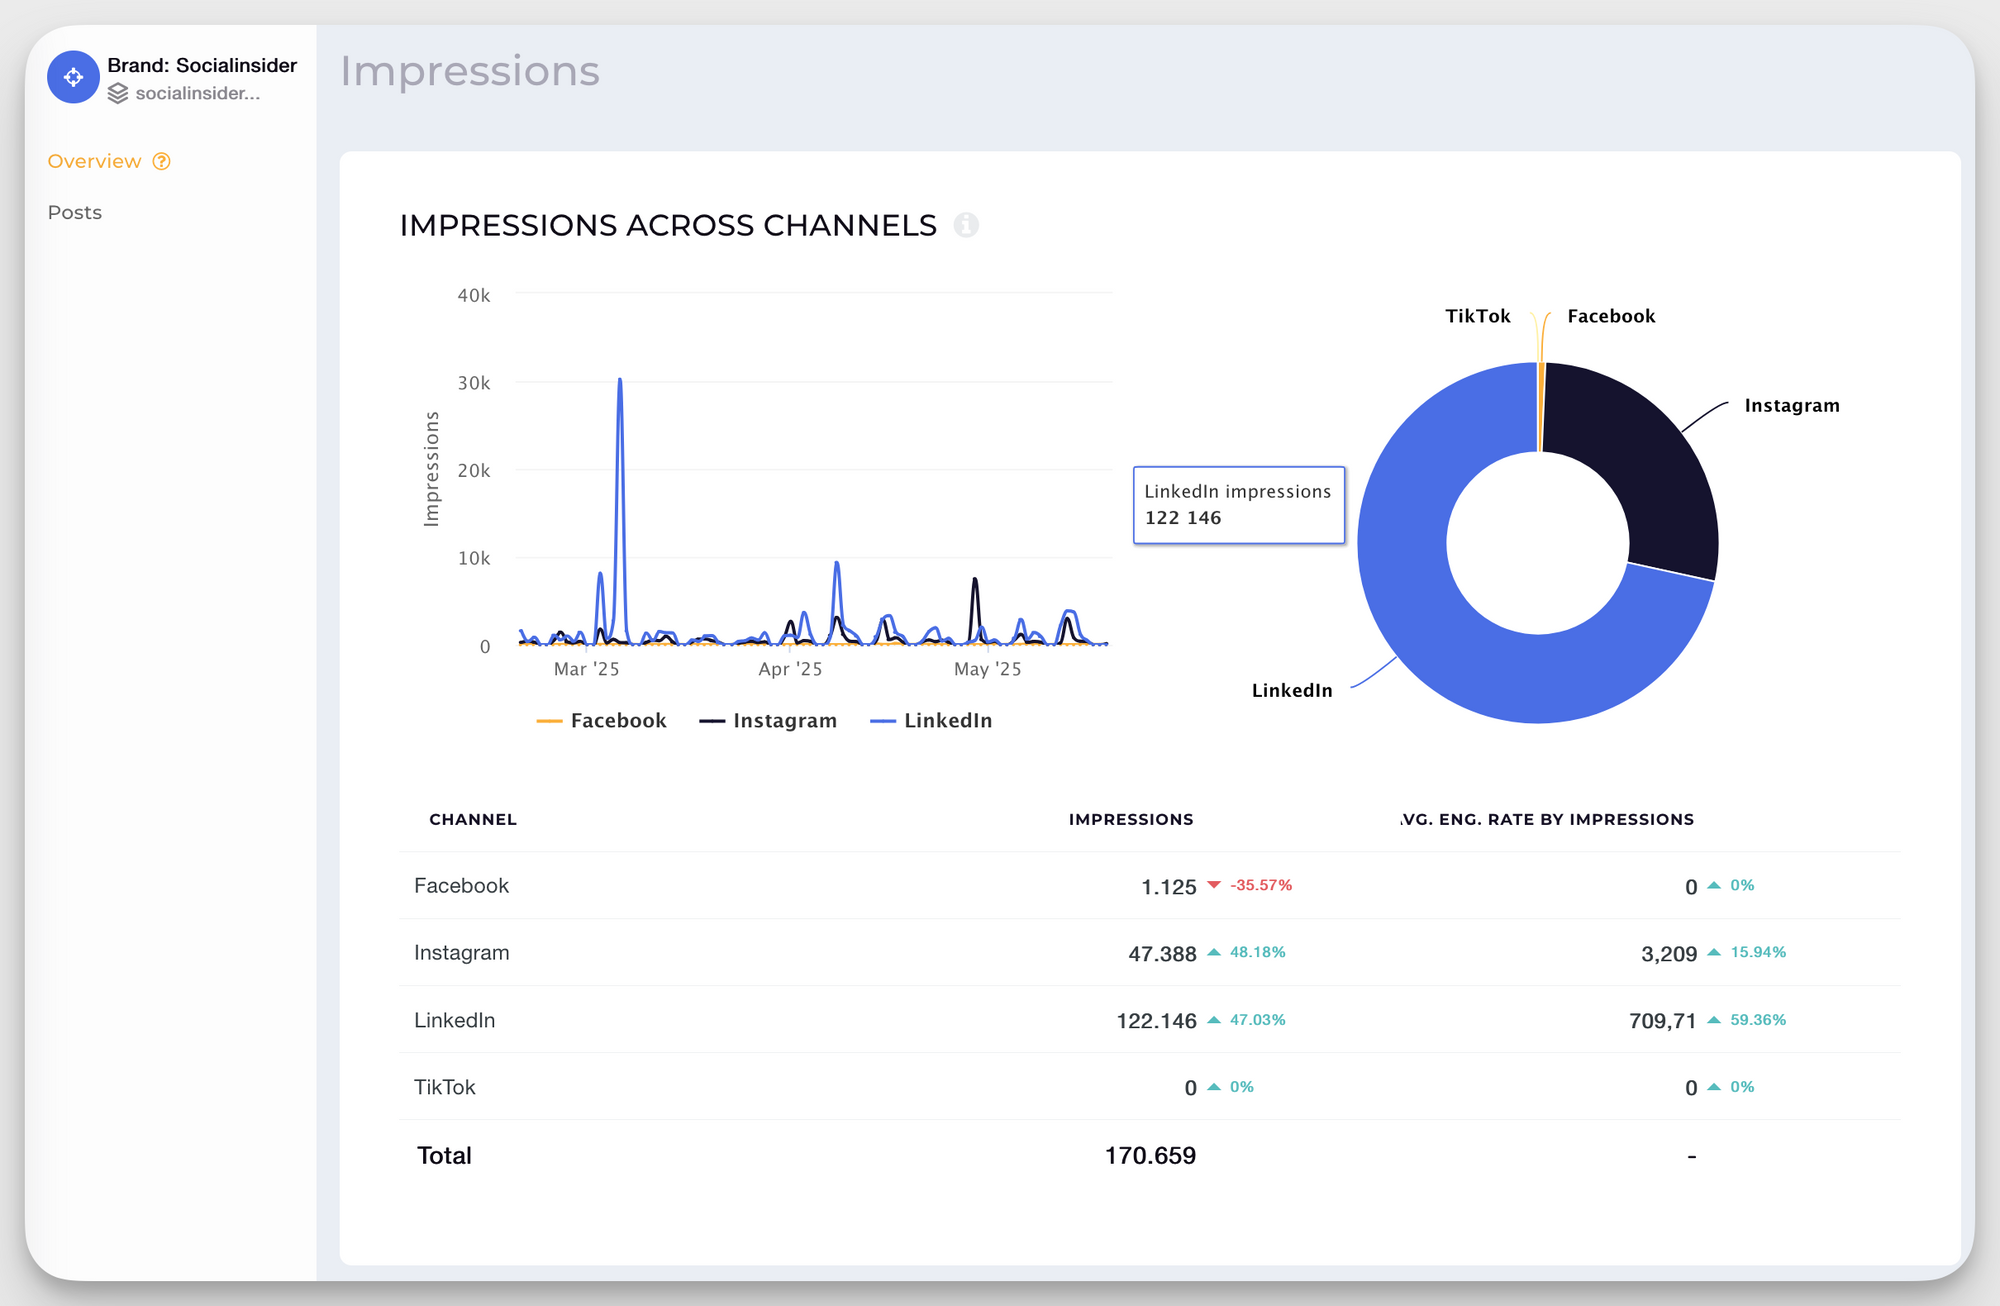
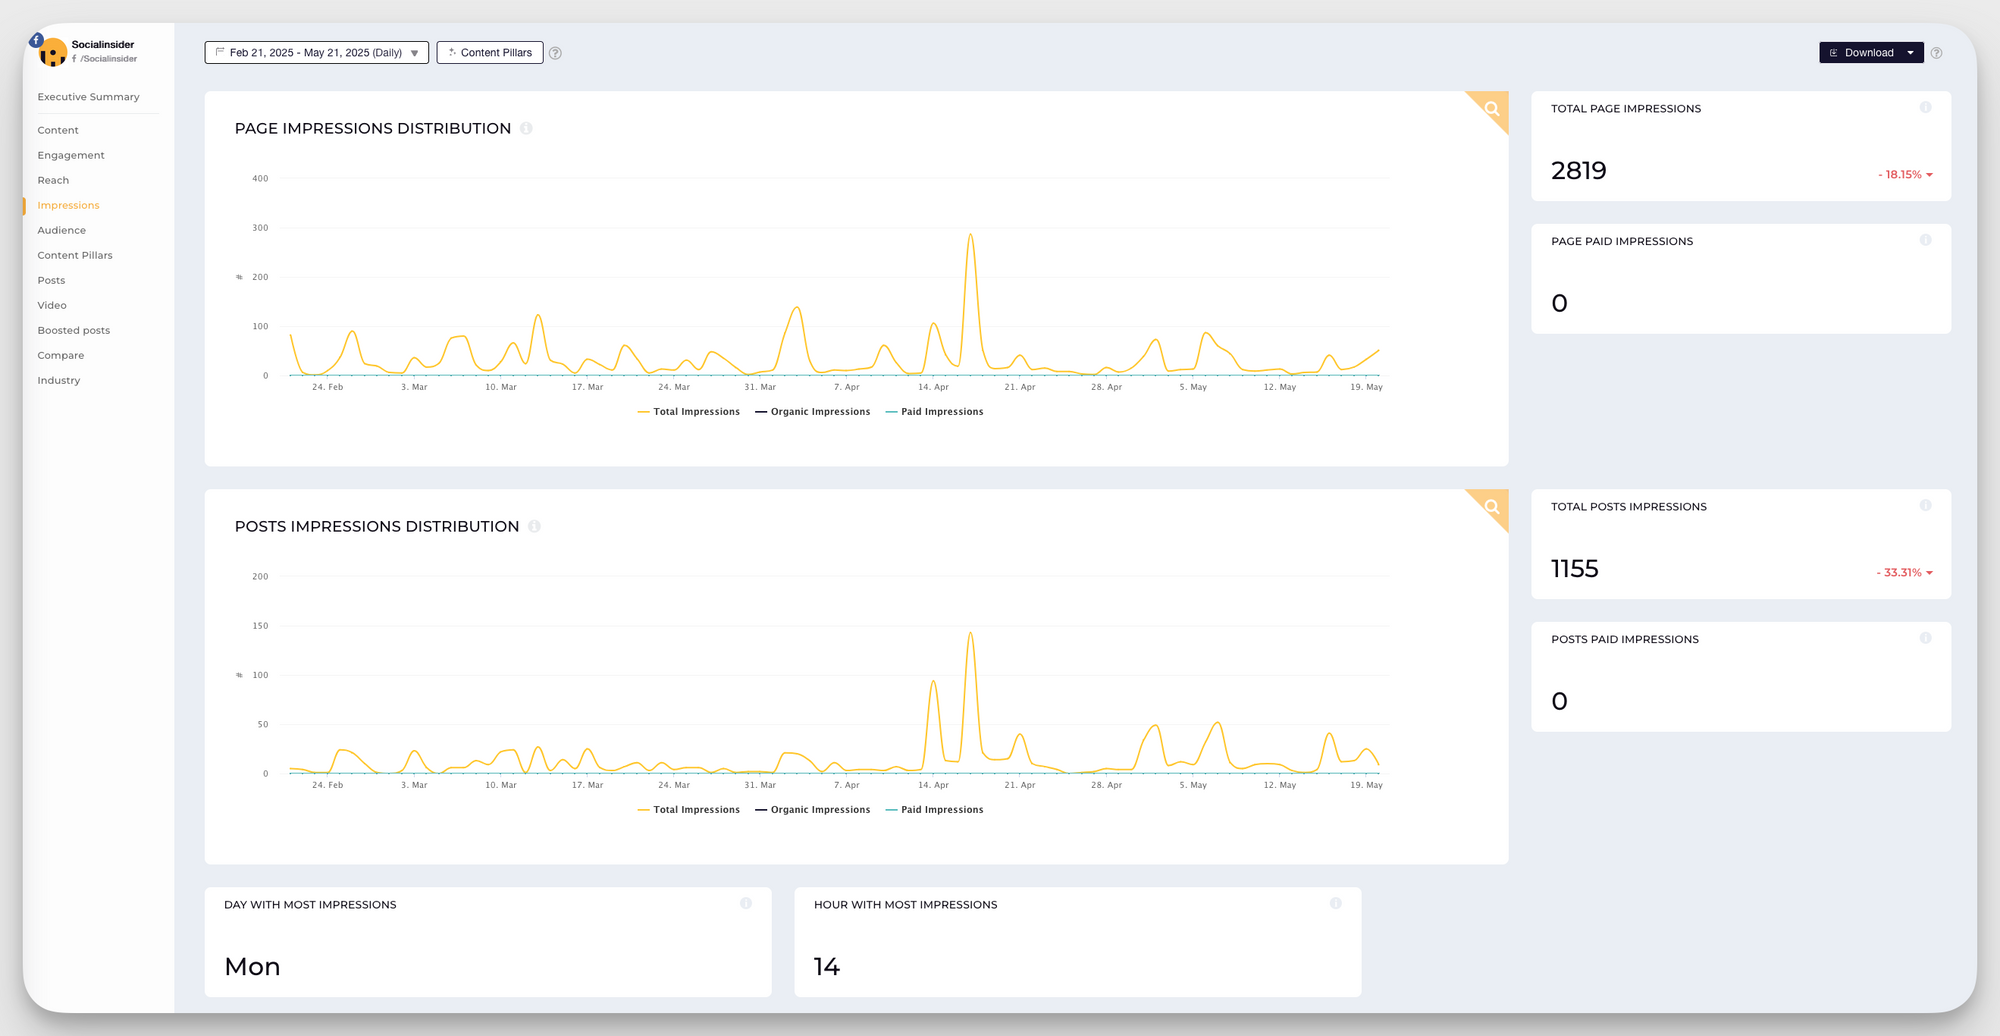
To check impressions for your Facebook page or a competitor’s, check the Impressions tab. You’ll see key metrics like page impressions (both paid and organic) and total post impressions.
Instagram reach vs. impressions
Instagram defines reach as the total number of unique accounts that have seen your content.
- Previously, you could track both reach and impressions. Still, in May 2025, Instagram officially discontinued the impressions metric and replaced it with views, which measures the number of times content is displayed on a user’s screen.
- Instagram shares both metrics through its API, and they can be tracked through third-party analytics tools.
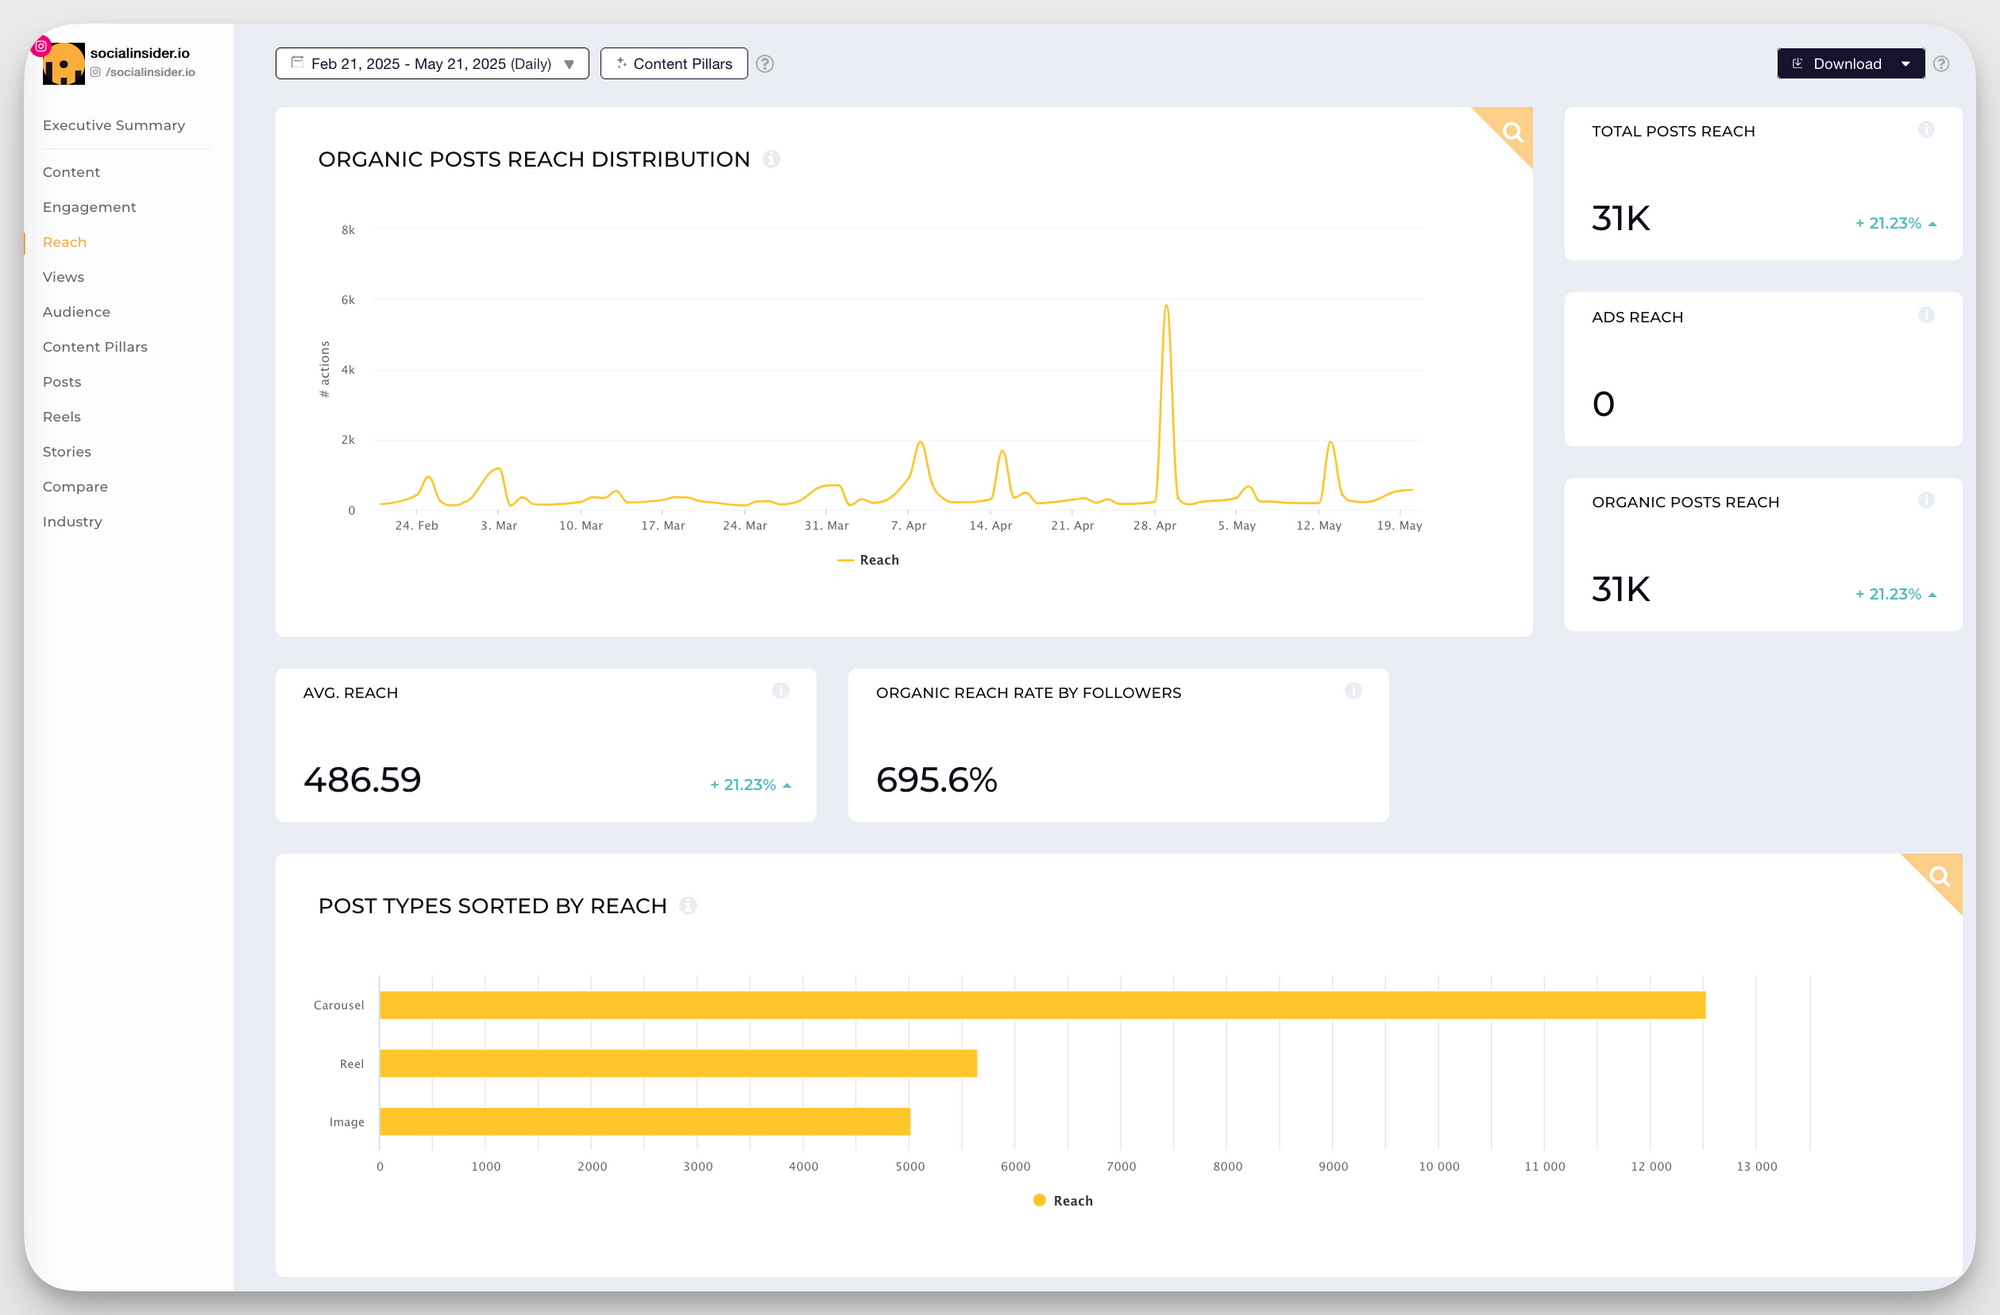
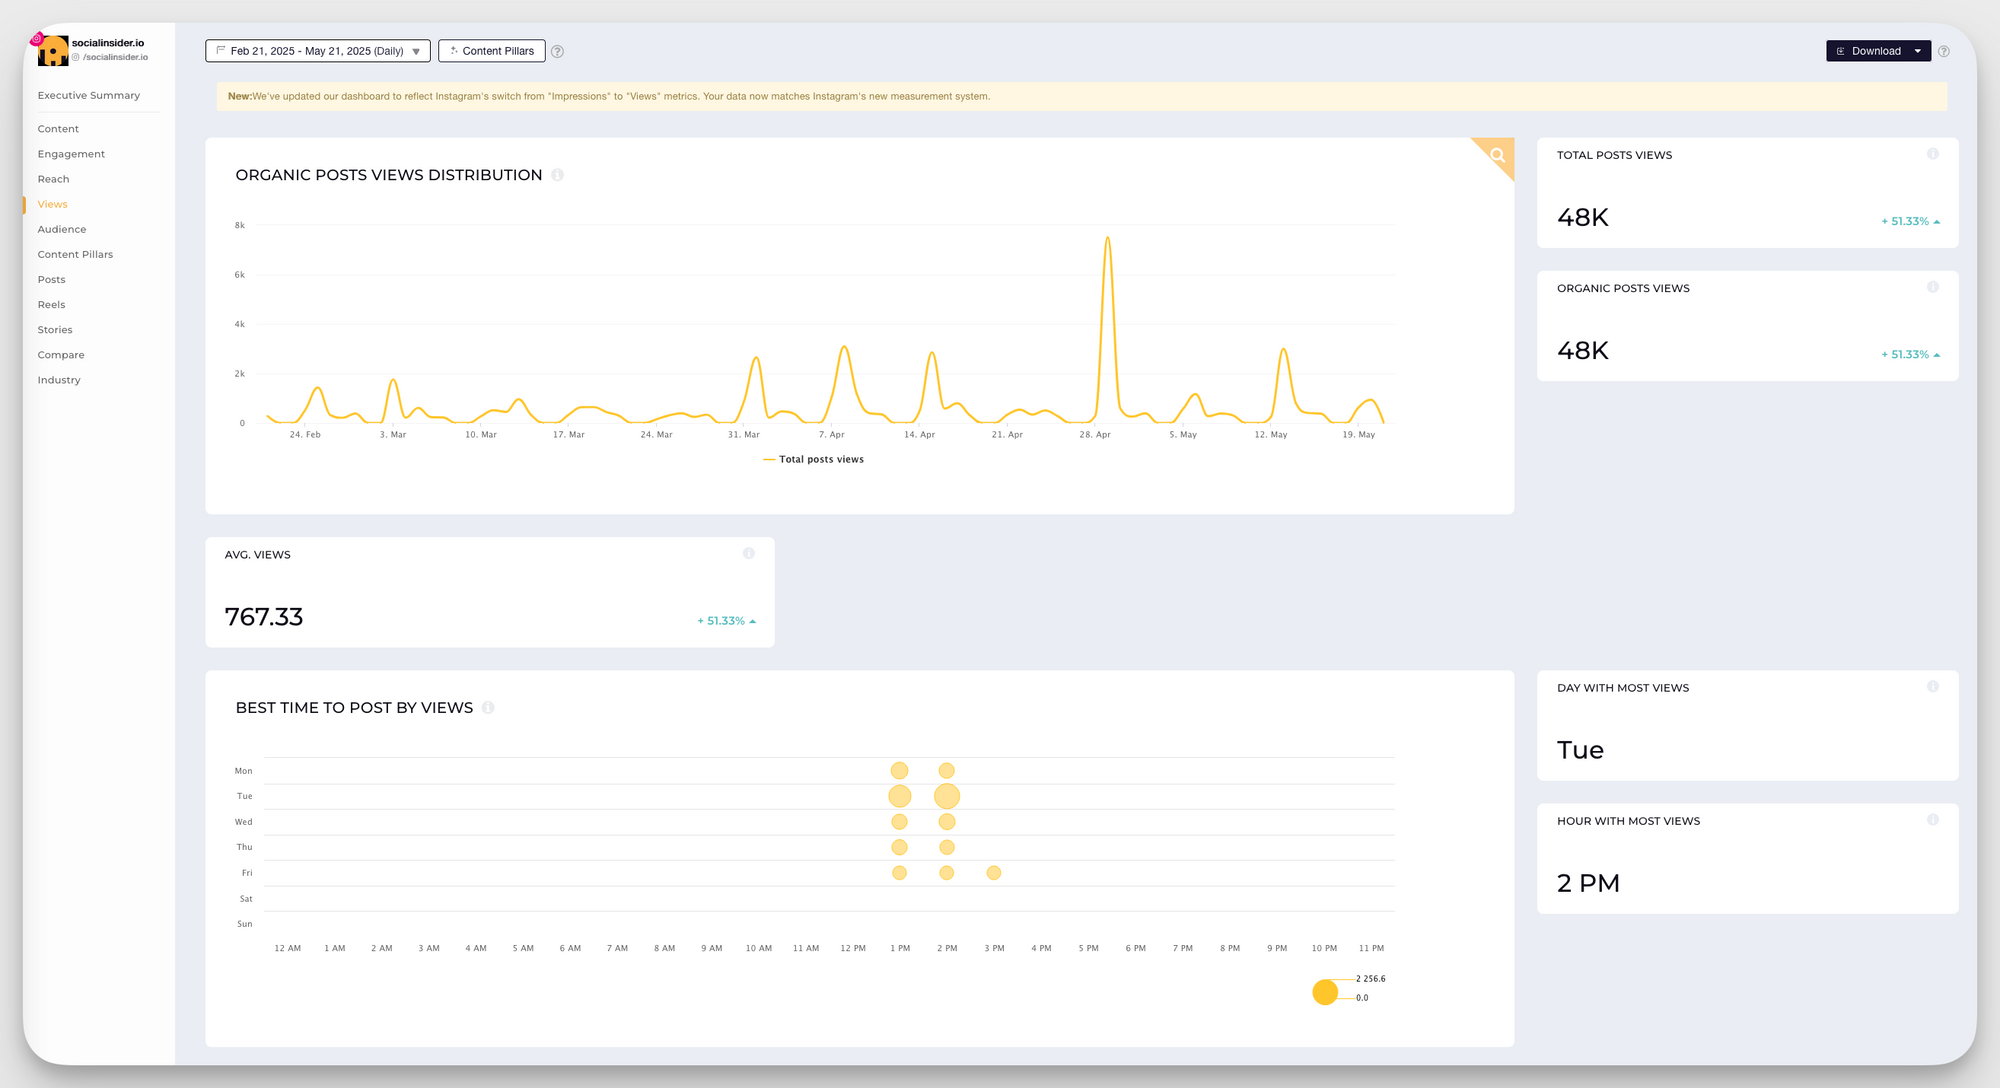
With Socialinsider, you can track Instagram reach over time, segmented by paid and organic sources.
You can also track the number of views generated by your Instagram posts over time.
X (Twitter) reach vs. impressions
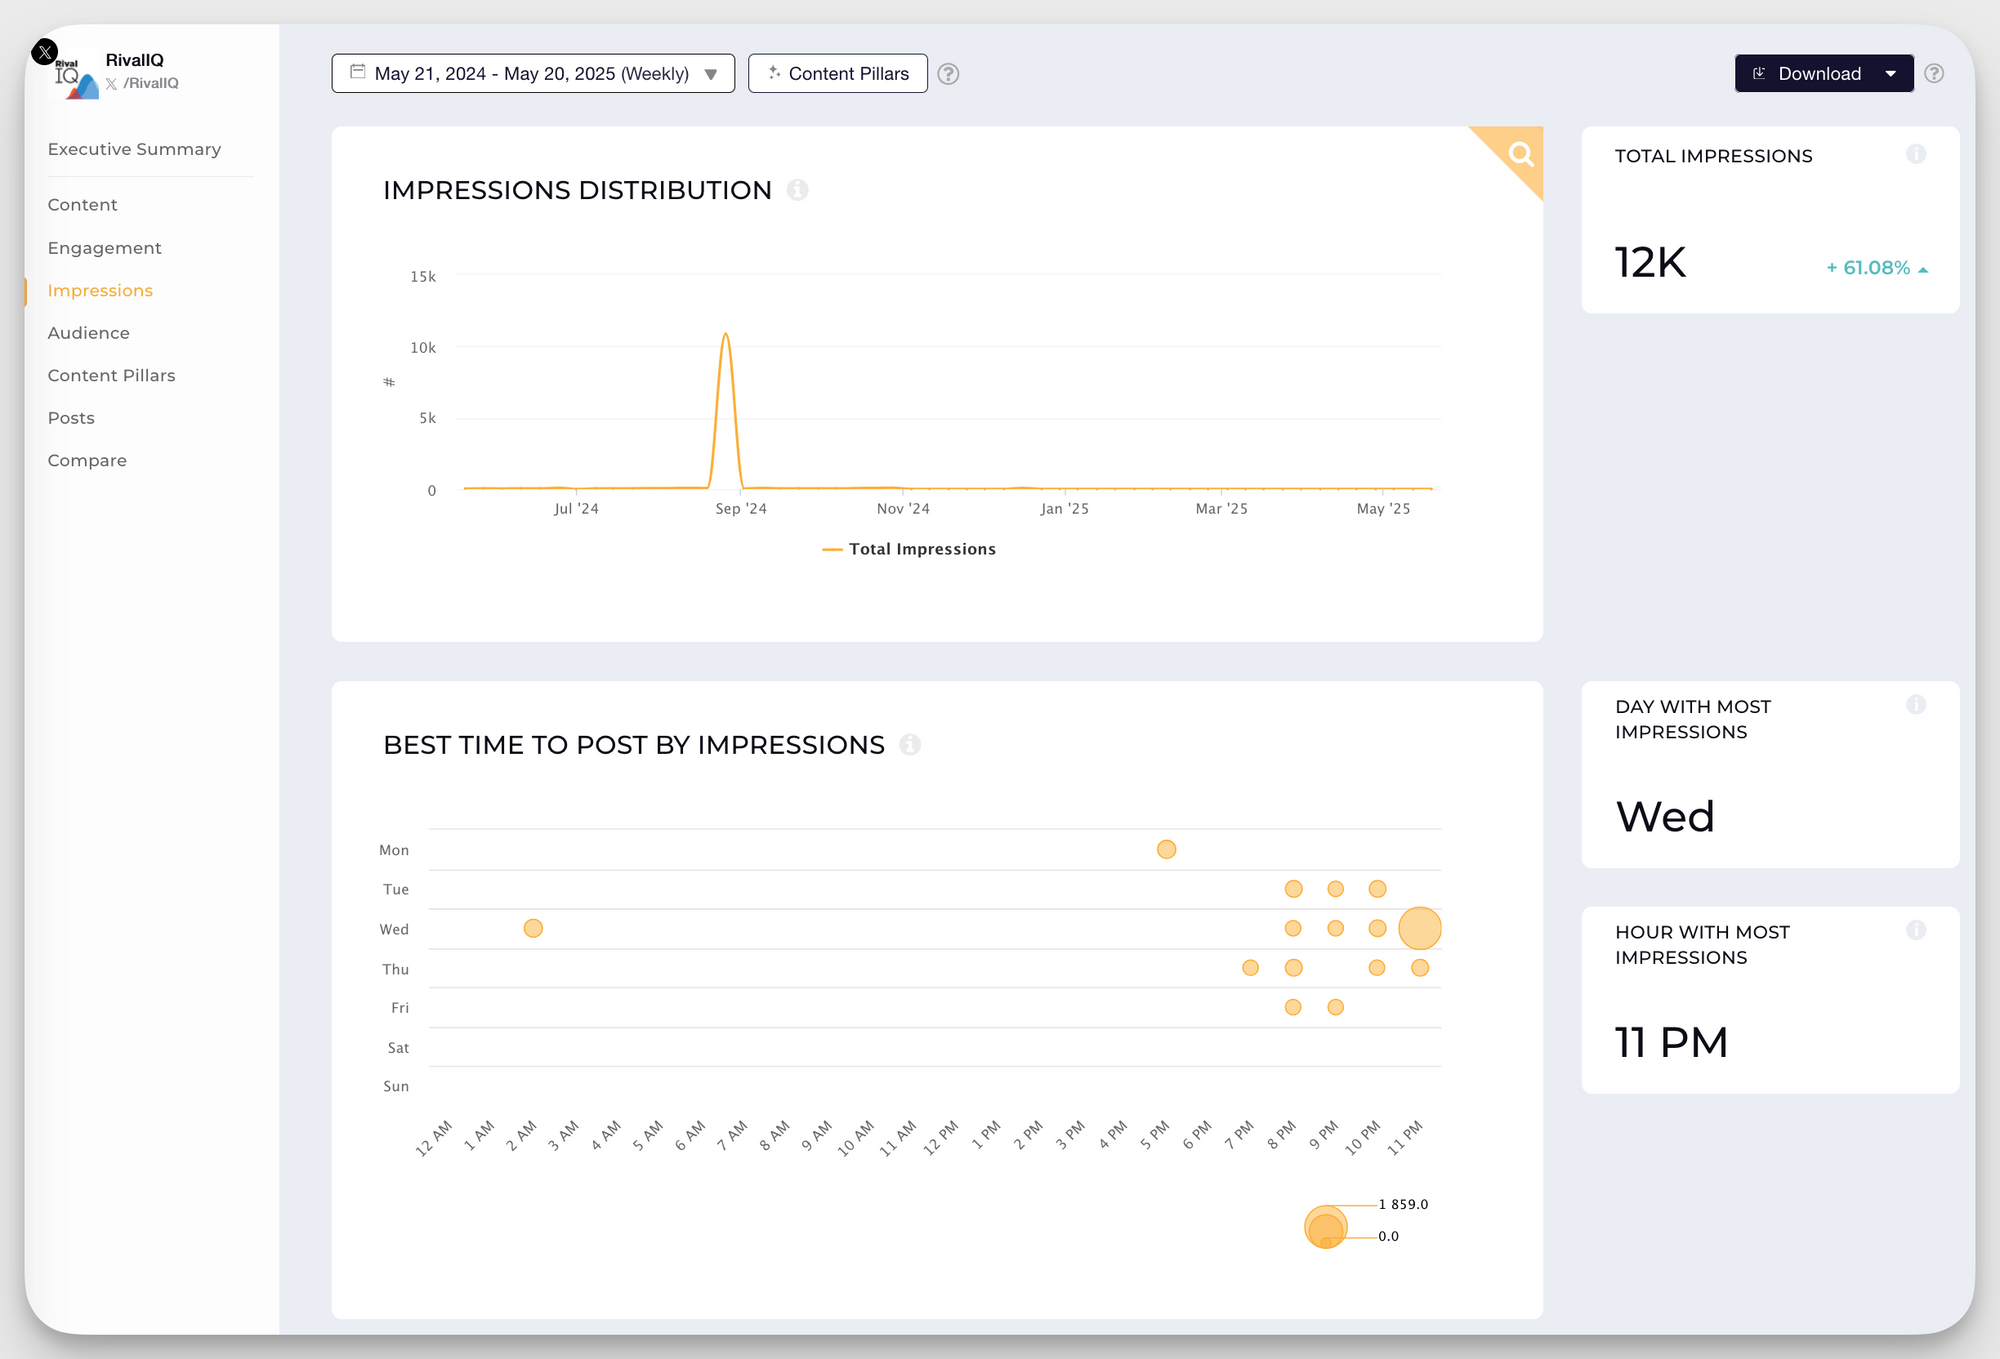
On X, an impression is counted every time a user sees a tweet, whether it’s on their home feed, search results, conversation threads, or a user’s profile. You can get the impressions data for both organic tweets and quoted retweets.
Socialinsider lets you track impressions over time so that you can analyze historical data and identify the best time to post your content.
LinkedIn reach vs. impressions
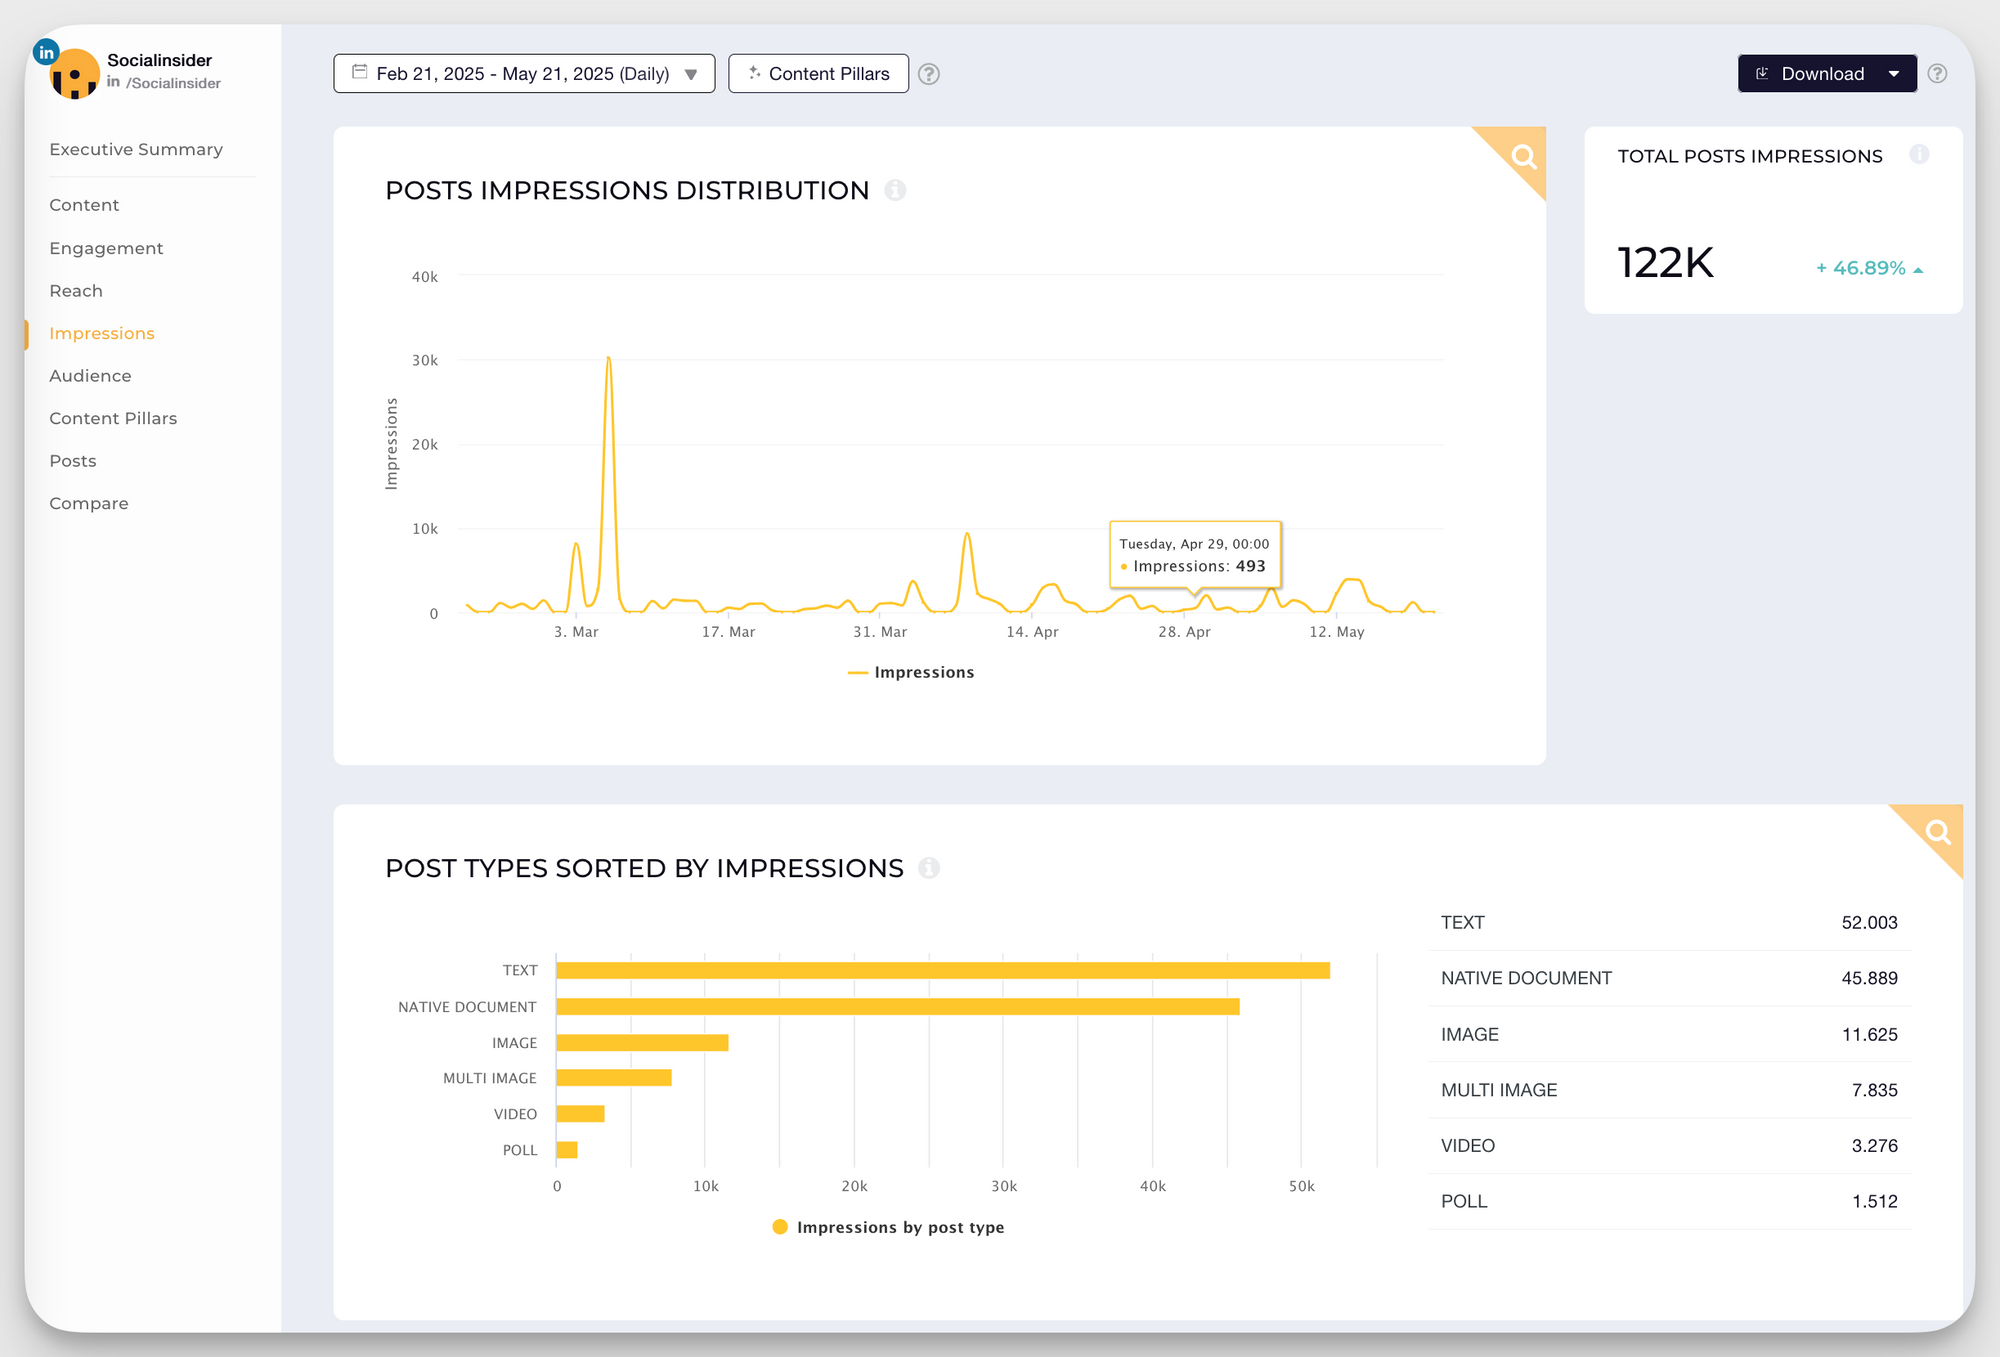
On LinkedIn, impressions refer to the number of times users view a post within a specified time period. The posts can include link shares, images, videos, polls, native documents, text, multi-image posts, and carousels.
To check your LinkedIn performance using Socialinsider, open the Reach tab to see estimated reach, average reach per post, and reach rate by followers, both for your own and competitor pages.
Go to the Impressions tab to view metrics, such as total impressions and the best times to post based on impressions.
Native apps vs. third-party tools: Reach vs. impressions
Let’s break down the differences between native and third-party tools and, more importantly, when to rely on each.
Key differences
Methodology
Native platforms have direct access to their own data. They can typically provide more accurate and comprehensive metrics.
In contrast, third-party analytics tools rely on platform APIs to gather information, and usually, this information is limited.
Discrepancies
When comparing numbers between a native platform and a third-party tool, you’ll almost always find some differences. This doesn’t mean one is wrong and the other is right. It just reflects how each system collects social media data and processes it.
Native platforms typically show higher social media reach and impression figures than third-party tools. These differences, combined with varying data refresh rates, can result in slight discrepancies across reporting periods.
Metrics
Native platforms often offer more detailed breakdowns of these metrics and differentiate between organic and paid social media campaigns more clearly.
Depending on API access, third-party tools may display a clear breakdown of organic and paid data, combine them into one, or exclude them entirely.
When to use native apps or a third-party tool to get reach and impressions
Here’s when you should use native platform analytics:
- You need granular performance data for a particular platform. For example, if you’re optimizing Instagram ads and need to see exact reach vs. impressions breakdowns for each ad set.
- You’re working inside platform-specific ad managers like Meta Ads Manager, YouTube Studio, or LinkedIn Campaign Manager, where you can access post-level and audience segmentation data not available elsewhere.
Here’s when you should use third-party analytics tools:
- You want a unified view of performance across Facebook, Instagram, LinkedIn, X (Twitter), YouTube, and TikTok in one dashboard.
- You need a comparative analysis between different channels, such as comparing engagement rates across Instagram and LinkedIn for a product launch.
- You need more advanced analytics features like competitor benchmarking, automated reporting, and historical performance analysis beyond the typical 30/60-day native limit.
Related metrics and relationships
Take a look at how reach and impressions relate to other metrics so that you can better analyze performance across the marketing funnel.
- Reach vs. views: Reach counts unique users who saw your content, while views track how many times the content was actively watched.
- Reach vs. engagement: Social media engagement metrics (likes, shares, comments) reflect how users interact with your content. High reach with low engagement could signal that your content isn’t resonating with the audience.
- Impressions vs. clicks: This measures how often people saw your post and took action. It helps calculate CTR (click-through rate).
Reach introduces your content to new users (top of the funnel), impressions reinforce your message through repeated exposure (mid-funnel), and engagement or clicks show audience interest and intent (bottom of the funnel). Tracking all three helps identify where users drop off and what makes them take action.
CPM (Cost Per Mille), which measures the cost to deliver 1,000 impressions through paid ads, is also a key metric for evaluating the efficiency of your brand visibility efforts.
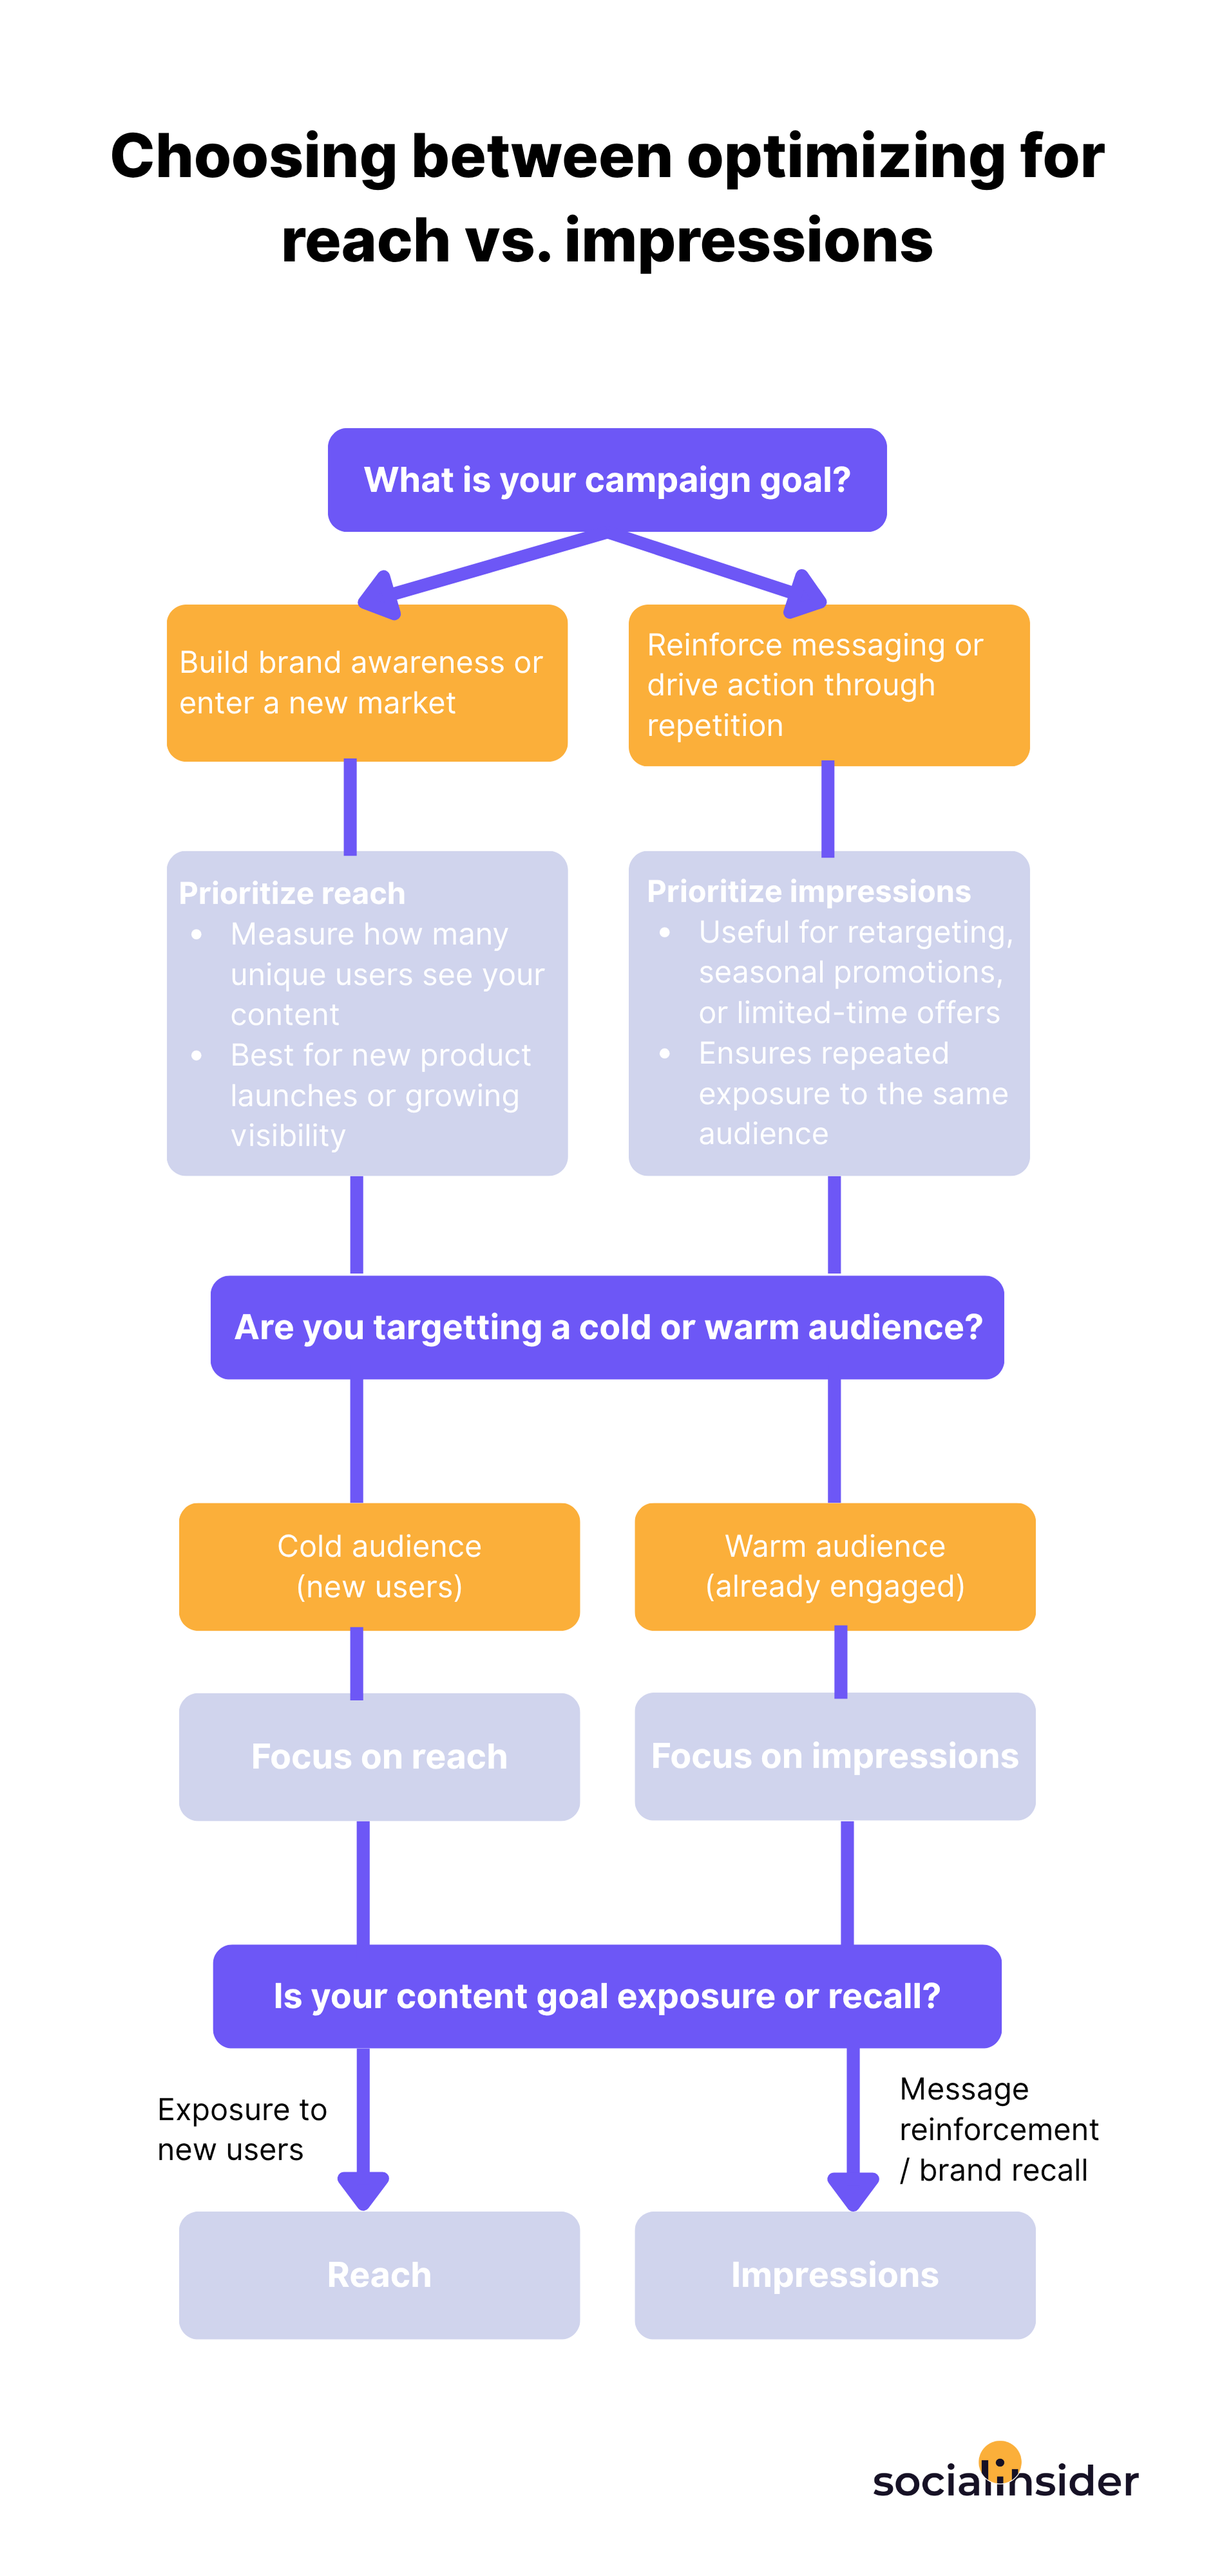
When to prioritize reach vs. impressions
Whether you should be prioritizing reach or impressions (or both) will depend on your campaign goals and current social media marketing strategy.
Let’s take a look at when to prioritize each:
Campaign objectives that favor reach: If your campaign goal involves improving brand awareness or reaching new people, prioritize reach to measure how many unique users saw your content. For instance, if you’re launching a new product or entering a new market, focus on reach to ensure you’re connecting with as many new people as possible.
Campaign objectives that favor impressions: If you are pushing out campaigns where repetition is important (such as retargeting), prioritizing impressions is the best way to go. For instance, if you are promoting a seasonal sale, building a high-impression campaign can repeatedly remind users of when the sale is and encourage them to make a purchase.
Is reach better than impressions?
Both serve different purposes and have distinct roles. The right metric will depend on your content goals. Use reach to expand your audience and impressions for repeated exposure as well as brand recall.
Measuring and analyzing reach and impressions
You can monitor reach and impressions using native platform analytics (such as Meta Business Suite, LinkedIn Analytics, or TikTok Creator Tools) or third-party tools like Socialinsider, which provide a unified dashboard for cross-platform comparisons.
Native tools offer more granular, real-time data, while third-party tools simplify reporting, especially when managing multiple brands or platforms.
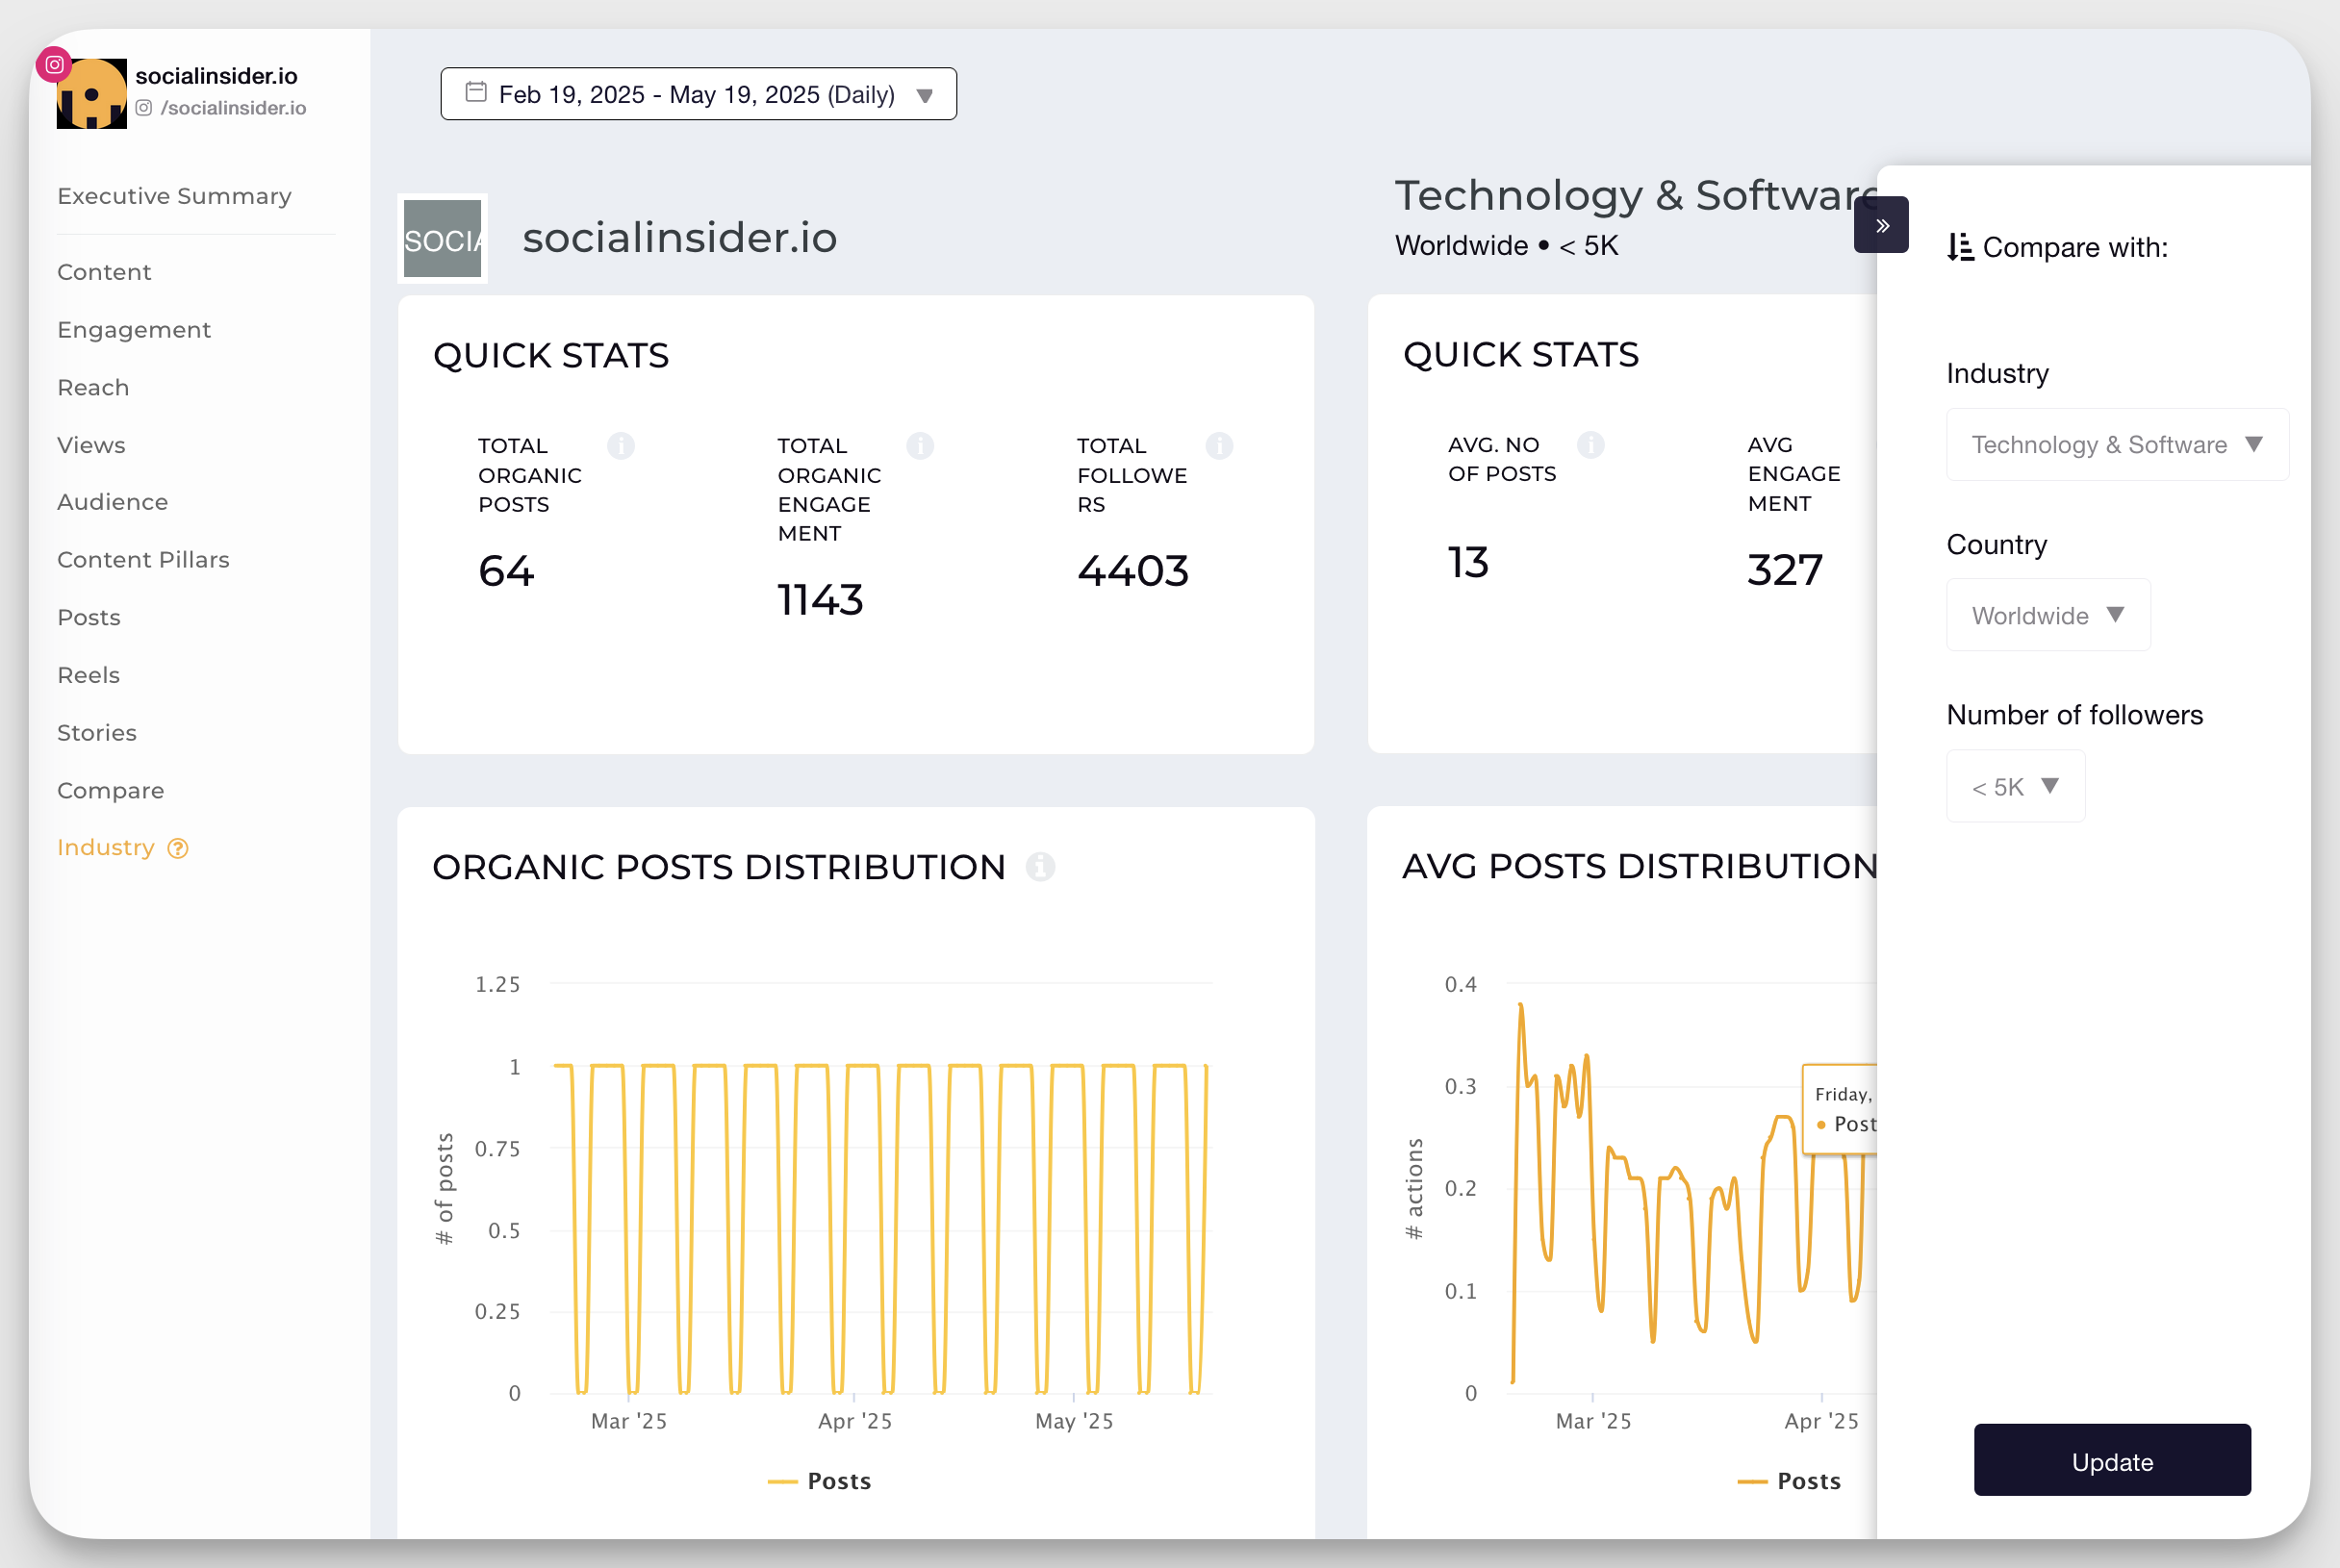
Set benchmarks by industry and platform
Your raw, isolated numbers will never tell the full story. Even if the reach increased, is it really good or just barely good enough as compared to your competitors?
To truly assess your brand’s performance, you’ll have to benchmark your reach and impressions against your industry or competitors. Socialinsider’s Social Media Industry Benchmark Reports provide up-to-date, channel-specific data to help you analyze your brand’s performance.
Red flags in the data that can indicate problems
Here are the main red flags that you should watch out for when analyzing reach and impressions:
- High impressions, low reach: It means the same users are seeing your content repeatedly, and you’re not able to reach new users. To fix it, experiment with new creatives and audience targeting.
- High reach, low engagement: It means a lot of new users see your content, but they are just not interacting with it. To fix it, consider changing your content mix and messaging.
- Sudden drops in reach and/or impressions: A decline in visibility can be due to a number of factors, including algorithm changes, reduced posting, or audience disengagement. Check for platform updates, review your posting frequency, and analyze past top-performing content to identify optimum timings or best-performing formats.
How to visualize and report on these metrics effectively
Visualizing reach and impressions over time helps identify patterns and seasonal spikes. When you include these metrics in your social media reports alongside engagement, clicks, and conversions, you get a fuller picture of how your content supports broader business goals.
Socialinsider simplifies the way you analyze and visualize reach and impressions with built-in historical tracking.
Its automated visual reporting feature allows you to generate ready-to-share reports with custom charts, date ranges, and performance breakdowns.
Compare your performance against competitors or industry standards using the competitive benchmarking feature. Many of our clients have found that what looks like ‘good reach’ in isolation might actually be underperformance when viewed against industry benchmarks.
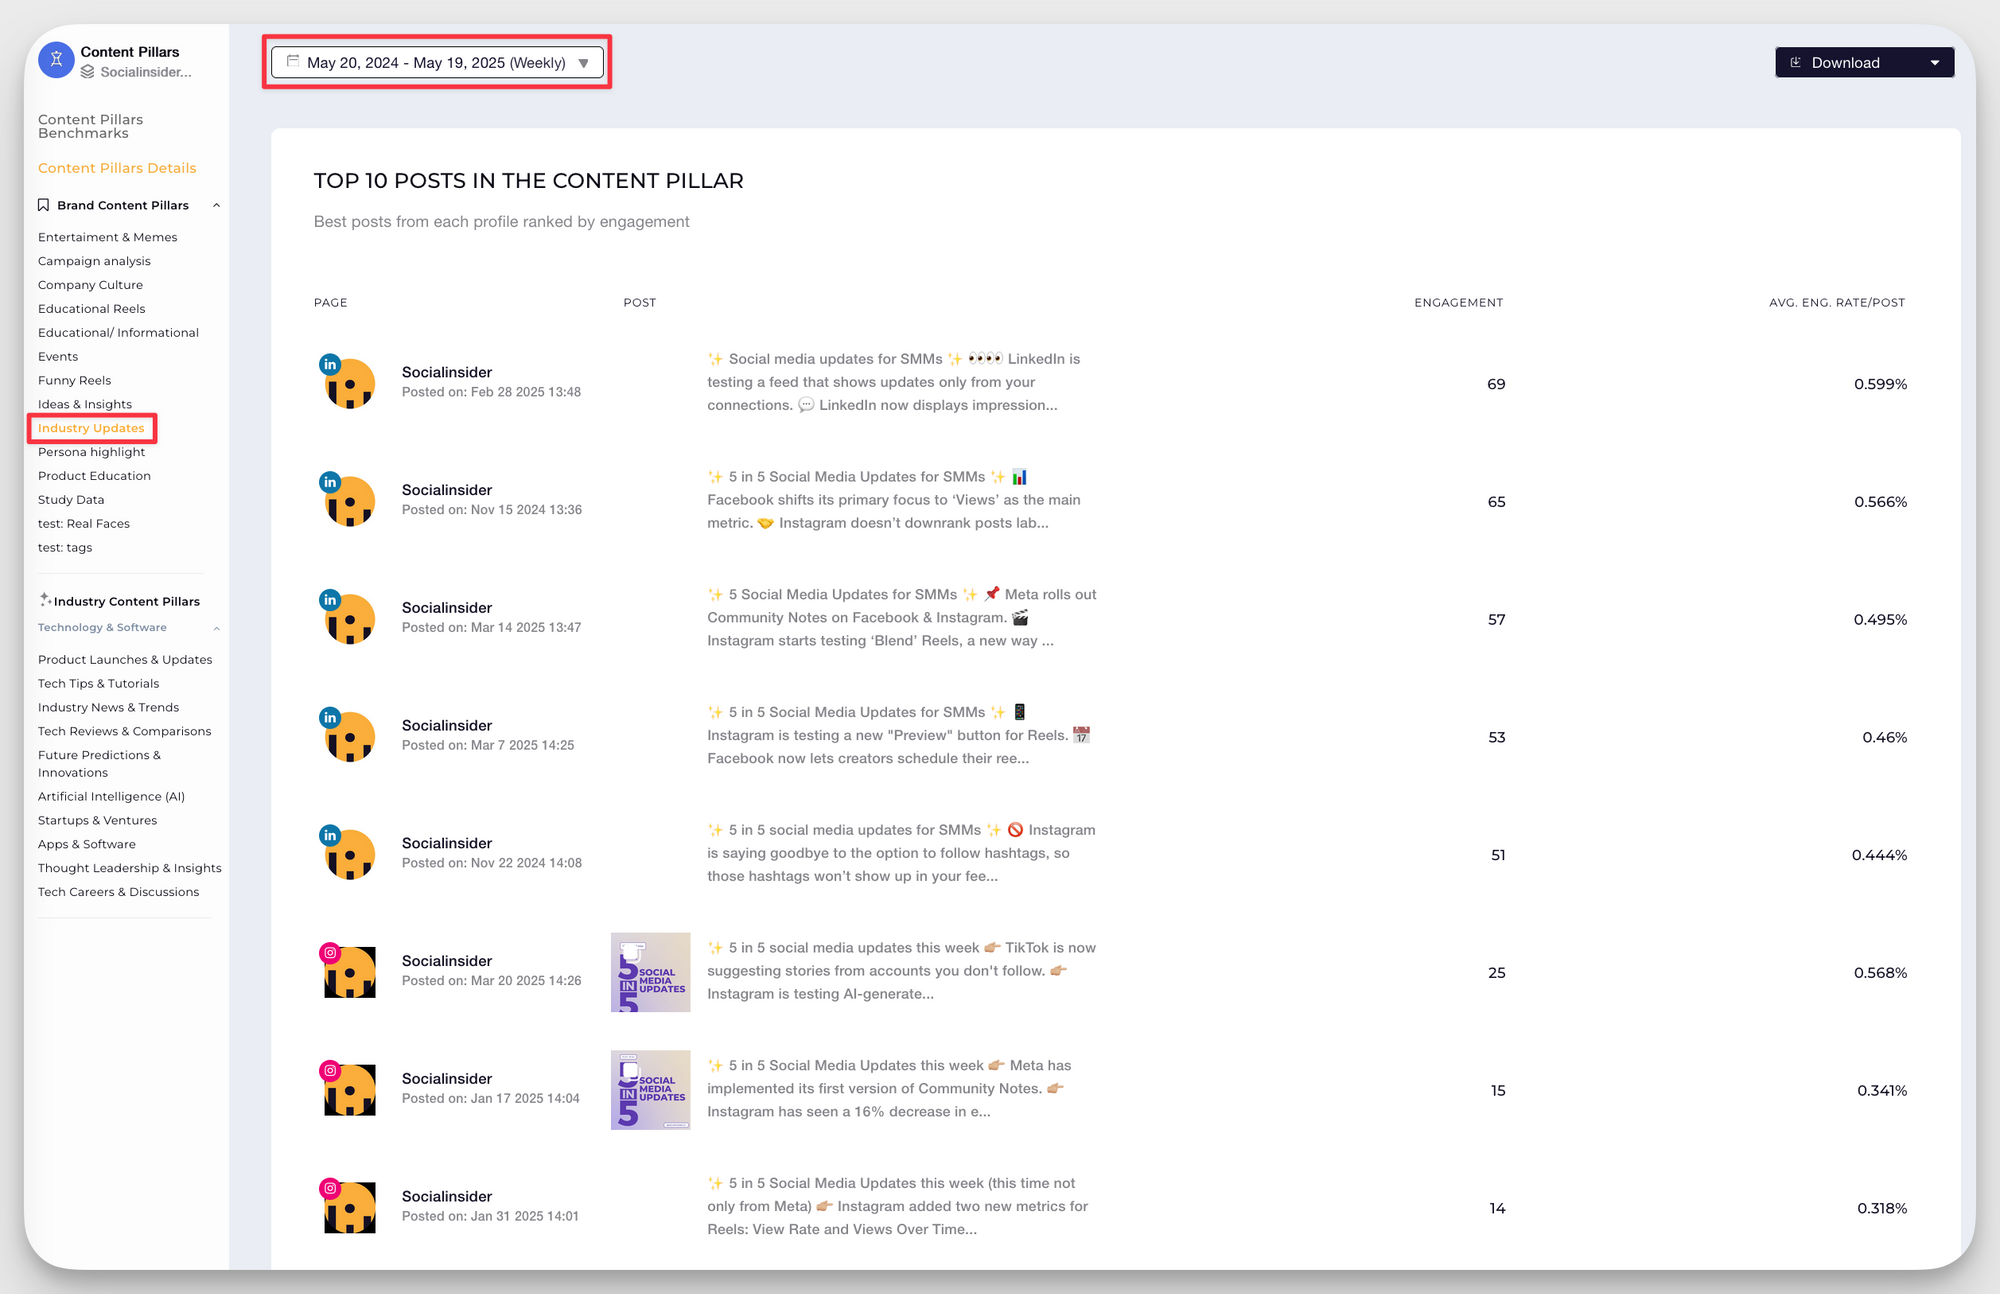
If you want to go more granular, you can group specific campaigns into content pillars and analyze reach vs. impressions for each individual campaign to determine which topics (as well as platforms and post formats) generate the best results for your brand.
You can also conduct this analysis for competitors to see what works at an industry level and identify topics to approach.
Future of reach and impressions
For years, impressions have been considered the main metric as they track how many times your content appears on a screen. But impressions don’t account for how much of the content is actually consumed. As users scroll faster and attention spans shrink, the big question is: is anyone even watching your content, or are they just scrolling through it?
This shift in user behavior is reshaping what success looks like on social media. One of the clearest signs of this shift is Instagram officially phasing out the impressions metric and replacing it with views. While on the surface, this may seem like a minor change, it’s actually a significant and possibly long-term shift in how platforms measure performance and define content value.
Passive viewing is now a legitimate and meaningful form of engagement, particularly on video-first platforms like TikTok and YouTube.
For brands, this shift requires taking a more intentional approach to their social media content strategies:
- Create for the ‘quiet audience’: Not all of your prospective customers will like, comment, or share, but they will watch, listen, and maybe even save your posts. Build content for these passive viewers instead of just chasing active engagement.
- Focus on meaningful connections: Instead of just trying to reach as many people as possible, brands should focus on content that connects with their audience and helps build lasting brand loyalty.
- Build sophisticated distribution models: Rethink how and where content is shared. Use analytics to understand where your viewers are most likely to consume (not just see) your content.
Final thoughts
Reach and impressions aren’t interchangeable metrics. They serve different roles across the funnel.
Prioritize reach when your goal is to grow brand awareness or connect with new audiences. Focus on impressions when you need repeated exposure, like in retargeting or promotional campaigns.
Track both over time, benchmark against competitors, and look beyond surface numbers to uncover what’s really driving results.
With Socialinsider, you can automate the entire process of tracking, benchmarking, and reporting your brand’s social media performance. Start your free trial today.
FAQs about reach vs. impressions
1. Is reach better than impressions?
Neither is inherently better - they serve different purposes. Reach measures unique people who saw your content, while impressions count total views (including repeat views by the same person). Reach is better for understanding audience size and brand awareness, while impressions are better for measuring content frequency and overall exposure. Choose based on your campaign goals.
2. Is CPM for reach or impressions?
CPM (Cost Per Mille) is traditionally calculated based on impressions, not reach. It measures the cost per 1,000 impressions. However, some platforms also offer CPM based on reach (sometimes called CPM-R or unique CPM), which calculates cost per 1,000 unique people reached. Standard CPM refers to impressions unless otherwise specified.
3. What is the difference between impressions and views?
Impressions count when an ad or post is displayed on someone’s screen, regardless of whether they actually looked at it or engaged with it. Views typically require some level of engagement or attention - for example, video views often require watching for a minimum duration (like 3 seconds), or the content needs to be in the viewable area of the screen. Impressions are broader; views are more selective and indicate actual consumption.
4. What is the difference between reach and engagement?
Reach measures how many unique people saw your content - it’s about audience size. Engagement measures how people interact with your content through likes, comments, shares, clicks, saves, etc. - it’s about audience response. You can have high reach with low engagement (many people saw it but few interacted) or low reach with high engagement (fewer people saw it but most of them interacted). Reach indicates exposure; engagement indicates interest and connection.
Ritika Tiwari
Ritika Tiwari is a content writer and strategist with over 10 years of experience creating content for SaaS B2B brands. Outside of work, you’ll likely find her somewhere near the ocean.

Analyze your competitors in seconds
Track & analyze your competitors and get top social media metrics and more!
You might also like


Improve your social media strategy with Socialinsider!
Use in-depth data to measure your social accounts’ performance, analyze competitors, and gain insights to improve your strategy.