How to Create a Comprehensive Facebook Analysis Report: Expert’s Insights
Read along and discover how to create a comprehensive Facebook analysis report, based on experts' tips and insights.

You walk into the board meeting clutching your Facebook report. Slides are ready, coffee’s kicking in, and you’re hoping this isn’t another round of blank stares and “Umm, what does this mean for our business?”
This time, though, the room nods. They get it.
Why?
Because every chart connects to a business goal, every insight has a clear takeaway. That’s the power of a strong Facebook analysis report. Whether you’re making a report for one CEO or fifty clients, the right report makes Facebook marketing look worth every dollar.
For a real-world perspective, I reached out to someone who’s been in the social media space long before Reels were a thing. Meet Megan Bowen, founder of Meg B Marketing — 80+ clients served, 210K followers built, and 32M video views delivered.
Let’s learn from her experience in this guide.
Key takeaways
- How should your Facebook analytics report be structured: A well-structured Facebook analytics report includes an executive summary, audience insights, engagement analysis, content performance, competitor benchmarks, and clear next steps that tie data to business goals.
- How to create your Facebook analysis report: A step-by-step process: Start by setting clear goals and KPIs, gather data from native and third-party tools, visualize it clearly, add actionable insights, and share customizable dashboards for real-time tracking.
- How to extract insights from your Facebook analysis report:Go beyond surface metrics by spotting trends, understanding audience behavior, comparing campaigns, and linking engagement to meaningful conversions or business outcomes.
- Facebook reporting best practices: Make your reports visual and narrative-driven, focus on translating data into actionable insights your audience cares about, and automate reporting to save time while maintaining accuracy.
How should your Facebook analytics report be structured
When I spoke with Megan, she pointed out that the structure of a Facebook analytics report depends on who it’s for and what you’re trying to achieve. One client might care most about content performance, while another may prefer starting with audience insights.
But every solid report includes a few essentials. Here are those and what to include in them.
Executive summary
I recommend starting with this section because it gives a quick overview of your most important findings.
It could cover things like:
- Growth trend in terms of followers, engagement, or website traffic through Facebook.
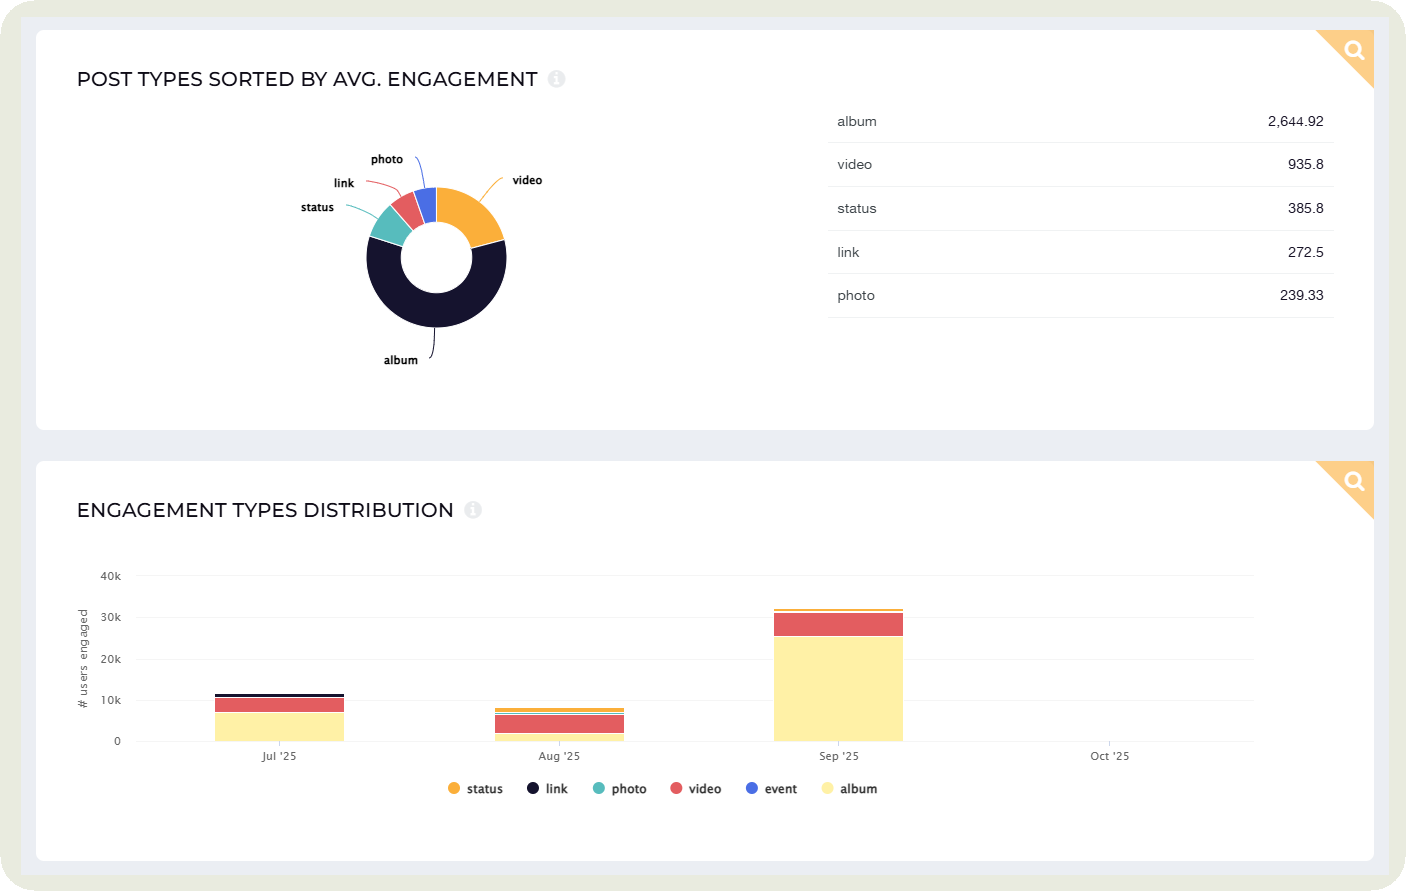
- If you witnessed major engagement shifts, such as Album posts getting more engagement than Reels.
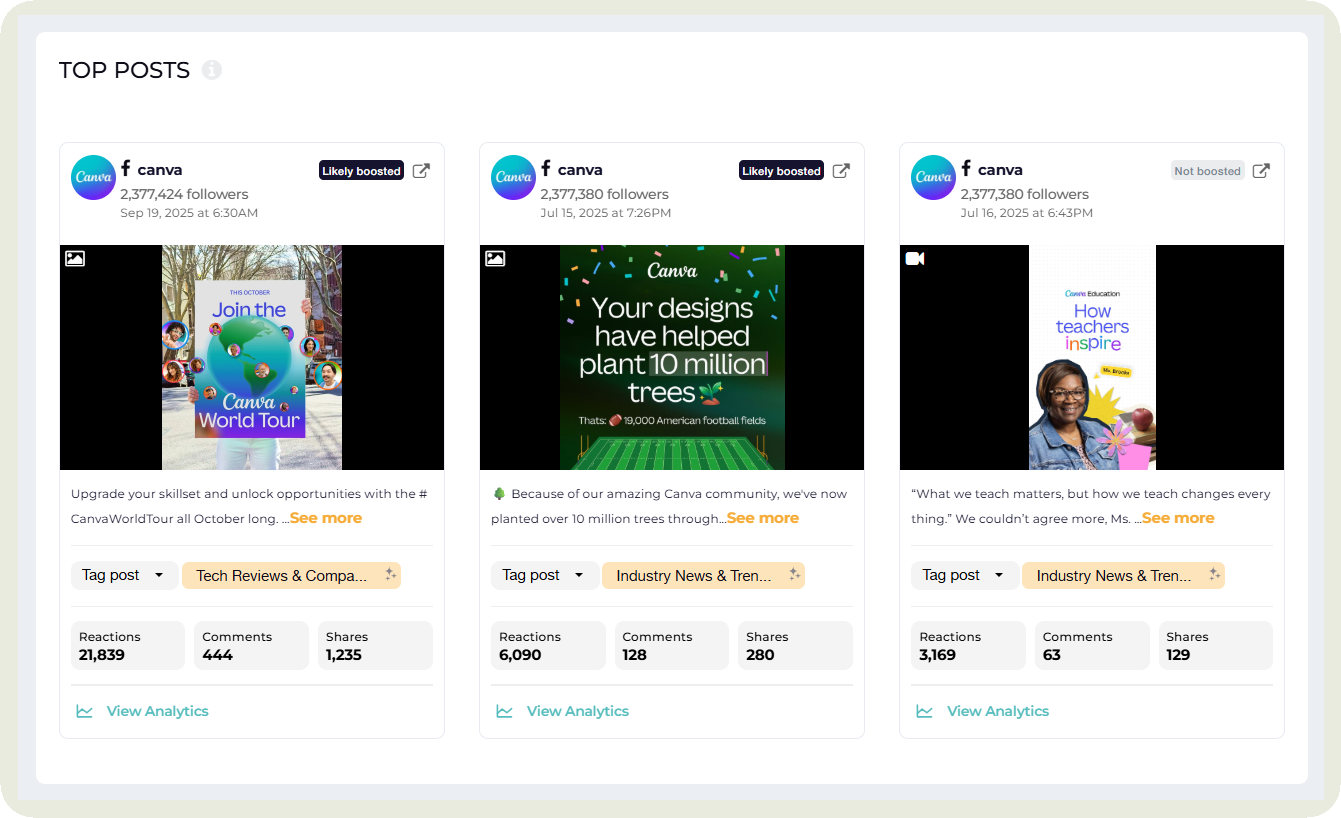
- The profile’s standout content for the period.
- Change in key metrics and the reasoning behind them
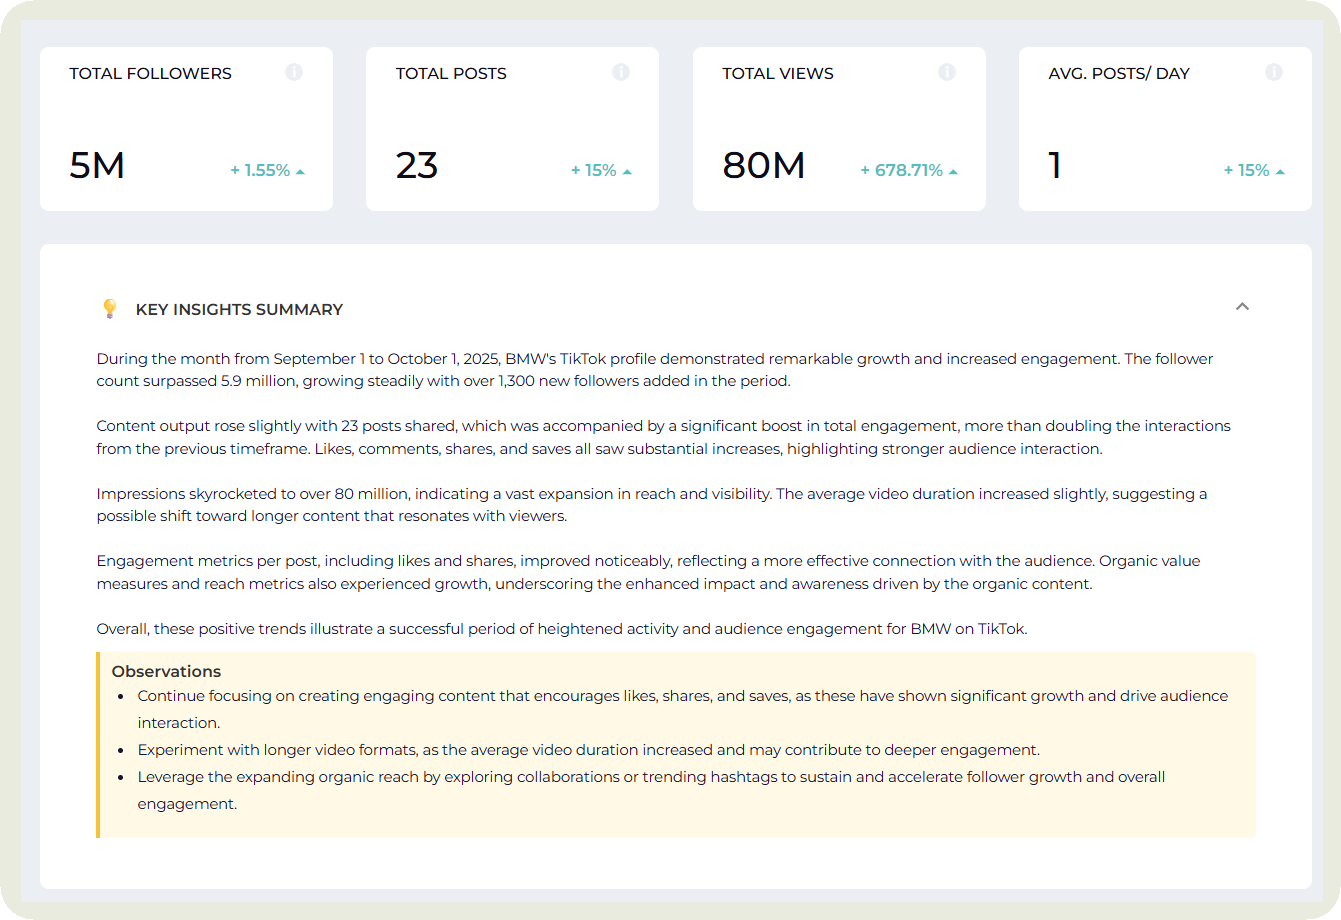
To make this task easier, I generally refer to Socialinsider’s Key Insights Summary, which gives me findings of what happened in that particular period, along with observations on what I can do next.
Facebook audience analysis
The audience runs the show on social media. If you target the wrong crowd or the right crowd with the wrong content, your strategies will fail to deliver results.
Here’s what you should analyze and include in your Facebook insights report.
- Demographics: Adding demographics (age, gender, location) shows the client who you’re actually reaching.
Megan mentioned that not every brand needs to be in front of everyone, everywhere. Some brands might have a very specific target, like 18-24 year old females in the U.S. And you need to check if that’s the largest section showing up on demographics.
She also added that location can be a crucial factor for certain kinds of businesses –
“When it comes to demographics, I always look at age and gender, though their importance really depends on the brand. I also pay close attention to location, especially for brick-and-mortar businesses or brands serving a specific area. If a company is trying to expand into a new region, location data becomes a valuable info-gathering tool.”
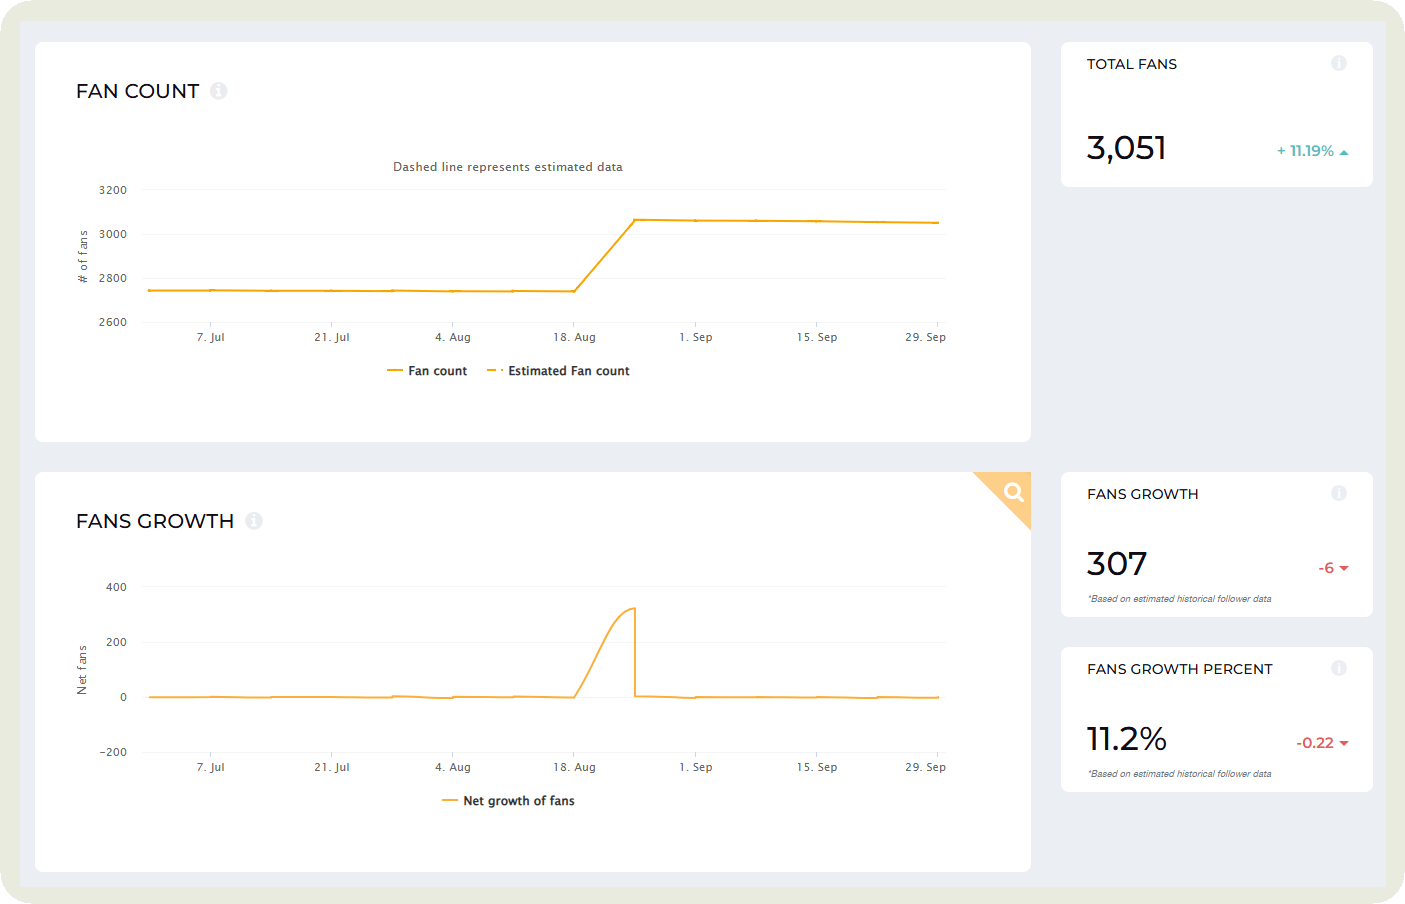
- Follower growth: How much did you grow your audience in the last month or the last quarter? Was that in line with what you were expecting? Or do you need to optimize your strategies?
I use Socialinsider to get this info for my Facebook audience report. The best part? It shows historical data for up to 3 or even 4 years, depending on the subscription. It helps me see how the overall account has progressed year over year.
Megan also discussed looking at the follower vs. non-follower mix to get more insights into the audience and your content strategies:
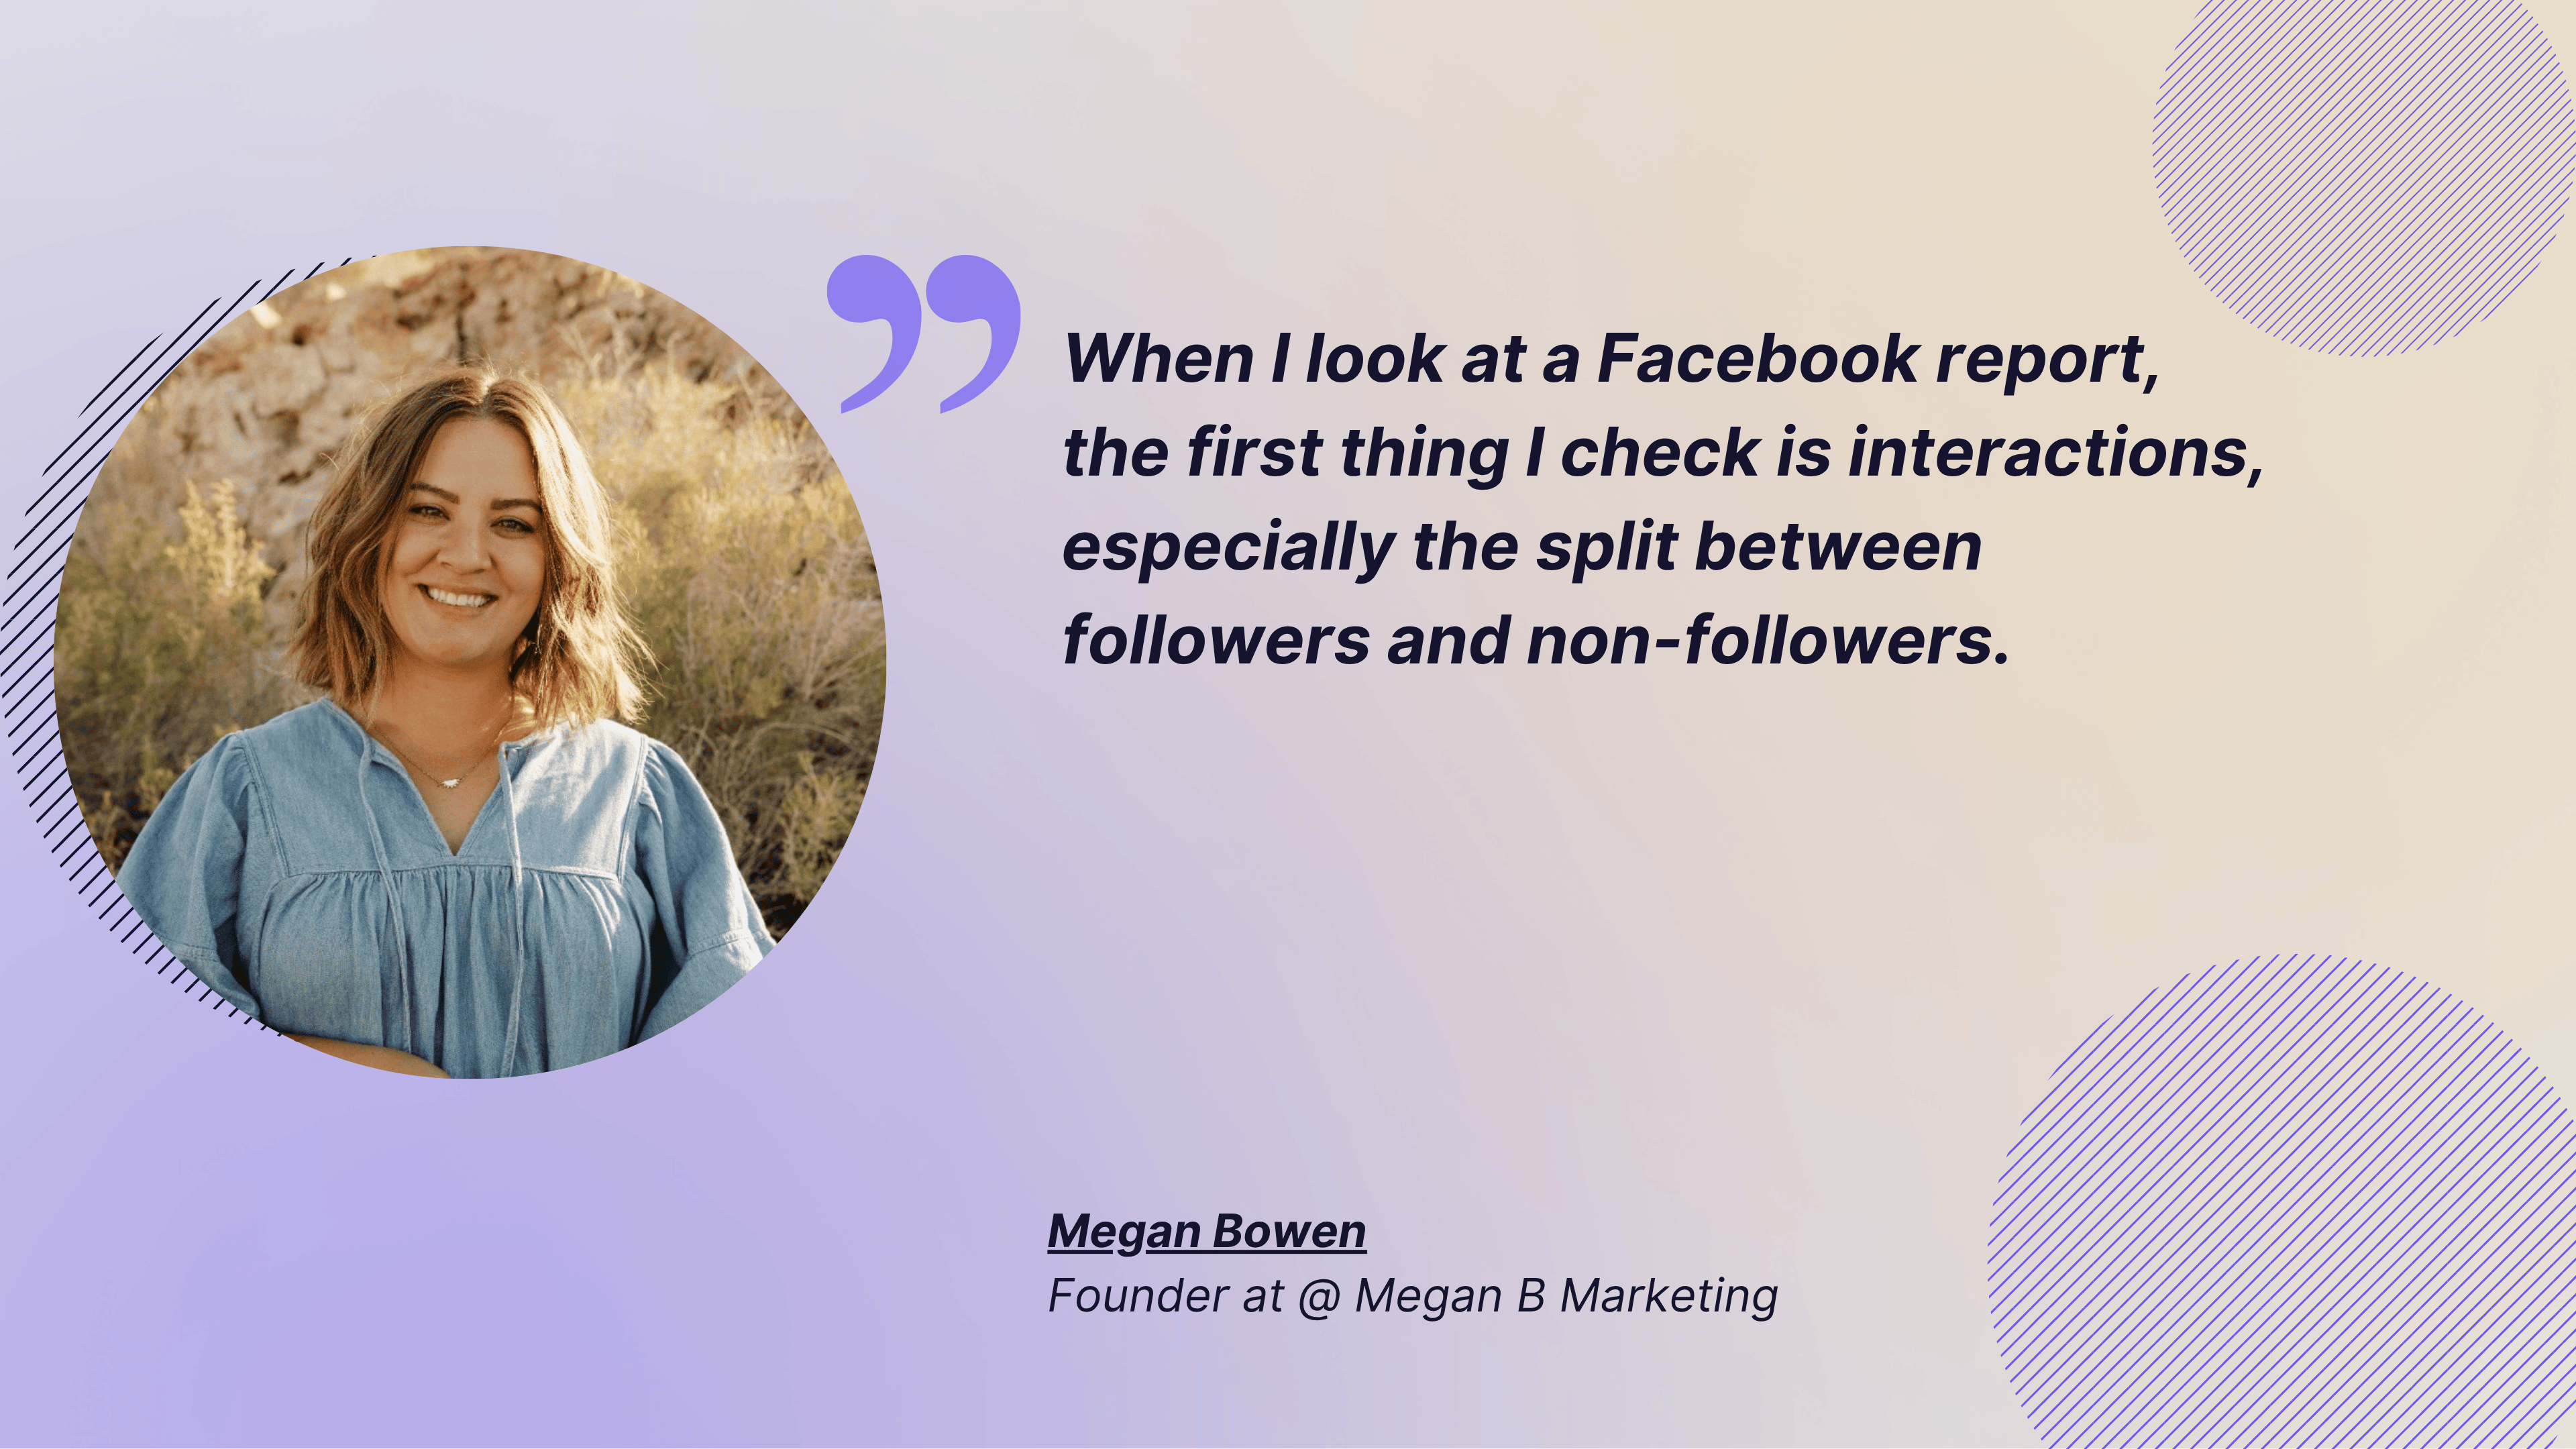
When I look at a Facebook report, the first thing I check is interactions, especially the split between followers and non-followers. I also like to break that down by content type and even by views. It’s not about one being better than the other; they serve different purposes.
Some posts are meant to nurture your existing community, so I want to see if they resonate there. Others are more discovery-focused, and I’m curious to see what gets picked up by non-followers — that kind of engagement can really inform future content strategy.
When I notice a spike in non-follower engagement, I always ask: did it lead to new followers, or was it just a momentary reach boost? That connection helps me understand whether our content is converting new audiences into long-term followers.
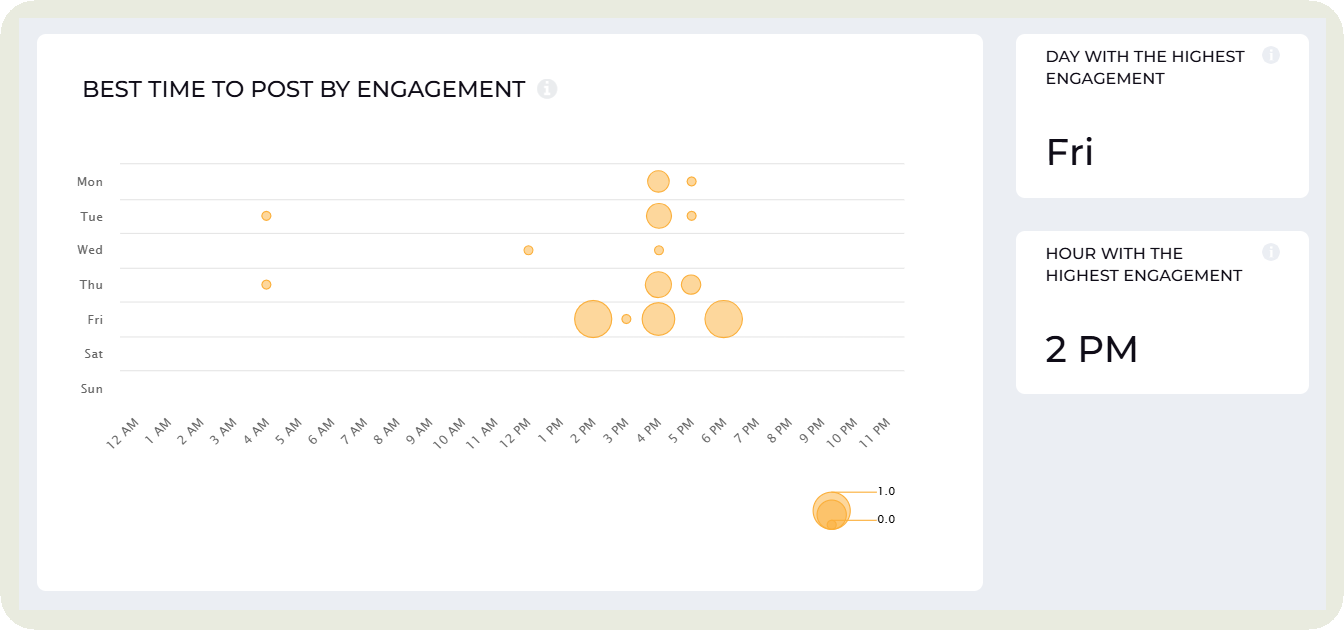
- When they are most active: Engagement generally runs high when your audience is most active. To get this data, you can use native analytics.
I also like to compare it with Socialinsider’s data on the best time to post by engagement to see if it aligns.
Facebook engagement analysis
Vanity metrics may not show much, but they tell you what type of content your audience responds to. Here are five things you should include in your Facebook analytics reporting.
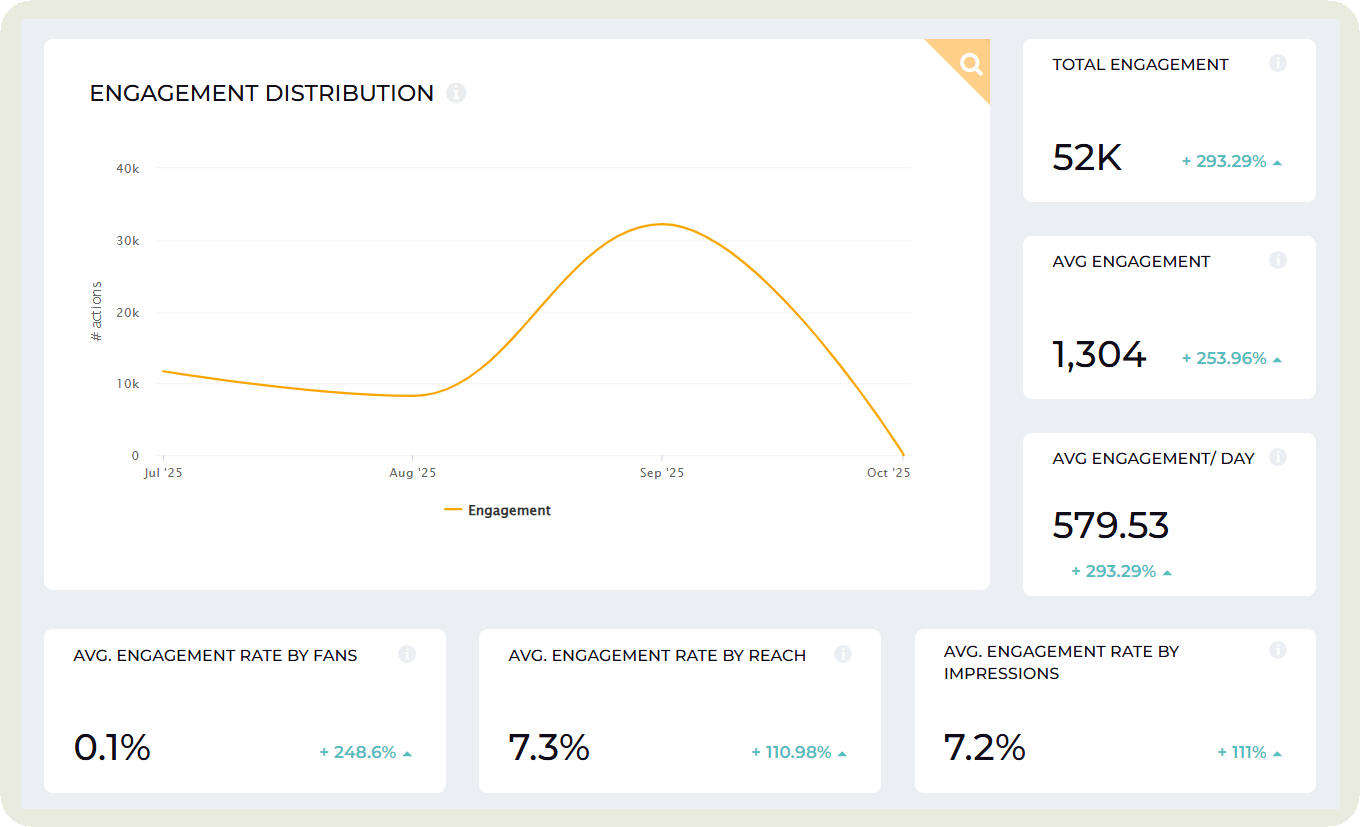
- Total engagement: It shows your clients or team the sum of reactions, comments, and shares received on your page in the selected time period. Instead of just showing this number, I like to showcase the percentage change over the previous period.
- Engagement rate by followers and reach: I like this metric over total engagement because it allows for fair, consistent comparison over time. You can track how your rate evolves from one reporting period to the next, giving you a clear view of whether engagement is growing relative to your audience size.
It’s also great for benchmarking. You can include your competitors’ engagement rates in the report to showcase how your performance stacks up against theirs.
Instead of manually calculating it, I draw this data from Socialinsider.
Megan talks about how you should always correlate your engagement rate to your other goals (if any). She said:
Engagement metrics are important. And I do use them. But what matters more to me is the trend: did engagement go up, and if so, did that translate into meaningful results? I always pair engagement with downstream KPIs. Think metrics like website traffic, conversions, watch time, or landing page bounce rate.
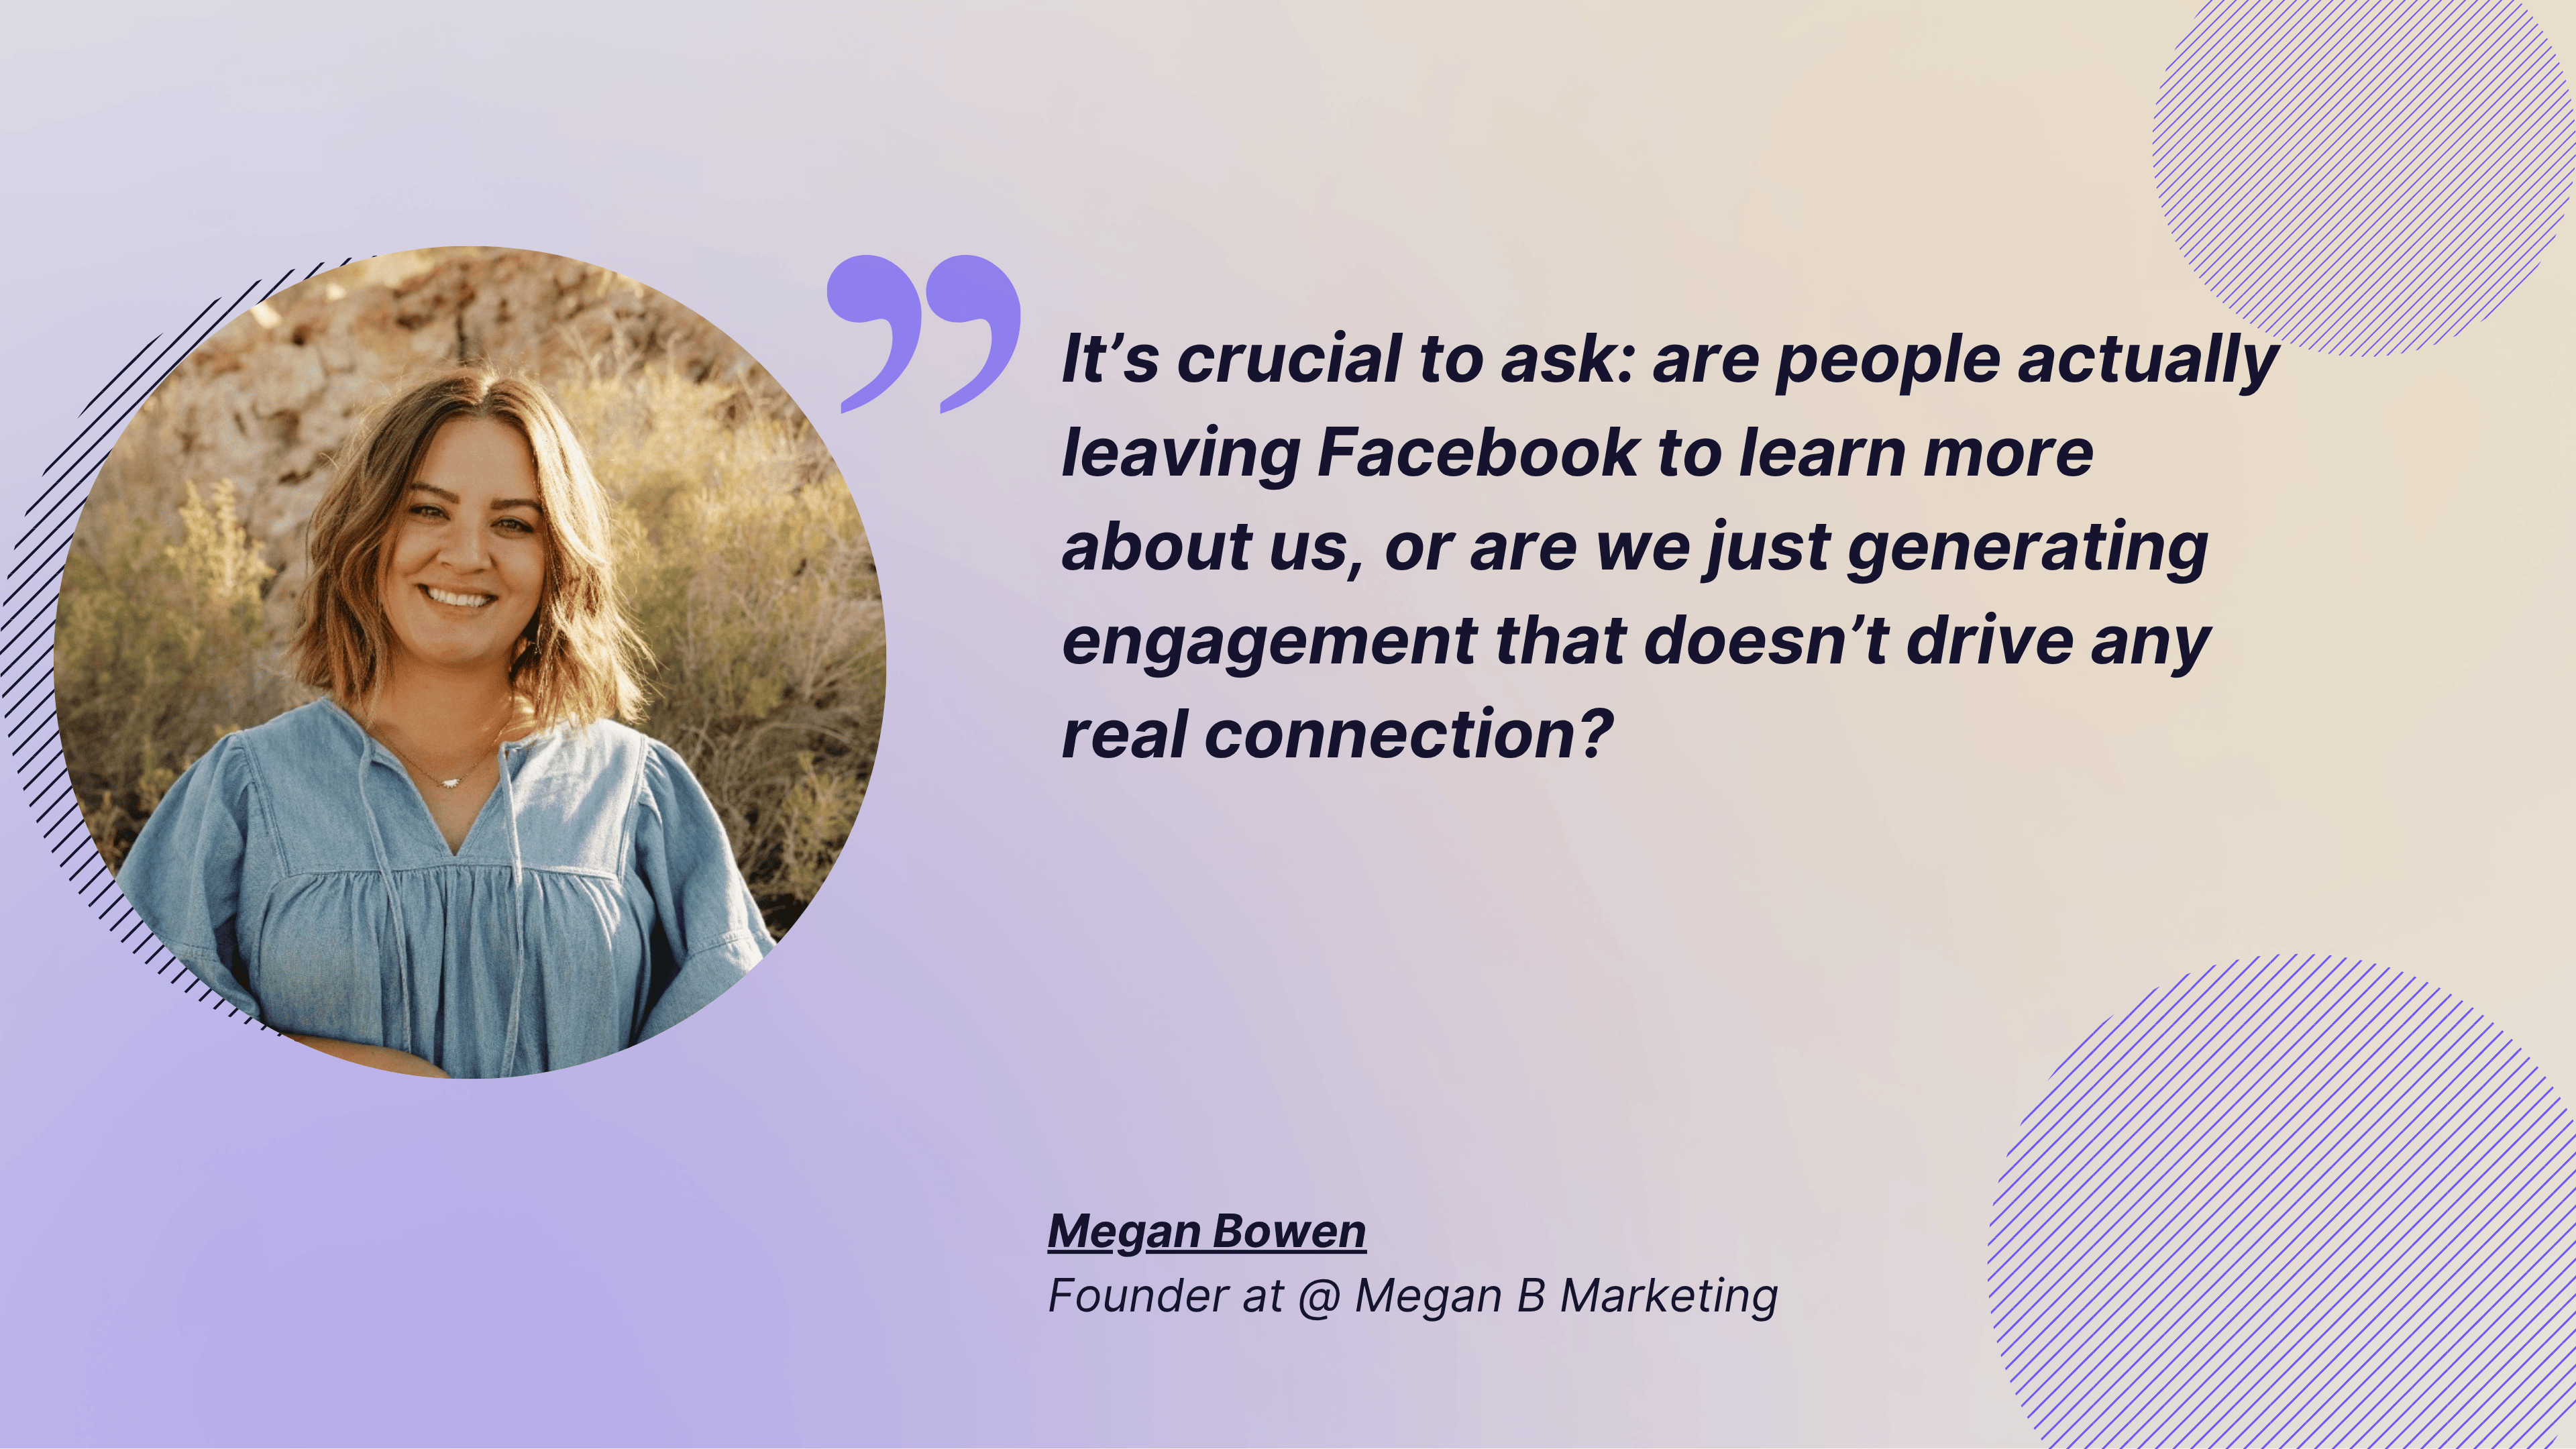
It’s crucial to ask: are people actually leaving Facebook to learn more about us, or are we just generating engagement that doesn’t drive any real connection? Engagement should mean something for the business. Of course, that definition varies. Some brands are happy with strong online interaction alone, while others need that engagement to convert into revenue. It really depends on the company’s goals.
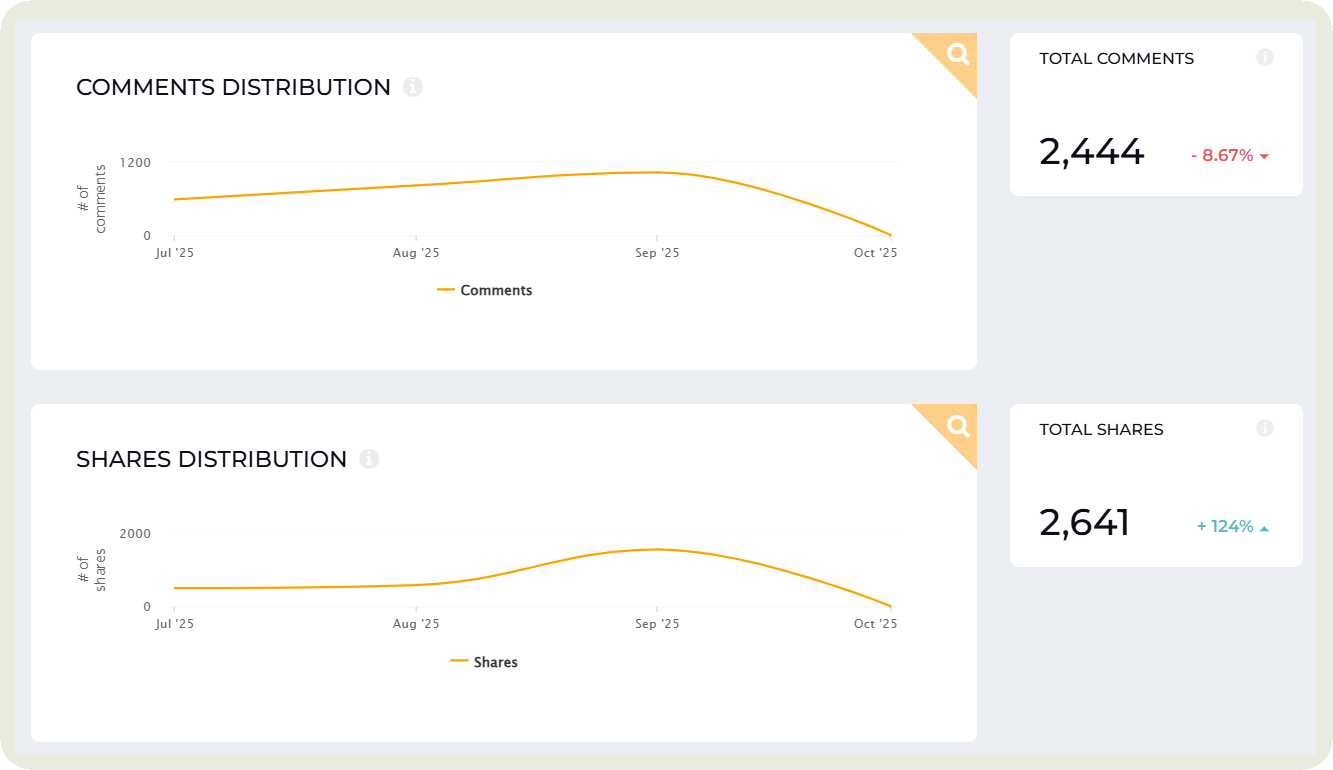
- Comments and shares: These metrics are more important than just likes as they show an active form of engagement. It shows people taking the time to react, contribute, or spread your content.
When analyzing these metrics in Socialinsider, I always investigate anomalies. If the graph shows a sudden dip, I click in to see which posts caused it. If likes have stayed consistent but comments or shares have dropped, that’s my cue to dig deeper. Maybe the topic didn’t spark conversation, or the content wasn’t share-worthy.
- Content format by engagement: Is the investment in Reels paying off? Are album posts working better than Reels? Should you shuffle resources for the next month to experiment?
Megan recommends not relying on one or two spikes to completely change your social media strategy. Instead, she says, look for patterns over time and then experiment and see if the success holds up.
The first step is to identify where the spikes in engagement are coming from. Is it a specific post type, theme, or format? Then I look for patterns over time. If one post performs exceptionally well, I don’t overhaul my strategy overnight. Instead, I track performance across four to six weeks and start testing
From there, I dig deeper: why did it perform well? Was it the creative, the caption, or the tone? For example, if carousels perform well, I’ll test whether it’s all carousels or just the funny, meme-style ones. The key is to test one variable at a time and turn those insights into a deliberate strategy.
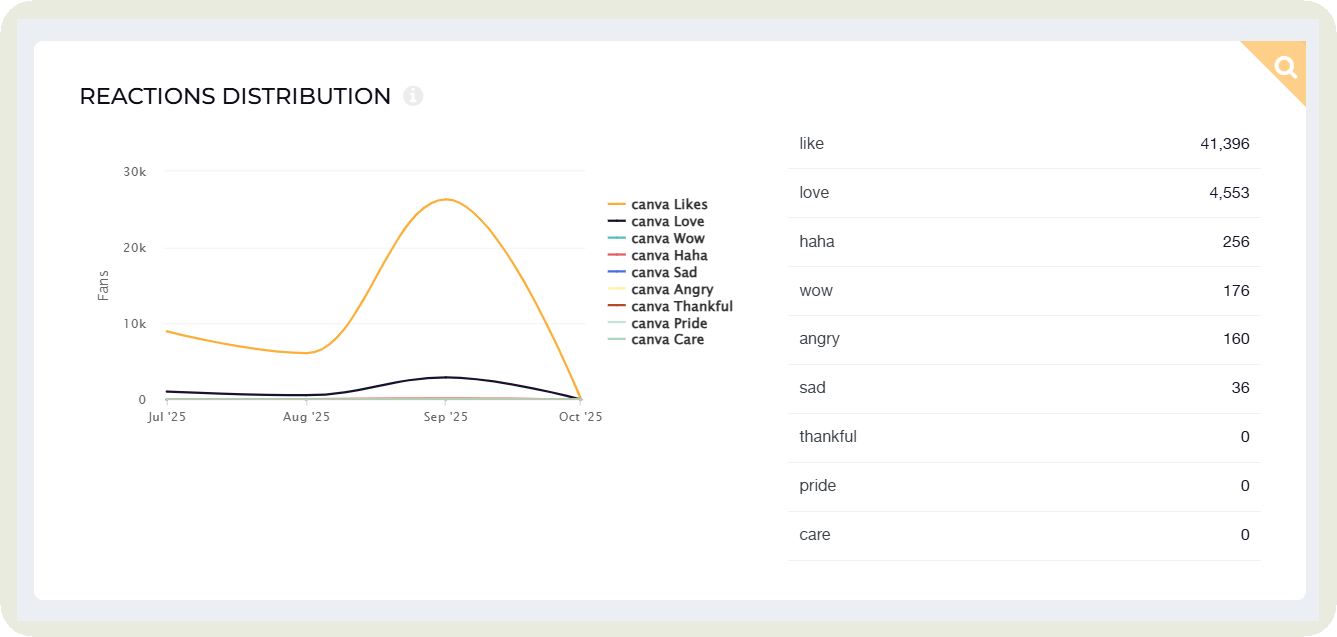
- Reactions distribution showing audience sentiment: Show the distribution of reactions you get on Facebook and talk about the general audience sentiment around your content.
Facebook content performance analysis
You post daily. But is that content even getting you any results? Or are the content themes you’re focusing on effective?
This analysis should answer these questions for your clients.
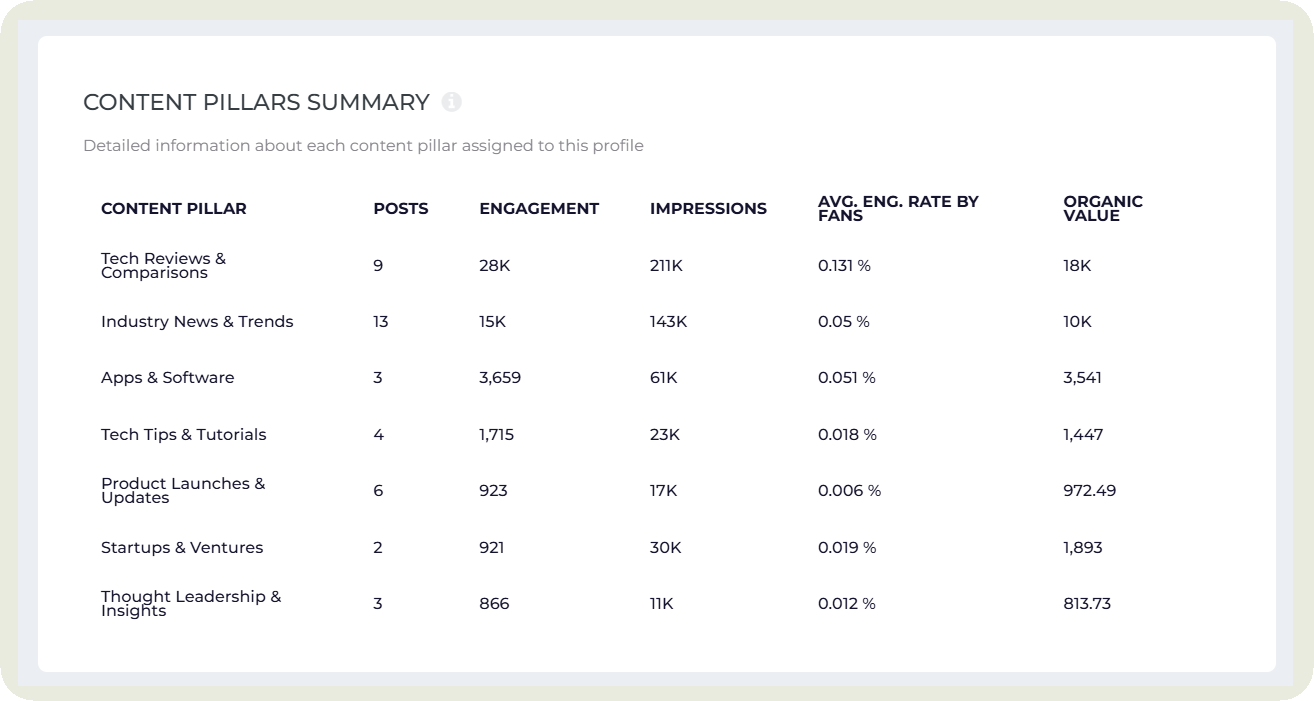
- Content pillars performance: Are you prioritizing content pillars that are getting you engagement? Is your content mix leaning more towards promotional content?
Only when you do this analysis, you can experiment with a context mix that might become the optimal one for you moving forward.
Instead of manually doing it, you can use AI-generated content pillars categorization in Socialinsider.
When talking about this subject, Megan mentioned something important. She said that instead of doing a complete comparison, you should break down your content pillars into two overall categories: promotional and entertainment.
Here’s why —
I like to divide our content pillars into categories like educational, entertaining, and promotional, but I never analyze them all on equal grounds. Promotional content rarely performs as well as something entertaining. And that’s completely normal. By separating them, you can set realistic expectations and give each pillar context.
This way, if a promotional post performs modestly, you’re not unfairly comparing it to an entertaining post that’s designed to go viral. The numbers start to make more sense when you evaluate each pillar within these two categories.
- Top and bottom-performing content: Look for common patterns in top and bottom-performing content. Maybe the top-performing content is all geared towards a specific pillar. Maybe the tone in the bottom-performing content is very salesy.
Jot down these insights in your Facebook report so your clients know exactly which insights you gathered from the data and the steps you plan to take next.
- Show campaign-specific performance: Did you run any major marketing campaigns in the past month or quarter? What kind of results did they bring? Did you get an increase in followers or engagement?
I usually group this content by tagging it in Socialinsider.
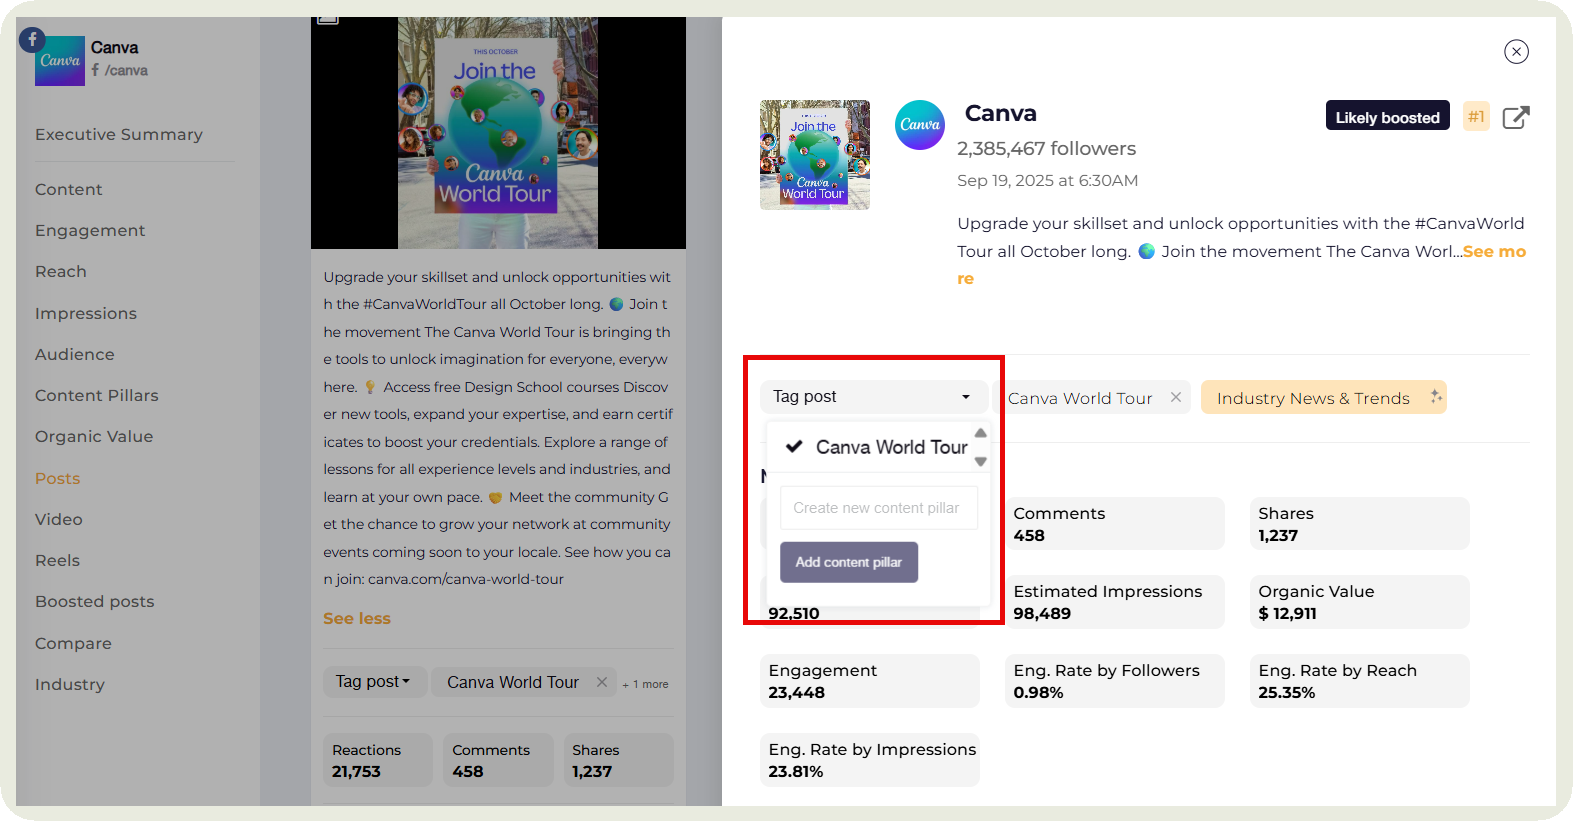
I can then check the overall campaign performance in the Content pillars section.
This saves me time and I don’t have to manually calculate the different metrics like engagement rate and percentage of total engagement for the campaign.
- Visuals and messaging analysis: Are your visuals of high quality? Is the tone resonating with your audience? I like to include this in the report as it gives clients or top management an idea of how the creative side supports performance. It shows that I am not just tracking metrics, but also interpreting what drives them.
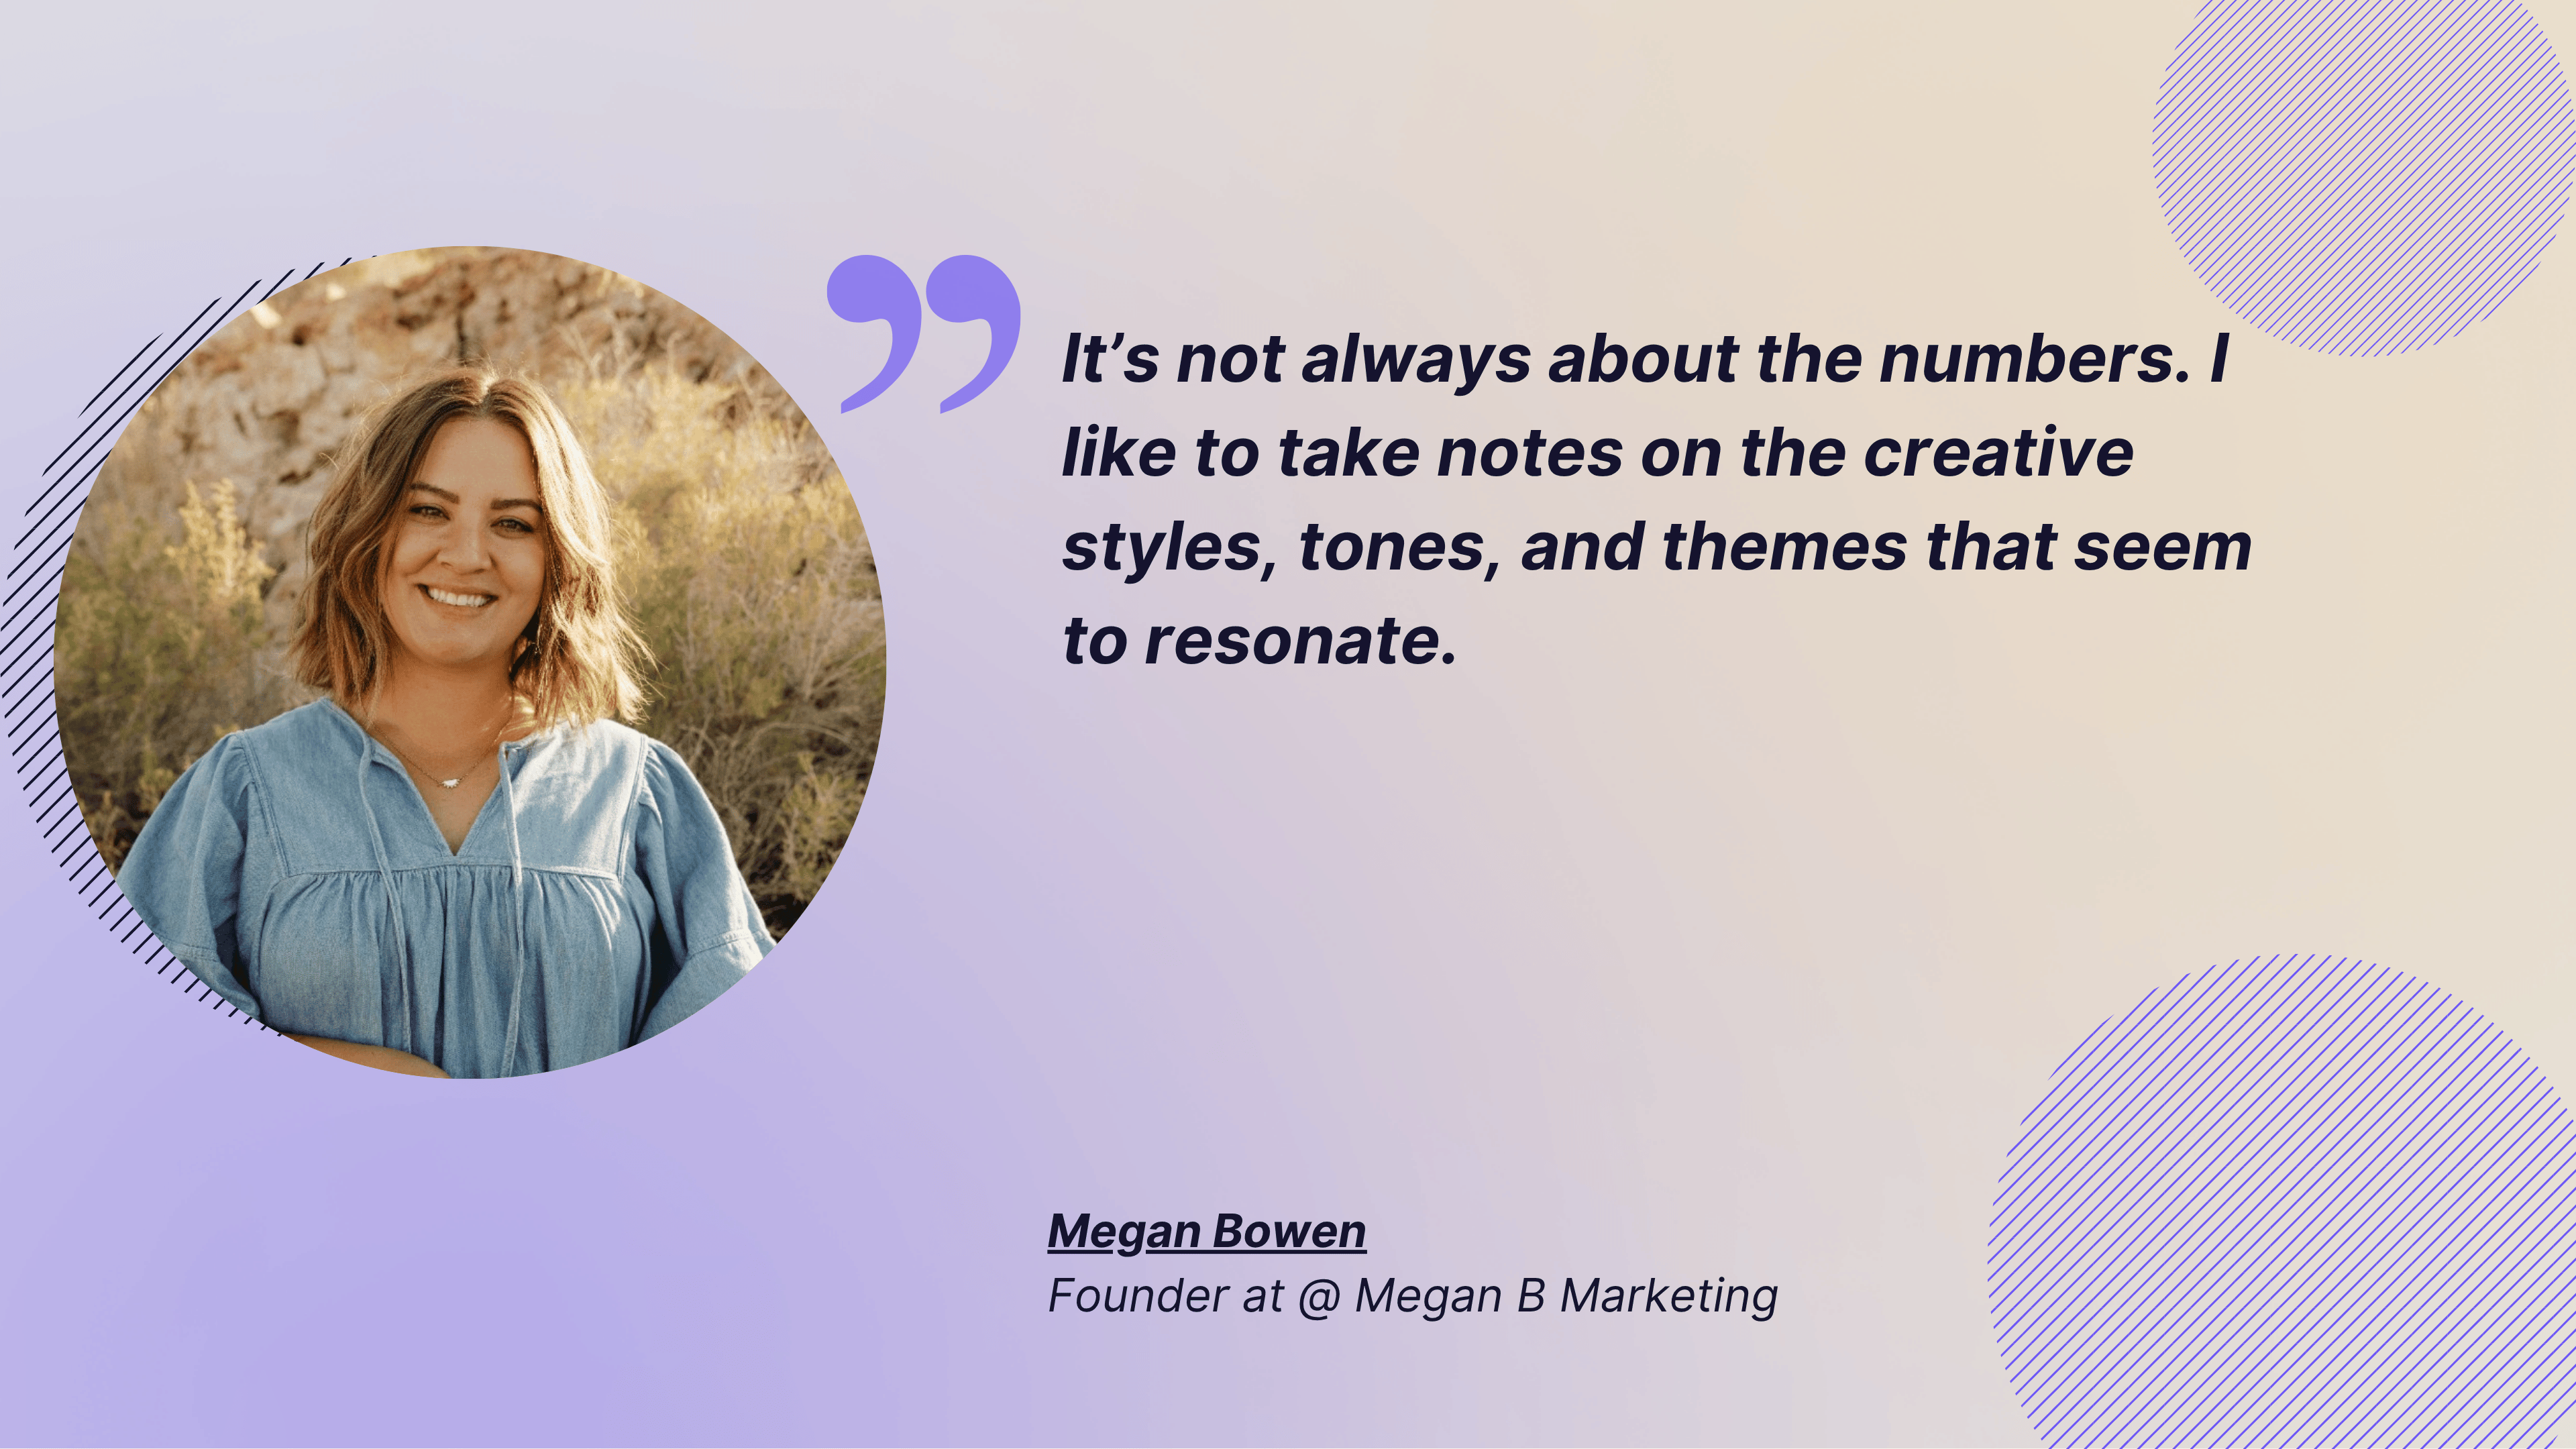
Megan does the same for her clients when conducting a Facebook page analytics report —
It’s not always about the numbers. I like to take notes on the creative styles, tones, and themes that seem to resonate. For example, maybe a certain tone performs consistently well, or people respond more when we tell stories. Those qualitative insights matter because they reveal patterns about what our audience genuinely connects with. So instead of focusing only on metrics, I pay close attention to what our community is consistently engaging with and why it resonates.
- Reels insights: For video performance, focus on metrics like watch time, completion rate, and retention graphs.
Pinpoint which Reels worked well and why. Mention what you will focus on implementing for your Reels strategy based on these insights.
Facebook competitor analysis
When you share a Facebook report with clients, one of the first questions they’ll ask is, “So, how do we stack up against the competition?”
For easy analysis, you can use the Benchmarking feature in Socialinsider. It gives you a side-by-side comparison of various metrics.
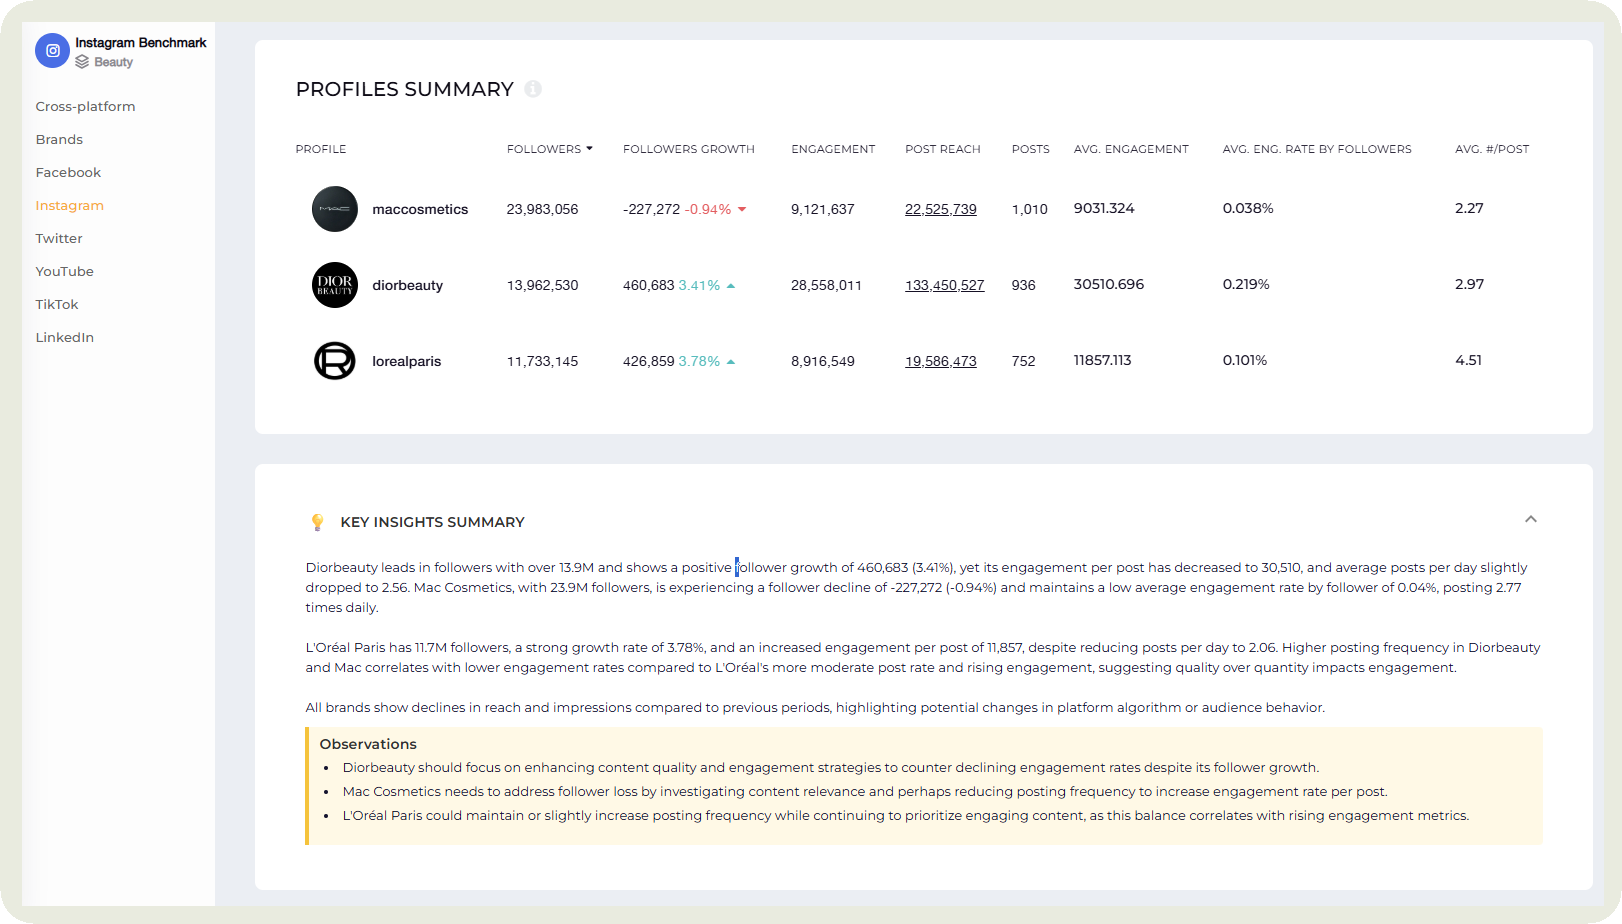
Here are the social media metrics or insights you should include in this section.
- Engagement comparison: How is their engagement rate compared to yours? For fair comparison, I like to compare the engagement rate by followers.
Megan said something similar while talking about engagement. She said:
I do look at the engagement rate but I always pay attention to how large a page’s audience is compared to how actively it engages, because that ratio tells you much more about real community connection than follower count alone. For example, if a page has 20,000 followers but only gets a couple of comments, you know that’s not great.
If you find their rate high, dig deep into the next analytics to find out why.
- Content pillar mix: Are they focusing on unique pillars that are getting them great engagement?
When you look at their content pillar distribution, pay special attention to which themes dominate their feed and how that balance compares to yours. Are they leaning heavily into entertaining or educational content while keeping promotional posts light? This gives you an idea of what you might have failed to notice while analyzing your content.
- Posting frequency: A competitor’s high engagement rate might simply come from posting more often than you do. Tracking their posting frequency helps you understand whether their results are volume-driven or strategy-driven.
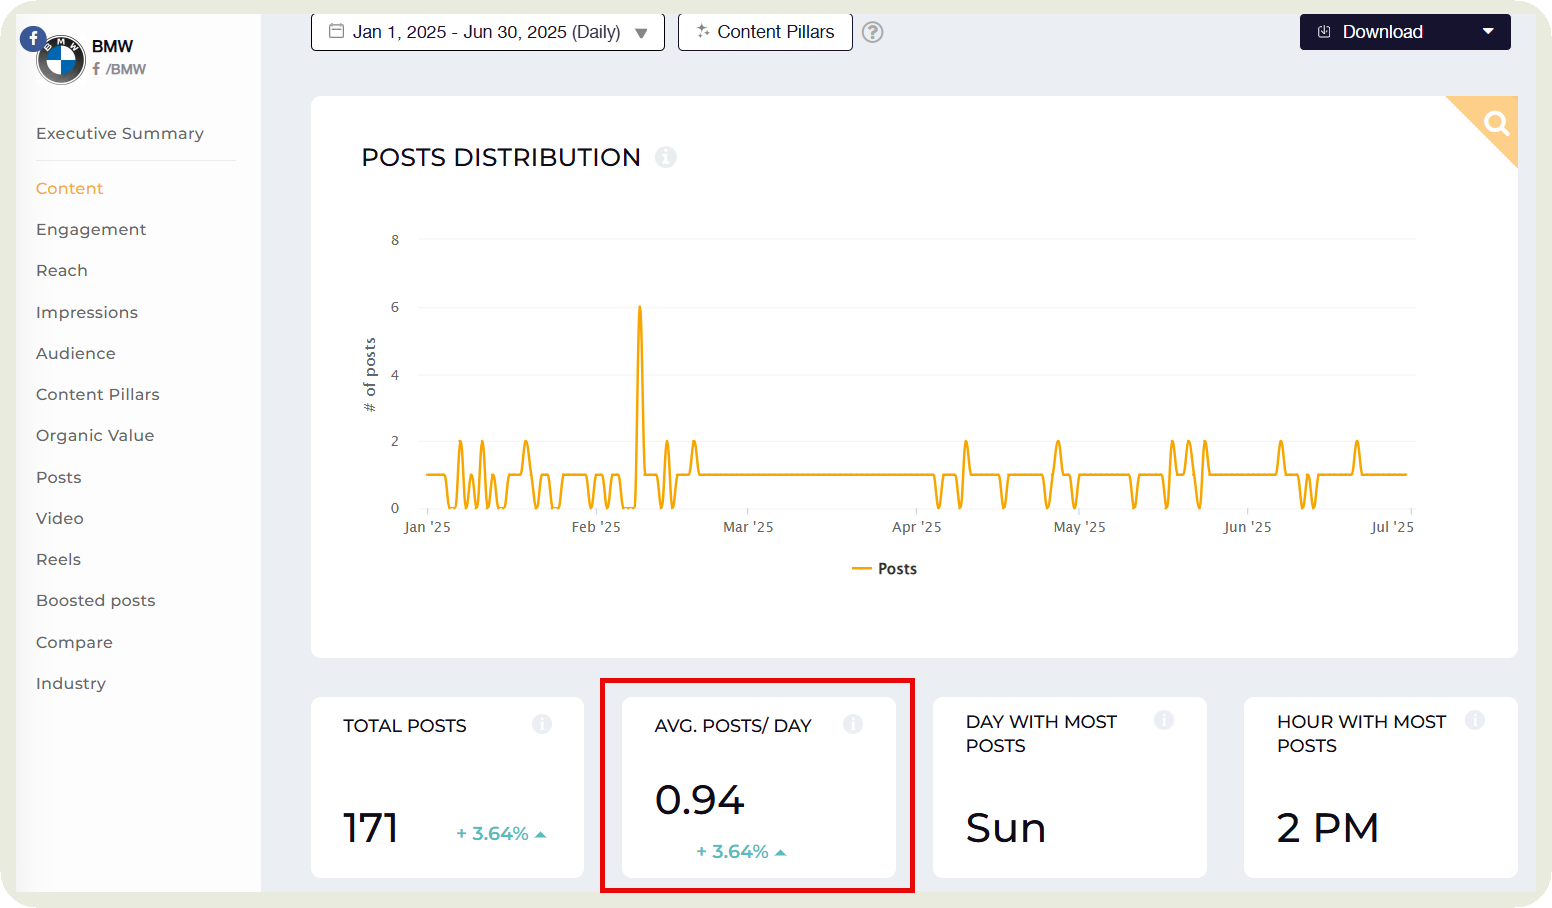
Use that insight to decide whether to experiment with posting more frequently or find a sweet spot that keeps your audience engaged without overwhelming them.
- Tone and branding: Don’t skip the qualitative side of analysis: tone, visuals, and overall branding. They often explain why certain posts perform well. Maybe their friendly, conversational tone sparks more comments, or their clever captions make people want to share. Observing these patterns helps you understand not just what works, but why it connects.
Megan mentioned looking at it the other way and finding what’s being overlooked. Here’s what she had to say —
I like to poke around and really observe what competitors are doing, almost like a bit of digital sleuthing. The goal is to identify the white space: what’s being underused or overlooked, and where the opportunity lies. Maybe nobody’s experimenting with a certain format or tone, and that’s something we can own. Or, if everyone’s doing the same thing and it feels repetitive or stale, that’s our cue to approach it differently and stand out.
Summary of next steps
Wrap up your report with a plan your clients can rally behind. Outline the key actions you’ll take next month or quarter based on what the data revealed. This could be testing new content formats, refining ad targeting, or doubling down on what’s already working. Be clear about what you aim to achieve and why it matters.
For example: “Our Facebook post analytics report showed that Reels drove 40% more engagement this month, so next quarter we’ll increase short-form video production by 25% to boost reach and follower growth.”
This helps clients see the data and also how you’re turning that data into actionable strategies.
How to create your Facebook analysis report: A step-by-step process
Ready to put it all together? Follow these steps to create your Facebook reports for clients.
Step 1: Set goals and KPIs
Before you even start collecting data, here are two questions you should ask:
- Who will I be presenting it to? Will it be top management, clients, or my team?
Megan explains why this step is important —
You always have to consider your audience when creating reports. If I’m reporting to a business owner who isn’t in marketing and just wants to know things are handled, I keep it simple: a short summary, maybe a chart or two, and clear next steps. They want to see, ‘Here’s what’s happening, and here’s what I’m doing about it.
But if I’m reporting to a marketing director or a team of marketers, the report looks different. It’s more detailed, with screenshots, examples, and notes about trends I’m testing or shifts I’ve noticed. Marketers want to understand the reasoning and experiments behind the data.
- What is the focus of this report? Is it a general update report, or are you focusing on certain goals like increasing brand awareness or engagement?
This will dictate the KPIs you select and showcase in your report.
Step 2: Collect data
This is where I roll up my sleeves and go data hunting. I start with Meta Business Suite to pull the basic analytics like reach, impressions, engagement, audience demographics, etc. Then I hop into Ads Manager to grab ad spend, clicks, and conversions. If I’ve got UTMs set up, I always check Google Analytics to see what people did after they clicked through.
The ultimate step is to lean in to third-party social analytics tools like Socialinsider. I can check content performance, competitor benchmarks, and campaign performance all in one place.
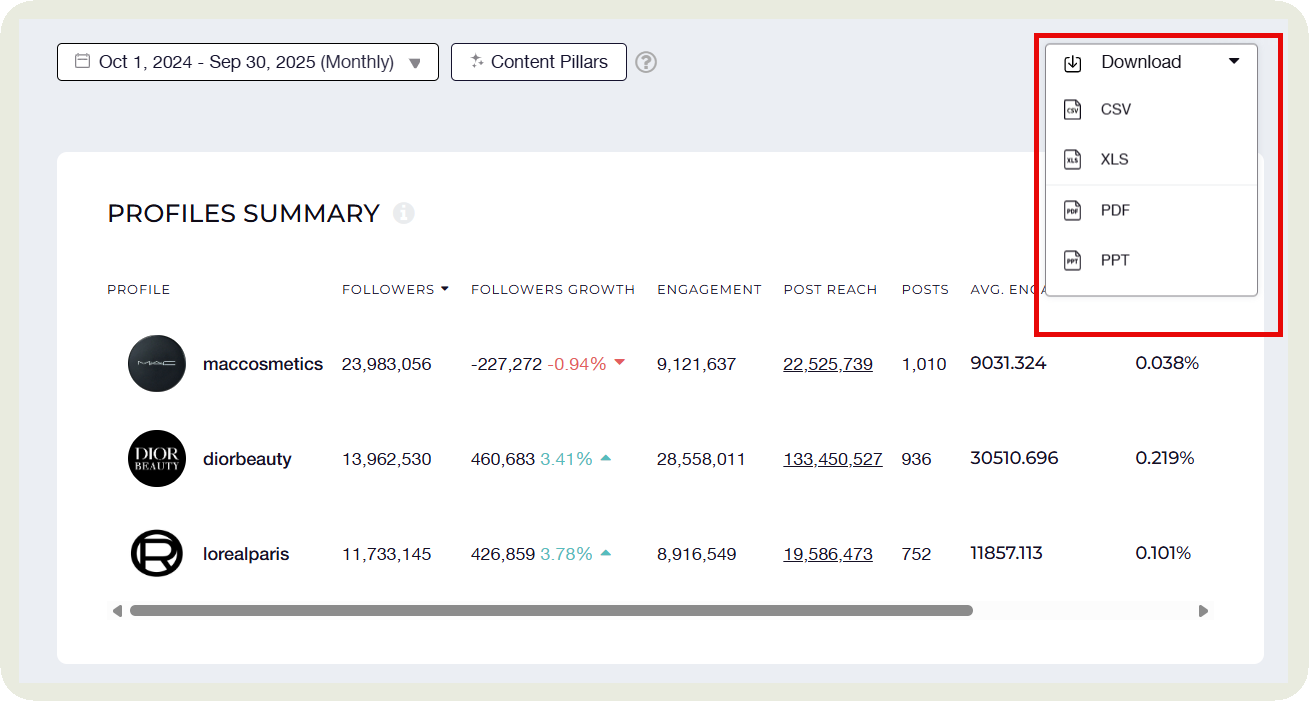
Step 3: Put data in a visual format
If you’re presenting to clients or even your top management, you need to use as little text as possible. Instead, show data visually for easy interpretation.
For example, instead of mentioning how much reach you got in the past month, show a graph of the reach evolution over time.
I usually use Socialinsider to get this data in a visual format instead of creating it from scratch. You can even directly download data into multiple formats from the tool.
Step 4: Add action items
Once you’ve gathered the data and added your visuals, turn those numbers into meaning. Explain what’s happening and what you plan to do about it.
For example: “Video views dropped by 20% this month, but engagement on image posts grew. Next month, we’ll test shorter video formats and repurpose top-performing images into Reels to see if that improves reach.”
I like to do this for each section I am including in the report. But if that’s too much, you can add this at the end of the report.
Step 5: Share a customizable dashboard
If your clients don’t want an extensive report but just an update on key Facebook metrics, you can share a customizable Facebook analytics dashboard with them.
In Socialinsider, you can customize your dashboard by selecting relevant metrics through the right tab. You can then download the data and present it to your clients.
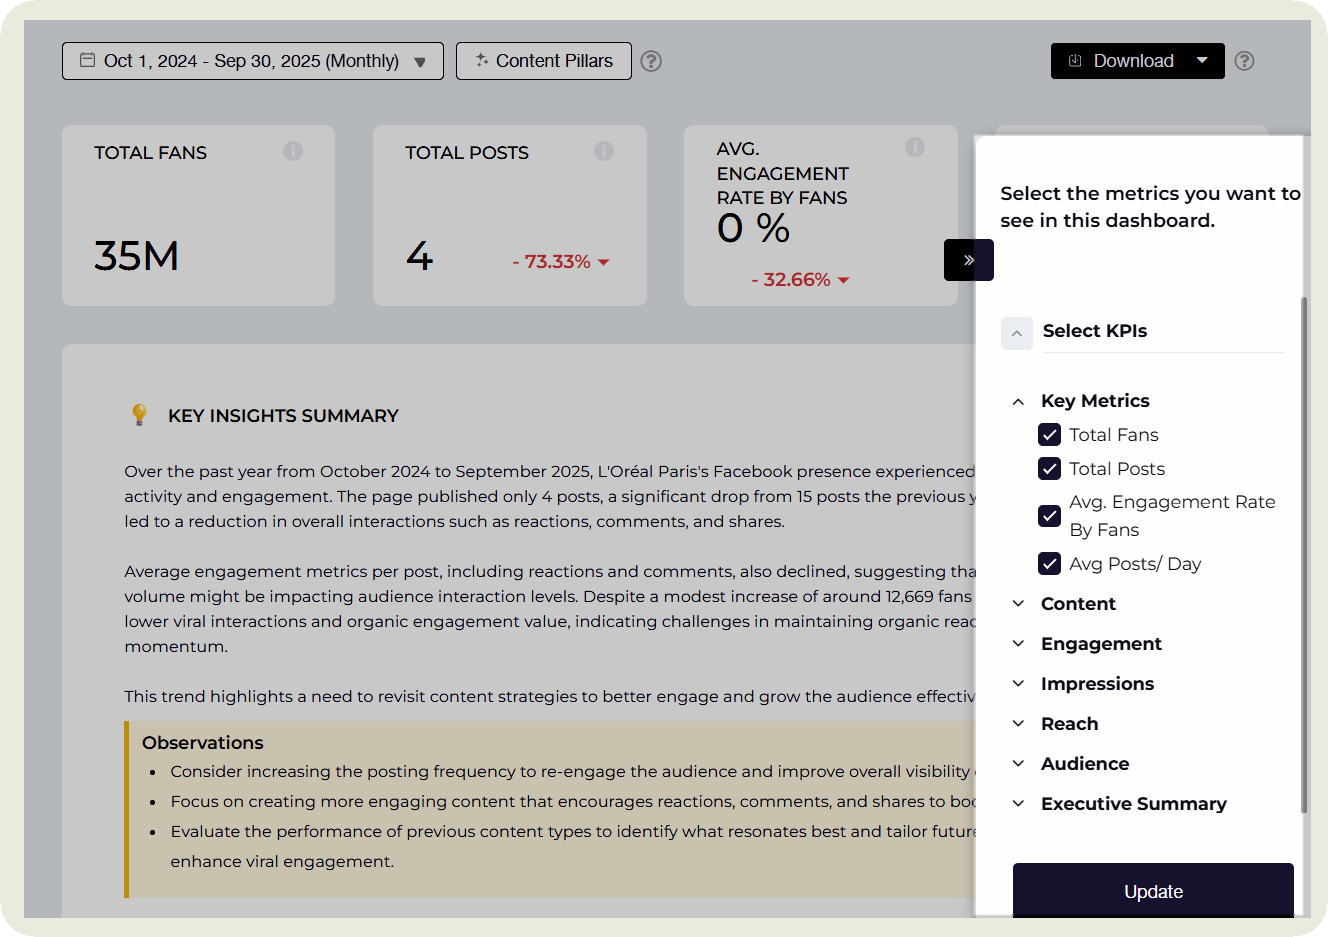
These dashboards update in real time, making it easy to track performance trends and share insights with clients and your team.
How to extract insights from your Facebook analysis report
Data collection is important. But many times, marketers miss out on drawing insights from that data. Here are my four strategies to extract the most out of your data.
- Spot seasonality and trends. Do certain posts perform better on weekends or holidays? Does engagement spike during product launches or certain times of day? Also, compare time periods to see whether engagement has gone up or down since last month or quarter.
- Dig deeper into how your audience interacts. Check which demographics engage most: by age, gender, or location. Are you reaching new audiences, or mainly talking to existing followers?
- Identify trends. Compare performance across campaigns to see shifts in audience response. Are competitors testing new formats or content types that are paying off?
- Track conversions and traffic. Go beyond likes. Did content actually drive clicks, leads, or sales? Are Facebook conversions growing or losing ground compared to other channels?
Facebook reporting best practices
While creating this report, here are some best practices you should adopt.
- Make reports visually engaging: Think about how a good image instantly grabs your attention. The same logic applies to reports. You don’t need to spend hours perfecting colors or design details, but a clean, visual layout makes your data easier to digest and your insights stand out. Use charts, icons, and whitespace to guide the reader’s eye to what matters most.
To save time, use templates or Facebook analytics tools that help you strike the right balance between clarity and aesthetics.
- Don’t focus solely on data. Bring the narrative together. A good report doesn’t drown people in charts and numbers. I always follow the data → insight → action framework while creating reports.
Megan put it well when she said:
The biggest mistake I see is when marketers fail to translate the data in a way that their audience actually cares about. Agencies and social media teams are so deep in the numbers that they forget most people don’t speak that language. You have to turn metrics into meaning — what does this data say about your community? Does it show that people care about your message, or that there’s a gap between what you’re posting and what they’re buying?
- Automate reports: If you need to present multiple reports to clients or top management, save yourself the headache with tools that offer auto-reporting features. They handle the repetitive part: pulling data, updating visuals, and organizing metrics, so you can focus on adding real insights. You can always tinker with the output later, polishing the visuals or adding context before sending it off.
Final thoughts
A great Facebook analytics report is all about drawing data and using that to inform your next strategy. When your data tells a clear story, it becomes easier to spot trends, justify decisions, and inspire action.
Ensure each section of your report connects insight to impact, showing how your efforts on Facebook move the brand forward. And instead of manually doing everything, rely on tools to make it easier.
If you want to try a tool that helps you draw in-depth data and automate your reporting, Socialinsider does it all. Take the tool for a free spin to see exactly how it helps.
FAQs about Facebook analytics reports
What is a Facebook analysis report?
A Facebook analysis report is a detailed overview of how your Facebook Page or campaigns are performing. It tracks key metrics like reach, engagement, audience growth, and content performance to show what’s working and what isn’t. The goal is to turn data into insights and help refine your strategy, prove ROI, and make smarter decisions for future campaigns.
What are the benefits of Facebook reporting?
Facebook reporting helps you understand how your content performs and whether your strategy is driving real results. It highlights what’s working, what needs improvement, and where your best opportunities lie. Regular reporting also builds transparency with clients or stakeholders, proves ROI, and helps you make data-backed decisions that improve engagement, reach, and conversions over time.
Nidhi Parikh
Nidhi Parikh is SaaS writer that believes scrolling through social media is research for work. When not working, find her binge watching the latest series or reading anything she can get her hands on.

Analyze your competitors in seconds
Track & analyze your competitors and get top social media metrics and more!
You might also like


Improve your social media strategy with Socialinsider!
Use in-depth data to measure your social accounts’ performance, analyze competitors, and gain insights to improve your strategy.