Unilever Brand Overview
See social media performance data for Unilever
Unilever
0.07%
Brand Avg Engagement RateVideo
Top Content (By Eng. Rate)6093
Avg. Brand Video ViewsBrand Posts Across Channels
Cross-channels analysis of the post
Brand Posts Across Channels
| Channels | Posts | Avg. Posts/Day |
|---|---|---|
 YouTube YouTube | 9 | 0.05 |
 Facebook Facebook | 43 | 0.24 |
 Instagram Instagram | 43 | 0.24 |
| Total | 95 | 0.53 |
Top Posts
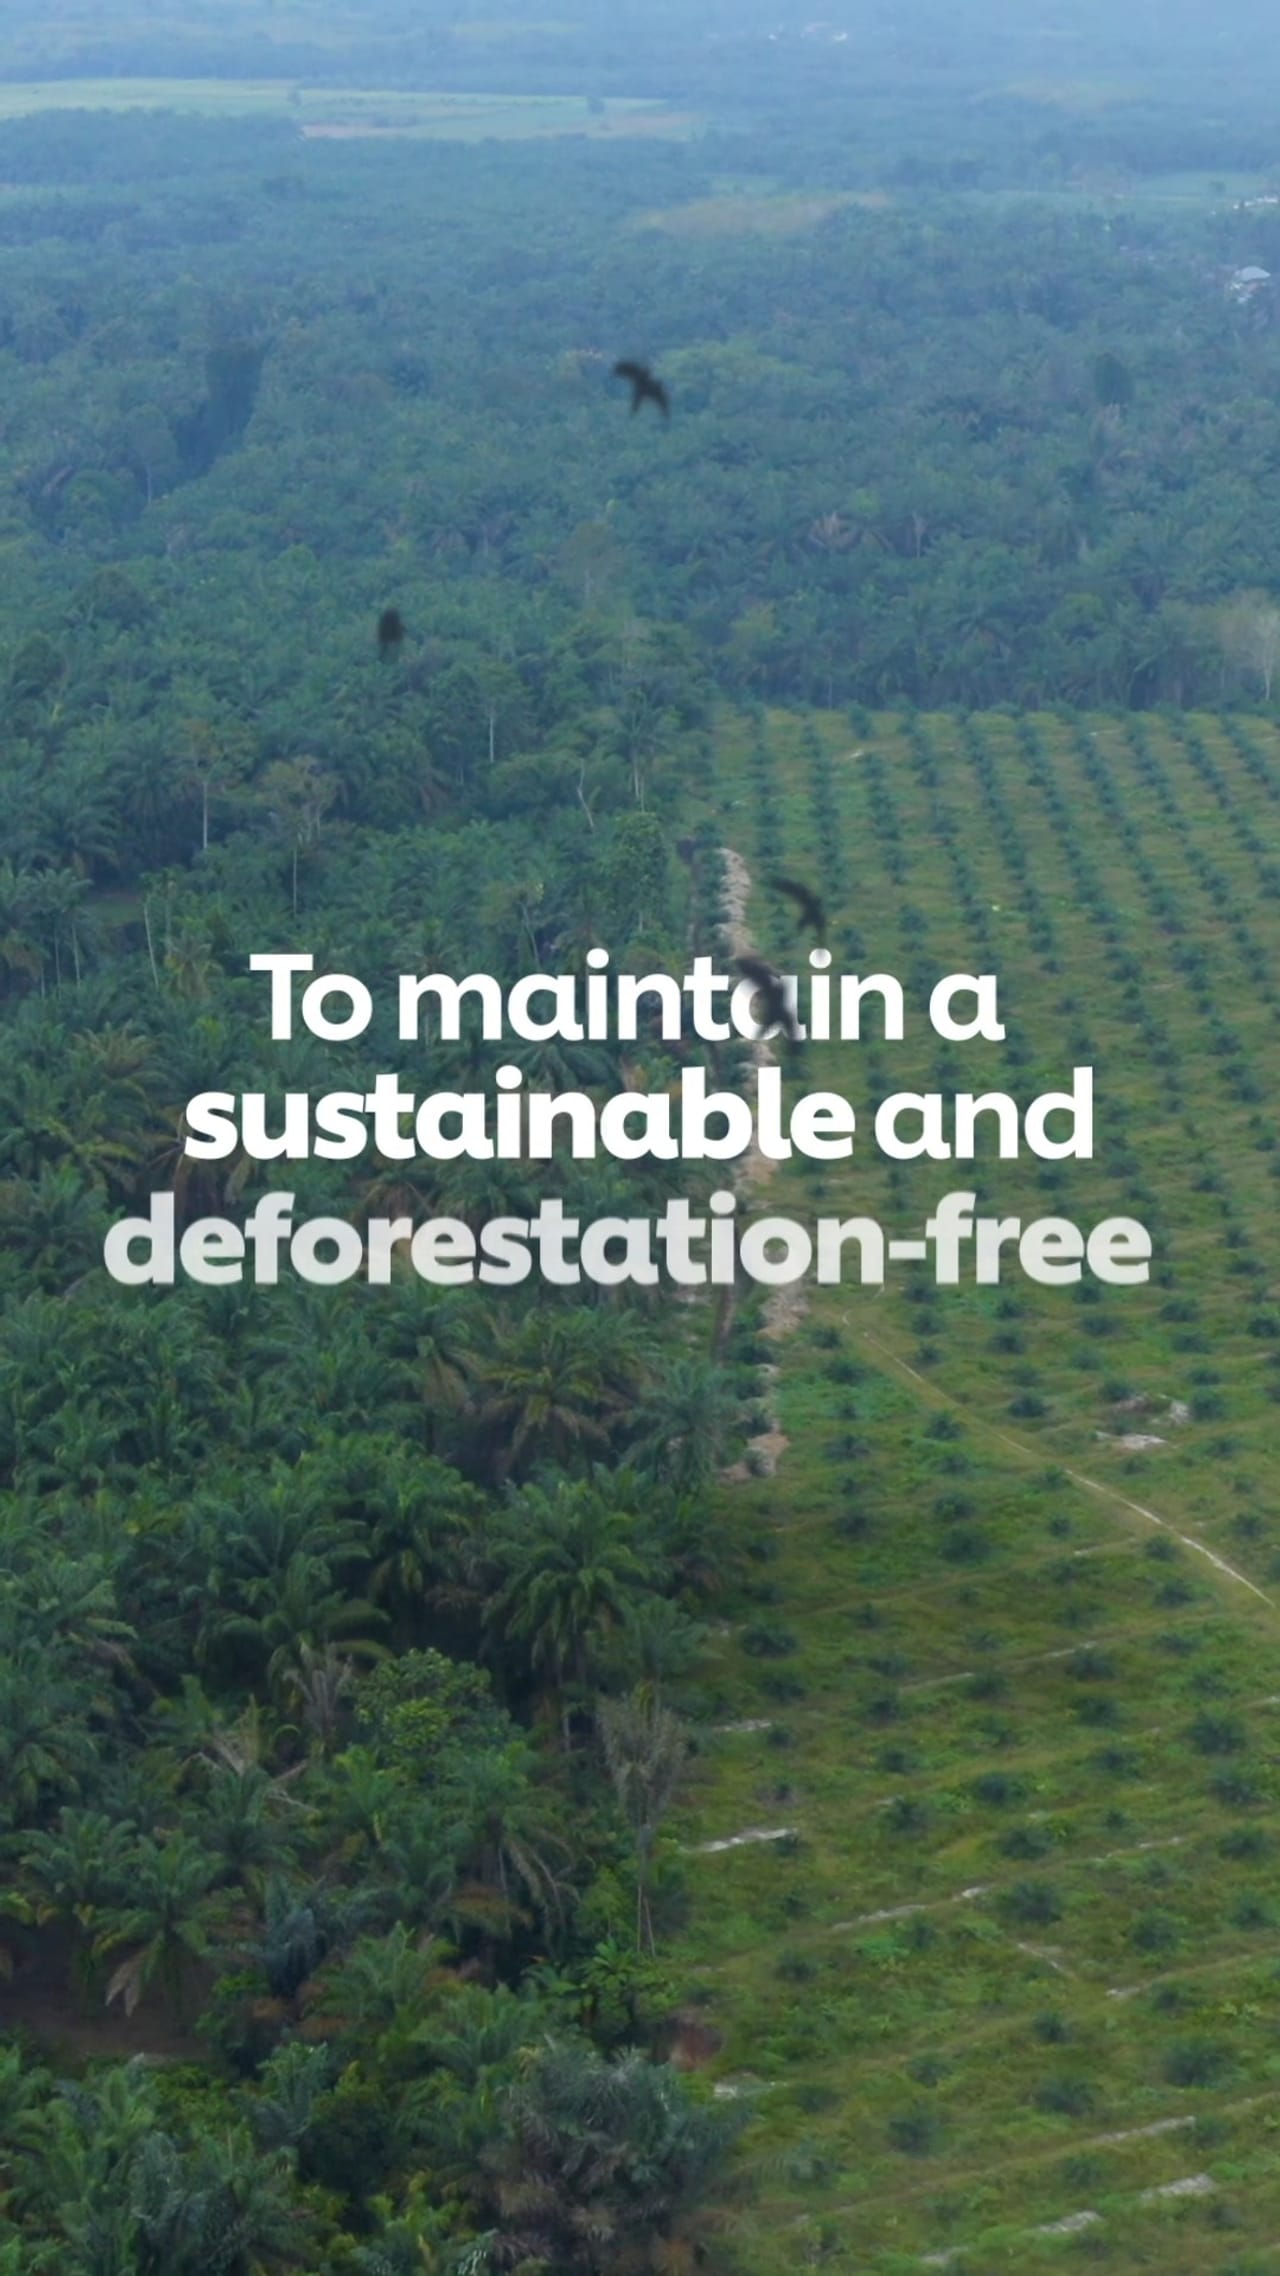
Unilever YouTube

Mar 6, 2025
28K followers
Engagement Rate
0.859%
 Unilever
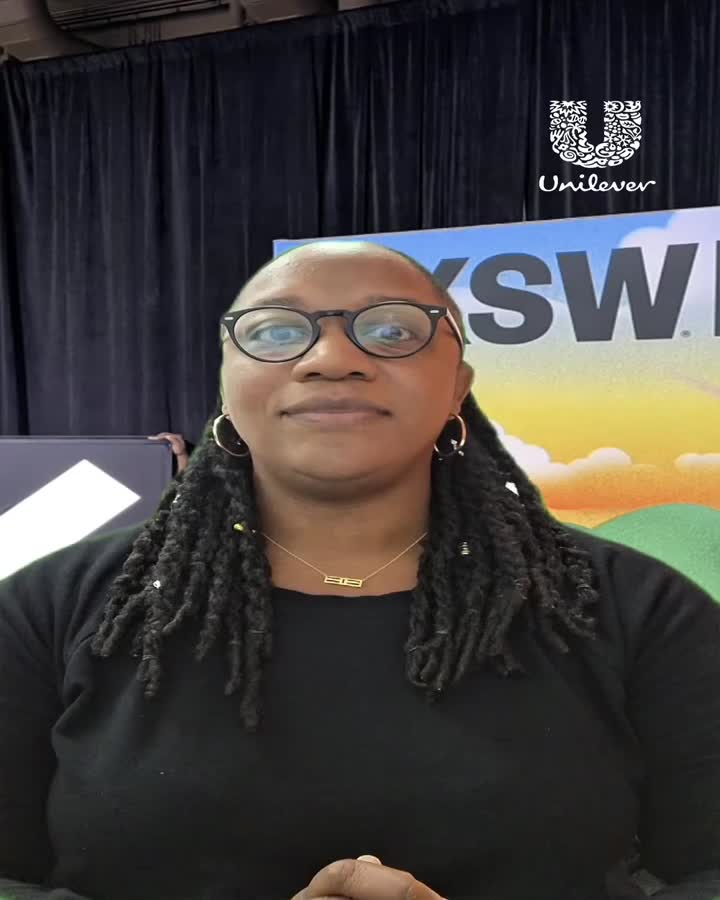
 Instagram
Mar 13, 2025
238K followers
Engagement Rate
0.67%
Unilever Instagram
Mar 18, 2025
226K followers
Engagement Rate
0.383%
Brand Engagement Across Channels
Cross-channels analysis of the engagement
Brand Engagement Across Channels
| Channels | Engagement | Avg. Engagement |
|---|---|---|
| YouTube | 360 | 40 |
| Facebook | 4512 | 104.93 |
| Instagram | 14K | 315.88 |
| Average | 6152 | 153.6 |
Brand Video Views Across Channels
Cross-channels analysis of the engagement
Brand Video Views Across Channels
| Channels | Video Views | Avg. Video Views |
|---|---|---|
| YouTube | 38K | 4251 |
| Facebook | 215K | 15K |
| Instagram | 168K | 4796 |
| Average | 140K | 8124 |
Similar Brands
Explore top-performing brands from the FMCG — Beverages Industry


Ready to improve your social media strategy with real-time insights
Get strategic insights, analyze the social performance across all channels, compare metrics from different periods and download reports in seconds.