Highland Spring Brand Overview
See social media performance data for Highland Spring
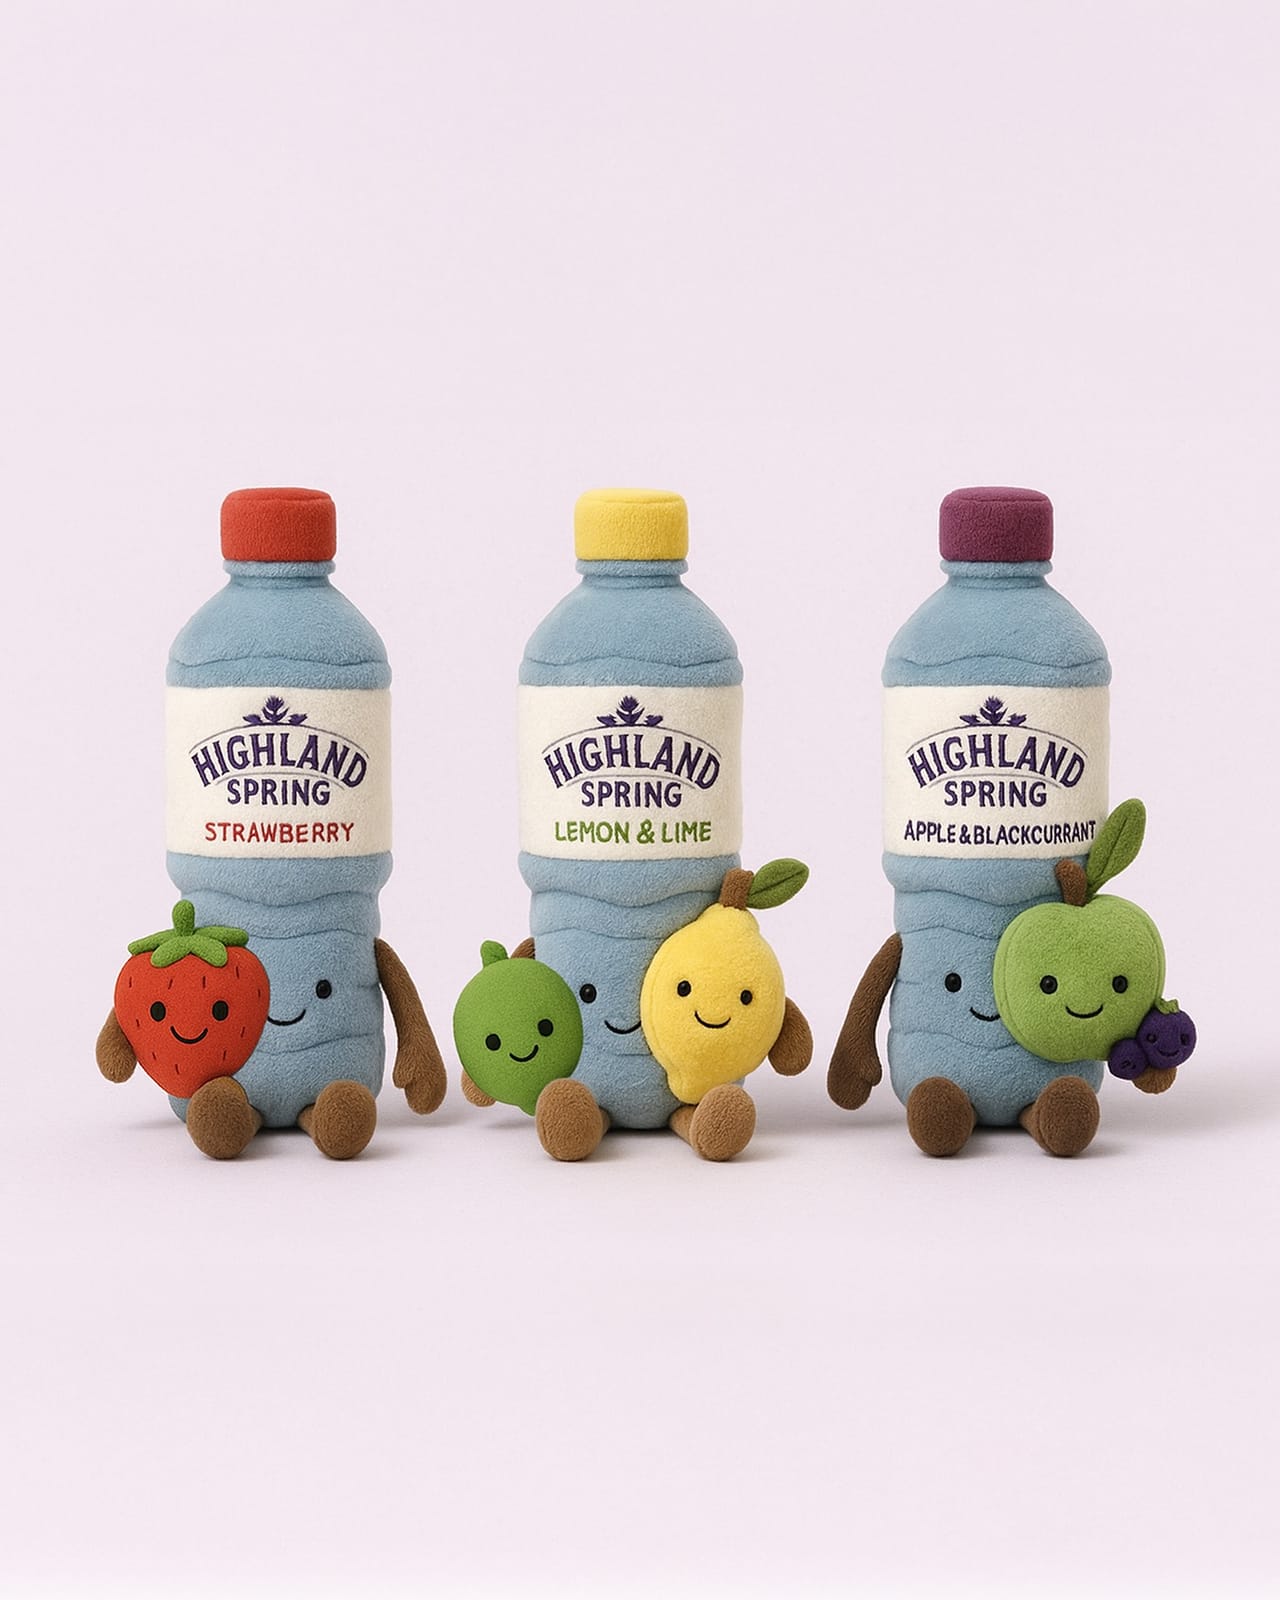
Highland Spring
0.46%
Brand Avg Engagement RatePhoto
Top Content (By Eng. Rate)12K
Avg. Brand Video ViewsBrand Posts Across Channels
Cross-channels analysis of the post
Brand Posts Across Channels
| Channels | Posts | Avg. Posts/Day |
|---|---|---|
 Twitter Twitter | 6 | 0.03 |
 Facebook Facebook | 36 | 0.2 |
 Instagram Instagram | 38 | 0.21 |
| Total | 80 | 0.44 |
Top Posts
 Highland Spring
 Instagram
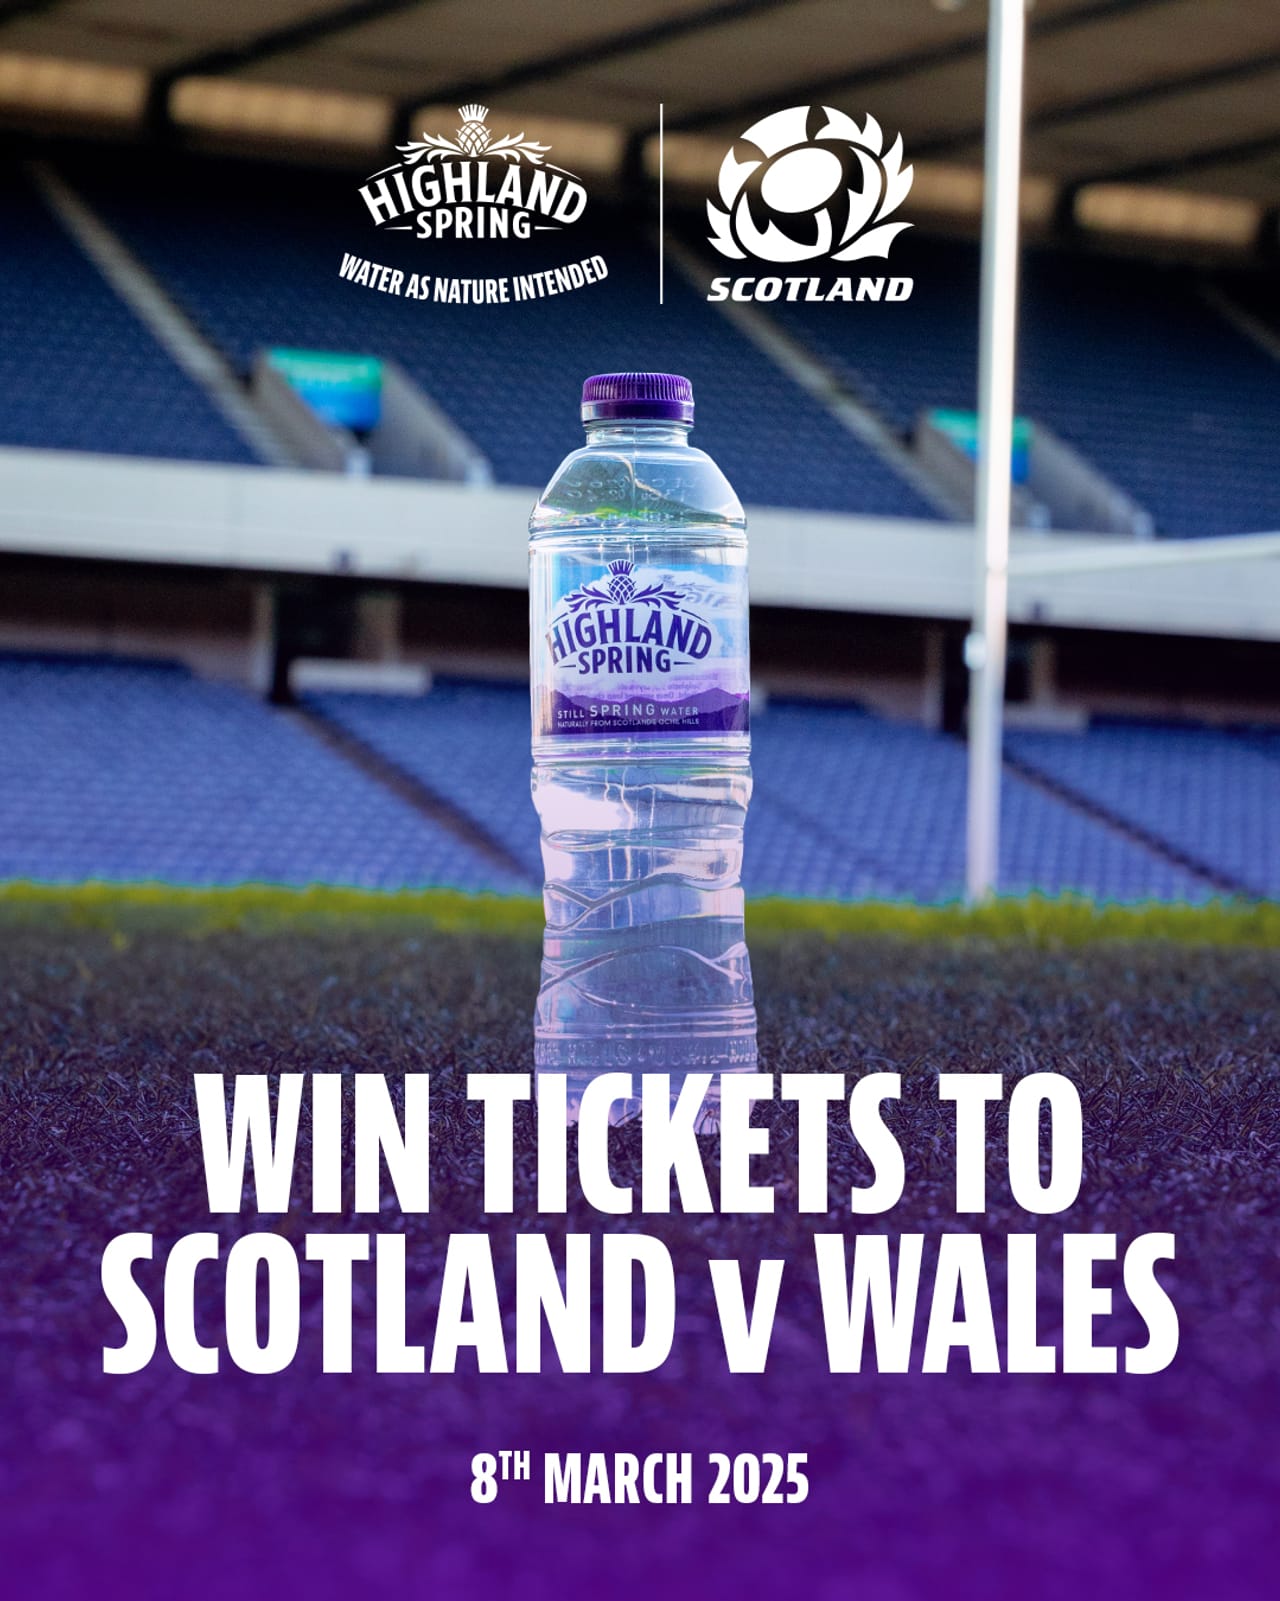
Feb 24, 2025
7534 followers
Engagement Rate
3.637%
Highland Spring Instagram
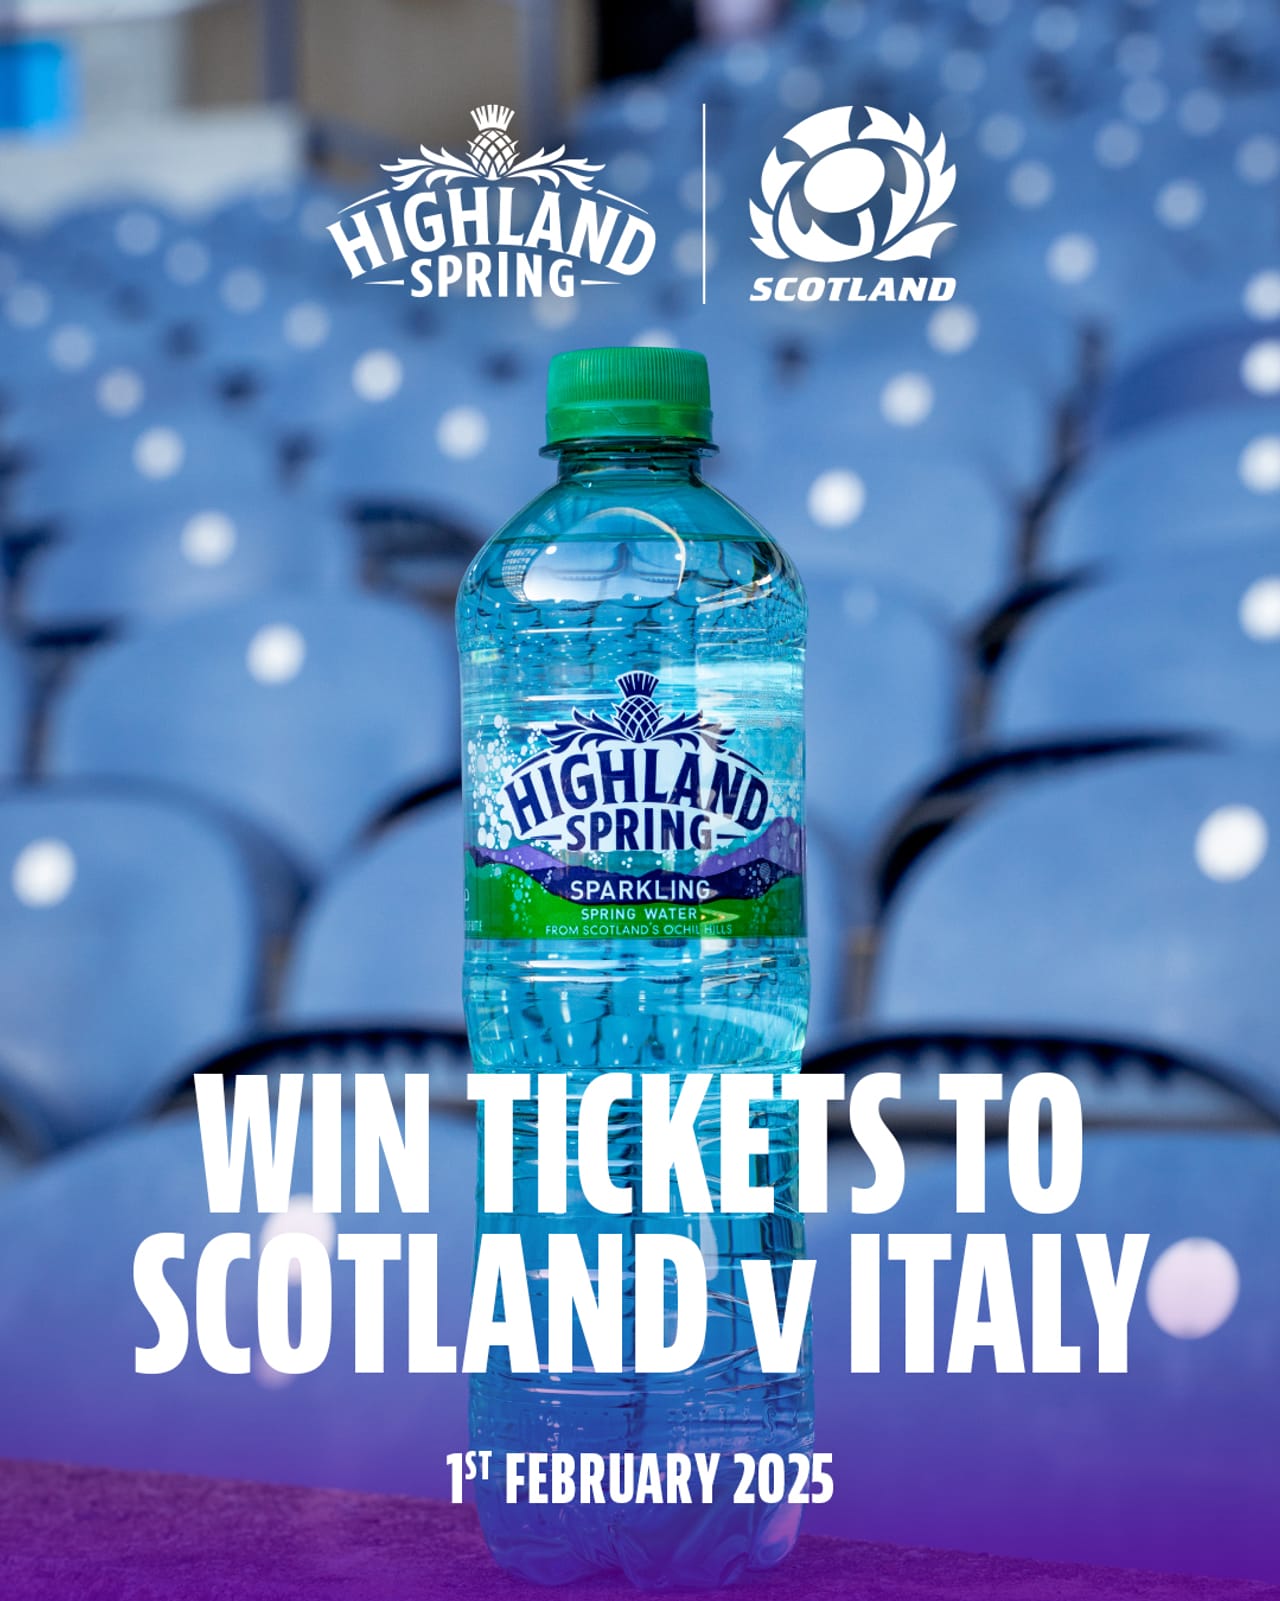
Jan 28, 2025
7534 followers
Engagement Rate
2.986%
Highland Spring Instagram
May 6, 2025
7544 followers
Engagement Rate
2.585%
Brand Engagement Across Channels
Cross-channels analysis of the engagement
Brand Engagement Across Channels
| Channels | Engagement | Avg. Engagement |
|---|---|---|
| Twitter | 20 | 3.33 |
| Facebook | 10K | 286.25 |
| Instagram | 1871 | 49.24 |
| Average | 4065 | 112.94 |
Brand Video Views Across Channels
Cross-channels analysis of the engagement
Brand Video Views Across Channels
| Channels | Video Views | Avg. Video Views |
|---|---|---|
| Twitter | 0 | 0 |
| Facebook | 763K | 35K |
| Instagram | 64K | 2798 |
| Average | 276K | 12K |
Similar Brands
Explore top-performing brands from the FMCG — Beverages Industry


Ready to improve your social media strategy with real-time insights
Get strategic insights, analyze the social performance across all channels, compare metrics from different periods and download reports in seconds.