Free TikTok analytics tool to analyze any account’s performance
Instantly check any top TikTok profile’s metrics and top-performing videos

HBO
2.8M Followers


The Average Video Length represents the average duration of a TikTok video published by this profile in the last 30 days. This metric is computed as the total videos length divided by the number of videos. Only TikTok videos are included in this metric.
Average Likes represents the total number of likes received on video content divided by the number of videos published in the last 30 days.
Average Comments represents the total number of comments received on video content divided by the number of videos published in the last 30 days.
Enter a TikTok handle to instantly see key video metrics and analytics for that account.
Top Performing Posts
HBO 

 HBO
HBO  HBO
HBO 
Analysis

Content
Average Videos/Day: The average number of videos published per day over the last 30 days.

Engagement
Avg. Engagement/Video: The average engagement per video over the last 30 days.

Views
Avg. Views/Video: The average number of views per video over the last 30 days.
*This analysis only takes into consideration data for the last 30 days.
**this analysis only takes into account the video format.
Want more historical data? Sign up for a FREE 14-day trial (no credit card required!)
I want to analyze my TikTok videosSupercharge your results with Socialinsider - see how it works for you
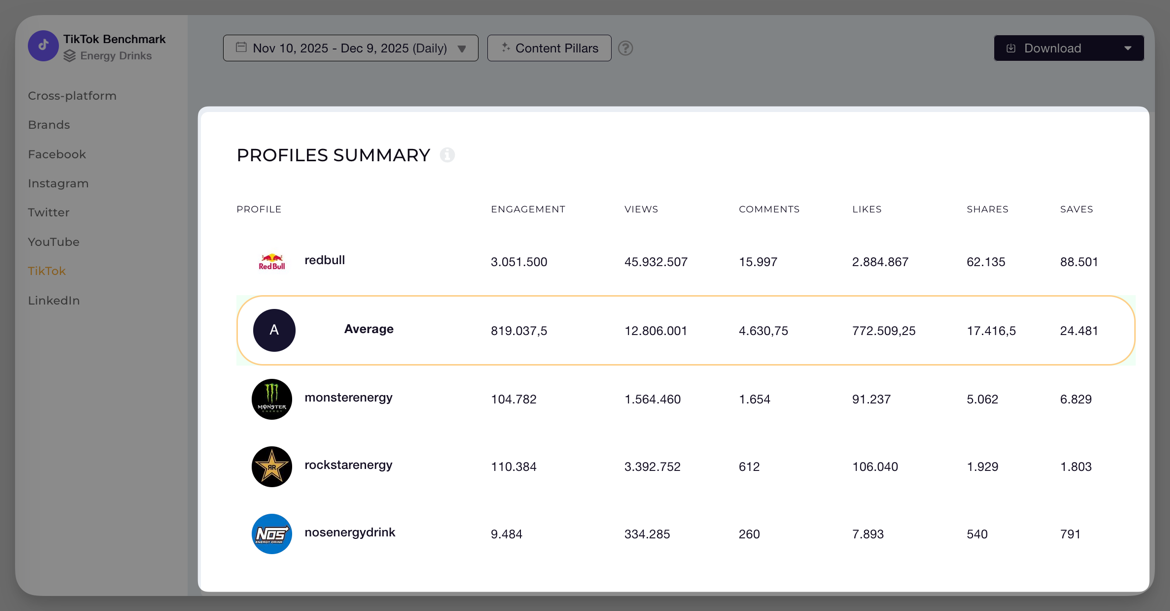
1. Boost your TikTok presence with competitive benchmarking and cross-channel analysis
Benchmark your TikTok performance against competitors and generate consolidated reports across multiple platforms. Group profiles for a comprehensive cross-channel analysis to see how short videos perform across channels.
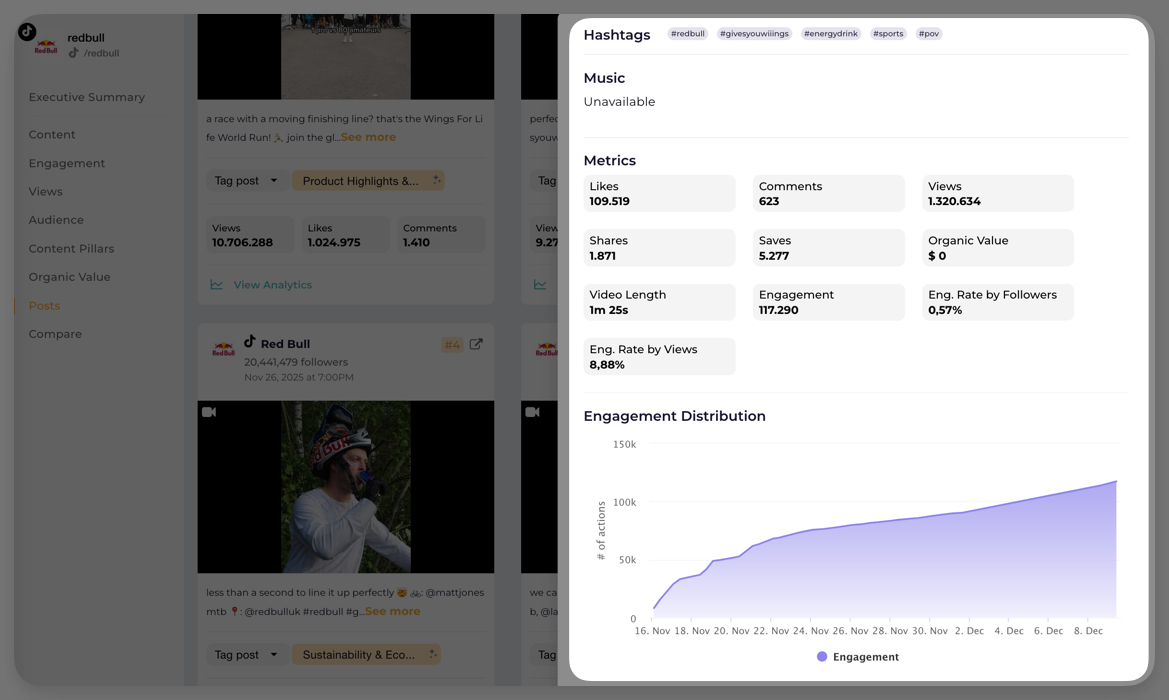
2. Discover top-performing TikTok videos
Get a complete view of how your TikTok videos perform with all the metrics that matter. With our Socialinsider TikTok Analytics dashboard, you’ll quickly learn how to assess your TikTok account’s performance and discover trends that resonate with your audience to drive better results.
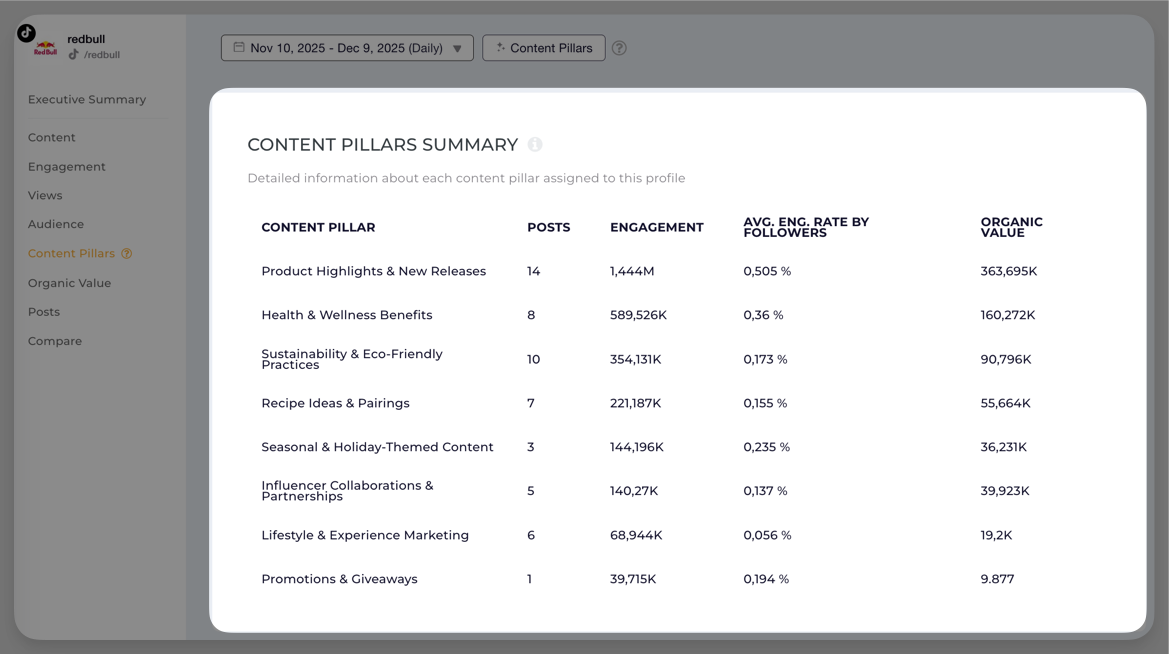
3. Boost engagement with a TikTok content analysis
Quickly tag and categorize your videos to reveal which themes consistently spark engagement. Whether it’s tutorials, behind-the-scenes clips, or industry updates, you get clear TikTok insights and streamlined analytics to double down on the ideas your audience responds to most.
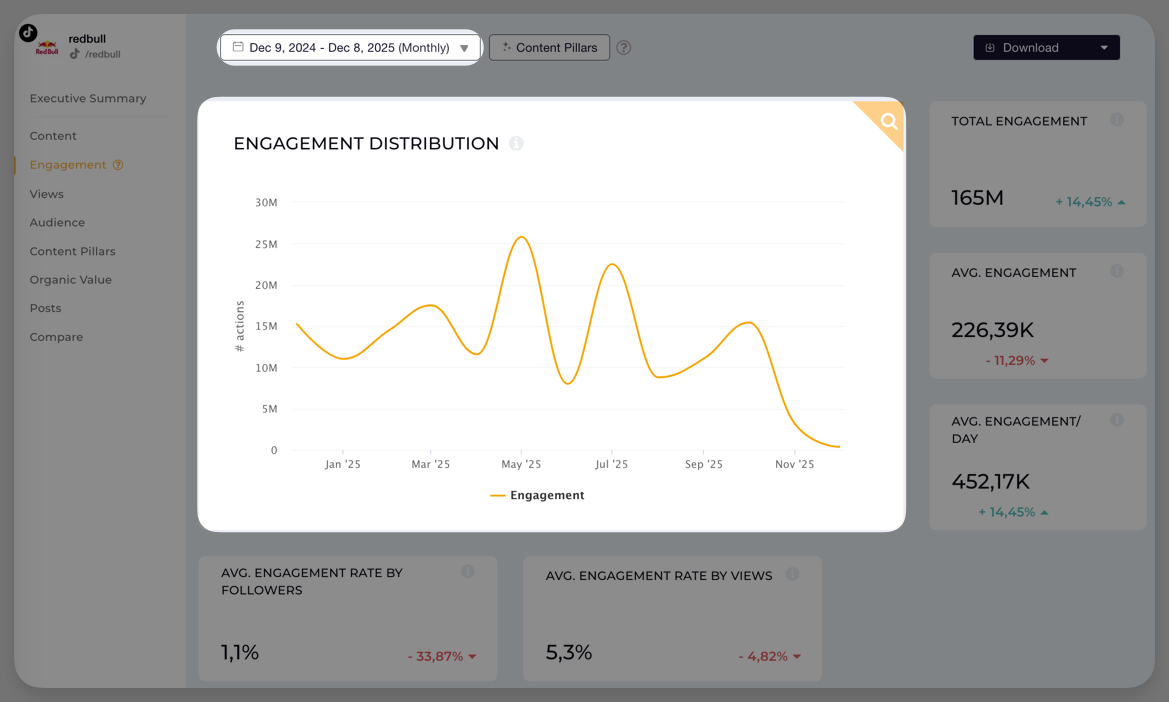
4. Track long-term trends
See what makes your TikTok videos take off using a powerful blend of TikTok analysis and automated insights. Identify winning content, compare performance instantly, and learn exactly how to analyze TikTok account performance.
Analyze your short-form videos with the right analytics tool


How to identify your best TikTok videos with Socialinsider
Socialinsider’s social media analytics allow you to measure and compare social media performance against competitors and industry peers.

Start by creating a trial account

Connect the profiles you manage

Select the time frame you want to analyze

See your top-performing videos

Analyze your TikTok performance
Easily analyze and track your TikTok metrics, conduct audits, and perform TikTok competitor analysis with Socialinsider.
FAQs about TikTok video analytics
Got a question? We've got answers.
Anyone else struggling to find a good TikTok analytics tool for deep competitor/account analysis?
What are some analytics tools for TikTok?
Which tool is good for TikTok analytics?
Ready to improve your social media strategy with real-time insights?
Get strategic insights, analyze the social performance across all channels, compare metrics from different periods, and download reports in seconds.