Simplified and straightforward
social media analytics
for
busy marketers
Compare performance across channels, get competitor analysis, benchmarks and listening insights.
Leader in Social Media Analytics Category
High Performer social media analytics tool for brands and businesses.


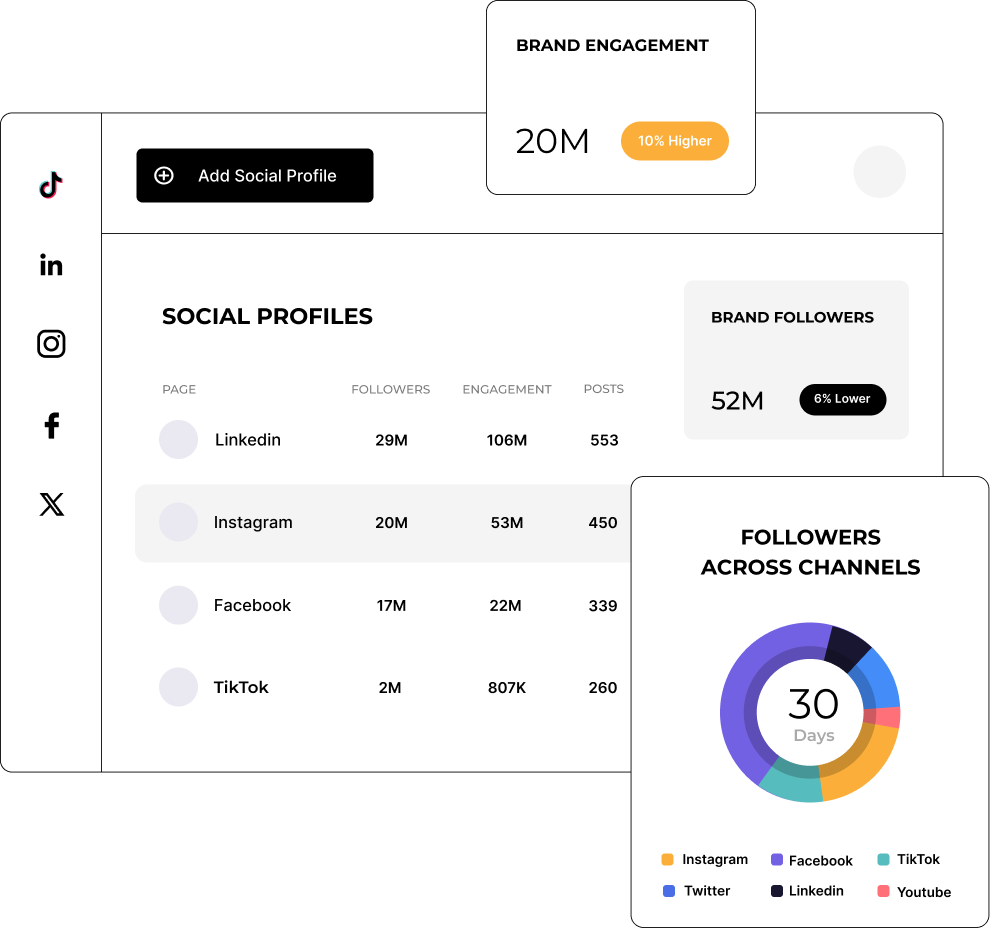
Analyze your brand performance across all social media channels

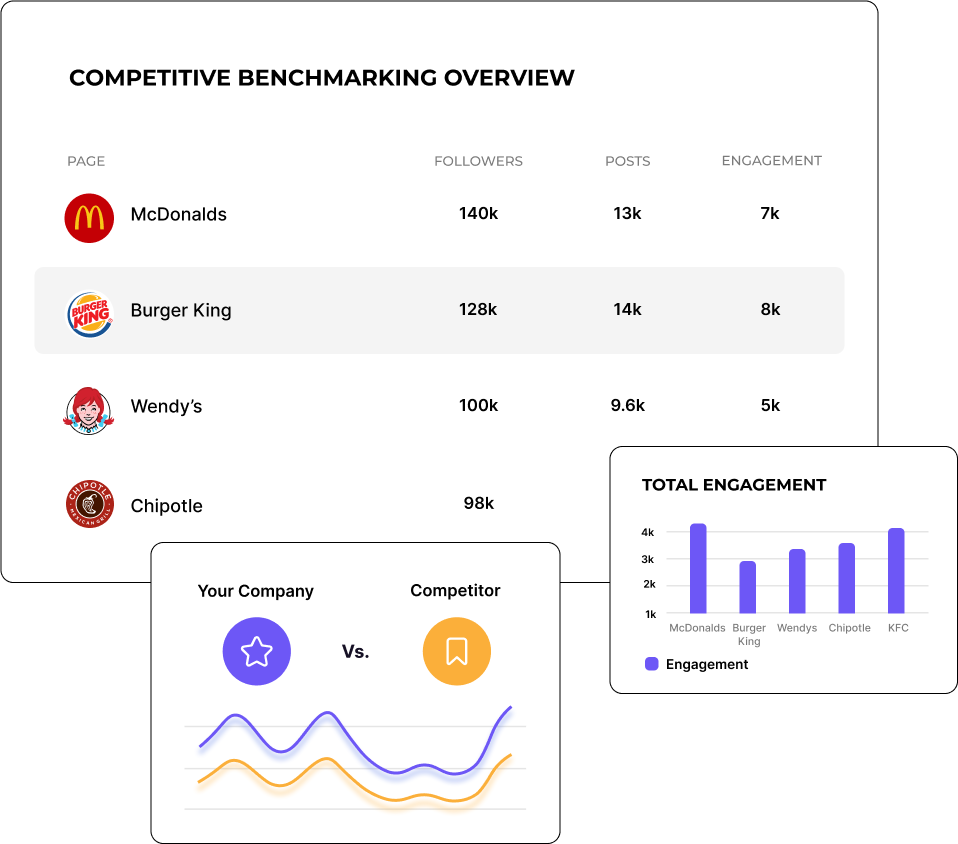
Access social media competitive intelligence and benchmarks.
Competitor Analysis

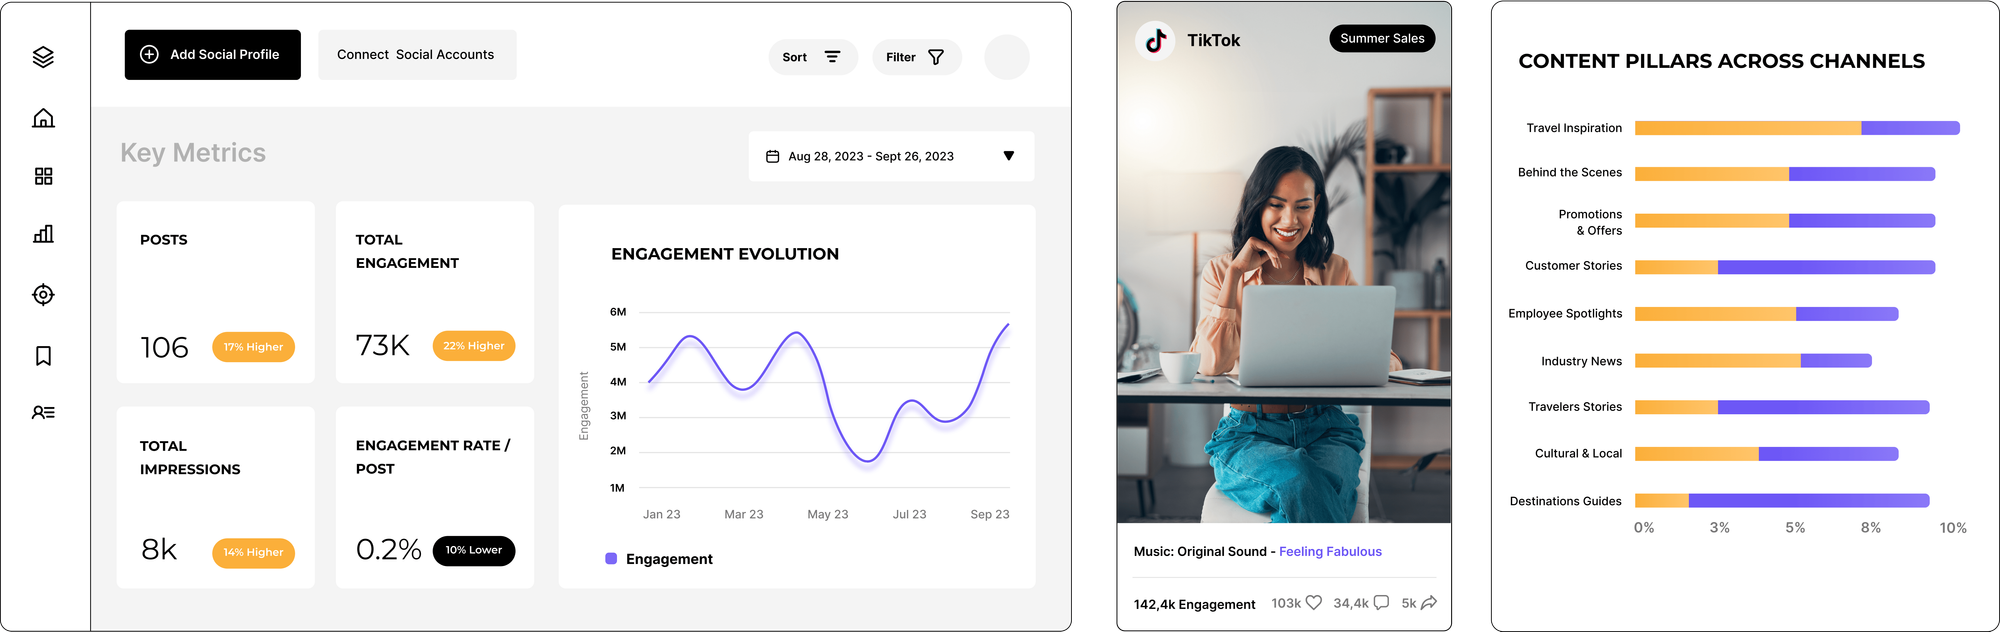
Get advanced social media analytics and reporting.
Social Media Analytics

Identify top content pillars to uncover hidden patterns.
Social Media Content Analytics
“Socialinsider’s competitor analysis dashboard helped in creating visibility on how we are performing in the market.“
Victor Mukubvu, Digital Marketing Analyst at Mitsubishi Electric

Analyze your content performance with AI
Analyze your content pillars with AI
Automatically cluster your social media content into AI content pillars.
Identify content pillars across channels
Discover what content pillars resonate with your audience.
Get AI content pillars from competitors
Stay ahead by seeing what works for others in your industry.
Discover industry content pillars
Get industry AI content pillars tailored to each social media platform.
“ The campaign post tagging feature has allowed us to very efficiently analyze our content strategies.“
Caitlin Duffy, Founder & Consultant at Roisin Consulting

Look at how your competitors do it
Perform a social media competitive analysis to understand what’s working and what’s not for your competitors and make more strategic decisions.
Easy to see the social media metrics that matter
Get advanced social media analytics, and leverage insights to power up your social media strategy. Look at your engagement metrics to identify your best-performing posts and replicate them.
What they say about us
"Customer service has been one of my favourite features as well. You guys are just phenomenal. Your team is so responsive and very friendly and helpful. Which is not the norm."
Caitlin Duffy | Roisin Consulting


"Socialinsider helped us understand whether we're improving or decreasing especially compared to the other accounts that we follow."
Declan Seachoy | Trades Union Congress


"Socialinsider allows for a competitor analysis that gives an insight to performance relative to the market."
Victor Mukubvu | Mitsubishi Electric


"The sentiment analysis is amazing for Instagram hashtags. This new social media listening dashboard helped me in long-term planning."
Giuseppe Veturi | Havas Media Network


"We are using this social media analytics dashboard for all our 40 social media clients. We can have all the performance data in one single place."
Arnold Vieriu | Tribal Worldwide


"With Socialinsider, our team became more efficient. We do not need to spend time on social media data gathering. Instead, we can focus on insights and analysis."
Yana Bushmeleva | Fashionbi


"We use Socialinsider for day-to-day social media insights if we need to outline any simple strategic changes or review the performance of certain social posts."
Nick Radclyffe | CEO at Hype Lab


"On average, a social media report for a brand requires 1 to 2 hours of work with Socialinsider, where it used to require a full day to gather the data."
Dorra Lunet | Hanging Gardens Agency


"Socialinsider has saved us more than $16k per year. It has enabled us to save time on monthly reports and complex long-term analyses."
Mohamed El-Daly | Create Media


"Customer service has been one of my favourite features as well. You guys are just phenomenal. Your team is so responsive and very friendly and helpful. Which is not the norm."
Caitlin Duffy | Roisin Consulting
"Socialinsider helped us understand whether we're improving or decreasing especially compared to the other accounts that we follow."
Declan Seachoy | Trades Union Congress
"Socialinsider allows for a competitor analysis that gives an insight to performance relative to the market."
Victor Mukubvu | Mitsubishi Electric
"The sentiment analysis is amazing for Instagram hashtags. This new social media listening dashboard helped me in long-term planning."
Giuseppe Veturi | Havas Media Network
"We are using this social media analytics dashboard for all our 40 social media clients. We can have all the performance data in one single place."
Arnold Vieriu | Tribal Worldwide
"With Socialinsider, our team became more efficient. We do not need to spend time on social media data gathering. Instead, we can focus on insights and analysis."
Yana Bushmeleva | Fashionbi
"We use Socialinsider for day-to-day social media insights if we need to outline any simple strategic changes or review the performance of certain social posts."
Nick Radclyffe | CEO at Hype Lab
"On average, a social media report for a brand requires 1 to 2 hours of work with Socialinsider, where it used to require a full day to gather the data."
Dorra Lunet | Hanging Gardens Agency
"Socialinsider has saved us more than $16k per year. It has enabled us to save time on monthly reports and complex long-term analyses."
Mohamed El-Daly | Create Media
Ready to improve your social media strategy with real-time insights?
Get strategic insights, analyze the social performance across all channels, compare metrics from different periods and download reports in seconds.