MONDRAGON Corporation Brand Overview
See social media performance data for MONDRAGON Corporation

MONDRAGON Corporation
0.1%
Brand Avg Engagement RateReel
Top Content (By Eng. Rate)120.5
Avg. Brand Video ViewsBrand Posts Across Channels
Cross-channels analysis of the post
Brand Posts Across Channels
| Channels | Posts | Avg. Posts/Day |
|---|---|---|
 Twitter Twitter | 62 | 0.34 |
 Facebook Facebook | 62 | 0.34 |
 Instagram Instagram | 60 | 0.33 |
| Total | 184 | 1.02 |
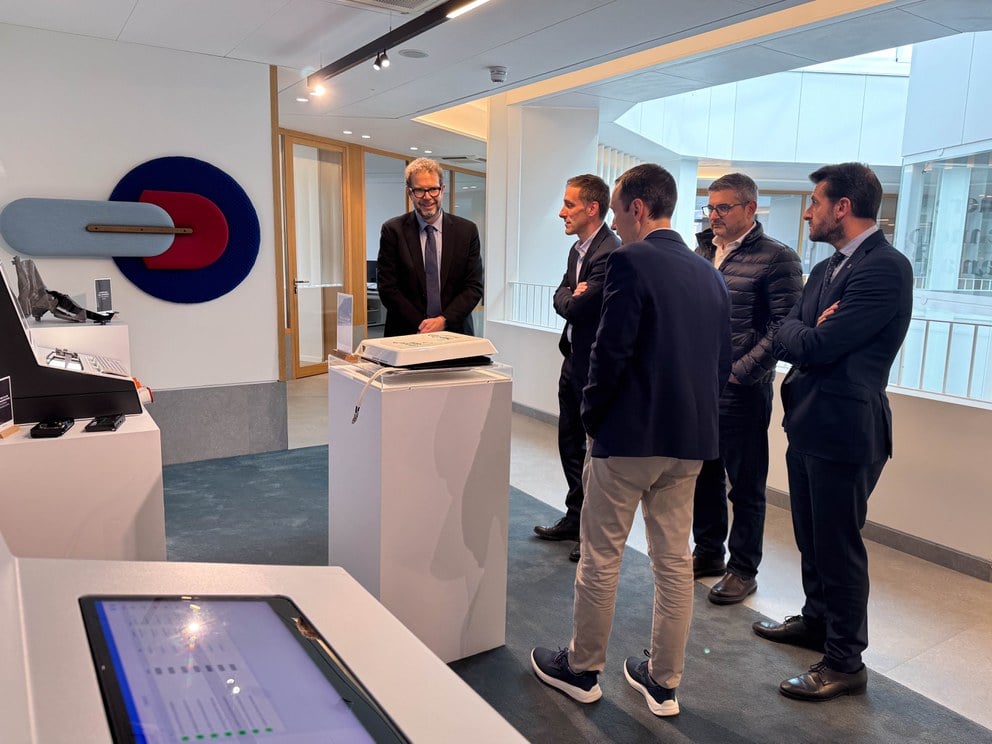
Top Posts
MONDRAGON Corpor... Instagram

Jan 31, 2025
3137 followers
Engagement Rate
1.084%
MONDRAGON Corpor... Instagram

Feb 17, 2025
3392 followers
Engagement Rate
0.914%
MONDRAGON Corpor... Instagram
Feb 18, 2025
3392 followers
Engagement Rate
0.678%
Brand Engagement Across Channels
Cross-channels analysis of the engagement
Brand Engagement Across Channels
| Channels | Engagement | Avg. Engagement |
|---|---|---|
| Twitter | 42 | 0.68 |
| Facebook | 126 | 2.03 |
| Instagram | 771 | 12.85 |
| Average | 313 | 5.19 |
Brand Video Views Across Channels
Cross-channels analysis of the engagement
Brand Video Views Across Channels
| Channels | Video Views | Avg. Video Views |
|---|---|---|
| Twitter | 126 | 126 |
| Facebook | 239 | 239 |
| Instagram | 117 | 117 |
| Average | 160.67 | 160.67 |
Similar Brands
Explore top-performing brands from the Industrial & Manufacturing Industry


Ready to improve your social media strategy with real-time insights
Get strategic insights, analyze the social performance across all channels, compare metrics from different periods and download reports in seconds.